JP4467094B2 - Apparatus for sampling a large number of potentially simultaneous instructions in a processor pipeline - Google Patents
Apparatus for sampling a large number of potentially simultaneous instructions in a processor pipeline Download PDFInfo
- Publication number
- JP4467094B2 JP4467094B2 JP37553998A JP37553998A JP4467094B2 JP 4467094 B2 JP4467094 B2 JP 4467094B2 JP 37553998 A JP37553998 A JP 37553998A JP 37553998 A JP37553998 A JP 37553998A JP 4467094 B2 JP4467094 B2 JP 4467094B2
- Authority
- JP
- Japan
- Prior art keywords
- instruction
- instructions
- pipeline
- sampling
- information
- Prior art date
- Legal status (The legal status is an assumption and is not a legal conclusion. Google has not performed a legal analysis and makes no representation as to the accuracy of the status listed.)
- Expired - Fee Related
Links
Images


Classifications
-
- G—PHYSICS
- G06—COMPUTING; CALCULATING OR COUNTING
- G06F—ELECTRIC DIGITAL DATA PROCESSING
- G06F11/00—Error detection; Error correction; Monitoring
- G06F11/30—Monitoring
- G06F11/34—Recording or statistical evaluation of computer activity, e.g. of down time, of input/output operation ; Recording or statistical evaluation of user activity, e.g. usability assessment
- G06F11/3466—Performance evaluation by tracing or monitoring
- G06F11/348—Circuit details, i.e. tracer hardware
-
- G—PHYSICS
- G06—COMPUTING; CALCULATING OR COUNTING
- G06F—ELECTRIC DIGITAL DATA PROCESSING
- G06F11/00—Error detection; Error correction; Monitoring
- G06F11/30—Monitoring
- G06F11/34—Recording or statistical evaluation of computer activity, e.g. of down time, of input/output operation ; Recording or statistical evaluation of user activity, e.g. usability assessment
- G06F11/3466—Performance evaluation by tracing or monitoring
Abstract
Description
【0001】
【発明の属する技術分野】
本発明は、一般に、コンピュータシステムの性能測定に係り、より詳細には、多数の同時実行命令をサンプリングすることに係る。
【0002】
【従来の技術】
コンピュータプロセッサは、益々高速になっているが、ソフトウェアアプリケーションの性能は、それに歩調が合っていない。大型の商業用途の場合に、命令当たりの平均プロセッササイクル(CPI)値が2.5ないし3という大きさである。4ウェイ命令イッシュープロセッサでは、CPIが3であることは、12ごとに1つのイッシュースロットしか良好に使用されないことになる。ソフトウェアスループットがハードウェアの改良となぜ歩調が合わないかを理解することが重要である。
このような問題をメモリの待ち時間に転嫁するのが一般的であり、実際に、多くのソフトウェアアプリケーションは、データ転送が完了するのを待機して多数のサイクルを費やす。しかしながら、分岐予想ミスのような他の問題も、プロセッササイクルを浪費する。一般的な原因とは独立して、システムアーキテクチャー並びにハードウェア及びソフトウェアエンジニアは、複雑なプロセッサを組み込んだ近代的なコンピュータシステムの性能を改善するために、どの命令がストールしているかそしてなぜかを知る必要がある。
【0003】
通常、これは、システムが動作している間にその振る舞いの「プロファイル」を発生することにより行われる。プロファイルとは、性能データの記録である。しばしば、プロファイルは、性能のボトルネックを容易に識別できるようにグラフ的に発生される。
プロファイル形成は、計装及び模擬により行うことができる。計装では、プログラムの実行中に特定事象を監視するためにプログラムに付加的なコードが追加される。模擬は、実際のシステムでプログラムを実行するのではなく、人為的な環境においてプログラム全体の振る舞いをエミュレートするように試みる。
これら2つの方法は、各々、欠点を有する。計装は、追加命令及び余計なデータ参照のためにプログラム真の振る舞いを擾乱させる。模擬は、実際のシステムにおいてプログラムを実行する場合に比して実質的な性能オーバーヘッドを犠牲にして擾乱を回避する。更に、計装又は模擬では、大規模なソフトウェアシステム全体、即ちアプリケーション、オペレーティングシステム及びデバイスドライバコードをプロファイリングすることが通常困難である。
【0004】
プロセッサのプロファイル情報を与えるために、ハードウェア実施の事象サンプリングを使用することもできる。ハードウェアサンプリングは、模擬及び計装に勝る多数の効果を有し、即ち性能を測定するためにソフトウェアプログラムを変更する必要がない。サンプリングは、比較的低いオーバーヘッドで全システムに作用する。実際に、最近では、低いオーバーヘッドのサンプリングをベースとするプロファイリングを使用して、パイプラインストール及びそれらの原因に関する詳細な命令レベル情報を収集することができる。しかしながら、多くのハードウェアサンプリング技術は、特定の事象を測定するように設計されているので融通性に欠ける。
デジタル社のAlpha AXP21164、インテル社のペンティウイム・プロ及びMIPS10000は、データキャッシュ(Dキャッシュ)ミス、命令キャッシュ(Iキャッシュ)ミス及び分岐予想ミスのような種々の事象をカウントすることのできる事象カウンタを形成する。これらの事象カウンタは、カウンタがオーバーフローするときに割り込みを発生し、従って、カウンタの性能データを高レベルのソフトウェアでサンプリングすることができる。
【0005】
事象カウンタは、特定のプログラム又はその一部分を実行する間にシステムが招いた分岐予想ミスの数のような集合情報を捕獲するのに有用である。しかしながら、既知の事象カウンタは、どの分岐命令が頻繁に予想ミスを生じるかのように状態情報を個々の命令に帰属させる点で有用性が低い。これは、事象カウンタがオーバーフローしそして割り込みを生じるときには、その事象を生じた命令のプログラムカウンタ(PC)がもはや使用できないためである。
命令をアウトオブオーダー(順序ずれして)でイッシューすることのできるプロセッサの動的なオペレーションを推測することが特に問題である。実際に、アウトオブオーダープロセッサで実行されるソフトウェアプログラムの振る舞いは極めて不可解で且つ理解が困難である。その具体的な例としてアウトオブオーダーのAlpha21264プロセッサでの命令の流れについて考える。
【0006】
スーパースカラープロセッサアーキテクチャー
実行順序
アウトオブオーダープロセッサは、命令を正しい順序でフェッチしそしてリタイアするが、命令をそれらのデータ依存性に基づいて処理する。命令の処理は、レジスタのマッピング、命令の発生及び実行を含む。命令は、それがフェッチされたときから、それがリタイア又はアボートするときまで、「フライト中」であると言える。
各プロセッササイクル中に、プロセッサパイプラインの第1段は、命令キャッシュ(Iキャッシュ)から命令のセットをフェッチする。命令のセットはデコードされる。命令デコーダは、フェッチされたセットのどの命令が命令流の一部分であるかを識別する。
【0007】
フェッチすべき次の命令のPCを分析するには多数のサイクルを要するので、PCは、通常、分岐又はジャンププレディクタ(予想子)により前もって予想される。予想を誤ったときには、プロセッサは、「不良」実行経路を占有する予想ミス命令をアボート(中止)し、そして「良好」経路において命令のフェッチを再スタートする。
命令を順序ずれ状態で実行できるようにするために、命令のオペランドに指定されたレジスタは、「読み取り後の書き込み」及び「書き込み後の書き込み」競合を防止するように動的に名前を付け直される。この名前の付け直しは、アーキテクチャー即ち「仮想」レジスタを物理的レジスタへとマッピングすることにより達成される。従って、同じ仮想レジスタに書き込む2つの命令は、それらが異なる物理的レジスタに書き込みそして仮想レジスタの消費者が適切な値を得るので、順序ずれ状態で安全に実行することができる。
【0008】
レジスタマップ型命令は、そのオペランドが計算されそして適当な形式の機能的「実行」ユニットが得られるまで、イッシュー待ち行列に存在する。命令によって使用される物理的なレジスタは、命令がイッシューされるサイクルで読み取られる。命令は、それらが実行された後に、リタイアの準備ができたとマークされ、そしてプログラム順序における全ての手前のリタイア準備命令がリタイアしたときに、即ち命令が正しいプログラム順序でリタイアするときに、プロセッサによりリタイアされる。リタイアの際に、プロセッサは、命令によりなされる変更をシステムのアーキテクチャー「状態」へコミットし、そして命令により消費されたリソースを解除する。
【0009】
予想ミス
分岐が誤って予想されるようなある場合には、命令をトラップし又は破棄しなければならない。これが生じたときには、現在の推測的な構造状態が、予想ミスが生じた実行点へと戻され、正しい命令においてフェッチが続けられる。
【0010】
遅延
多数の事象が命令の実行を遅らせる。パイプラインの前方において、フェッチユニットは、Iキャッシュミスのためにストールするか、又はフェッチユニットは、予想ミスのために不良経路に沿って命令をフェッチすることがある。マップ手段は、空いた物理的レジスタが欠乏するか、又はイッシュー待ち行列に空きスロットが欠乏するためにストールすることがある。イッシュー待ち行列の命令はそれらのレジスタ依存性が満足されるか又は機能的実行ユニットが使用できるようになるのを待機する。
命令は、データキャッシュミスによりストールすることがある。命令は、それらが不良経路を下るように推測的に発生されるか、又はプロセッサが割り込みを行ったためにとラップされることがある。これら事象の多くは、例えば、コードの検査により静的に予想することが困難であり、それらは全てシステムの性能を低下させる。この形式の状態情報を捕獲するのに単純な事象カウンタでは不充分である。加えて、遅延の長さを厳密に測定して、どの遅延に特に注目すべきかを決定することは困難である。
【0011】
プログラマー又は最適化ツールが、スーパースカラー及びアウトオブオーダープロセッサ、又はこの点については任意のアーキテクチャー設計のプロセッサのような複雑なコンピュータシステムのソフトウェア及びハードウェア要素の性能を改善できるように、事象を特定の命令及びマシン状態に直接的に帰属させることが強く望まれる。
【0012】
【発明が解決しようとする課題】
公知の事象カウンタに伴う問題
既知の事象カウンタに伴う主な問題は、カウンタをオーバーフローさせた事象を生じさせた命令が、通常は、例外的PCよりかなり前にフェッチされることであり、即ち、このPCは、オーバーフローを生じさせた命令のものではない。フェッチと割り込みとの間の遅延の長さは、一般に、予想できない量である。この予想できない事象分布は、事象を特定の命令に適切に帰属させることを困難にする。順序ずれ及び予測的実行は、この問題を増幅するが、これは、Alpha21164プロセッサのようなインオーダー(順序正しい)マシンにも存在する。
例えば、Alpha21164(インオーダー)プロセッサ対ペンチウム・プロ(アウトオブオーダー)プロセッサに対してDキャッシュ基準事象カウントを監視しながら、性能カウンタ割り込みハンドラーに与えられるプログラムカウンタ値を比較する。例示的プログラムは、ランダムメモリアクセス命令、例えば、ロード命令と、それに続く、ナルオペレーション命令(nop)のハンドラーとを含むループより成る。
【0013】
インオーダー型のAlphaプロセッサでは、全ての性能カウンタ事象(例えば、キャッシュミス)は、事象の6サイクル後に実行される命令に帰属され、ロードアクセス後の7番目の命令においてサンプルの大きなピークを生じる。このスキューした事象分布は、理想的なものではない。しかしながら、単一の大きなピークがあるために、静的な分析は、時々、このピークから後方に作用し、その事象を生じさせた実際の命令を識別することができるが、これは、非常に単純なプログラムに対する最良の推測以上のものは何もない。
アウトオブオーダー型のペンティウム・プロで実行される同一のプログラムの場合に、事象サンプルは、次の25個の命令にわたって広く分布され、スキューを示すだけでなく、著しい不鮮明さも示す。サンプルの広い分布は、特定の事象を、その事象を生じた特定の命令に帰属させるのをほぼ不可能にする。他のハードウェア事象をカウントするときにも同様の振る舞いが生じる。
【0014】
スキュー又は不鮮明さのある事象サンプル分布に加えて、従来の事象カウンタは、付加的な問題で悩まされている。通常、事象カウンタより多くの当該事象があり、全ての当該事象を同時に監視することは、不可能でないまでも、困難である。プロセッサの複雑さが増すと、この問題が一層悪化する。
加えて、事象カウンタは、事象が発生したという事実しか記録せず、その事象に関する付加的な状態情報を与えない。多数の種類の事象に対し、キャッシュミス事象にサービスする待ち時間のような付加的な情報が極めて有用である。
更に、公知のカウンタは、一般に、事象をコードの「ブラインドスポット」に帰属させることができない。ブラインドスポットとは、割り込み権が与えられるまで事象が確認されないために、高優先順位システムルーチン及びPALコードのような割り込み不能コードである。そのときまでに、プロセッサの状態は著しく変化し、おそらく偽の情報を与える。
【0015】
ストール対ボトルネック
パイプライン式のインオーダープロセッサにおいて、パイプライン段で1つの命令がストールすると、その後の命令がそのパイプライン段に通過することが妨げられる。それ故、インオーダープロセッサでは「ボトルネック」命令を識別することが比較的容易であり、即ちボトルネック命令は、パイプラインのどこかでストールする傾向がある。インオーダープロセッサの場合、命令が各パイプライン段を通るときにその待ち時間を測定し、そしてその測定された待ち時間を、各パイプライン段におけるその命令の理想的な待ち時間と比較することにより、ストールを識別することができる。命令は、ある段を通過する最小待ち時間より長い時間を必要とするときに、その段においてストールしたと仮定することができる。
【0016】
しかしながら、アウトオブオーダープロセッサでは、あるパイプライン段でストールした命令に対して他の命令がそのパイプライン段を通過することがある。実際に、ストールした命令の付加的な待ち時間は、他の命令の処理によって完全にマスクされ、実際に、ストールした命令は、観察されるプログラム完了を遅延しないことがある。
インオーダーシステムにおいても、あるパイプライン段のストールは、別のパイプライン段がボトルネックであるときにはプログラムの全実行時間に影響しない。例えば、メモリ集中のプログラムの実行中には、Dキャッシュミスにより遅延される実行ユニットからの「バックプレッシャー」のために、命令パイプラインのフェッチ手段及びマップ手段がしばしばストールすることがある。
【0017】
理想的には、キャッシュミスを生じるメモリオペレーションを一次ボトルネックとして分類する。フェッチ手段及びマップ手段のストールは、実際には、キャッシュミスによる遅延の非兆候状態であり、即ち二次ボトルネックである。
ストールが他の命令によりマスクされない命令を識別し、そしてそれらを真のボトルネックとして識別することが望ましい。更に、プログラムの振る舞いを改善するためには、非兆候(二次)ボトルネックよりもカジュアル(一次)のボトルネックに焦点を合わせることが必要である。このようにパイプライン段のボトルネックをカジュアル及び非兆候と分類することは、パイプラインの状態並びにフライト中命令のデータ及びリソース依存性を詳細に知ることが必要であるが、これらは、良く知られたように、単純な事象カウンタから得ることができない。
【0018】
1992年9月29日付のウェスコット氏等の「命令サンプリング手段(Instruction Sampling Instrumentation)」と題する米国特許第5,151,981号は、アウトオブオーダーの実行マシンにおいて命令ベースのサンプリングを行うハードウェアメカニズムを提案している。ウェスコット氏等の解決策には多数の欠点がある。第1に、この解決策は、サンプリングされるコードの長さ及びサンプリングレートに基づいて命令サンプルの流れをバイアスし得る。第2に、このシステムは、リタイアした命令のみをサンプリングし、フェッチした全ての命令をサンプリングするのではなく、その幾つかがアボートされる。第3に、ウェスコット氏等のメカニズムにより収集される情報は、例えば、キャッシュミスのような個々の事象属性に集中するが、命令間の関係を決定するための有用な情報を与えるものではない。
【0019】
最近、「ロード通知(informing loads) 」と称するハードウェアメカニズムが提案されている。これについては、1996年5月22日のプロシーディングズ第23アニュアルインターナショナルシンポジウム・オン・コンピュータアーキテクチャー、第260−270ページに掲載されたホロイッツ氏等の「インフォームドメモリオペレーション:近代的なプロセッサにおけるメモリ性能フィードバックの供給(Informed memory operations: Providing memory performance feedback in modern processors)」を参照されたい。この場合は、メモリオペレーションに続いて、そのメモリオペレーションがキャッシュにおいてミスした場合及びその場合にのみ条件分岐オペレーションを行うことができる。プロファイリングについては特に設計されていないが、このメカニズムは、特にDキャッシュミスの事象情報のみを収集するのに使用できる。
【0020】
キャッシュミスルックアサイド(CML)バッファと称する他の特殊なハードウェアにおいては、高いレベル2のキャッシュミスレートに悩まされる仮想メモリページが識別される。この詳細な説明については、1994年10月4日のプロシーディングズ・オブ・ザ・シックスス・インターナショナルコンファレンス・オン・アーキテクチャルサポート・フォア・プログラミングランゲッジ・アンド・オペレーティングシステム、第158−170ページに掲載されたバーシャド氏等の「大型の直接マップ式キャッシュにおける競合ミスの動的な回避(Avoiding conflict misses dynamically in large direct-mapped caches)」を参照されたい。
インテル社のペンティウムのようなプロセッサは、分岐プレディクタの分岐ターゲットバッファ(BTB)の内容をソフトウェアで読み取ることができる。ソフトウェアでBTBを周期的に読み取ることにより、コンテ氏等は、プログラムの限界実行頻度を推定するための非常にオーバーヘッドの低い技術を開発した。これについては、1994年11月30日のプロシーディングズ・オブ・第27アニュアルインターナショナルシンポジウム・オン・マイクロアーキテクチャ、第12−21ページに掲載された「プロファイル駆動の最適化をサポートするための分岐ハンドリングハードウェアの使用(Using branch handling hardware to support profile-driven optimization) 」を参照されたい。
【0021】
この解決策は、関連サンプリング情報を記憶する「プロファイル記録」に含まれた分岐方向情報を追跡することにより得られるものと同様の情報を形成する。最近、コンテ氏等は、分岐が実行される回数及び実行されない回数をカウントするプロファイルバッファと称する付加的なハードウェアの断片を提案している。これについては、1996年12月2日のプロシーディングズ・オブ・第29アニュアルインターナショナルシンポジウム・オン・マイクロアーキテクチャー、第36−45ページに掲載された「プロファイルバッファを使用する正確且つ実際的なプロファイル駆動の編集(Accurate and practical profile-driven compilation using the profile buffer)」を参照されたい。
【0022】
【課題を解決するための手段】
本発明によれば、プロセッサのオペレーションを測定するための装置及び方法であって、従来のメカニズムとは異なる装置及び方法が提供される。事象をカウントし、そして事象カウンタがオーバーフローしたときにプログラムカウンタをサンプリングするのではなく、本発明の装置及び方法は、命令をランダムに選択し、そしてその選択された命令に対して詳細な状態情報をサンプリングすることに依存する。
周期的に、プロセッサの動作中に、プロファイリングされるべき命令がランダムに選択され、そして命令の実行中に何が起きたかのプロファイル記録がプロセッサの内部プロファイルレジスタのセットに累積される。選択された命令の処理が終了し、例えば、命令がリタイアし、アボートし又はトラップした後に、割り込みが発生される。パイプラインにおいて命令がいかに処理されたかの詳細を特徴付ける記録情報を内部プロファイルレジスタからソフトウェアによりサンプリングすることができる。
【0023】
プロファイルレジスタは、命令の実行に関する多数の有用な事実を記録することができる。性能情報は、例えば、選択された命令が実行パイプラインの各段において費やしたサイクルの数、即ち段の待ち時間、命令がIキャッシュ又はDキャッシュミスを受けたかどうか、メモリオペランドの有効アドレス又は分岐/ジャンプターゲット、そして命令がリタイア又はアボートされたかどうかを含むことができる。
順序正しく実行する(インオーダー型)プロセッサにおいては、サンプルされた命令のフェッチ−リタイア待ち時間が与えられたときに各命令に起因する全ストールサイクル数を推定することができる。これは、1つのストールした命令が別のストールした命令とオーバーラップすることがないので、ボトルネックを識別するのに充分である。
【0024】
順序ずれして実行する(アウトオブオーダー型)プロセッサにおいては、ほとんどのストールがおそらくオーバーラップし、そしてそのストールした命令の周りで順序ずれして発生される他の命令によりマスクされる。これは、ストールした命令の識別を困難なものにする。更に、ボトルネックを識別するためには、各命令が実行される間に同時性の平均レベルに関する情報を収集することが必要となる。
特殊目的のハードウェアは、プロファイリングされた命令が実行される間に発生する命令の数をカウント及び記録して、同時実行のレベルを測定することができる。しかしながら、これは、発生するがアボートされ、従って、リタイアしない命令を考慮に入れるものではない。そこで、有用な同時性の量の測定値が与えられる。有用な同時性は、並列に発生しそして所与の命令で首尾良くリタイアする命令の平均数である。発生するがその後にアボートされる命令は、有用ではない。従って、ストールが有用な同時性によりマスクされない命令をボトルネックとして分類することができる。この別の方法を説明するために、アウトオブオーダープロセッサにおいて性能ボトルネックの位置を正確に示すための重要なメトリックは、所与の命令が実行される間に費やされた発生スロットの数である。
【0025】
従って、有用な同時性を測定するために、「対ごとのサンプリング(pair-wise sampling)」と称する技術が提供される。基本的な考え方は、ネスト形態のサンプリングを実行することである。ここでは、第1のプロファイリングされた命令と同時に実行できる命令のウインドウが動的に定義される。命令のウインドウからプロファイリングするために第2の命令がランダムに選択される。プロファイリングされた及び第2の命令は、プロファイル情報を収集できるところのサンプル対を形成する。
対ごとのサンプリングは、各命令に起因する費やされた発生スロットの数を容易に決定すると共に、ボトルネックの位置を既知の技術よりもかなり正確に指示する。一般に、対ごとのサンプリングは、非常に融通性があり、種々様々な当該同時性及び利用メトリックを決定することのできる分析の基礎を形成する。
【0026】
より詳細には、プロセッサのパイプラインにより処理される1つ以上の命令を周期的に且つランダムに選択し、そして実行パイプラインの段を経て命令が進行する間にプロファイル情報を収集するための装置及び方法が提供される。高レベルのソフトウェアは、次いで、この情報を種々の仕方で後処理することができ、例えば、同じ命令の多数の実行から情報を収集することにより後処理することができる。
捕獲することのできる情報は、例えば、命令のアドレス(プログラムカウンタ即ちPC)、命令が命令キャッシュミスを受けたかどうか、及びミスにサービスするために被る待ち時間を含む。命令がメモリオペレーションを実行する場合には、命令がデータキャッシュミスを受けたかどうか決定し、そしてメモリ要求を満足するための待ち時間を測定する。更に、命令が各パイプライン段において費やす時間の長さを測定することができる。又、プロファイル情報は、命令がリタイアしたかアボートしたかを指示すると共に、後者の場合には、どんな種類のトラップが命令の実行をアボートしたかも指示することができる。
【0027】
命令が実行パイプラインを経て進行するときにプロファイリングレジスタのセットに情報が収集される。命令の実行が終了すると、それがリタイアするか又はアボートするために、上位レベルのソフトウェアに割り込みが与えられる。次いで、ソフトウェアは、プロファイリングレジスタに存在する情報を種々の方法で処理することができる。
サンプリングされる性能情報は、プロファイルで指示される最適化にとって非常に有用であるが、事象の発生を集合的にカウントするようなハードウェア事象カウンタとしても多数の使い方がある。
ここに開示する技術は、既存の性能監視ハードウェアに対する改良であり、そして命令を順序ずれして発生できる近代的なマイクロプロセッサにおいて比較的低いハードウェアコストで効率的に実施することができる。
【0028】
より詳細には、システムのプロセッサパイプラインにおいて多数の同時実行命令をサンプリングするための装置が提供される。パイプラインは、複数の処理段を有する。この装置は、パイプラインの第1段へ命令がフェッチされたときに選択される多数の命令を識別する。多数の選択された命令のサブセットは、パイプラインにおいて同時に実行される。多数の選択された命令のいずれかがパイプラインのいずれかの段にある間にシステムの状態情報がサンプリングされる。全ての選択された命令がパイプラインを出るときにソフトウェアに通知して、ソフトウェアがいずれの状態情報も読み取れるようにする。
【0029】
【発明の実施の形態】
システムの概要
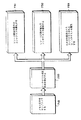
図1は、ここに開示するサンプリング方法及び装置を使用することのできるコンピュータシステム100を示す。このシステム100は、バスライン140で接続された1つ以上のプロセッサ110、オフチップメモリ120及び入力/出力インターフェイス(I/O)130を備えている。プロセッサ110は、例えば、デジタルイクイップメント社のAlpha21264プロセッサのように、集積半導体チップにおいて、機能的実行ユニットを含む多数の実行パイプライン111、命令キャッシュ(Iキャッシュ)112及びオンチップデータキャッシュ(Dキャッシュ)113として実施することができる。又、プロセッサチップ110は、以下に詳細に述べるように、選択された命令に対してプロセッサ状態をサンプリングするためのハードウェア119も備えている。
オフチップメモリ120は、汎用キャッシュ(Bキャッシュ又はSRAM)121と、揮発性メモリ(DRAM)122と、永続的メモリ(ディスク)123とを含むハイアラーキー構成をとることができる。I/O130は、システム100に対してデータを入力及び出力するのに使用できる。
【0030】
オペレーション
システム100のオペレーション中に、ソフトウェアプログラムの命令及びデータがメモリ120に記憶される。命令及びデータは、既知のコンパイラー、リンカー及びローダー技術を使用して従来のやり方で発生される。命令及びデータは、キャッシュ112−113を経て1つのプロセッサ110の実行パイプライン111に転送される。パイプラインにおいて、命令が実行のためにデコードされる。ある命令は、データに作用する。他の命令は、プログラムの実行流を制御する。
命令を実行しながら詳細な性能データを収集することが所望される。性能データは、メモリオペレーション及び実行流に関連付けることができる。
【0031】
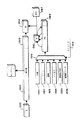
プロセッサパイプライン
図2aは、図1の1つのプロセッサ110の実行パイプライン200を示すもので、これは、例えば、フェッチ、マップ、イッシュー、実行及びリタイアユニット、各々、210、220、230、240及び250としてシリアルに構成された複数の段を有する。パイプライン200が情報(データ及び命令)を処理するレートは、ライン201上のシステムクロック信号、即ちいわゆるクロック「サイクル」により制御される。
各クロックサイクルは、パイプライン200の段が個々の量の処理を実行できるときの「スロット」即ち時間間隔を定義する。処理スロットは、通常、順方向命令を搬送し、そして以下に述べる実行ユニットの場合は、以下一般に「データ項目」と称するデータを搬送する。例えば、分岐予想ミス又はキャッシュミス或いはパイプラインストールのような場合には、クロックはサイクルを続けるが、有意義な命令は順方向に送られない。
【0032】
1つの効果として、本発明の装置及び方法は、「廃物(garbage) 」即ち非有効データを搬送するプロセッサスロットに関する状態情報をサンプリングすることができる。これらは、「浪費(wasted)」スロットとして知られている。浪費スロットを識別しそしてサンプリングすることは、タスクを最適化するための重要な先駆手段である。というのは、浪費スロットは、有効に機能せず、従って、システム性能を低下するからである。それ故、一般に、ここでサンプリングされるものは、公知技術のように単なる「事象」又は「命令」ではなく、プロセッサスロットが有効な命令に関連したものであるか無効の命令に関連したものであるかに関わりなくパイプライン200を経てプロセッサスロットをプッシュすることに関連した状態情報をである。
【0033】
フェッチユニット
Bキャッシュ121は、データ項目を各々Iキャッシュ112及びDキャッシュ113に転送する。フェッチユニット210は、仮想アドレスを物理的アドレスへと解析するためのある形式の変換ルックアサイドバッファ(TLB)205を使用して、実行されるべき次の命令をIキャッシュ112からフェッチする。Iキャッシュ112からフェッチされる項目は、一般的に、実行可能な命令である。しかしながら、これらは、Iキャッシュが「廃物」データ即ち非命令をミスする場合のように、無効命令でもよい。
単一のプロセッササイクル中に「命令」のセットがフェッチされるのが好ましい。このセットは、例えば、4つの命令を含むことができる。換言すれば、パイプライン200は、4スロット巾である。スロットの数は、使用可能な実行ユニットの数に基づく。他の形式のプロセッサは、単一プロセッササイクル中により少数の又はより多数の命令をフェッチすることができる。一般に、これは、各サイクルがキャッシュから4つの処理スロットを満たすことを意味する。あるスロットは、Iキャッシュ112が使用可能なデータをもたないときに浪費される。全ての処理を休止、停止するのではなく、スロットはいかなる場合にも順方向に搬送されて、サンプリングの目的で使用できるようにされるが、スロットの廃物「命令」は、実行のために発生されることがない。
フェッチ中に、選択された命令は、サンプリング又はシステムプロファイリングを許すために付加的な情報で増強することができる。増強命令は、図4を参照して以下に説明する。他の実施においては、選択された命令の増強が、イッシューユニット230を含むプロセッサのいかなる段でも実行できることに注意されたい。
【0034】
マップユニット
システム100では、パイプライン200の次の段のマップユニット220を用いて命令のオペランドが物理的レジスタに動的に指定又は「マップ」される。マップユニットは、物理的レジスタをアーキテクチャー即ち「仮想」レジスタに指定する。換言すれば、仮想レジスタと物理的レジスタとの間には1対1の対応がなくてもよい。
【0035】
イッシューユニット
次の段において、フェッチされた命令は、イッシューユニット230によって順序付けされる。イッシューユニット230は、実行されるべき次の命令のための待ち行列ヘッド(a head-of-the-queue) エントリ231を有するイッシュー待ち行列を備えている。命令に必要なリソースが使用できないために、イッシューユニット230の1つ以上の命令がストールされ得ることに注意されたい。それ故、ストールされた命令の「周り」で待ち行列230から他の保留中命令が順序ずれして発生される。正しい実行順序は、以下に述べるリタイアユニット250で確認される。
【0036】
実行ユニット
命令は、機能的実行ユニット(E0・・・E3)241及びld/stユニット242へ発生される。実行ユニット241の各々は、特定形式のオペレータコード(opコード)、例えば、整数及び浮動小数点演算、分岐及びジャンプ命令等で命令を取り扱うように設計される。ld/stユニット242は、メモリアクセス命令を実行し、例えば、Dキャッシュ113に対してデータをロード及び記憶する。ld/stユニット242は、長い遅延を経験するために特別に識別される。又、長い待ち時間を伴うメモリアクセス命令は、スループットを改善するために、データがプロセッサに送り込まれるかなり前に「完了」となる。
【0037】
リタイアユニット
命令の実行の終了は、リタイアユニット250により処理される。リタイアユニット250は、処理状態をコミットする。ある命令は、アボートするか、又はとラップされることに注意されたい。例えば、実行流は、命令がフェッチされた後に変化するか、又は命令は、例外トラップを被ることがある。このような場合に、パイプラインに既にある命令及び全ての後続命令は破棄され、そして推測的処理状態がロールバックされる。ここでの1つの効果として、破棄又は「アボート」された命令も、浪費プロセッサスロットと同様にプロファイリングされる。換言すれば、終了とは、完全に実行された有効命令をリタイアし、部分的に実行された有効命令を後処理し、或いは無効命令又は浪費スロットを破棄することを意味する。
【0038】
本発明の技術の根底にある基本的な考え方は、パイプライン200の段を経て進むときに、選択された「スロット」、主として命令において「データ項目」の処理を行うものである。プロファイリングハードウェアは、詳細な状態情報を動的に収集する。状態情報は、いずれのパイプライン段からでも又はシステム100のどこからでも到来することができ、例えば、第1及び第2レベルキャッシュ又は他のサブシステムから到来することができる。状態情報は、特定事象に直接起因し得る。
ここでの設計戦略は、プロファイル記録において静的に決定することが困難な情報を収集することである。これは、プロファイル記録を性能ツールとして又はプロファイルで指令される最適化として有用なものにするか、或いはサンプリング及び分析に直接応答する動的な調整を含むオペレーティングシステム及びアプリケーションレベルソフトウェアにおけるリソース割り当てポリシー判断を行う上で有用なものにする。本発明の方法及び装置は、実際の機能的システムにおいて作用するよう設計されることを想起されたい。
【0039】
プロファイル記録の一部分としてセーブするのにどんな状態情報に関心があるかを決定するために、図2bに示すように、近代的なアウトオブオーダーマイクロプロセッサのパイプライン200の種々の段に理論的に得られる情報を検査することが有用である。
図2bに示すように、パイプラインの段は、フェッチ210、マップ220、イッシュー230、実行240及びリタイア250である。これらの段のいずれかの間に、特定の実施形態に基づき、パイプライン200で処理されるいずれかの「フライト中」命令202をライン512によりサンプリングのために選択することができる。この選択は、カウンタ510の値により制御される。カウンタの値は、ライン(init)により初期化することができる。
【0040】
命令アドレス(PC)281、分岐経過ビット(HIST)282、段の待ち時間283、分岐実行指示(T)287、データアドレス(ADDR)284、データミス(MISS)285及びリタイア状態286のような状態情報は、ライン288においてサンプリングすることができる。選択された命令の処理が終了すると、ライン289に割り込み信号を発生することができる。割り込み信号289は、ソフトウェアでライン299を経て状態情報281−286をサンプリングすることができるようにする。或いは又、ソフトウェアは、内部プロセッサレジスタ541を経てライン289をポーリングすることもできる。
【0041】
スーパースカラーのアウトオブオーダープロセッサアーキテクチャー
アウトオブオーダー実行プロセッサは、正しい順序で命令をフェッチ及びリタイアするが、それらのデータ依存性に基づいて命令を実行する。命令は、それがフェッチされたときから、それが終了するまで、例えば、リタイア又はアボートするまで、「フライト中」であると言える。命令は、マッピングの後、イッシューユニット230に入れられ、そして入力オペランドを保持するレジスタが更新されるまでそこで待機する。
各プロセッササイクルごとに、フェッチユニット210は、命令キャッシュ112から命令のセットをフェッチしてデコードする。フェッチユニット210の一部分である命令デコーダは、フェッチされたセットの中のどの命令が命令流の一部分であるかを識別する。フェッチすべき次の命令のプログラムカウンタ(PC)を分析するには多数のサイクルを必要とするので、次のPCは、フェッチユニット210の一部分である分岐又はジャンププレディクタにより予想される。予想が間違っている場合には、プロセッサは、その予想ミスした命令、即ち「不良」経路においてフェッチされた命令をアボートし、そして「良好」経路においてフェッチ命令を再スタートする。
命令を順序ずれして実行できるようにするために、レジスタはマップユニット220により動的に名前が付け直され、「読み取り後の書き込み」及び「書き込み後の書き込み」競合を防止する。同じ仮想レジスタに書き込む2つの命令は、順序ずれ状態で安全に実行することができる。というのは、それらは、異なる物理的レジスタに書き込みするのであり、そして仮想レジスタの消費者が適切な値を得るからである。命令は、正しい順序でフェッチされ、マップされそしてリタイアされるが、順序ずれ状態で実行することができる。
【0042】
レジスタマップユニット220は、フェッチされた命令のオペランドを有効な物理的レジスタに指定する。即ち、レジスタオペランドの仮想名は、プロセッサの物理的なレジスタスペースに対して名前付けし直される。次いで、命令は命令待ち行列230へ送られ、そこで、実行の前に2つの事象を待機する。第1に、それらのレジスタ依存性を分析しなければならない。第2に、命令に必要なリソース、例えば、実行ユニット、レジスタ、キャッシュポート、メモリ待ち行列等が使用できねばならない。これは、現在マップされたいかなる命令に対しても、必要なリソースを再割り当てできないことを意味する。
ある命令に対してこれら2つの条件が満たされると、命令オペランドが物理的レジスタファイルにおいて探索される。次いで、オペランドレジスタの内容及び命令に関するある情報が適当な実行ユニット240へ送られて実行される。命令が実行を終了し、そして命令がプロセッサにおいて最も古い「非リタイア」命令であるときに、命令がリタイアする。これは、命令により使用されるリソース、例えば、物理的レジスタ及びキャッシュポートを解放する。
【0043】
多数の事象が命令の実行を遅延させることがある。パイプラインの前方では、フェッチユニット210がIキャッシュ112のミスによりストールするか又はフェッチユニット210が予想ミス経路の命令をフェッチすることがある。マップユニット220は、空きの物理的レジスタの欠乏、又はイッシューユニット230における空きスロットの欠乏によりストールすることがある。
イッシューユニット230における命令は、それらのレジスタ依存性が満足されるのを待機するか、又は実行ユニット240が使用できるのを待機する。命令は、Dキャッシュにおけるミスによりストールすることがある。命令は、それらが不良経路に沿って推測的に発生されるか、又はプロセッサが不法なオペレーション又はメモリアドレスのような割り込みを行ったためにトラップされることがある。これら条件の多くは、コンパイル時に予想することが困難であり、それらは全てシステム100の性能を低下させる。これにより、ライン288に得られる情報をサンプリングすることが重要となる。
【0044】
プロファイル情報レジスタ
それ故、図3に示すように、サンプリングされる各命令ごとにプロファイル情報を記憶するためのメモリ300が設けられる。メモリ300は、レジスタファイル又はバッファの形態でよい。換言すれば、サンプリングされる選択済み命令は、レジスタファイル300で直接識別される。レジスタファイル300は、複数のレジスタを含むことができる。或いは又、ファイル300は、多数のフィールドをもつ単一のインデックス可能なレジスタとして実施することができる。
ファイル300は、図2bのライン288によりパイプライン200の要素に接続され、従って、選択された命令に関連した性能情報をパイプライン200の各段に対して捕獲することができる。プロファイルレジスタ300は、公知技術で見られる単純な「事象」カウンタ以上のものであり、ここでは、これらレジスタは、特定の既知の命令及び事象に起因する性能情報を収集することに注意されたい。
【0045】
図3において、各レジスタに対して割り当てられるビットの数は、そこに記憶される情報の形式、例えば、命令アドレス(64ビット)、サイクルカウント、即ち待ち時間(8又は10ビット)、個別事象(1ビット/事象)等々に依存している。これらの数は単なる指針に過ぎない。他の実施形態は、種々のレジスタ300に対して異なるビット数を使用することができ、これは設計上の選択肢である。
好ましい実施形態では、プロファイルPCレジスタ310は、選択された命令のPCを記憶する。以下に述べるように、プロファイリングされている命令は、アサートされた「プロファイル」ビットを有する。又、PCレジスタ310は、選択された命令のopコードを含むこともできる。更に、マルチスレッド式実行を許すプロセッサについては、レジスタ310の付加的なビットがスレッドの識別子を記憶することができる。レジスタ310の他のフィールドは、プロセス識別子、アドレススペース番号、CPU番号、及び実行されている命令の命令番号(inum)を記憶することができる。更に、多数の論理レジスタセット、即ちハードウェアコンテクスト及び同時実行スレッドを有するプロセッサでは、レジスタ310がハードウェアコンテクスト及びスレッド識別子である。この情報を記憶することにより、プロファイル情報を特定の命令に直接起因させることができる。更に、サンプリングされた情報は、アドレスの範囲、opコード、実行スレッド、アドレススペース、等々に基づいてフィルタすることができる。
【0046】
プロファイル有効アドレスレジスタ320には、選択された命令に関連したアドレスがロードされる。命令がロード又は記憶のようなメモリアクセス命令である場合には、有効な64ビット仮想メモリアドレスが捕獲される。命令がジャンプ又は分岐である場合には、ターゲットPCが記録される。
本発明のサンプリング技術の1つの効果として、パイプライン200によって処理される全ての「命令」は、サンプリングレートに関わりなく、サンプリングのために選択される確率が等しい。命令は、有効な命令、無効の命令、非割り込み命令、又は「廃物」命令である。従って、捕獲された有効アドレスは、プログラムの全体的な振る舞いを統計学的に表す。サンプリングされた命令の有効アドレスを捕獲することにより、メモリアクセス及び実行流を、実際の動的な実行に正確に関連付けることができる。
【0047】
プロファイル事象カウンタ330は、例えば、1ビットフィールドに区画化される。1ビットフィールドは、選択された命令に対する事象を記録する。命令が最初に選択されるときに、レジスタがクリアされる。事象は、キャッシュミス、分岐予想ミス、リソース競合、トラップ及び例外条件、リタイア/アボート/無効、TLBミス、実行/非実行、データ依存性ストール、リソース依存性ストール、等々を含む。この実施形態では、多数の事象を単一の命令に起因させることができる。リタイア及びアボートの両命令に対して事象情報が収集されることに注意されたい。事象レジスタ330のサイズを減少するために、あるビットフィールドを使用して、命令のopコードに基づき異なる形式の相互に排他的な事象を記録することができる。
【0048】
プロファイル経路レジスタ340は、分岐経過テーブルから最近の分岐実行/非実行情報を捕獲するのに使用される。分岐経過テーブルは、他の用途に対して良く知られている。グローバルな分岐実行経過は、選択された命令をフェッチした実行経路を指示するのに使用できる。命令は、この情報を有効なものにするために分岐命令である必要はないことに注意されたい。経路情報の使用は、以下で詳細に説明する。
待ち時間レジスタ350は、選択された命令が、例えば、パイプライン200の種々の段間をフライト中である間に、チェックポイントにおいて得られたタイミング情報を記憶する。チェックポイントは、命令がストールされて、ある事象又はリソースを待機する場所に基づいて、プロセッサごとに異なる。各待ち時間レジスタ350は、2つのチェックポイント間で命令が費やすサイクル数をカウントする。
【0049】
選択された命令がチェックポイントを通過し、即ちパイプライン200の次の段に入るときに、それに対応する待ち時間レジスタ350が最初にクリアされ、そして1サイクル当たり1回増加され、やがて、命令が次のチェックポイントを通過し、次の待ち時間レジスタが初期化されそしてカウントを開始する。待ち時間レジスタ350の数は、特定の実施形態におけるパイプライン200の段数に基づく。命令がアボート又はリタイアするときには、待ち時間レジスタ350に完全な待ち時間プロファイルが記憶される。
収集すべき潜在的に有用な待ち時間のリストは、フェッチ対マップ、マップ対データレディ、データレディ対実行、実行対リタイアレディ、リタイアレディ対リタイア遅延を含む。メモリ命令(ロード及び記憶)の場合、待ち時間は、イッシュー対完了である。この最後の待ち時間は、あるメモリオペレーションは、それらが作用するデータが実際にプロセッサに送られる前にリタイアの準備ができるという点で、他の待ち時間とは異なる。これらの待ち時間は、レジスタ350で直接カウントすることもできるし、或いはレジスタが生のサイクルカウントを収集することもでき、この場合に、プロファイリングソフトウェアは、次々の段に対する生のカウント間の差を計算して、実際の待ち時間を決定する。例えば、パイプライン待ち時間クロックサイクルをカウントする回路は、図6を参照して以下に詳細に説明する。
【0050】
レジスタ300における情報の更新は、遅延が受け入れられた直後に行う必要はない。必要とされるのは、選択された命令が完了した(リタイア又はアボートした)ことを知らせる割り込みを、レジスタファイル300の全ての情報が更新されるまで遅延するか、或いは割り込みハンドラーを、プロファイルファイル300が更新されるまでストールできるようにすることだけである。
プロファイルレジスタファイル300を複写できることに注意されたい。プロファイルレジスタファイルの多数のコピーがある場合には、シリアルに又は同時にプロファイリングするために多数の命令を選択することができる。この場合には、各選択された命令が、以下に述べるように、特定のレジスタファイルで明確に識別される。オーバーヘッドの量を減少するために単一の割り込み信号に応答して多数のレジスタファイルをサンプリングすることができる。
【0051】
増強命令
図4に示すように、各命令400はサンプルフィールドを含む。例えば、このサンプルフィールドは、「サンプル」ビット(S)401と称する1ビットタグである。サンプルビット401がアサートされると、サンプリングのために命令が選択される。ビット401をアサートすると、プロファイル情報を収集するサンプリングハードウェアが作動されると共に、選択された命令が完了した(リタイア又はアボートされた)ときに割り込みを生じさせる。或いは又、フェッチされた各「命令」を「inum」値で連続的に番号付けすることもできる。この場合には、特定のinum値をもつ命令を選択することができる。命令を選択するメカニズムについては、以下に述べる。
【0052】
プロファイルレジスタファイル300は、フィールドが更新されそして割り込み信号が発生されたときに読み取ることができる。割り込み信号は、特権付きのプロファイリングソフトウェア(PSW)がプロファイルレジスタ300の内容を処理できるようにする。多数のサンプルが記録される場合には、単一の割り込みで、多数の選択された命令に対して性能データをサンプリングできることに注意されたい。
実施形態に基づき、増強命令400は、次の付加的なフィールド、即ち3つまでの命令オペランド(op1、op2及びop3)411−413と、プログラムカウンタ(PC)420と、オペレータコード(opコード)430とを含むことができる。有効フィールド(V)431は、1ビットフィールドを真又は偽にセットすることにより、選択されたスロットにおける「命令」が有効であるかどうか指示することができる。フィールド440及び450は、命令に関連したIキャッシュ及びTLBミスを各々指示するために指定することができる。単一の命令が多数のオペランドを含み得るので、その命令に対して多数のミスが考えられることに注意されたい。
【0053】
プロファイルレジスタファイルID
若干複雑な設計では、多数の命令を同時にプロファイルすることができる。この実施形態では、複数のレジスタファイル300、或いはサブフィールドを伴う単一の大きなレジスタがあり、ファイル300の数は、同時にプロファイルすることのできるフライト中命令の数に対応する。このケースを取り扱うために、命令400は、サンプルレジスタファイル識別子(ID)フィールド402も含むように増強される。これは、多数のレジスタファイル300の1つにプロファイル情報を直接リンクできるようにする。上記したように、ここでは、選択された命令とプロファイルレジスタとの間に直接的な関連がある。それ故、レジスタに収集されるプロファイル情報は、特定の命令に直接起因し得る。
一度に1つのフライト中命令しかプロファイリングされないときでも、ファイル即ちレジスタ300をIDフィールド402でインデックスして、プロファイリングソフトの割り込みハンドラーのコストを多数の命令サンプルにわたり償還できるようにするのが有用である。命令セット内の命令が選択された命令であるかどうかを決定することは、「ワイヤドOR」オペレーションを用いて行うことができる。
【0054】
ランダムサンプリング
本発明のプロファイリングのオーバーヘッドは、同時にプロファイリングすることのできる命令の数を制限することにより減少され、例えば、ビット401がセットされる。プログラム又はプログラムの一部分において各命令をプロファイリングするのではなく、ここでは、プロファイリングされるべき命令が、プロセッサパイプライン200の特定の段階中に、例えば、フェッチの間に選択され、そしてその選択された命令がサンプルビット401のアサートによりタグ付けされる。サンプルビット401がアサートされた場合には、パイプライン200の要素がプロファイル情報をプロファイルレジスタファイル300へ送る。
ここに記載する命令レベルプロファイリングをサポートする詳細について以下に述べる。
【0055】
フライト中状態
第1に、プロセッサパイプライン200を通過する各デコードされた命令状態は、上記のように、付加的な情報で増強される。命令は、それがフェッチされたときから、それがリタイア又はアボートするときまで、フライト中であるとみなされる。上述したように、命令は、少なくとも1つのサンプルビット401で増強される。サンプルビット401は、各フライト中命令及びキャッシュ/メモリ要求の状態の一部分である。ビット401がアサートされると、このビットは、この命令に対してプロファイリング情報が記録されることを示し、さもなくば、記録されないことを示す。
簡単な設計においては、一度に1つのフライト中命令のみが、そのサンプルビット401をアサートすることが許される。サンプルビット401は、選択された命令に対し、その命令がリタイアするか又はアボートされるまで、アサートされたままとなる。多数のレジスタファイル300をもつ更に複雑な設計では、多数のフライト中命令を個々にプロファイリングすることができ、そして付加的なビットをアサートすることができる。
【0056】
プロファイルされた命令の選択及びサンプリング
フェッチ段の実施について図5に示したように、プロファイリングされるべき命令の選択及びプロファイル情報のサンプリングは、次のように行われる。フェッチカウンタ510は、例えば、特権付きプロファイリングソフトウェア(PSW)520によりライン511を経て初期化される。PSW520は、所定サイズを有する値の間隔からランダムに選択された値でカウンタ510を初期化することができる。従って、サンプリングされた命令は、命令の実行における特定のパターンと相関しない。間隔のサイズは、サンプリングの平均頻度を決定する。カウンタ510の値を初期化するための他のランダム化技術(ハードウェアを含む)も使用できる。
【0057】
例えば、公知技術の場合のように命令が固定頻度でサンプリングされるときのように、ランダムサンプリングが行われないと、例えば、システム100の収集オペレーションのように、フェッチされた全ての命令の統計学的に正しいプロファイルを発生することができない。これは、サンプリングレートに対して比較的重要でない多数の命令を含む実行ループを有する実行スレッド、例えば、命令を有しそしてサンプリング間隔が65536個の命令であるループに対して、特に言えることである。他の通常のサンプリングも同じ問題を有する。そこで、2つの命令の一方のみからのサンプルが常に収集される。1つの効果として、ランダムに選択された命令は、サンプリング間隔の長さとは独立した相関を発生する。
各命令400がフェッチされるたびに、カウンタ510がパイプライン200のフェッチユニット210によりその初期値から増加されるか、或いは別の実施形態では、減少される。カウンタ510が、その実施形態に基づいて、オーバーフローするか又はアンダーフローしたときに、現在フェッチされた命令がそのサンプルビット401をアサートし、そしてIDフィールド402は、多数の命令がサンプリングのために選択されたときにも初期化することができる。
【0058】
別の実施形態では、カウンタ510は、各命令がフェッチされるたびではなく各サイクルごとに増加され、例えば、カウンタ510は、フェッチの機会をカウントし、実際にフェッチされる命令をカウントするのではない。例えば、フェッチユニット210が各クロックサイクル中にIキャッシュ112から4つの項目をフェッチできる場合には、4つのフェッチ機会がある。Iキャッシュからの1つ以上のフェッチがミスとなるか又は「不良」命令をフェッチすることがある。ミスの場合には、ミスした命令に対して使用できるスロットが「廃物」を含み、命令を無効とマークすることが必要になる。不良命令は、不良の実行経路に存在するものであるか、又はさもなくば、アボートされる。
フェッチされた命令ではなくサイクルをカウントする場合には、設計を効果的に簡単化する。フェッチされた有効な命令のみをカウントする場合には、かなり複雑なものとなる。というのは、制御流が、フェッチされた命令のグループに向かって又はそこから分岐することができ、従って、全ての命令をデコードしてどれが有効であるかを決定することが必要となり、もはや、カウンタを4だけ増加するだけの簡単なことではなくなるからである。
【0059】
1つの効果として、サイクル中にIキャッシュからフェッチされた全てのもの(良好な命令、不良の命令、廃物命令)をサンプリングのために選択し、Iキャッシュ112及びパイプライン200の真の性能を決定することができる。ここでは、バイアスはなく、従って、システム性能の統計学的に正しい推定値が得られる。
これは、短い固定の時間周期中に又は離間された固定の間隔で各有効な命令のみを選択する既知の技術とは区別されるものである。何れの場合にも、オーバーヘッドを最小にすることが戦略である。システム全体の性能データを捕獲することのできる技術はない。
【0060】
命令のフィルタ動作
選択されたものは、フィルタ505によりフィルタすることができる。フィルタ動作は、命令opコード、オペランド、或いは例えば、ある時間周期内で第1形式の命令の後に別の形式の命令が続くといったより複雑なフィルタ基準に基づいて行うことができる。パイプライン200への入力においてフィルタ動作を行う場合には、カウンタ510をリセットすることができる。これを行う方法は、多数ある。1つの方法では、カウンタ510の現在初期値が初期値(init)レジスタ513に記憶される。命令がフィルタされるときには、初期値レジスタ513に記憶された値がカウンタ510に再ロードされ、初期のランダム化選択が想起される。
【0061】
命令が増強された後に、パイプライン200は、図2bのプロファイル情報281−286をレジスタファイル300(1つ又は複数)に供給する。リタイアユニット250は、命令の完了又はアボートに応答して、プロファイル情報をファイリングを完了し、そしてライン540に割り込み信号を発生して、PSW520がプロファイル情報をサンプリングできるようにする。
或いは、PSW520は、内部プロセッサレジスタ又はメモリ位置(541)を経てライン540をポーリングすることもできる。本発明の技術の1つの特徴として、公知のあるプロファイリング技術とは対照的に、たとえ本発明の技術がプロセッサにわたる状態に関する正確な情報を与えるものであっても、プロセッサのサイクルタイムに何ら影響を与えない。唯一の時間制約は、プロファイルレジスタ300がサンプリングされる前に全てのプロファイル情報を記録しなければならないことである。
【0062】
待ち時間カウンタ
図6は、例示的な待ち時間、フェッチ対マップ(FM)、マップ対イッシュー(MI)、イッシュー対リタイア(IR)、フェッチ対トラップ(FT)、及びイッシュー対ldst(ILS)をカウントするための回路600を示す。この回路600は、ライン611によりラッチ620に接続されたサイクルカウンタ610を備えている。
サイクルカウンタ610及びラッチ620は、ライン601上の信号Pfetchにより初期化される。この信号は、プロファイリングされるべき命令がフェッチされるときに発生され、例えば、サンプルビット401から導出される信号である。カウンタ610は、ライン609のクロック信号により増加される。各クロック信号は、1つのプロセッササイクルに対応する。
命令400がパイプライン200の段を経て進行するときに、パイプライン200の段遷移がライン602−606の信号、各々、Pmap、Pissue、Pretire、Ptrap及びPLSdoneをトリガーする。対応するラッチ620は、図3のプロファイル待ち時間レジスタ(又はフィールド)350に記憶するためにライン612−616において読み取ることができる。
【0063】
プロファイリングアプリケーション
上記のプロファイリングハードウェアは、種々の異なる方法で使用することができる。本発明の技術は、個々の命令の実行に関する非常に詳細な情報を与えるので、1つのアプリケーションで非常に多数の命令をプロファイリングすることができる。サンプル情報はメモリバッファに記憶され、プロファイリングツールにより後で処理されて、詳細な命令レベル情報を形成することができる。
この情報は、例えば、各ロード命令に対するロード待ち時間のヒストグラム、命令実行時間のヒストグラム、及びおそらくは各命令に対するパイプライン状態の適度に包括的な分析を発生するのに使用できる。この解決策により与えられる情報の量は、おそらく、かなり多くなるので、本発明の技術の全メモリオーバーヘッドも、相当の量のメモリトラフィックが含まれるために、かなり大きなものとなる。例えば、1秒当たり10億の命令がフェッチされ、そして各1万のフェッチされる命令ごとにサンプリングが実行される場合には、プロファイル情報のデータレートが1秒当たり約2.4MBとなる。
以下、プロファイル情報を収集することにより帯域巾を減少するためのソフトウェア実施方法について説明する。
【0064】
出力プロファイル情報をフィルタすることによるデータの減少
サンプリングされるデータの量は、プロファイル記録のあるフィールド、例えば、プロファイルレジスタ300のデータを、それらが明確に要求されるときを除いて、無視することにより、減少することができる。システム100のユーザは、異なるレベルのプロファイリングを望むことがある。最低のオーバーヘッドモードでは、プロファイリングアプリケーションソフトウェアは、PC及びリタイア−遅延フィールドのみを用いてプログラムの全部又は一部分に対してプロファイルレポートを発生することができる。実行されるべき最適化に基づき、平均化又は他の統計学的メトリック、例えば、最小、最大又は標準偏差の計算により他のPCごとの(per-PC)値を要約することができる。データを処理するための更なる時間が与えられると、プロファイリングアプリケーションは、種々の命令待ち時間のヒストグラムを形成することができる。
【0065】
有効なメモリアドレス、分岐ターゲットアドレス及び分岐経過サンプルは、おそらく、他のフィールドよりも経費のかかる処理を必要とする。これらのフィールドは、おそらく、特定の最適化タスクを実行するためにデータを収集するとき以外は無視することができる。命令と命令との間の命令間フェッチ距離がサイクルで与えられると、プロファイリングアプリケーションは、同時性のレベルに関する情報も収集することができる。
又、プロファイリング情報のフィルタ動作は、例えば、マスクレジスタ又はプログラマブルロジックのようなハードウェア手段により行うこともできる。例えば、キャッシュミスがあったとき又は命令がリタイアしたときにのみサンプルリングするか、或いはopコード、オペランド、アドレス、事象及び待ち時間の他のブール組合せのみをサンプリングする。
【0066】
ハードウェアオペレーションの決定
本発明のプロファイリング技術は、Alpha21264プロセッサのようなアウトオブオーダーイッシュープロセッサの内部動作の正確な理解を得るために使用することができる。この形式のマシン編成に関して注目すべき第1の事柄の1つは、パイプライン200において命令がストールする場所が多数ありそしてストールする理由が非常に多数あることである。
例えば、ある命令は、イッシューユニット230においてストールすることがある。というのは、そのオペランドの幾つかがデータレディでなく、選択された命令の実行に必要なリソースの幾つかが使用できず、又はその命令に先立って他の命令が実行されるべく選択されるからである。
【0067】
ある命令は、仮想−物理的レジスタマッピングを行うマップ段においてストールすることがある。というのは、マシンが物理的レジスタからのものであり、フライト中の命令が非常に多数あり、或いはイッシューユニット230がいっぱいである(実行されようとしている命令を入れる場所がないことを意味する)ためである。或いは又、ある命令は、リタイアユニットにおいてストールすることがある。というのは、プログラム順に既にイッシューされた命令がまだ完了していないからである。
命令がどこでストールされたか、なぜストールされたかそしてどれほどの時間ストールされたかを正確に決定することは、主に、その命令が実行されるときのマシンの正確な状態によって左右される。プロセッサがこのように動的であるために、ソフトウェア性能ツールでこの状態を静的に決定することは困難である。
【0068】
オペレーションの概要
図7aに示すように、プロファイリング方法700は、次のステップを含むことができる。プロファイリング状態は、ステップ710において初期化される。ここで、レジスタがクリアされ、そしてカウンタに初期値が指定される。ステップ720において、命令がフェッチされそしてカウントされる。ステップ730において、初期化以来フェッチされた命令の数が所定のランダム数に等しいときに命令が選択される。選択された命令は、その選択を指示するよう増強される。選択された命令が実行パイプライン200を経て進むときに、ステップ740においてプロファイル情報が収集される。完了(リタイア又はアボート)時に、収集された情報がステップ740においてサンプリングされる。サンプリングされた情報は、その後の処理のためにバッファすることができる。又、特定のプロファイリング状態をサンプリングし、より詳細な情報を抽出することもできる。
【0069】
処理された命令の特性の統計値の推定
図7bに示されたように、プロセス799は、パイプライン200により処理される命令の特性の統計値を推定する。プロセス799は、次のステップを含むことができる。ステップ751は、ステップ750において上記したようにサンプリングされたプロファイル記録300を読み取る。記録は、選択された命令が完了したときに読み取られる。ステップ760において、サンプルは、システムの状態情報を考慮するファンクション755に基づいて選択又は破棄される。
例えば、ファンクション755は、選択された命令のアドレス、プロセス識別子、アドレススペース番号、ハードウェアコンテクスト識別子、又はスレッド識別子のような状態情報756を入力として得る。又、ファンクション755は、経路識別情報、opコード、オペランド、待ち時間、又は選択された命令により経験する事象のような状態情報も使用することができる。事象情報は、リタイア/アボート/無効状態、キャッシュヒット/ミス、分岐予想ミス、トラップ状態TLBヒット/ミス、及びデータリソース依存性状態、等々である。
【0070】
ステップ760は、ファンクション755に基づいてサンプルのサブセットを発生する。ステップ780において、統計値790が決定される。これら統計値は、サンプリングされた命令の特性の平均値、標準偏差、ヒストグラム(分布)及びエラー限界を含むことができる。例えば、特定の事象が発生する平均レートや、命令実行の平均待ち時間や、メモリアクセスがある。又、プロセス、スレッド又はハードウェアコンテクストの実行レートの平均値も決定できる。ヒストグラムは、命令実行、メモリアクセスレート又は待ち時間のような分布を示すことができる。
エラーの限界は、サンプリングされている特定の特性に対してサンプルの数の平方根の逆数で近似することができる。
【0071】
N個ごとのサンプリング
ここに開示するプロファイリング技術は、N個ごとの(N-wise)サンプリングを実行するのにも使用できる。ここで、多数の同時実行命令間の相互作用の動的な状態を捕獲することができる。単一のフライト中命令をプロファイリングするのではなく、2つ以上の個別の命令が同時にプロファイリングされる。選択された命令間の動的な「距離」は、フェッチされた命令の数、又はフライト中の命令を「分離」するプロセッササイクルの数として測定することができる。カウンタ510によりカウントされる事象のいずれかを用いて、選択された命令間の距離、例えば、クロックサイクル、フェッチされた命令等を測定することができる。
N個ごとのサンプリングされた命令に対するプロファイル情報は、多数の考えられる用途を有する。第1に、情報を分析して、有用な同時性レベルを測定することができる。これは、真のボトルネックを探索できるようにする。真のボトルネックは、長いストールが低い同時性で結合されることを特徴とする。又、N個ごとのサンプルは、経路のプロファイリングを容易にすると共に、経路に沿った少なくとも2つのポイントを含むように経路を制限することにより実行経路候補を明確化することができる。更に、N個ごとのサンプリングから、詳細なプロセッサパイプライン状態を統計学的に再構成することもできる。ここで、命令のグループの選択は、命令間のある類似性の尺度、例えば、最近の分岐経過、ストール、命令形式、又は他の最近の状態経過をベースとすることができる。
【0072】
有効な同時性の測定
アウトオブオーダープロセッサにおいて性能のボトルネックを正確に位置決めするには、ストール時間及び同時性レベルの両方に関する詳細な情報を必要とする。インオーダープロセッサとは対照的に、長い待ち時間の命令がストールされる間にプロセッサを効率的に利用するに充分な同時性があるときには、長い待ち時間の命令が問題とならない。
同時性情報を得るための1つの解決策は、全パイプライン状態のスナップショットを得ることである。これは、同時実行命令のセットが所与の時点でパイプラインの段のどこにあるかを直接的に露呈する。しかしながら、全パイプラインの状態をサンプリングレジスタ及びバッファに「ダンプ」することは、時間及びスペースの両面で非常に経費がかかる。更に、発生される多量のデータは、おそらく、サンプリングのコストを償還するように効率的に収集することができない。更に悪いことに、この解決策は、リタイアする命令しか「有効」としてカウントされず、そしてフェッチされた命令がアボートするところの情報がまだ分からないので、実際上不充分である。
【0073】
ネスト状の対ごとのサンプリング
N個ごとのサンプリングの1つの形式は、単一命令プロファイリングと全パイプラインスナップショットとの間の妥協を最小にする。ここで、統計学的な対ごとの(pair-wise) サンプリングがネスト状に行われ、所与の選択された命令に対して、同時に実行し得る別の命令が直接サンプリングされる。
ネスト状のN個ごとのサンプリングに対するハードウェアサポート
N個ごとのサンプリングは、次のハードウェア特徴を含む。第1に、ハードウェアは、少なくとも2つの同時フライト中命令に対しプロファイル情報を捕獲できねばならない。プロファイルレジスタのセットは、プロファイル記録の多数の個別のセットをサポートするために複写されねばならず、そして単一サンプルビット401は、より一般的なIDフィールド402へと増強されねばならない。第2に、ハードウェアは、サンプリングレートの変更により、選択された命令間の距離を動的に変更できねばならない。これは、ハードウェア又はソフトウェアによって行うことができる。同時サンプリング命令(N個ごと、但しN>1)のセットのサイズは、カウンタ及びレジスタの付加的な複写でより大きくすることができる。
【0074】
例えば、特権付きプロファイリングソフトウェア520は、対ごとのケースでは2つのフェッチカウンタ510の初期値がランダムに選択されるところの間隔のサイズを動的に変更することができる。これは、一対の命令に対するサンプル間フェッチ距離を同時に特定できるようにする。ハードウェアは、ソフトウェアレベルでの最大の融通性を得るために比較的大きなサンプル間フェッチ距離をサポートすることができる。
第2のフェッチカウンタがコアフェッチ命令カウンタ510と同じサイズであって、充分な距離に離れた2つの独立した命令を選択できるのが理想的である。Alpha21264プロセッサの場合には10ビットカウンタで充分である。フェッチ命令をカウントするときに同時性を測定するには、それより小さなカウンタで充分であり、サイクルがカウントされる場合には、それより大きなカウンタが必要とされる。ネスト状のN個ごとのサンプリングについては、ハードウェアは、サンプル間フェッチ・対・フェッチ待ち時間もサイクルで測定して、多数の待ち時間レジスタ350を時間的に相関させることができねばならない。
【0075】
ネスト状のN個ごとのサンプリングアプリケーション
高レベルアプリケーションソフトウェアは、ネスト状のN個ごとのサンプリングを用いて、有効な同時性を測定することができる。ここでの重要な考え方は、潜在的に同時に実行し得る命令セットのサンプリングを許すことである。ネスト状のサンプリングは、通常のサンプリングを正当化する同じ統計学的引数に基づくもので、即ちサンプリングが繰り返し適用される。N個ごとのサンプリングは2つのサンプリングレベルを含むので、著しく実行されるコードについては最も効果的である。明らかに、これは、最も重要なところでもある。
【0076】
定義された同時性
図8に示すように、4巾のパイプラインにおける所与の選択された命令I(810)に対し、潜在的に同時の命令とは、ある動的な実行中に命令Iと共にプロセッサパイプライン200に共存する命令である。これは、命令Iがフェッチされる前に種々の実行段に存在する命令と、命令Iがリタイア又はアボートされる前にフェッチされる命令とを含む。
例えば、Alpha21264プロセッサは、80個のフライト中命令を許すものである。しかしながら、実際には、同時即ちフライト中命令の実数は、おそらく、ハードウェアでサポートされるピーク値より相当に小さい。他方、予想ミス又は不良経路に沿った推測的実行は、潜在的同時性のウインドウを増加することができる。
Alpha21264プロセッサにおいて同時性を検討するために、命令I(810)の周りのウインドウW820の適度なサイズが約100個の命令を含まねばならないことが提案された。他の実施形態については、ウインドウの適当なサイズを実験で決定することができる。
例えば、約100個の潜在的な同時命令であるサイズWのウインドウが与えられると、選択される命令間のフェッチ距離をランダム化することにより非バイアスのサンプリングを行うことができる。例えば、対ごとの各サンプル<I1、I2>(831及び832)に対し、サンプル間フェッチ距離は、1とWとの間に均一に分布した擬似ランダム数にセットされる。このように、第1の選択された命令I1と第2の選択された命令I2との間でサンプル間距離をランダムに変更すると、命令が実際に時間的に重畳するところの多量の統計学的情報が捕獲される。
【0077】
同時重畳の分析
種々のサンプル間フェッチ距離をもつ同時選択される命令のセットに対するプロファイル情報は、有効な同時性統計値を直接的に表す。対応するサンプル情報の各セットを使用し、第1命令I1から時間的に前方にそして第2命令I2から時間的に後方に見ることにより同時性情報を決定することができる。
各N個ごとの選択された命令に対して記録されるプロファイル情報は、両命令<I1、I2>が所与の時間にプロセッサパイプライン200に存在するようなインスタンスを正確に考慮する待ち時間を含まねばならない。更に、待ち時間レジスタのセットを相関させるためには、サンプル間フェッチ待ち行列が記録されねばならない。又、ネスト状のプロファイリングは、放棄した実行経路において命令<I1、I2>が完了したときを指示することもできる。この詳細な情報を統計学的に収集して、有効な同時性レベルを反映する種々のメトリックを形成することができる。
【0078】
浪費イッシュースロットの測定
種々のサンプル間フェッチ距離をもつ対ごとの命令サンプル<I1、I2>の収集は、有効な同時性統計値を直接的に表す。対ごとの各サンプルを使用して、第1命令から時間的に前方にそして第2命令から時間的に後方に見ることにより同時性情報を計算する。命令Iの後にフェッチされた命令に対する性能情報を測定するために、<I、I2>の形態の対を考える。命令Iの前にフェッチされた命令に対する性能を測定するために、<I1、I>の形態のサンプルされた対を考える。
対ごとの各サンプル<I1、I2>に対して記録されるプロファイルデータは、待ち時間レジスタ350に記憶される値であって、各時点にプロセッサパイプライン200のどこにI1及びI2があるかを指示する値と、2セットの待ち時間レジスタ350を相関させることのできるサンプル間フェッチ待ち時間とを含む。又、プロファイル記録は、対<I1、I2>がリタイアするかどうかも指示する。
【0079】
この詳細な情報を統計学的に収集して、有効な同時性レベルを反映する種々のメトリックを形成することができる。例えば、命令Iに対する1つの関心のある同時性の尺度は、Iがフライト中である間に浪費したイッシュースロットの平均数である。
浪費したイッシュースロットの数は、図9に示すように決定できる。I及びI2がリタイアするような形式<I、I2>のサンプルの数をF1とし、サンプルと共に記録される待ち時間は、I及びI2の実行が重畳することを指示する(ステップ910)。それ故、有効な順方向重畳を伴うサンプル対の全数をカウントし、これはF1で表される。同様に、ステップ920において、I及びI2の両方がリタイアしそしてそれらの実行が重畳するような形式<I1、I>のサンプルの数をB1とする。即ち、第2の命令が第1の命令に対してサンプリングされる場合には順方向に、そして第1の命令が第2の命令に対してサンプリングされる場合には逆方向に、各対が2回考慮される。
【0080】
次いで、ステップ930において、一致するサンプルの数F1+B1に潜在的な同時性のサンプルウインドウのサイズWを乗算することにより、命令Iがフライト中である間にイッシューされる有効命令の数を統計学的に推定し、即ち形成されるイッシュースロットの数は、Wx(F1+B1)となる。
イッシュースロットで測定される命令Iの累積的待ち時間L1、例えば、Alpha21264プロセッサで持続できる4/サイクルを付加的に決定することにより、ステップ940において、命令Iの実行中に浪費したイッシュースロット(WIS)の全数を次のように要約することができる。
WIS=L1−(Wx(F1+B1))
値WISは、命令Iの実行当たりの浪費イッシュースロットの割合又は平均数を表すように容易に拡張することができる。好都合にも、この平均に寄与する値を増分的に収集し、データ収集中にコンパクトな記憶を行うことができる。又、これは、1997年3月3日に出願されたウエイル氏等の「プロセッサ性能カウンタの高頻度サンプリング(High Frequency Sampling of Processor Performance Counters) 」と題する米国特許出願第08/812,899号に開示されたような効率的なデータ減少技術を可能にする。
【0081】
命令Iがフライト中である間にリタイアした命令の数、又は命令Iの周りでイッシューされた命令の数のような他の同時性メトリックも同様に決定することができる。
最終的に、命令Iが特定のパイプライン段にある間の特定の実行ユニット240の平均的な利用のような更に詳細な情報も抽出又は収集することができる。
【0082】
単一プロセッササイクル中にパイプライン段により処理される
命令の瞬時平均数の決定
図10に示すように、異なる形式の多路サンプリングを使用して、固定サイズのプロセッササイクル数にわたりパイプラインにより処理される命令の平均数を決定することができる。図10は、例えば、リタイアされる命令の瞬時平均数を決定するための回路を示す。プロセッササイクル中に、パイプライン220のいずれの段1001についても、同様の回路を使用して、フェッチ、マップ、イッシュー又は実行される命令の平均数を決定することができる。
装置1000において、先入れ先出し(FIFO)待ち行列1010及びN容量の加算器1020の各々は、単一のプロセッササイクル中にパイプラインの特定の段1001により処理される命令の数(カウント1002)を受け取り、例えば、フェッチ、マップ、イッシュー又は実行される命令の数を受け取る。FIFO待ち行列1010におけるエントリの数(P)1022は、平均値が決定されるところのサイクルの数を決定する。Pは、ハードウェアで設定されてもよいし、ソフトウェアで設定されてもよい。値Pは、平均値が決定されるところのサイクルのウインドウを制御する。
加算器1010はスケール型カウントレジスタ1040に接続され、従って、このレジスタ1040は、N個のサイクル中にリタイアした命令の全数を累積することができる。FIFO待ち行列1020及びレジスタ1040は、ライン1021及び1041を経て初期化することができる。減算器1030は、それまでのN−1サイクルにリタイアした命令の数をレジスタ1040から減算し、例えば、FIFO待ち行列1010のヘッドエントリに記憶されたカウントを減算する。レジスタ1040の出力は追跡されたサイクルの数(P)で除算され(1050)、段1001で処理された実際の命令の動特性即ち瞬時平均数1060を形成する。瞬時平均値は、プロファイルレジスタ300に捕獲されるか、或いはソフトウェアで読み取り可能なプロセッサレジスタ又はメモリ位置に記憶される。
【0083】
サンプルされた命令がリタイアした命令であるときには、コンピュータにより行われた実際の「真」の有効作業を計算することができる。これは、相対的なプロセッサ性能を指示するためにしばしば引用される「生」の命令フェッチレートよりも良好な指示である。例えば、特定のアーキテクチャーは、大きなフェッチレートをもつことができるが、パイプラインにおけるストールが性能を低下することがある。
【0084】
命令のクラスター化
又、サンプルされた状態情報を使用し、同時性情報を収集しながら当該ケースを識別することもできる。例えば、命令Iがキャッシュの1つにおいて「ヒット」するときに平均同時性レベルを計算し、次いで、平均同時性レベルを、命令Iがキャッシュミスを招く場合と比較することが有用である。変化する同時性レベルと相関するために検討すべき他の当該特徴は、レジスタ依存性ストール、キャッシュミスストール、分岐予想ミスストール、及び最近の分岐経過を含む。
一般に、N個ごとのサンプリングは、W個の命令のウインドウにわたりF(I1、I2)と表すことのできるファンクションの値をサンプリングすることにより種々の異なるメトリックを統計学的に計算できるようにする著しい融通性を与える。対応する公知のハードウェアメカニズムとは対照的に、ここに与えられる融通性は、N個ごとのサンプリングを、複雑なプロセッサに関する同時性情報を捕獲するための非常に優れた選択肢にする。これは、新規なメトリック及び分析技術の設計を可能にするためである。
標準的なSPECベンチマークソフトウェアを実行するプロセッサでの実験では、統計学的に収集されたサンプルをベースとするメトリックは、低いオーバーヘッドの完全な情報で得られた値に収斂することが示されている。
【0085】
経路プロファイル
命令のクラスターをプロファイリングする付加的な効果は、経路プロファイルが得られることである。経路プロファイルは、多数のコンパイラー最適化及びトレーススケジューリングに有用である。
更に、最近の分岐実行経過と共にプログラムの実行経路に沿った多数のポイントを制限することにより、経路プロファイルが明確化される。この明確化は、N個ごとのサンプリングとで改善され、即ちNが増加するにつれて、明確化が改善される。著しく実行されるコードの場合には、同時プログラムが、全ての実行命令に対しパイプライン200の各段において命令の相対的な実行順序を示すことができる。従って、ここでは、オペレーティングシステムにおける実行パイプライン200の実際のオペレーションを統計学的に再構成することができる。
【0086】
ランダムにサンプルされるプロファイル情報の他のアプリケーション
マイクロプロセッサの最新の世代は、考えられる最高の性能を与えるためにコンピュータアーキテクチャーが許す全ての策略を利用する。これらのマイクロプロセッサは、サイクル当たり多数の命令をフェッチし、イッシューしそしてコミットする。更に、これらのプロセッサは、命令を順序ずれして実行する。それらのあるものは、メモリオペレーションも順序ずれして実行する。
不都合なことに、プロセッサにより使用される多数の発見的メカニズムが命令及びメモリオペレーションを順序ずれしてイッシューするので、性能特性がかなり変化し得る。1つの効果として、ここに述べるプロファイリング技術は、システム100の性能を自動的に改善できるように、システムがプログラムの性能を充分詳細に測定できるようにすることである。
【0087】
最適化
又、本発明のプロファイリング技術は、システム100の最適化を実行するのにも使用できる。以下の説明は、プログラマー及びコンパイラーで指令されるソフトウェアプログラムの最適化を手引きするよう意図されたものである。
【0088】
ハードウェアの最適化
アウトオブオーダーのスーパースカラーマイクロプロセッサは、データ及びリソースの利用状態に基づいて命令をスケジューリングし直すので、コンパイル−時間命令スケジューリングは、構造的に簡単なプロセッサの場合よりも重要性がかなり低い。ここでは、主なボトルネックは、命令フェッチ及びメモリオペレーションによるものである。
より詳細には、分岐又はジャンプ予想ミス、オンチップキャッシュミス、及びTLB欠陥によりプロセッサパイプライン200においてサイクルが失われる。これらは、静的に推測することが不可能でないまでも困難な状態である。又、高レベルオフチップオペレーションにおける遅延に対しても、キャッシュミス、リソーストラップ及び順序づけトラップのために、サイクルが失われる。失われたサイクルは、時間を浪費する。
従来の事象カウンタでは、これらの性能低下事象の合計数を測定することはできるが、失われたサイクルをプログラムの特定の命令に起因させることは不可能ではないまでも非常に困難である。ここに述べるプロファイリング技術は、ユーザが主な性能問題を測定して、それら問題を特定の命令に相関させることができるようにする。
【0089】
フロントエンド最適化
性能の助けとなる1つのフロントエンド最適化は、基本的ブロックにおいて命令をそして手順において基本的ブロックを順序付けし直すことである。基本的ブロックとは、1つの単位として直線的に実行されるか又は全く実行されない命令のセットとして定義される。手順とは、一般に、コール命令を経て到達する基本的ブロックの凝集セットである。手順は、多数の基本的ブロックを含むことができる。基本的ブロックにおいて命令をそして手順において基本的ブロックを順序付けし直すことは、ページ及びキャッシュの一時的な位置を最適化すると共に、分岐の数を減少するように実行流及びデータアクセスを変更できるようにする。分岐は、実行流しか再指令せずそしてデータにおいて有効に作用しないので、サイクルを浪費する。この最適化は、入力として、制御流グラフエッジ周波数を知る必要がある。
【0090】
トレースの形成
同様に、命令のスケジューリングを追跡するために、コンパイラーは、制御流グラフのエッジ又は経路周波数を必要とする。トレーススケジューラは、各基本的ブロック又はより大きな実行経路を実行するのにどれほどの時間を要するかの推定値を有するときは非常の良好なジョブを行うことができる。アルタ・ビスタサーチエンジンのような大規模な動作システムの場合には、これを従来のツールでリアルタイムに測定することが困難である。
【0091】
ホット/コールド最適化及び経路情報
トレーススケジューリング及びホット/コールド最適化のような多数のコンパイラー最適化は、プログラムによりどの実行経路が頻繁にとられるかを知ることに依存している。これらは「ホット」経路と称する。最近まで、計装又は模擬のいずれかによりプログラムをプロファイリングすることにより、頻繁に実行される経路が推測されて、基本的なブロック又はエッジカウントが収集され、そしてこれらのカウントを用いて、ホット及びコールド経路が間接的に推測される。
最近、経路情報を直接収集するための技術が使用されている。これらの技術は正確な経路情報を与えるが、非常に高いオーバーヘッドをもつ傾向があり、アクティブな大規模コンピュータシステムを測定するには不適当である。本発明のプロファイリングでは、経路情報を最小のオーバーヘッドでランダムに捕獲することができ、そして実際の実行流の統計学的に正しい概観を依然として表すことができる。
【0092】
分岐経過レジスタ
ほとんどの近代的なマイクロプロセッサは、グローバルな分岐経過レジスタにおいて最後のN個の分岐の方向を追跡する。分岐経過レジスタは、移動ウインドウとして、最近の分岐予想を観察し、そしてそれに応じて将来の命令フェッチに作用を及ぼすことができる。命令のPCがサンプリングされると共に、このレジスタの内容を命令フェッチ時間に捕獲することにより、時には、制御流グラフの静的な分析を使用して、プロセッサがとらねばならない最後のN個の分岐により厳密な経路を仮定することができる。
しかしながら、従来の経過レジスタは、通常、分岐の方向しか含まず、実際のターゲット行先を含まないので、情報が不正確なものとなる。特に、制御流の合流は、実際にとられた経路を識別する上であいまいさを招く。
又、分岐コードの実行を生じさせる非同期事象、例えば、割り込み又はコンテクストスイッチは、分岐経過ビットを汚染することがある。しかしながら、これらの事象は、比較的稀であり、そしてオペレーティングシステムにおけるそれらの発生は、コードにわたってランダムに分布されねばならない。頻度の高い経路を識別するのが目的であるから、予想不能な非同期事象により発生される「ノイズ性」の分岐経過ビットにより生じるものを含む頻度の低い経路を無視することができる。
図11に示す命令シーケンスについて考える。PCアドレスA−E(1101−1105)に命令がある。アドレスA及びCにおける命令1101及び1103は、分岐型の命令である。EのPCをもつ命令1105があって、グローバルな分岐経過における最後のビットが1である場合には、CDEで終わるいかなる経路も除外することができる。というのは、このような経路の最後の分岐が失敗に終わり、それ故、グローバルな分岐経過に対応しないからである。しかしながら、ポイントEにおける異なる制御経路の合体により、実行された真の経路がAE(1110)又はABCE(1111)であったときを決定することができない。
【0093】
制御流グラフの合流によるあいまいさ
図12は、サンプリングされたPC値を入力として使用して、プログラム流の静的な分析を実行することのできるプロセス1200を示す。選択された命令の経路サンプルがステップ1210において上記のように捕獲される。マシンへの影響を最小にするために、サンプリングされた命令はランダムに選択されるのが好ましい。各「経路」サンプル1220は、サンプリングされた第1命令I1のPC1と、命令I1までの最後のN個の条件付き分岐によりとられる方向(BRANCH HIST)とを含む。
【0094】
任意であるが、サンプリングされた情報は、第1命令の直前に実行される第2命令(I2)のPC2で増強することもできるし、或いは最後のM個の分岐のPC値に適用されるあるファンクション、例えば、ある数の下位ビット又はハッシュ関数を用いて決定されたビットを選択するファンクションに基づいて選択された情報で増強することもできる。
ステップ1240において、経路サンプルを使用して、プログラムの制御流グラフの逆方向分析を実行する。この分析は、サンプリングされたデータに一致する実行経路を識別することができ(1250)、そしてこの情報を収集して、最適化から更に効果が得られる頻繁に実行される経路を識別することができる(1260)。
【0095】
例えば、図11を参照すれば、命令Eにおいて、1の分岐経過長さが与えられると、経過ビット「1」により、ソフトウェアツールは、経路セグメントAE1110及びABCE(1101−1105)を考えられる経路として識別することができる。分岐経過ビットの値が与えられたときに、静的な分析が、可能性として、単一経路セグメントしか識別できないときに、考えられる最良の成果が得られる。
又、プロセスの最近の実行経過に関する他の情報も、特定の命令に到達するためにとられた実行経路を識別する上で助けとなる。有効な情報の1つの断片は、最近実行された命令の第2のPC値の知識である。おそらくN個ごとのサンプリングと共に多数のPC値を使用することにより、1つのPCしか含まない経路を除外することができる。
【0096】
所与のクラスの最後のM個の命令のサンプリング
図13に示す別の技術においては、ハードウェアは、パイプラインの任意の選択された段、例えばリタイアユニットで処理された最後のM個の命令の各々から少数のビット(B)を捕獲することができる。Bビット1303は、PCの下位のBビットでもよいし、或いはBビットは、PC1304に適用されるハードウェア実施ファンクションF1310を使用して選択することもでき、即ちB←F(PC)である。ファンクション1310がハッシュ関数である場合には、分岐アドレスの非均一な分布が回避される。
命令のクラスは、例えば、条件分岐、コール、リターン、アクセス(ロード又は記憶)命令、間接的分岐、及び間接的コール1321−1326として識別することができる。クラスは、比較器又はマルチプレクサのような選択メカニズム1320によりライン1321を経て選択することができる。又、クラスは、パイプラインの段、例えば、フェッチ、マップ又はリタイア等により識別することもできる。クラスID1319は、ソフトウェアにより制御される。
【0097】
選択されたビットは、MxBビット巾のシフトレジスタ1300に記憶することができる。このレジスタは、ソフトウェアの内部レジスタとして或いはメモリ位置として図5のPSW520へアクセスすることができる。識別されたクラスの命令1321−3124が処理されるときには、シフトレジスタ1300は、その上位のBビット1302を破棄するようにシフトされる。命令のPC1304の選択されたBビット1303は、空きビット1305へとシフトされる。従って、レジスタ1300は、これら形式の命令に対し指紋即ち「経路符号」として働く。レジスタ1300は、例えば、実行された最新のM個の分岐を制限する助けをする。というのは、現在経路符号に一致しない経路は、考慮対象から排除できるからである。分岐命令1321に対し、図2の分岐実行指示287を使用して、サンプリングをトリガーすることができる。
【0098】
経路符号により得られる精度の改善は、相当のものとなり、例えば、B=4、M=6のように、最後の6個の分岐から4つのビットを節約するだけでも、標準的なSpecInt95ベンチマークプログラムに対する実行経路を決定する精度が2倍になる。
経路符号及びグローバルな分岐経過を使用すると、トレースを次のように分析することができる。
トレースにおいて実行される各命令に対し、次のいずれかに達するまで経路セグメントを決定するように逆方向に進行する。
a)グローバルな分岐経過ビットが尽きる、又は
b)命令を含むルーチンの開始点に到達する。
【0099】
制御流グラフの逆方向進行中に手順のコール命令に遭遇したときには、コールされた手順を通して逆方向に進行し、そして最終的に、そのコールされた全ルーチンを通して逆方向に作用するに充分な分岐経過があるときに、コール側手順に復帰する。従って、実行流のより正確な概観が与えられる。
【0100】
キャッシュ及びTLBヒットレートの増強
キャッシュ又は変換ルックアサイドバッファ(TLB)における高いミスレートは、システムの性能を著しく低下する。公知の解決策は、一般に、キャッシュミスアドレスを収集する特殊なハードウェア又は特殊なソフトウェア機構、例えば、TLBを周期的にフラッシュするものに依存している。観察されたミスパターンは、頻繁にアクセスされるページ即ち「ホット」ページのおおよその理解を与え、これは、仮想/物理ページマッピングポリシーに影響するように使用することができる。しかしながら、完全な分析を行うのに必要なアドレス情報は、事象が検出されるときまでに得られない。
図14は、より正確な仮想/物理ページマッピングを実行するのに使用できるプロセス1400を示す。ステップ1410では、マッピングされるべきコードがシステムにおいて実行される。ステップ1420では、メモリをアクセスするオペレーション(ロード及び記憶)がサンプリングのために選択される。オーバーヘッドを最小にするためにサンプリングはランダムであるのが好ましい。
命令が実行される間に、有効な仮想メモリアドレスが、ステップ1430において、キャッシュ及びTLBミスと共に識別され、従って、1つの効果として、事象及びアドレスを特定の命令に直接的に起因させることができる。同様に、ステップ1440において、高いアクセスレートで隣接ページを識別することができる。ステップ1450では、キャッシュ及びTLBにおけるアクセス競合を減少するために、仮想/物理ページマッピングを調整することができる。ステップ1460では、隣接ページを大きな「スーパーページ」へと合成し、ページングオーバーヘッドを減少することができる。
【0101】
キャッシュ又はTLBにおいて捕獲され損なったメモリ参照の仮想アドレスは特定の命令に直接的に起因させて、ページマッピングポリシーを誘導するに必要な情報の形式を厳密に与えることができる。アプリケーションのメモリ参照流に関する情報を使用して、オペレーティングシステムの仮想/物理マッピングポリシーを動的に制御すると、大きな直接マップ式キャッシュにおける競合ミスを首尾良く回避し、スーパーページの形成によるTLBミスレートを低減し、そしてページの複写及び移動による非均一メモリアクセス時間(NUMA)マルチプロセッサにおける遠隔メモリ参照の数を減少することができる。
【0102】
改良された命令スケジューリング
コード最適化の間に行われる1つの重要なタスクは、理想的な命令スケジューリングである。理想的な命令スケジューリングは、メモリ待ち時間による遅延を最小にするようにコードを順序付けし直す。基本的なブロックにおける隣接命令の静的な順序付けは、前世代のインオーダー型RISCプロセッサの場合よりも重要性が低いが、巨視的な命令スケジューリングは、アウトオブオーダー型プロセッサにおいて非常に重要である。
命令スケジューリングについての1つの非常に困難なものは、ロード及び記憶のスケジューリングである。これは、静的なスケジューラが、メモリアクセス命令を最適にスケジュールできるようにする厳密な依存性情報を常に有していないからである。加えて、メモリアクセス命令の待ち時間を厳密に予想することが困難である。命令スケジューラは、通常、メモリアクセスに関する正確な情報が不充分であるから、一般に、Dキャッシュヒットを仮定してロード及び記憶をスケジュールする。或いは又、バランス型スケジューリングは、ロード当たり等しい量の待ち時間を含むスケジュールを発生するよう試みる。これは、ロード/記憶オペレーションがキャッシュにおいて常にヒットすると常時仮定することに勝る改良である。
【0103】
マルチスレッド型プロセッサにおけるスレッドのスケジューリング
マルチスレッド型プロセッサにおいては、上記プロファイリング方法を用いて得たスレッドのリソース利用に関する情報を使用して、全体的なリソース利用度及びスループットを最大にするようにスレッドをスケジューリングすることができる。
2つのスレッドがリソースの相補的な使い方を有し、例えば、一方のスレッドが主として整数演算ユニットを使用するが、他方のユニットは主として浮動小数点演算ユニットを使用する場合には、2つのスレッドが異なる機能的実行ユニットを使用するので、2つのスレッドを同時に動作するようにスケジューリングすることができる。同様に、2つのスレッドが競合するリソース使用を有し、例えば、両スレッドが浮動小数点演算ユニットを頻繁に使用する場合には、それらを異なる時間に動作するようにスケジューリングすることができる。
【0104】
図14bは、プロセッサの利用度によりスレッドをスケジューリングするためのプロセスを示す。オペレーティングシステムにおいて実行されるスレッドのリソース利用度がステップ1470において測定される。ステップ1475では、リソースの利用度が収集され、そしてそのリソース利用度に基づいてスレッドがセットへと分類される。本発明のサンプリングでは、各スレッドが、プロセッサにおける各クラスのリソース、例えば、整数演算ユニット、浮動小数点演算ユニット、メモリユニット、分岐ユニット、イッシューユニット等々をいかに使用するかを決定することができる。
ステップ1480では、スレッドのリソース利用度を比較して、非競合実行スケジュールを決定する。所与のクラスのリソースに対する1組のスレッドの合成利用度により、そのクラスのリソースが完全利用状態より著しく多く利用されている場合には、その組のスレッドを一緒にスケジューリングしてはならず(ステップ1490)、逆に、合成利用度により、そのクラスのリソースが完全利用状態以下で利用されるか或いは完全利用状態より若干多めに利用される場合には、それらを一緒にスケジューリングするのが有益である(ステップ1485)。
【0105】
図15は、命令のスケジューリングを実行するのに使用できるプロセス1500を示す。マシンコード1510は、図1のシステム100で実行される。コードが実行される間に、メモリオペレーション命令の待ち時間がステップ1520において上記のように測定される。多数の命令、例えば、命令対に対する測定値をステップ1530においてサンプリングすることができる。サンプリングは、オーバーヘッドを減少するためにランダムに行うことができる。同じPCをもつ命令に対してサンプリングされたデータは、ステップ1540において収集されて、例えば、待ち時間のヒストグラム(HIST)1541が形成される。ステップ1560では、マシンコードが順序付けし直される。この再順序付けは、収集されたヒストグラム情報1541に基づく。例えば、長い待ち時間をもつメモリオペレーションは、それらに依存するオペレーションからできるだけ離れるように進められる。ステップ1560は、リストスケジューリング或いはトレーススケジューリングのようなスケジューリングアルゴリズムを使用することができる。
ランダムサンプリングによりロード及び記憶待ち時間を収集する場合には、各命令を待ち時間のヒストグラムに基づいてスケジューリングすることができる。本発明の技術は、全キャッシュシュミレーションの経費を被ることなく待ち時間情報を収集することにより最適化を導出するように使用できる。
【0106】
プリフェッチ命令の挿入
図16は、測定された待ち時間に基づいてプリフェッチ命令を挿入するためのプロセスを示す。プリフェッチ命令の挿入は、メモリから返送されるべきデータを待機することにより生じるプロセッサストールを隠す上で助けとなる技術である。データが実際に必要とされる充分前にメモリシステムに要求を発生し、そして時々はデータが必要になると決定される直前にデータを要求することにより、コンパイラー及びオプチマイザーは、メモリからデータをフェッチするための待ち時間のほとんど又は全部をしばしば隠すことができる。
しかしながら、性能を実際に改善するためには、著しい待ち時間を実際に経験するメモリオペレーションに対してのみプリフェッチ命令を挿入することが望ましく、即ち長い待ち時間を実際に被らないメモリオペレーションにプリフェッチ命令を挿入すると、付加的なプリフェッチ命令を実行しなければならないためにプログラムが実際上低速化されてしまう。メモリオペレーション、特に、プリフェッチから利益を得るロードオペレーションを識別するために、プログラム内の種々のメモリオペレーションにより経験する平均待ち時間に関する統計学的データを収集することが所望される。
その一般的な構成が図16に示されている。ステップ1610では、プログラム内のメモリオペレーションに対するメモリオペレーション待ち時間が測定される。ステップ1620では、同じプログラムカウンタ(PC)値をもつ命令に対しサンプリングされたメモリオペレーション情報が収集される。ステップ1630では、プリフェッチを挿入すべき大きなメモリ待ち時間をもつメモリオペレーションのサブセットが識別される。
【0107】
ステップ1640では、実行頻度情報及び測定された待ち時間情報に基づき、これらのメモリオペレーションに対してプリフェッチ命令を挿入するのに有益な位置が識別される。ステップ1650では、その適当な位置にプリフェッチ命令が挿入される。
待ち時間は、上記のように測定することができる。1つの方法は、サンプリングハードウェアでメモリオペレーションの待ち時間を直接測定することである。別の方法は、ロード命令が対の第1サンプルでありそしてロードからのデータの使用が対の第2サンプルであるである場合に、対構成でサンプリングを行いそして対を探索することによるものである。2つのサンプルにおいて待ち時間情報を探し、そして特に2つのサンプルのイッシュー時間の差を探すことにより、ロードオペレーションに対するメモリシステム待ち時間を推定することができる。
【0108】
以上、特定の実施形態について詳細に説明した。当業者であれば、上記実施形態を変更しても、幾つかの又は全ての効果が達成されることが明らかであろう。それ故、本発明の精神及び範囲内に包含されるこのような修正や変更は全て請求の範囲内に含まれるものとする。
【図面の簡単な説明】
【図1】命令駆動状態サンプリングを伴うコンピュータシステムのブロック図である。
【図2a】サンプリングされた命令を処理するためのマイクロプロセッサ実行パイプラインのブロック図である。
【図2b】サンプリングすることのできる状態情報を示すパイプラインのブロック図である。
【図3】プロファイル情報を記憶するためのレジスタファイルのブロック図である。
【図4】増強された命令のブロック図である。
【図5】選択された命令をプロファイリングするための流れ線図である。
【図6】パイプライン待ち時間を測定するための回路を示す回路図である。
【図7】プロセスの流れ線図である。
【図7a】命令をサンプリングするプロセスの流れ線図である。
【図7b】プロセッサパイプラインにより処理される命令の特性の統計値を推定するためのプロセスを示す流れ線図である。
【図8a】命令の同時実行を示す図である。
【図8b】命令の同時実行を示す図である。
【図8c】命令の同時実行を示す図である。
【図9】費やされる発生スロットを決定するプロセスを示す流れ線図である。
【図10】プロセッササイクル中に処理される命令の平均数を決定するための装置のブロック図である。
【図11】命令シーケンスの制御の流れを示すグラフである。
【図12】制御流を識別するプロセスのデータの流れを示す図である。
【図13】分岐経過を収集する装置のブロック図である。
【図14a】ページマッピングプロセスの流れ線図である。
【図14b】スレッドスケジューリングプロセスの流れ線図である。
【図15】メモリ待ち時間の影響を受ける命令スケジューラの流れ線図である。
【図16】プリフェッチ命令を挿入するためのプロセッサ1600の流れ線図である。
【符号の説明】
100 コンピュータシステム
110 プロセッサ
111 パイプライン
112 データキャッシュ(Dキャッシュ)
113 命令キャッシュ(Iキャッシュ)
119 プロセッサ状態をサンプリングするハードウェア
120 オフチップメモリ
121 汎用キャッシュ
122 揮発性メモリ
123 永続的メモリ
130 入力/出力インターフェイス(I/O)
140 バスライン
200 実行パイプライン
205 変換ルックアサイドバッファ(TLB)
210 フェッチユニット
220 マップユニット
230 イッシューユニット
240 実行ユニット
250 リタイアユニット[0001]
BACKGROUND OF THE INVENTION
The present invention relates generally to measuring the performance of a computer system, and more particularly to sampling a large number of concurrent instructions.
[0002]
[Prior art]
Computer processors are getting faster and faster, but the performance of software applications is not keeping pace. For large commercial applications, the average processor cycle (CPI) value per instruction is as high as 2.5-3. In a 4-way instruction issue processor, a CPI of 3 means that only one issue slot is successfully used for every twelve. It is important to understand why software throughput does not keep pace with hardware improvements.
It is common to pass such problems to memory latency, and in fact, many software applications spend many cycles waiting for the data transfer to complete. However, other problems such as branch mispredictions also waste processor cycles. Independent of common causes, system architecture and hardware and software engineers are able to determine which instructions are stalled and why to improve the performance of modern computer systems incorporating complex processors. Need to know.
[0003]
This is usually done by generating a “profile” of the behavior while the system is running. A profile is a record of performance data. Often, profiles are generated graphically so that performance bottlenecks can be easily identified.
Profile formation can be performed by instrumentation and simulation. In instrumentation, additional code is added to the program to monitor for specific events during program execution. Simulation does not run the program on an actual system, but attempts to emulate the behavior of the entire program in an artificial environment.
Each of these two methods has drawbacks. Instrumentation disturbs the true behavior of the program due to additional instructions and extra data references. Simulating avoids disturbances at the expense of substantial performance overhead compared to running a program in an actual system. Moreover, in instrumentation or simulation, it is usually difficult to profile an entire large software system, i.e., applications, operating system and device driver code.
[0004]
Hardware-implemented event sampling can also be used to provide processor profile information. Hardware sampling has a number of advantages over simulation and instrumentation, i.e. no software programs need to be modified to measure performance. Sampling affects the entire system with relatively low overhead. Indeed, recently, profiling based on low overhead sampling can be used to collect detailed instruction level information about pipeline installations and their causes. However, many hardware sampling techniques are inflexible because they are designed to measure specific events.
Digital Alpha AXP 21164, Intel Pentium Pro and MIPS 10000 have event counters that can count various events such as data cache (D-cache) misses, instruction cache (I-cache) misses and branch prediction misses. Form. These event counters generate an interrupt when the counter overflows, so the counter performance data can be sampled with high level software.
[0005]
Event counters are useful for capturing aggregate information such as the number of branch mispredictions that the system has incurred while executing a particular program or portion thereof. However, known event counters are less useful in that state information is attributed to individual instructions as if branch instructions frequently cause mispredictions. This is because when the event counter overflows and causes an interrupt, the program counter (PC) of the instruction that caused the event is no longer available.
It is particularly problematic to guess the dynamic operation of a processor that can issue instructions out-of-order. In fact, the behavior of a software program executed on an out-of-order processor is extremely incomprehensible and difficult to understand. As a specific example, consider the flow of instructions in an out-of-order Alpha 21264 processor.
[0006]
Super scalar processor architecture
Execution order
Out-of-order processors fetch and retire instructions in the correct order, but process the instructions based on their data dependencies. Instruction processing includes register mapping, instruction generation and execution. An instruction can be said to be “in flight” from the time it is fetched until it retires or aborts.
During each processor cycle, the first stage of the processor pipeline fetches a set of instructions from the instruction cache (I cache). The set of instructions is decoded. The instruction decoder identifies which instructions in the fetched set are part of the instruction stream.
[0007]
Since analyzing the PC of the next instruction to fetch requires many cycles, the PC is usually predicted in advance by a branch or jump predictor. When mispredicted, the processor aborts the mispredicted instruction that occupies the “bad” execution path and restarts fetching instructions on the “good” path.
To allow instructions to be executed out of order, the registers specified in the instruction operands are dynamically renamed to prevent "write after read" and "write after write" conflicts. It is. This renaming is accomplished by mapping architecture or “virtual” registers to physical registers. Thus, two instructions that write to the same virtual register can be safely executed out of order because they write to different physical registers and the virtual register consumer gets the appropriate value.
[0008]
Register-mapped instructions exist in the issue queue until their operands are computed and a suitable type of functional “execution” unit is obtained. The physical register used by the instruction is read in the cycle in which the instruction is issued. Instructions are marked as ready for retirement after they have been executed and by the processor when all previous retire ready instructions in the program order have retired, i.e. when the instruction retires in the correct program order. Retired. Upon retirement, the processor commits the changes made by the instruction to the system architecture “state” and releases the resources consumed by the instruction.
[0009]
Misprediction
In some cases where a branch is predicted incorrectly, the instruction must be trapped or discarded. When this happens, the current speculative structural state is returned to the execution point where the misprediction occurred, and fetching continues at the correct instruction.
[0010]
delay
Many events delay the execution of instructions. At the front of the pipeline, the fetch unit may stall due to an I-cache miss, or the fetch unit may fetch instructions along a bad path due to an expected miss. The mapping means may stall due to a lack of free physical registers or a lack of empty slots in the issue queue. The issue queue instructions wait for their register dependencies to be satisfied or for the functional execution unit to become available.
Instructions may stall due to data cache misses. Instructions may be speculatively generated as they go down the bad path, or may be wrapped because the processor has interrupted. Many of these events are difficult to predict statically, for example by code inspection, and they all reduce system performance. A simple event counter is not sufficient to capture this type of state information. In addition, it is difficult to precisely measure the length of the delay to determine which delay is particularly noteworthy.
[0011]
Events can be implemented so that programmers or optimization tools can improve the performance of software and hardware elements in complex computer systems such as superscalar and out-of-order processors, or processors of any architectural design in this regard. It is highly desirable to attach directly to specific instructions and machine states.
[0012]
[Problems to be solved by the invention]
Problems with known event counters
The main problem with the known event counter is that the instruction that caused the event that caused the counter to overflow is usually fetched well before the exceptional PC, i.e. this PC caused an overflow. It is not the one of the command that was made. The length of the delay between fetch and interrupt is generally an unpredictable amount. This unpredictable event distribution makes it difficult to properly attribute an event to a particular command. Out-of-order and predictive execution amplifies this problem, but it also exists in in-order machines such as the Alpha 21164 processor.
For example, compare the program counter value provided to the performance counter interrupt handler while monitoring the D-cache reference event count for an Alpha 21164 (in-order) processor versus a pentium pro (out-of-order) processor. An exemplary program consists of a loop that includes a random memory access instruction, eg, a load instruction, followed by a handler for a null operation instruction (nop).
[0013]
In an in-order Alpha processor, all performance counter events (eg, cache misses) are attributed to instructions executed 6 cycles after the event, resulting in a large sample peak in the 7th instruction after load access. This skewed event distribution is not ideal. However, because of the single large peak, static analysis can sometimes act backward from this peak and identify the actual instruction that caused the event, which is very There is nothing more than the best guess for a simple program.
In the case of the same program running in an out-of-order pentium pro, the event samples are widely distributed over the next 25 instructions, not only showing skew but also showing significant blurring. The wide distribution of samples makes it almost impossible to attribute a specific event to the specific command that caused the event. Similar behavior occurs when counting other hardware events.
[0014]
In addition to event sample distribution with skew or blur, conventional event counters suffer from additional problems. There are usually more events of interest than event counters, and it is difficult if not impossible to monitor all of these events simultaneously. This problem is exacerbated as processor complexity increases.
In addition, the event counter only records the fact that an event has occurred and does not provide additional state information about the event. For many types of events, additional information such as latency to service cache miss events is extremely useful.
Furthermore, known counters generally cannot assign events to “blind spots” in the code. Blind spots are non-interruptible codes such as high priority system routines and PAL codes because events are not acknowledged until interrupt rights are granted. By that time, the state of the processor has changed significantly, possibly giving false information.
[0015]
Stall vs bottleneck
In a pipelined in-order processor, if an instruction stalls in a pipeline stage, subsequent instructions are prevented from passing through that pipeline stage. Therefore, in-order processors are relatively easy to identify “bottleneck” instructions, ie, bottleneck instructions tend to stall somewhere in the pipeline. For in-order processors, by measuring the latency of an instruction as it passes through each pipeline stage, and comparing the measured latency to the ideal latency of that instruction in each pipeline stage , Can identify a stall. An instruction can be assumed to have stalled in a stage when it requires more time than the minimum latency to pass through that stage.
[0016]
However, in an out-of-order processor, an instruction stalled in a certain pipeline stage may cause another instruction to pass through that pipeline stage. In fact, the additional latency of stalled instructions is completely masked by the processing of other instructions, and indeed stalled instructions may not delay observed program completion.
Even in an in-order system, a stall in one pipeline stage does not affect the overall execution time of the program when another pipeline stage is a bottleneck. For example, during execution of memory intensive programs, instruction pipeline fetch and map means often stall due to "back pressure" from execution units delayed by D-cache misses.
[0017]
Ideally, memory operations that cause cache misses are classified as primary bottlenecks. The stall of the fetch means and map means is actually an indication of a delay due to a cache miss, i.e. a secondary bottleneck.
It is desirable to identify instructions whose stalls are not masked by other instructions and identify them as true bottlenecks. Furthermore, in order to improve program behavior, it is necessary to focus on casual (primary) bottlenecks rather than non-symptomatic (secondary) bottlenecks. This classification of pipeline stage bottlenecks as casual and asymptomatic requires detailed knowledge of the state of the pipeline and the data and resource dependencies of in-flight instructions, which are well known. As can be seen, it cannot be derived from a simple event counter.
[0018]
U.S. Pat. No. 5,151,981 entitled “Instruction Sampling Instrumentation” by Wescott et al., Dated September 29, 1992, is hardware that performs instruction-based sampling in an out-of-order execution machine. A mechanism is proposed. Wescott et al.'S solution has a number of drawbacks. First, this solution may bias the instruction sample flow based on the length of the sampled code and the sampling rate. Secondly, the system samples only retired instructions, rather than sampling all fetched instructions, some of them are aborted. Third, the information collected by Wescott et al. Mechanisms, for example, concentrate on individual event attributes such as cache misses, but do not provide useful information to determine the relationship between instructions. .
[0019]
Recently, a hardware mechanism called "informing loads" has been proposed. See “Informed Memory Operations: Modern Processors” by Holloyts et al., Pages 260-270, Proceedings 23rd Annual International Symposium on Computer Architecture, May 22, 1996. See Informed memory operations: Providing memory performance feedback in modern processors. In this case, following the memory operation, the conditional branch operation can be performed only when and when the memory operation misses in the cache. Although not specifically designed for profiling, this mechanism can be used specifically to collect only D-cache miss event information.
[0020]
In other specialized hardware, referred to as cache miss lookaside (CML) buffers, virtual memory pages that suffer from
A processor such as Intel Pentium can read the contents of the branch target buffer (BTB) of the branch predictor in software. By reading BTB periodically with software, Conte et al. Developed a very low overhead technique for estimating the limit execution frequency of a program. This is described in "Procedure of the 27th Annual International Symposium on Microarchitecture of November 30, 1994, on page 12-21," Branch Handling to Support Profile Driven Optimization. Refer to “Using branch handling hardware to support profile-driven optimization”.
[0021]
This solution forms information similar to that obtained by tracking the branch direction information contained in the “profile record” that stores the relevant sampling information. Recently, Conte et al. Proposed an additional piece of hardware called a profile buffer that counts the number of times a branch is executed and not executed. This is described in “Procedures of the 29th Annual International Symposium on Microarchitecture on December 2, 1996, pages 36-45,“ Accurate and Practical Profiles Using Profile Buffers ” See "Accurate and practical profile-driven compilation using the profile buffer".
[0022]
[Means for Solving the Problems]
In accordance with the present invention, there is provided an apparatus and method for measuring the operation of a processor that is different from conventional mechanisms. Rather than counting events and sampling the program counter when the event counter overflows, the apparatus and method of the present invention randomly selects an instruction and provides detailed status information for the selected instruction. Depends on sampling.
Periodically, during the operation of the processor, the instructions to be profiled are randomly selected, and a profile record of what happened during the execution of the instructions is accumulated in a set of processor internal profile registers. An interrupt is generated after processing of the selected instruction is complete, for example after the instruction retires, aborts or traps. Record information that characterizes the details of how instructions were processed in the pipeline can be sampled by software from the internal profile register.
[0023]
The profile register can record a number of useful facts regarding instruction execution. The performance information includes, for example, the number of cycles that the selected instruction has spent in each stage of the execution pipeline, i.e. the latency of the stage, whether the instruction has undergone an I-cache or D-cache miss, the effective address or branch of the memory operand / Jump target, and whether the instruction was retired or aborted.
In an orderly executing (in-order) processor, the total number of stall cycles due to each instruction can be estimated given the fetch-retire latency of the sampled instruction. This is sufficient to identify a bottleneck because one stalled instruction does not overlap with another stalled instruction.
[0024]
In processors that run out of order (out-of-order), most stalls probably overlap and are masked by other instructions that are generated out of order around the stalled instruction. This makes it difficult to identify stalled instructions. Furthermore, identifying bottlenecks requires collecting information about the average level of concurrency while each instruction is executed.
Special purpose hardware can count and record the number of instructions that occur while the profiled instructions are executed to measure the level of concurrency. However, this does not take into account instructions that occur but are aborted and therefore do not retire. A useful measure of simultaneity is then given. Useful simultaneity is the average number of instructions that occur in parallel and successfully retire with a given instruction. Instructions that occur but are subsequently aborted are not useful. Thus, instructions that are not masked by useful concurrency can be classified as bottlenecks. To illustrate this alternative method, an important metric for pinpointing the location of performance bottlenecks in an out-of-order processor is the number of generated slots spent during the execution of a given instruction. is there.
[0025]
Therefore, a technique called “pair-wise sampling” is provided to measure useful simultaneity. The basic idea is to perform nested sampling. Here, a window of instructions that can be executed simultaneously with the first profiled instruction is dynamically defined. A second instruction is randomly selected for profiling from the instruction window. The profiled and second instructions form a sample pair from which profile information can be collected.
Pair-wise sampling easily determines the number of generated slots spent due to each instruction and indicates the location of the bottleneck much more accurately than known techniques. In general, pair-wise sampling is very flexible and forms the basis of analysis that can determine a wide variety of such concurrency and usage metrics.
[0026]
More particularly, an apparatus for periodically and randomly selecting one or more instructions to be processed by a processor pipeline and collecting profile information as the instructions progress through the stages of the execution pipeline And methods are provided. High-level software can then post-process this information in various ways, for example by collecting information from multiple executions of the same instruction.
Information that can be captured includes, for example, the address of the instruction (program counter or PC), whether the instruction has received an instruction cache miss, and the latency that is incurred to service the miss. If the instruction performs a memory operation, determine whether the instruction has received a data cache miss and measure the latency to satisfy the memory request. In addition, the length of time an instruction spends in each pipeline stage can be measured. The profile information also indicates whether the instruction has retired or aborted, and in the latter case it can also indicate what kind of trap has aborted the execution of the instruction.
[0027]
Information is collected in a set of profiling registers as instructions progress through the execution pipeline. When the instruction finishes executing, the higher level software is interrupted to retire or abort. The software can then process the information present in the profiling register in various ways.
Although the performance information sampled is very useful for the optimization indicated in the profile, it can also be used in many ways as a hardware event counter that collectively counts the occurrence of events.
The technology disclosed herein is an improvement over existing performance monitoring hardware and can be efficiently implemented at relatively low hardware costs in modern microprocessors that can generate instructions out of order.
[0028]
More particularly, an apparatus is provided for sampling a number of concurrently executing instructions in the system's processor pipeline. The pipeline has a plurality of processing stages. This apparatus identifies a number of instructions that are selected when an instruction is fetched into the first stage of the pipeline. Multiple selected subsets of instructions are executed simultaneously in the pipeline. System state information is sampled while any of a number of selected instructions are in any stage of the pipeline. Notify software when all selected instructions exit the pipeline so that software can read any state information.
[0029]
DETAILED DESCRIPTION OF THE INVENTION
System overview
FIG. 1 illustrates a
The off-
[0030]
operation
During operation of the
It is desirable to collect detailed performance data while executing instructions. Performance data can be associated with memory operations and execution streams.
[0031]
Processor pipeline
FIG. 2a shows the
Each clock cycle defines a “slot” or time interval when the stages of the
[0032]
As one advantage, the apparatus and method of the present invention can sample state information regarding processor slots carrying "garbage" or non-valid data. These are known as “wasted” slots. Identifying and sampling wasted slots is an important precursor to optimizing tasks. This is because wasted slots do not function effectively, thus reducing system performance. Therefore, in general, what is sampled here is not just "events" or "instructions" as in the prior art, but is related to instructions where the processor slot is associated with a valid or invalid instruction. Regardless of whether there is status information associated with pushing a processor slot through the
[0033]
Fetch unit
The
Preferably, a set of “instructions” is fetched during a single processor cycle. This set can include, for example, four instructions. In other words, the
During fetching, the selected instruction can be augmented with additional information to allow sampling or system profiling. The augmentation command is described below with reference to FIG. Note that in other implementations, the selected instruction augmentation can be performed at any stage of the processor including the
[0034]
Map unit
In
[0035]
Issue unit
In the next stage, fetched instructions are ordered by
[0036]
Execution unit
Instructions are issued to functional execution units (E0... E3) 241 and ld /
[0037]
Retire unit
Completion of instruction execution is processed by the retire
[0038]
The basic idea underlying the technology of the present invention is to process a “data item” in a selected “slot”, primarily an instruction, as it progresses through the stages of the
The design strategy here is to collect information that is difficult to determine statically in the profile record. This makes profile recording useful as a performance tool or profile-directed optimization, or resource allocation policy decisions in operating system and application level software, including dynamic adjustments that respond directly to sampling and analysis Make it useful in doing. Recall that the method and apparatus of the present invention is designed to work in an actual functional system.
[0039]
In order to determine what state information is of interest to save as part of the profile record, the various stages of a modern out-of-
As shown in FIG. 2 b, the pipeline stages are fetch 210,
[0040]
States such as instruction address (PC) 281, branch progress bit (HIST) 282, stage wait
[0041]
Superscalar out-of-order processor architecture
Out-of-order execution processors fetch and retire instructions in the correct order, but execute instructions based on their data dependencies. An instruction can be said to be “in flight” from the time it is fetched until it is terminated, eg, retired or aborted. The instruction is placed in the
For each processor cycle, fetch
To allow instructions to be executed out of order, the registers are dynamically renamed by
[0042]
When these two conditions are met for an instruction, the instruction operand is searched in the physical register file. The information in the operand register and some information about the instruction is then sent to the
[0043]
A number of events can delay instruction execution. In the front of the pipeline, the fetch
Instructions in
[0044]
Profile information register
Therefore, as shown in FIG. 3, a
[0045]
In FIG. 3, the number of bits allocated to each register is the type of information stored therein, eg, instruction address (64 bits), cycle count, ie latency (8 or 10 bits), individual events ( 1 bit / event) and so on. These numbers are only guidelines. Other embodiments may use different numbers of bits for the
In the preferred embodiment,
[0046]
The profile
One advantage of the sampling technique of the present invention is that all “instructions” processed by the
[0047]
The
[0048]
Profile path register 340 is used to capture recent branch execution / non-execution information from the branch progress table. Branch progress tables are well known for other uses. The global branch execution history can be used to indicate the execution path from which the selected instruction was fetched. Note that the instruction need not be a branch instruction in order for this information to be valid. The use of route information is described in detail below.
The latency register 350 stores timing information obtained at checkpoints while the selected instruction is in flight between various stages of the
[0049]
As the selected instruction passes the checkpoint, i.e., enters the next stage of the
A list of potentially useful latency to collect includes fetch vs map, map vs data ready, data ready vs execute, execute vs retire ready, retire ready vs retire delay. For memory instructions (load and store), the latency is issue vs. completion. This last latency differs from other latency in that certain memory operations are ready to retire before the data on which they operate is actually sent to the processor. These latencies can be counted directly in
[0050]
Updating the information in
Note that the
[0051]
Augmentation order
As shown in FIG. 4, each
[0052]
The
Based on the embodiment, the augment
[0053]
Profile register file ID
For slightly more complex designs, multiple instructions can be profiled simultaneously. In this embodiment, there are
Even when only one instruction in flight is profiled at a time, it is useful to index the file or register 300 with the
[0054]
Random sampling
The profiling overhead of the present invention is reduced by limiting the number of instructions that can be profiled simultaneously, eg,
Details supporting the instruction level profiling described here are described below.
[0055]
In flight
First, each decoded instruction state passing through the
In a simple design, only one in-flight instruction at a time is allowed to assert its
[0056]
Profiled instruction selection and sampling
As shown in FIG. 5 for the implementation of the fetch stage, the selection of instructions to be profiled and the sampling of profile information are performed as follows. The fetch
[0057]
For example, if random sampling is not performed, such as when instructions are sampled at a fixed frequency as in the prior art, statistics for all fetched instructions, such as the collect operation of
As each
[0058]
In another embodiment,
The design is effectively simplified when counting cycles rather than fetched instructions. Counting only the fetched valid instructions can be quite complicated. This is because the control stream can branch to or from a group of fetched instructions, so it is necessary to decode all instructions to determine which are valid, and no longer This is because it is not as simple as incrementing the counter by four.
[0059]
One effect is that everything fetched from the I cache during the cycle (good instructions, bad instructions, garbage instructions) is selected for sampling and the true performance of the
This is in contrast to known techniques that select only each valid instruction during a short fixed time period or at fixed fixed intervals. In either case, the strategy is to minimize overhead. There is no technology that can capture performance data for the entire system.
[0060]
Instruction filtering
The selection can be filtered by a
[0061]
After the instruction is augmented, the
Alternatively,
[0062]
Latency counter
FIG. 6 illustrates exemplary latency, fetch vs. map (FM), map vs. issue (MI), issue vs. retire (IR), fetch vs. trap (FT), and issue vs. ldst (ILS). A
The
As
[0063]
Profiling application
The above profiling hardware can be used in a variety of different ways. The technique of the present invention provides very detailed information about the execution of individual instructions, so a large number of instructions can be profiled in one application. Sample information can be stored in a memory buffer and later processed by a profiling tool to form detailed instruction level information.
This information can be used, for example, to generate a load latency histogram for each load instruction, an instruction execution time histogram, and possibly a reasonably comprehensive analysis of the pipeline state for each instruction. The amount of information provided by this solution is probably quite large, so the total memory overhead of the technique of the present invention is also quite large because it includes a significant amount of memory traffic. For example, if 1 billion instructions are fetched per second and sampling is performed for every 10,000 fetched instructions, the data rate of the profile information will be about 2.4 MB per second.
Hereinafter, a software implementation method for reducing bandwidth by collecting profile information will be described.
[0064]
Data reduction by filtering output profile information
The amount of data sampled can be reduced by ignoring certain fields of the profile record, eg, the data in the
[0065]
Valid memory addresses, branch target addresses, and branch progress samples probably require more expensive processing than other fields. These fields can probably be ignored except when collecting data to perform a specific optimization task. Given the inter-instruction fetch distance between instructions in cycles, the profiling application can also collect information regarding the level of concurrency.
Further, the filtering operation of the profiling information can be performed by hardware means such as a mask register or programmable logic. For example, sample only when there is a cache miss or when an instruction retires, or sample only other Boolean combinations of opcode, operand, address, event and latency.
[0066]
Determining hardware operations
The profiling technique of the present invention can be used to gain an accurate understanding of the internal operation of an out-of-order issue processor such as the Alpha 21264 processor. One of the first things to note about this type of machine organization is that there are many places where instructions stall in
For example, an instruction may stall in
[0067]
Certain instructions may stall in the map stage that performs virtual-physical register mapping. This is because the machine is from a physical register and there are a large number of in-flight instructions, or the
The exact determination of where an instruction was stalled, why it was stalled, and how long it was stalled depends primarily on the exact state of the machine when the instruction is executed. Because the processor is so dynamic, it is difficult to determine this state statically with software performance tools.
[0068]
Overview of operations
As shown in FIG. 7a, the profiling method 700 may include the following steps. The profiling state is initialized at
[0069]
Estimate statistics of characteristics of processed instructions
As shown in FIG. 7b,
For example, the
[0070]
Step 760 generates a subset of samples based on
The error limit can be approximated by the reciprocal of the square root of the number of samples for the particular characteristic being sampled.
[0071]
Sampling every N
The profiling techniques disclosed herein can also be used to perform N-wise sampling. Here, the dynamic state of interaction between multiple concurrent instructions can be captured. Rather than profiling a single in-flight instruction, two or more individual instructions are profiled simultaneously. The dynamic “distance” between selected instructions can be measured as the number of instructions fetched or the number of processor cycles that “separate” the instructions in flight. Any of the events counted by the
The profile information for every N sampled instructions has a number of possible uses. First, information can be analyzed to determine useful concurrency levels. This makes it possible to search for true bottlenecks. True bottlenecks are characterized by long stalls being combined with low simultaneity. In addition, every N samples can facilitate path profiling and clarify the execution path candidates by restricting the path to include at least two points along the path. In addition, detailed processor pipeline states can be reconstructed statistically from every N samples. Here, the selection of a group of instructions may be based on some measure of similarity between instructions, eg, recent branch history, stall, instruction type, or other recent state history.
[0072]
Effective concurrency measurement
Accurately locating performance bottlenecks in an out-of-order processor requires detailed information regarding both stall time and concurrency level. In contrast to in-order processors, long latency instructions are not a problem when there is sufficient simultaneity to efficiently utilize the processor while long latency instructions are stalled.
One solution for obtaining concurrency information is to obtain a snapshot of the entire pipeline state. This directly exposes where in the pipeline stage the set of concurrent instructions is at a given time. However, “dumping” the state of the entire pipeline into the sampling registers and buffers is very expensive in both time and space. Furthermore, the large amount of data generated is probably not collected efficiently to reimburse the cost of sampling. To make matters worse, this solution is practically inadequate because only instructions that retire are counted as “valid” and the information that the fetched instruction aborts is not yet known.
[0073]
Nested pairwise sampling
One form of sampling every N samples minimizes the compromise between single instruction profiling and full pipeline snapshots. Here, statistical pair-wise sampling is performed in a nested fashion, and for a given selected instruction, another instruction that can be executed simultaneously is directly sampled.
Hardware support for sampling every N nested samples
Every N samplings include the following hardware features: First, the hardware must be able to capture profile information for at least two simultaneous in-flight instructions. The set of profile registers must be duplicated to support multiple individual sets of profile records, and the
[0074]
For example, the
Ideally, the second fetch counter is the same size as the core fetch
[0075]
Nest sampling application every N
High-level application software can measure effective simultaneity using nested N samplings. An important idea here is to allow sampling of instruction sets that can potentially be executed simultaneously. Nested sampling is based on the same statistical arguments that justify normal sampling, ie sampling is applied repeatedly. Every Nth sampling includes two sampling levels, so it is most effective for code that is significantly executed. Obviously, this is also the most important part.
[0076]
Defined concurrency
As shown in FIG. 8, for a given selected instruction I (810) in a four-width pipeline, a potentially simultaneous instruction is the
For example, the Alpha 21264 processor allows 80 in-flight instructions. In practice, however, the real number of simultaneous or in-flight instructions is probably much smaller than the peak value supported by the hardware. On the other hand, speculative execution along mispredictions or bad paths can increase the window of potential concurrency.
In order to consider concurrency in the Alpha 21264 processor, it was proposed that a reasonable size of the window W820 around instruction I (810) should contain about 100 instructions. For other embodiments, the appropriate size of the window can be determined experimentally.
For example, given a window of size W, which is about 100 potential concurrent instructions, unbiased sampling can be performed by randomizing the fetch distance between selected instructions. For example, for each sample <I1, I2> (831 and 832) for each pair, the intersample fetch distance is set to a pseudorandom number uniformly distributed between 1 and W. Thus, if the inter-sample distance is randomly changed between the first selected instruction I1 and the second selected instruction I2, a large amount of statistical data where the instructions actually overlap in time. Information is captured.
[0077]
Simultaneous overlay analysis
Profile information for a set of simultaneously selected instructions with various inter-sample fetch distances directly represents valid concurrency statistics. Using each set of corresponding sample information, simultaneity information can be determined by looking forward in time from the first instruction I1 and backward in time from the second instruction I2.
The profile information recorded for every N selected instructions has a latency that accurately considers instances where both instructions <I1, I2> are present in the
[0078]
Measurement of wasted slot
The collection of pairwise instruction samples <I1, I2> with various intersample fetch distances directly represents valid concurrency statistics. Each sample per pair is used to calculate simultaneity information by looking forward in time from the first instruction and backward in time from the second instruction. To measure performance information for instructions fetched after instruction I, consider a pair of the form <I, I2>. To measure performance for instructions fetched before instruction I, consider a sampled pair of the form <I1, I>.
The profile data recorded for each sample <I1, I2> for each pair is a value stored in the
[0079]
This detailed information can be collected statistically to form various metrics that reflect the effective concurrency level. For example, one concurrency measure of interest for instruction I is the average number of issue slots wasted while I was in flight.
The number of wasted slots that were wasted can be determined as shown in FIG. Let F1 be the number of samples of the form <I, I2> where I and I2 retire, and the latency recorded with the samples indicates that the execution of I and I2 overlap (step 910). Therefore, the total number of sample pairs with valid forward superposition is counted, which is represented by F1. Similarly, in
[0080]
Then, in
By additionally determining the cumulative latency L1 of instruction I measured in the issue slot, eg, 4 / cycle that can be sustained by the Alpha 21264 processor, in
WIS = L1- (Wx (F1 + B1))
The value WIS can be easily expanded to represent the percentage or average number of wasted issue slots per instruction I execution. Conveniently, the values contributing to this average can be collected incrementally for compact storage during data collection. This is also disclosed in U.S. Patent Application No. 08 / 812,899, entitled "High Frequency Sampling of Processor Performance Counters" filed March 3, 1997 by Mr. Weil et al. Enables efficient data reduction techniques as disclosed.
[0081]
Other concurrency metrics can be determined as well, such as the number of instructions retired while instruction I is in flight, or the number of instructions issued around instruction I.
Finally, more detailed information such as the average utilization of a
[0082]
Processed by pipeline stages during a single processor cycle
Determining the instantaneous average number of instructions
As shown in FIG. 10, different forms of multipath sampling can be used to determine the average number of instructions processed by the pipeline over a fixed number of processor cycles. FIG. 10 shows, for example, a circuit for determining the instantaneous average number of instructions to be retired. Similar circuitry can be used for any
In
The
[0083]
When the sampled instruction is a retired instruction, the actual "true" useful work done by the computer can be calculated. This is a better indication than the “raw” instruction fetch rate often quoted to indicate relative processor performance. For example, certain architectures can have large fetch rates, but stalls in the pipeline can degrade performance.
[0084]
Instruction clustering
The sampled state information can also be used to identify the case while collecting simultaneity information. For example, it may be useful to calculate an average concurrency level when instruction I “hits” in one of the caches, and then compare the average concurrency level to the case where instruction I causes a cache miss. Other such features that should be considered to correlate with changing concurrency levels include register dependent stalls, cache miss stalls, branch prediction miss stalls, and recent branch history.
In general, every N samplings are significant, allowing various different metrics to be statistically calculated by sampling the value of a function that can be expressed as F (I1, I2) over a window of W instructions. Give flexibility. In contrast to the corresponding known hardware mechanisms, the flexibility provided here makes every N sampling a very good option for capturing concurrency information about complex processors. This is to allow the design of new metric and analysis techniques.
Experiments with processors running standard SPEC benchmark software show that statistically collected sample-based metrics converge to values obtained with low overhead complete information .
[0085]
Route profile
An additional effect of profiling a cluster of instructions is that a path profile is obtained. Path profiles are useful for many compiler optimizations and trace scheduling.
Furthermore, the path profile is clarified by restricting a number of points along the execution path of the program along with the progress of the recent branch execution. This clarification improves with every N samplings, ie, as N increases, the clarification improves. In the case of heavily executed code, a concurrent program can indicate the relative execution order of instructions at each stage of the
[0086]
Other applications of profile information sampled randomly
The latest generation of microprocessors uses all the tricks that computer architecture allows to give the best possible performance. These microprocessors fetch, issue and commit a large number of instructions per cycle. In addition, these processors execute instructions out of order. Some of them also perform memory operations out of order.
Unfortunately, the performance characteristics can vary considerably as many heuristic mechanisms used by the processor issue instructions and memory operations out of order. As one effect, the profiling techniques described herein allow the system to measure program performance in sufficient detail so that the performance of the
[0087]
optimisation
The profiling technique of the present invention can also be used to perform
[0088]
Hardware optimization
Because out-of-order superscalar microprocessors reschedule instructions based on data and resource utilization, compile-time instruction scheduling is much less important than in the case of structurally simple processors. Here, the main bottleneck is due to instruction fetch and memory operations.
More specifically, cycles are lost in the
While conventional event counters can measure the total number of these performance degradation events, it is very difficult if not impossible to attribute lost cycles to specific instructions in the program. The profiling techniques described herein allow users to measure key performance problems and correlate those problems with specific instructions.
[0089]
Front-end optimization
One front-end optimization that helps performance is to reorder instructions in basic blocks and basic blocks in procedures. A basic block is defined as a set of instructions that are executed linearly as a unit or not at all. A procedure is generally an aggregate set of basic blocks that are reached via a call instruction. A procedure can include a number of basic blocks. Reordering instructions in basic blocks and basic blocks in procedures can optimize the temporary location of pages and caches and change execution flow and data access to reduce the number of branches To. Branches waste cycles because they only re-execute the execution flow and do not work effectively on the data. This optimization requires knowing the control flow graph edge frequency as input.
[0090]
Trace formation
Similarly, in order to track instruction scheduling, the compiler needs edges or path frequencies in the control flow graph. The trace scheduler can perform very good jobs when it has an estimate of how long it takes to execute each basic block or larger execution path. In the case of a large-scale operating system such as the Alta Vista search engine, it is difficult to measure this in real time with conventional tools.
[0091]
Hot / cold optimization and route information
Many compiler optimizations, such as trace scheduling and hot / cold optimization, rely on knowing which execution paths are frequently taken by a program. These are referred to as “hot” paths. Until recently, by profiling programs either by instrumentation or simulation, frequently executed paths were inferred, basic block or edge counts were collected, and these counts were used to The cold path is inferred indirectly.
Recently, techniques for collecting route information directly have been used. While these techniques provide accurate routing information, they tend to have very high overhead and are unsuitable for measuring active large computer systems. With the profiling of the present invention, path information can be captured randomly with minimal overhead and still represent a statistically correct overview of the actual execution flow.
[0092]
Branch progress register
Most modern microprocessors track the direction of the last N branches in the global branch progress register. The branch progress register, as a moving window, can observe recent branch predictions and act on future instruction fetches accordingly. By capturing the contents of this register at the instruction fetch time as the instruction's PC is sampled, sometimes using a static analysis of the control flow graph, the last N branches that the processor must take An exact path can be assumed.
However, conventional progress registers usually contain only the branch direction and not the actual target destination, so the information is inaccurate. In particular, the merging of control flows is frustrating in identifying the actual path taken.
Also, asynchronous events that cause branch code execution, such as interrupts or context switches, can contaminate the branch progress bits. However, these events are relatively rare and their occurrence in the operating system must be randomly distributed across the code. Since the goal is to identify the more frequent paths, less frequent paths, including those caused by “noisy” branch progress bits caused by unpredictable asynchronous events, can be ignored.
Consider the instruction sequence shown in FIG. There is an instruction at PC address AE (1101-1105).
[0093]
Ambiguity due to confluence of control flow graphs
FIG. 12 shows a
[0094]
Optionally, the sampled information can be augmented with PC2 of the second instruction (I2) executed just before the first instruction, or applied to the PC value of the last M branches. It can also be augmented with information selected based on a function, eg, a function that selects a number of lower bits or bits determined using a hash function.
In
[0095]
For example, referring to FIG. 11, given a branch elapsed length of 1 in instruction E, the progress bit “1” causes the software tool to take path segments AE1110 and ABCE (1101-1105) as possible paths. Can be identified. Given the value of the branch progress bit, the best possible outcome is obtained when static analysis potentially can identify only a single path segment.
Other information regarding the recent execution history of the process also helps to identify the execution path taken to reach a particular instruction. One piece of valid information is knowledge of the second PC value of the most recently executed instruction. By using a large number of PC values, possibly with every N samplings, paths that contain only one PC can be excluded.
[0096]
Sampling the last M instructions of a given class
In another technique shown in FIG. 13, the hardware captures a small number of bits (B) from each of the last M instructions processed in any selected stage of the pipeline, eg, the retire unit. Can do. The
Instruction classes can be identified, for example, as conditional branches, calls, returns, access (load or store) instructions, indirect branches, and indirect calls 1321-1326. The class can be selected via
[0097]
The selected bits can be stored in a
[0098]
The accuracy improvement gained by the path code is substantial, for example the standard SpecInt95 benchmark program, even saving 4 bits from the last 6 branches, eg B = 4, M = 6 The accuracy of determining the execution path for is doubled.
Using the path code and global branch path, the trace can be analyzed as follows.
For each instruction executed in the trace, it proceeds in the reverse direction to determine the path segment until one of the following is reached:
a) The global branch progress bit is exhausted, or
b) The starting point of the routine containing the instruction is reached.
[0099]
When a call to a procedure is encountered while going backwards in the control flow graph, it will go backwards through the called procedure, and finally enough branches to act backwards through all the called routines Return to the calling procedure when there is progress. Thus, a more accurate overview of the execution flow is given.
[0100]
Increased cache and TLB hit rates
High miss rates in the cache or translation lookaside buffer (TLB) significantly degrade system performance. Known solutions generally rely on special hardware or special software mechanisms that collect cache miss addresses, such as those that periodically flush the TLB. The observed miss pattern gives an approximate understanding of frequently accessed or “hot” pages, which can be used to influence the virtual / physical page mapping policy. However, the address information necessary to perform a complete analysis is not obtained by the time an event is detected.
FIG. 14 shows a
While the instruction is executed, a valid virtual memory address is identified in
[0101]
The virtual address of the memory reference that was missed in the cache or TLB can be directly attributed to a specific instruction to give exactly the type of information needed to guide the page mapping policy. Using information about the application's memory reference flow to dynamically control the operating system's virtual / physical mapping policy successfully avoids contention misses in large direct-mapped caches and reduces TLB miss rates due to superpage formation And the number of remote memory references in a non-uniform memory access time (NUMA) multiprocessor by copying and moving pages.
[0102]
Improved instruction scheduling
One important task performed during code optimization is ideal instruction scheduling. Ideal instruction scheduling reorders the code to minimize delays due to memory latency. Although static ordering of adjacent instructions in a basic block is less important than in previous generation in-order RISC processors, macroscopic instruction scheduling is very important in out-of-order processors. .
One very difficult thing about instruction scheduling is load and store scheduling. This is because a static scheduler does not always have strict dependency information that allows memory access instructions to be optimally scheduled. In addition, it is difficult to accurately predict the latency time of memory access instructions. The instruction scheduler typically schedules loads and stores assuming a D-cache hit, since accurate information about memory accesses is usually insufficient. Alternatively, balanced scheduling attempts to generate a schedule that includes an equal amount of latency per load. This is an improvement over always assuming that load / store operations always hit in the cache.
[0103]
Thread scheduling in multithreaded processors
In a multi-threaded processor, information on thread resource usage obtained using the profiling method can be used to schedule threads to maximize overall resource utilization and throughput.
If two threads have complementary uses of resources, for example if one thread primarily uses integer units, but the other unit primarily uses floating point units, the two threads are different Since a functional execution unit is used, two threads can be scheduled to run simultaneously. Similarly, if two threads have competing resource usage, for example if both threads frequently use floating point units, they can be scheduled to operate at different times.
[0104]
FIG. 14b shows a process for scheduling threads according to processor utilization. Resource utilization of threads executing in the operating system is measured in
In
[0105]
FIG. 15 shows a process 1500 that can be used to perform scheduling of instructions.
If load and store latency is collected by random sampling, each instruction can be scheduled based on a latency histogram. The technique of the present invention can be used to derive optimizations by collecting latency information without incurring the full cash simulation expense.
[0106]
Insert prefetch instruction
FIG. 16 shows a process for inserting prefetch instructions based on measured latency. Inserting prefetch instructions is a technique that helps to hide processor stalls caused by waiting for data to be returned from memory. By making a request to the memory system well before the data is actually needed, and sometimes requesting the data just before it is determined that the data is needed, the compiler and optimizer fetch the data from memory. Often, most or all of the waiting time to do can be hidden.
However, in order to actually improve performance, it is desirable to insert prefetch instructions only for memory operations that actually experience significant latency, i.e., prefetch instructions for memory operations that do not actually incur long latency. Inserting an additional prefetch instruction effectively slows down the program. In order to identify memory operations, particularly load operations that benefit from prefetching, it is desirable to collect statistical data regarding the average latency experienced by the various memory operations in the program.
Its general configuration is shown in FIG. In
[0107]
At
Latency can be measured as described above. One method is to directly measure the latency of memory operations with sampling hardware. Another method is by sampling in the pair configuration and searching for pairs where the load instruction is the first sample of the pair and the use of data from the load is the second sample of the pair. is there. By looking for latency information in the two samples, and particularly looking for the difference in issue time between the two samples, the memory system latency for the load operation can be estimated.
[0108]
The specific embodiment has been described in detail above. It will be apparent to those skilled in the art that some or all of the effects can be achieved by modifying the above embodiments. Therefore, all such modifications and changes that fall within the spirit and scope of the present invention are intended to be included within the scope of the claims.
[Brief description of the drawings]
FIG. 1 is a block diagram of a computer system with instruction driven state sampling.
FIG. 2a is a block diagram of a microprocessor execution pipeline for processing sampled instructions.
FIG. 2b is a block diagram of a pipeline showing state information that can be sampled.
FIG. 3 is a block diagram of a register file for storing profile information.
FIG. 4 is a block diagram of augmented instructions.
FIG. 5 is a flow diagram for profiling selected instructions.
FIG. 6 is a circuit diagram showing a circuit for measuring pipeline waiting time.
FIG. 7 is a process flow diagram.
FIG. 7a is a flow diagram of a process for sampling instructions.
FIG. 7b is a flow diagram illustrating a process for estimating statistics of characteristics of instructions processed by the processor pipeline.
FIG. 8a illustrates simultaneous execution of instructions.
FIG. 8b shows simultaneous execution of instructions.
FIG. 8c illustrates simultaneous execution of instructions.
FIG. 9 is a flow diagram illustrating a process for determining the generated slot to be consumed.
FIG. 10 is a block diagram of an apparatus for determining an average number of instructions processed during a processor cycle.
FIG. 11 is a graph showing a flow of instruction sequence control.
FIG. 12 is a diagram showing a data flow of a process for identifying a control flow.
FIG. 13 is a block diagram of an apparatus for collecting branch progress.
FIG. 14a is a flow diagram of a page mapping process.
FIG. 14b is a flow diagram of a thread scheduling process.
FIG. 15 is a flow diagram of an instruction scheduler affected by memory latency.
FIG. 16 is a flow diagram of a
[Explanation of symbols]
100 computer system
110 processor
111 pipeline
112 Data cache (D-cache)
113 Instruction cache (I cache)
119 Hardware for sampling processor state
120 off-chip memory
121 General-purpose cache
122 volatile memory
123 Persistent memory
130 Input / Output Interface (I / O)
140 Bus line
200 execution pipeline
205 Conversion lookaside buffer (TLB)
210 Fetch unit
220 map units
230 issue unit
240 execution units
250 Retirement unit
Claims (37)
パイプラインの第1段へ、サンプルビット(401)及びサンプルレジスタファイル識別フィールド(402)を含む複数の指示フィールドをそれぞれが有する命令をフェッチする手段(210)と;
現在実行されているフェッチされた命令のいずれかのサブセットをサンプリングのために選択された命令としてランダムに識別するのに、その選択された命令中のサンプルビット(401)をアサートすることによりランダムに識別する手段と;
選択された命令のいずれかがパイプラインのいずれかの段にある間に前記のシステムの状態情報を与える手段(288)と;
前記状態情報を記憶するための複数のプロファイルレジスタ(300)と;
全ての選択された命令がパイプラインを出てしまったことをソフトウェアアプリケーションに通知して、ソフトウェアアプリケーションがいずれの状態情報も読み取れるようにする手段と
を備え、
前記指示フィールド(401,402)の中の少なくとも一つは、前記の選択された命令が監視のために選択されたことを指示し、前記指示フィールド(402)は前記の選択された命令と関連する命令番号を指示することを特徴とする装置。An apparatus for sampling instructions in a processor pipeline (200) having a plurality of processing stages of a system comprising:
Means (210) for fetching an instruction each having a plurality of instruction fields including a sample bit (401) and a sample register file identification field (402) into the first stage of the pipeline;
Randomly identifying any subset of fetched instructions currently being executed as the selected instruction for sampling by randomly asserting the sample bit (401) in the selected instruction Means to identify;
Means (288) for providing status information of the system while any of the selected instructions are in any stage of the pipeline;
A plurality of profile registers (300) for storing said state information;
Means for notifying the software application that all selected instructions have exited the pipeline and allowing the software application to read any status information ;
At least one of the indication fields (401, 402) indicates that the selected instruction has been selected for monitoring, and the indication field (402) is associated with the selected instruction. An apparatus for indicating an instruction number to be performed.
各サンプリングカウンタを特定の値に初期化する手段と、
特定の事象に応答してオーバーフローする前記のサンプリングカウンタの少なくとも1つのオーバーフローに応答してランダムに識別する前記手段をアクチベートする手段と
を更に含んでいる請求項1から10のいずれか1項に記載の装置。A plurality of sampling counters (510) for counting specific events;
Means for initializing each sampling counter to a specific value;
11. The means of any one of claims 1 to 10 , further comprising means for activating the means for randomly identifying in response to at least one overflow of the sampling counter that overflows in response to a particular event. Equipment.
パイプライン(200)の第1段へ、それぞれがサンプルビット(401)含む複数の指示フィールド及びサンプルレジスタファイル識別フィールド(402)を有する、現在実行されている命令をフェッチする段階と;
そのフェッチされた命令のいずれかのサブセットを選択された命令としてランダムに識別するのに、その選択された命令中のサンプルビット(401)をアサートすることにより識別する段階と;
前記の選択された命令のいずれかがパイプラインのいずれかの段にある間に前記のシステムの状態情報を与える段階と;
前記状態情報を複数のプロファイルレジスタ中に記憶する段階と;
全ての選択された命令がパイプラインを出てしまったことをソフトウェアアプリケーションに通知して、ソフトウェアアプリケーションがいずれの状態情報も読み取れるようにする段階と
を備え、前記指示フィールドの中の少なくとも一つは前記の選択された命令が監視のために選択されたことを指示し、前記指示フィールドは前記の選択された命令と関連する命令番号を指示することを特徴とする方法。A computer-implemented method for sampling instructions in a processor pipeline (200) having a plurality of processing stages of a system comprising:
Fetching the currently executing instruction into the first stage of the pipeline (200), each having a plurality of indication fields and sample register file identification fields (402), including sample bits (401);
Identifying by asserting a sample bit (401) in the selected instruction to randomly identify any subset of the fetched instruction as a selected instruction;
Providing status information of the system while any of the selected instructions are in any stage of the pipeline;
Storing the state information in a plurality of profile registers;
Notifying the software application that all selected instructions have exited the pipeline so that the software application can read any status information , wherein at least one of the indication fields is The method wherein the selected instruction indicates that it has been selected for monitoring and the instruction field indicates an instruction number associated with the selected instruction .
Applications Claiming Priority (2)
| Application Number | Priority Date | Filing Date | Title |
|---|---|---|---|
| US08/980,168 US6163840A (en) | 1997-11-26 | 1997-11-26 | Method and apparatus for sampling multiple potentially concurrent instructions in a processor pipeline |
| US08/980168 | 1997-11-26 |
Publications (2)
| Publication Number | Publication Date |
|---|---|
| JPH11272520A JPH11272520A (en) | 1999-10-08 |
| JP4467094B2 true JP4467094B2 (en) | 2010-05-26 |
Family
ID=25527392
Family Applications (1)
| Application Number | Title | Priority Date | Filing Date |
|---|---|---|---|
| JP37553998A Expired - Fee Related JP4467094B2 (en) | 1997-11-26 | 1998-11-26 | Apparatus for sampling a large number of potentially simultaneous instructions in a processor pipeline |
Country Status (4)
| Country | Link |
|---|---|
| US (1) | US6163840A (en) |
| EP (1) | EP0919924B1 (en) |
| JP (1) | JP4467094B2 (en) |
| DE (1) | DE69826418T2 (en) |
Families Citing this family (58)
| Publication number | Priority date | Publication date | Assignee | Title |
|---|---|---|---|---|
| US6367063B1 (en) * | 1998-02-05 | 2002-04-02 | Hughes Electronics Corporation | Method and apparatus for selectively performing a plurality of logic operations and memory functions |
| US6748589B1 (en) | 1999-10-20 | 2004-06-08 | Transmeta Corporation | Method for increasing the speed of speculative execution |
| GB2362481B (en) * | 2000-05-09 | 2004-12-01 | Rolls Royce Plc | Fault diagnosis |
| US20020073406A1 (en) * | 2000-12-12 | 2002-06-13 | Darryl Gove | Using performance counter profiling to drive compiler optimization |
| US8458754B2 (en) | 2001-01-22 | 2013-06-04 | Sony Computer Entertainment Inc. | Method and system for providing instant start multimedia content |
| US7320065B2 (en) | 2001-04-26 | 2008-01-15 | Eleven Engineering Incorporated | Multithread embedded processor with input/output capability |
| US7257516B2 (en) | 2001-09-20 | 2007-08-14 | International Business Machines Corporation | Method, apparatus, and program for eliminating thread skew in multithreaded performance benchmarks |
| US6961769B2 (en) * | 2001-09-20 | 2005-11-01 | International Business Machines Corporation | Method, apparatus, and program for measuring server performance using multiple clients |
| US20030088758A1 (en) * | 2001-11-08 | 2003-05-08 | Matthew Becker | Methods and systems for determining valid microprocessor instructions |
| US20030135719A1 (en) * | 2002-01-14 | 2003-07-17 | International Business Machines Corporation | Method and system using hardware assistance for tracing instruction disposition information |
| US7107585B2 (en) * | 2002-07-29 | 2006-09-12 | Arm Limited | Compilation of application code in a data processing apparatus |
| US8374841B2 (en) * | 2002-11-22 | 2013-02-12 | Texas Instruments Incorporated | Precise detection of triggers and trigger ordering for asynchronous events |
| WO2004049152A1 (en) * | 2002-11-26 | 2004-06-10 | Mplicity Ltd. | A processor capable of multi-threaded execution of a plurality of instruction-sets |
| US7243214B2 (en) * | 2003-04-21 | 2007-07-10 | Intel Corporation | Stall optimization for an in-order, multi-stage processor pipeline which analyzes current and next instructions to determine if a stall is necessary |
| US20050071612A1 (en) * | 2003-09-30 | 2005-03-31 | International Business Machines Corporation | Method and apparatus for generating interrupts upon execution of marked instructions and upon access to marked memory locations |
| US7373637B2 (en) | 2003-09-30 | 2008-05-13 | International Business Machines Corporation | Method and apparatus for counting instruction and memory location ranges |
| US20050071608A1 (en) * | 2003-09-30 | 2005-03-31 | International Business Machines Corporation | Method and apparatus for selectively counting instructions and data accesses |
| US7937691B2 (en) | 2003-09-30 | 2011-05-03 | International Business Machines Corporation | Method and apparatus for counting execution of specific instructions and accesses to specific data locations |
| US20050071516A1 (en) * | 2003-09-30 | 2005-03-31 | International Business Machines Corporation | Method and apparatus to autonomically profile applications |
| US7395527B2 (en) | 2003-09-30 | 2008-07-01 | International Business Machines Corporation | Method and apparatus for counting instruction execution and data accesses |
| US7421681B2 (en) | 2003-10-09 | 2008-09-02 | International Business Machines Corporation | Method and system for autonomic monitoring of semaphore operation in an application |
| US8381037B2 (en) | 2003-10-09 | 2013-02-19 | International Business Machines Corporation | Method and system for autonomic execution path selection in an application |
| US20050086455A1 (en) * | 2003-10-16 | 2005-04-21 | International Business Machines Corporation | Method and apparatus for generating interrupts for specific types of instructions |
| US7392370B2 (en) | 2004-01-14 | 2008-06-24 | International Business Machines Corporation | Method and apparatus for autonomically initiating measurement of secondary metrics based on hardware counter values for primary metrics |
| US7415705B2 (en) | 2004-01-14 | 2008-08-19 | International Business Machines Corporation | Autonomic method and apparatus for hardware assist for patching code |
| US7197586B2 (en) * | 2004-01-14 | 2007-03-27 | International Business Machines Corporation | Method and system for recording events of an interrupt using pre-interrupt handler and post-interrupt handler |
| US7526757B2 (en) | 2004-01-14 | 2009-04-28 | International Business Machines Corporation | Method and apparatus for maintaining performance monitoring structures in a page table for use in monitoring performance of a computer program |
| US7895382B2 (en) | 2004-01-14 | 2011-02-22 | International Business Machines Corporation | Method and apparatus for qualifying collection of performance monitoring events by types of interrupt when interrupt occurs |
| US7082486B2 (en) * | 2004-01-14 | 2006-07-25 | International Business Machines Corporation | Method and apparatus for counting interrupts by type |
| US7421684B2 (en) | 2004-03-22 | 2008-09-02 | International Business Machines Corporation | Method and apparatus for autonomic test case feedback using hardware assistance for data coverage |
| US7237094B2 (en) * | 2004-10-14 | 2007-06-26 | International Business Machines Corporation | Instruction group formation and mechanism for SMT dispatch |
| US7475232B2 (en) * | 2005-07-19 | 2009-01-06 | International Business Machines Corporation | Performance of an in-order processor by no longer requiring a uniform completion point across different execution pipelines |
| US7975263B2 (en) * | 2006-01-10 | 2011-07-05 | Intel Corporation | Method and apparatus for generating run time profiles for program compilation |
| US7908593B2 (en) * | 2007-01-04 | 2011-03-15 | International Business Machines Corporation | Technique for evaluating software performance online to support online tuning |
| US20090044159A1 (en) * | 2007-08-08 | 2009-02-12 | Mplicity Ltd. | False path handling |
| US9483405B2 (en) | 2007-09-20 | 2016-11-01 | Sony Interactive Entertainment Inc. | Simplified run-time program translation for emulating complex processor pipelines |
| US8433759B2 (en) | 2010-05-24 | 2013-04-30 | Sony Computer Entertainment America Llc | Direction-conscious information sharing |
| US8898646B2 (en) * | 2010-12-22 | 2014-11-25 | Intel Corporation | Method and apparatus for flexible, accurate, and/or efficient code profiling |
| US9430238B2 (en) | 2012-03-16 | 2016-08-30 | International Business Machines Corporation | Run-time-instrumentation controls emit instruction |
| US9411591B2 (en) | 2012-03-16 | 2016-08-09 | International Business Machines Corporation | Run-time instrumentation sampling in transactional-execution mode |
| US9454462B2 (en) | 2012-03-16 | 2016-09-27 | International Business Machines Corporation | Run-time instrumentation monitoring for processor characteristic changes |
| US9483268B2 (en) | 2012-03-16 | 2016-11-01 | International Business Machines Corporation | Hardware based run-time instrumentation facility for managed run-times |
| US9367316B2 (en) | 2012-03-16 | 2016-06-14 | International Business Machines Corporation | Run-time instrumentation indirect sampling by instruction operation code |
| US9158660B2 (en) * | 2012-03-16 | 2015-10-13 | International Business Machines Corporation | Controlling operation of a run-time instrumentation facility |
| US9465716B2 (en) | 2012-03-16 | 2016-10-11 | International Business Machines Corporation | Run-time instrumentation directed sampling |
| US9471315B2 (en) | 2012-03-16 | 2016-10-18 | International Business Machines Corporation | Run-time instrumentation reporting |
| US9405541B2 (en) | 2012-03-16 | 2016-08-02 | International Business Machines Corporation | Run-time instrumentation indirect sampling by address |
| US9250902B2 (en) | 2012-03-16 | 2016-02-02 | International Business Machines Corporation | Determining the status of run-time-instrumentation controls |
| US9280447B2 (en) | 2012-03-16 | 2016-03-08 | International Business Machines Corporation | Modifying run-time-instrumentation controls from a lesser-privileged state |
| US9442824B2 (en) | 2012-03-16 | 2016-09-13 | International Business Machines Corporation | Transformation of a program-event-recording event into a run-time instrumentation event |
| JP6187264B2 (en) * | 2014-01-07 | 2017-08-30 | 富士通株式会社 | Calculation method, calculation program, and calculation apparatus |
| US9329980B2 (en) | 2014-03-05 | 2016-05-03 | Microsoft Technology Licensing, Llc | Security alerting using n-gram analysis of program execution data |
| US9594665B2 (en) * | 2014-03-05 | 2017-03-14 | Microsoft Technology Licensing, Llc | Regression evaluation using behavior models of software applications |
| US9355016B2 (en) | 2014-03-05 | 2016-05-31 | Microsoft Technology Licensing, Llc | Automated regression testing for software applications |
| US9880915B2 (en) | 2014-03-05 | 2018-01-30 | Microsoft Technology Licensing, Llc | N-gram analysis of inputs to a software application |
| GB2595303B (en) * | 2020-05-22 | 2024-04-17 | Advanced Risc Mach Ltd | Profiling of sampled operations processed by processing circuitry |
| US11853221B2 (en) | 2022-02-18 | 2023-12-26 | Hewlett Packard Enterprise Development Lp | Dynamic prefetching of data from storage |
| US11941250B2 (en) | 2022-05-06 | 2024-03-26 | Hewlett Packard Enterprise Development Lp | Optimizing application execution based on memory-level parallelism (MLP)-based metrics |
Family Cites Families (68)
| Publication number | Priority date | Publication date | Assignee | Title |
|---|---|---|---|---|
| US4084231A (en) * | 1975-12-18 | 1978-04-11 | International Business Machines Corporation | System for facilitating the copying back of data in disc and tape units of a memory hierarchial system |
| US4481583A (en) * | 1981-10-30 | 1984-11-06 | At&T Bell Laboratories | Method for distributing resources in a time-shared system |
| JPS6047623B2 (en) * | 1982-02-12 | 1985-10-22 | 株式会社日立製作所 | Address translation method |
| US4583165A (en) * | 1982-06-30 | 1986-04-15 | International Business Machines Corporation | Apparatus and method for controlling storage access in a multilevel storage system |
| US4800521A (en) * | 1982-09-21 | 1989-01-24 | Xerox Corporation | Task control manager |
| US4590550A (en) * | 1983-06-29 | 1986-05-20 | International Business Machines Corporation | Internally distributed monitoring system |
| US5103394A (en) * | 1984-04-30 | 1992-04-07 | Hewlett-Packard Company | Software performance analyzer |
| US4845615A (en) * | 1984-04-30 | 1989-07-04 | Hewlett-Packard Company | Software performance analyzer |
| US4972338A (en) * | 1985-06-13 | 1990-11-20 | Intel Corporation | Memory management for microprocessor system |
| US4821178A (en) * | 1986-08-15 | 1989-04-11 | International Business Machines Corporation | Internal performance monitoring by event sampling |
| US4965717A (en) * | 1988-12-09 | 1990-10-23 | Tandem Computers Incorporated | Multiple processor system having shared memory with private-write capability |
| JPH02271435A (en) * | 1989-04-13 | 1990-11-06 | Mitsubishi Electric Corp | Task tracing device |
| JPH03210649A (en) * | 1990-01-12 | 1991-09-13 | Fujitsu Ltd | Microcomputer and its bus cycle control method |
| US5282274A (en) * | 1990-05-24 | 1994-01-25 | International Business Machines Corporation | Translation of multiple virtual pages upon a TLB miss |
| US5301299A (en) * | 1990-06-07 | 1994-04-05 | Intel Corporation | Optimized write protocol for memory accesses utilizing row and column strobes |
| US5151981A (en) * | 1990-07-13 | 1992-09-29 | International Business Machines Corporation | Instruction sampling instrumentation |
| US5450609A (en) * | 1990-11-13 | 1995-09-12 | Compaq Computer Corp. | Drive array performance monitor |
| US5339425A (en) * | 1990-12-11 | 1994-08-16 | Fisher Controls International, Inc. | Operating system for a process controller |
| JPH0774984B2 (en) * | 1991-06-10 | 1995-08-09 | インターナショナル・ビジネス・マシーンズ・コーポレイション | System resource utilization measurement method and data processing system |
| US5630157A (en) * | 1991-06-13 | 1997-05-13 | International Business Machines Corporation | Computer organization for multiple and out-of-order execution of condition code testing and setting instructions |
| JPH079632B2 (en) * | 1991-06-18 | 1995-02-01 | インターナショナル・ビジネス・マシーンズ・コーポレイション | Address translation device and method |
| US5450586A (en) * | 1991-08-14 | 1995-09-12 | Hewlett-Packard Company | System for analyzing and debugging embedded software through dynamic and interactive use of code markers |
| US5269017A (en) * | 1991-08-29 | 1993-12-07 | International Business Machines Corporation | Type 1, 2 and 3 retry and checkpointing |
| US5287508A (en) * | 1992-04-07 | 1994-02-15 | Sun Microsystems, Inc. | Method and apparatus for efficient scheduling in a multiprocessor system |
| GB2266606B (en) * | 1992-04-27 | 1996-02-14 | Intel Corp | A microprocessor with an external command mode |
| JP3544214B2 (en) * | 1992-04-29 | 2004-07-21 | サン・マイクロシステムズ・インコーポレイテッド | Method and system for monitoring processor status |
| US5515538A (en) * | 1992-05-29 | 1996-05-07 | Sun Microsystems, Inc. | Apparatus and method for interrupt handling in a multi-threaded operating system kernel |
| US5418973A (en) * | 1992-06-22 | 1995-05-23 | Digital Equipment Corporation | Digital computer system with cache controller coordinating both vector and scalar operations |
| US5450349A (en) * | 1992-10-27 | 1995-09-12 | Digital Equipment Corporation | Computer system performance evaluation system and method |
| US5452457A (en) * | 1993-01-29 | 1995-09-19 | International Business Machines Corporation | Program construct and methods/systems for optimizing assembled code for execution |
| JPH06290079A (en) * | 1993-03-30 | 1994-10-18 | Hitachi Ltd | Information processing system |
| US5594741A (en) * | 1993-03-31 | 1997-01-14 | Digital Equipment Corporation | Method for control of random test vector generation |
| US5452440A (en) * | 1993-07-16 | 1995-09-19 | Zitel Corporation | Method and structure for evaluating and enhancing the performance of cache memory systems |
| US5379432A (en) * | 1993-07-19 | 1995-01-03 | Taligent, Inc. | Object-oriented interface for a procedural operating system |
| US5485574A (en) * | 1993-11-04 | 1996-01-16 | Microsoft Corporation | Operating system based performance monitoring of programs |
| US5623627A (en) * | 1993-12-09 | 1997-04-22 | Advanced Micro Devices, Inc. | Computer memory architecture including a replacement cache |
| US5922070A (en) * | 1994-01-11 | 1999-07-13 | Texas Instruments Incorporated | Pipelined data processing including program counter recycling |
| US5603004A (en) * | 1994-02-14 | 1997-02-11 | Hewlett-Packard Company | Method for decreasing time penalty resulting from a cache miss in a multi-level cache system |
| US5493673A (en) * | 1994-03-24 | 1996-02-20 | International Business Machines Corporation | Method and apparatus for dynamically sampling digital counters to improve statistical accuracy |
| US5446876A (en) * | 1994-04-15 | 1995-08-29 | International Business Machines Corporation | Hardware mechanism for instruction/data address tracing |
| US5581482A (en) * | 1994-04-26 | 1996-12-03 | Unisys Corporation | Performance monitor for digital computer system |
| EP0689141A3 (en) * | 1994-06-20 | 1997-10-15 | At & T Corp | Interrupt-based hardware support for profiling system performance |
| US5528753A (en) * | 1994-06-30 | 1996-06-18 | International Business Machines Corporation | System and method for enabling stripped object software monitoring in a computer system |
| US5537541A (en) * | 1994-08-16 | 1996-07-16 | Digital Equipment Corporation | System independent interface for performance counters |
| JP3588485B2 (en) * | 1994-08-26 | 2004-11-10 | 富士通株式会社 | Process scheduling method |
| JP2908739B2 (en) * | 1994-12-16 | 1999-06-21 | インターナショナル・ビジネス・マシーンズ・コーポレイション | System and method for monitoring a CPU in a multiprocessor system |
| US5651124A (en) * | 1995-02-14 | 1997-07-22 | Hal Computer Systems, Inc. | Processor structure and method for aggressively scheduling long latency instructions including load/store instructions while maintaining precise state |
| US5748468A (en) * | 1995-05-04 | 1998-05-05 | Microsoft Corporation | Prioritized co-processor resource manager and method |
| US5608892A (en) * | 1995-06-09 | 1997-03-04 | Alantec Corporation | Active cache for a microprocessor |
| JPH0997214A (en) * | 1995-09-29 | 1997-04-08 | Internatl Business Mach Corp <Ibm> | Information-processing system inclusive of address conversion for auxiliary processor |
| US5691920A (en) * | 1995-10-02 | 1997-11-25 | International Business Machines Corporation | Method and system for performance monitoring of dispatch unit efficiency in a processing system |
| US5751945A (en) * | 1995-10-02 | 1998-05-12 | International Business Machines Corporation | Method and system for performance monitoring stalls to identify pipeline bottlenecks and stalls in a processing system |
| US5765204A (en) * | 1996-06-05 | 1998-06-09 | International Business Machines Corporation | Method and apparatus for adaptive localization of frequently accessed, randomly addressed data |
| US5854934A (en) * | 1996-08-23 | 1998-12-29 | Hewlett-Packard Company | Optimizing compiler having data cache prefetch spreading |
| US5799143A (en) * | 1996-08-26 | 1998-08-25 | Motorola, Inc. | Multiple context software analysis |
| US5802593A (en) * | 1996-09-06 | 1998-09-01 | Intel Corporation | Method and apparatus for improving disk drive performance |
| US5802386A (en) * | 1996-11-19 | 1998-09-01 | International Business Machines Corporation | Latency-based scheduling of instructions in a superscalar processor |
| US5862371A (en) * | 1996-11-25 | 1999-01-19 | International Business Machines Corporation | Method and system for instruction trace reconstruction utilizing performance monitor outputs and bus monitoring |
| US5878208A (en) * | 1996-11-25 | 1999-03-02 | International Business Machines Corporation | Method and system for instruction trace reconstruction utilizing limited output pins and bus monitoring |
| US5884080A (en) * | 1996-11-26 | 1999-03-16 | International Business Machines Corporation | System and method for instruction burst performance profiling for single-processor and multi-processor systems |
| US5857097A (en) * | 1997-03-10 | 1999-01-05 | Digital Equipment Corporation | Method for identifying reasons for dynamic stall cycles during the execution of a program |
| US5944841A (en) * | 1997-04-15 | 1999-08-31 | Advanced Micro Devices, Inc. | Microprocessor with built-in instruction tracing capability |
| US5860018A (en) * | 1997-06-25 | 1999-01-12 | Sun Microsystems, Inc. | Method for tracking pipeline resources in a superscalar processor |
| US5987598A (en) * | 1997-07-07 | 1999-11-16 | International Business Machines Corporation | Method and system for tracking instruction progress within a data processing system |
| US5964867A (en) * | 1997-11-26 | 1999-10-12 | Digital Equipment Corporation | Method for inserting memory prefetch operations based on measured latencies in a program optimizer |
| US6000044A (en) * | 1997-11-26 | 1999-12-07 | Digital Equipment Corporation | Apparatus for randomly sampling instructions in a processor pipeline |
| US5923872A (en) * | 1997-11-26 | 1999-07-13 | Digital Equipment Corporation | Apparatus for sampling instruction operand or result values in a processor pipeline |
| US5809450A (en) * | 1997-11-26 | 1998-09-15 | Digital Equipment Corporation | Method for estimating statistics of properties of instructions processed by a processor pipeline |
-
1997
- 1997-11-26 US US08/980,168 patent/US6163840A/en not_active Expired - Lifetime
-
1998
- 1998-11-25 DE DE69826418T patent/DE69826418T2/en not_active Expired - Lifetime
- 1998-11-25 EP EP98309672A patent/EP0919924B1/en not_active Expired - Lifetime
- 1998-11-26 JP JP37553998A patent/JP4467094B2/en not_active Expired - Fee Related
Also Published As
| Publication number | Publication date |
|---|---|
| EP0919924A2 (en) | 1999-06-02 |
| EP0919924A3 (en) | 2000-02-23 |
| DE69826418D1 (en) | 2004-10-28 |
| DE69826418T2 (en) | 2005-03-03 |
| JPH11272520A (en) | 1999-10-08 |
| EP0919924B1 (en) | 2004-09-22 |
| US6163840A (en) | 2000-12-19 |
Similar Documents
| Publication | Publication Date | Title |
|---|---|---|
| JP4467094B2 (en) | Apparatus for sampling a large number of potentially simultaneous instructions in a processor pipeline | |
| JP4294778B2 (en) | Method for estimating statistics of the characteristics of interactions processed by a processor pipeline | |
| JP4467093B2 (en) | Apparatus for randomly sampling instructions in a processor pipeline | |
| US5923872A (en) | Apparatus for sampling instruction operand or result values in a processor pipeline | |
| US5964867A (en) | Method for inserting memory prefetch operations based on measured latencies in a program optimizer | |
| US5809450A (en) | Method for estimating statistics of properties of instructions processed by a processor pipeline | |
| US6092180A (en) | Method for measuring latencies by randomly selected sampling of the instructions while the instruction are executed | |
| US6070009A (en) | Method for estimating execution rates of program execution paths | |
| US6549930B1 (en) | Method for scheduling threads in a multithreaded processor | |
| US6195748B1 (en) | Apparatus for sampling instruction execution information in a processor pipeline | |
| US6237073B1 (en) | Method for providing virtual memory to physical memory page mapping in a computer operating system that randomly samples state information | |
| US5797019A (en) | Method and system for performance monitoring time lengths of disabled interrupts in a processing system | |
| US6708296B1 (en) | Method and system for selecting and distinguishing an event sequence using an effective address in a processing system | |
| US5691920A (en) | Method and system for performance monitoring of dispatch unit efficiency in a processing system | |
| US5752062A (en) | Method and system for performance monitoring through monitoring an order of processor events during execution in a processing system | |
| US5751945A (en) | Method and system for performance monitoring stalls to identify pipeline bottlenecks and stalls in a processing system | |
| JP5649613B2 (en) | Method, apparatus, microprocessor and system for enhancing performance monitoring architecture for critical path based analysis | |
| US6189072B1 (en) | Performance monitoring of cache misses and instructions completed for instruction parallelism analysis | |
| US6148396A (en) | Apparatus for sampling path history in a processor pipeline | |
| US5938760A (en) | System and method for performance monitoring of instructions in a re-order buffer | |
| US5949971A (en) | Method and system for performance monitoring through identification of frequency and length of time of execution of serialization instructions in a processing system | |
| US6175814B1 (en) | Apparatus for determining the instantaneous average number of instructions processed | |
| US5881306A (en) | Instruction fetch bandwidth analysis | |
| US5729726A (en) | Method and system for performance monitoring efficiency of branch unit operation in a processing system | |
| US5748855A (en) | Method and system for performance monitoring of misaligned memory accesses in a processing system |
Legal Events
| Date | Code | Title | Description |
|---|---|---|---|
| A521 | Request for written amendment filed |
Free format text: JAPANESE INTERMEDIATE CODE: A523 Effective date: 20051109 |
|
| A621 | Written request for application examination |
Free format text: JAPANESE INTERMEDIATE CODE: A621 Effective date: 20051109 |
|
| A711 | Notification of change in applicant |
Free format text: JAPANESE INTERMEDIATE CODE: A712 Effective date: 20051109 |
|
| A131 | Notification of reasons for refusal |
Free format text: JAPANESE INTERMEDIATE CODE: A131 Effective date: 20081208 |
|
| A601 | Written request for extension of time |
Free format text: JAPANESE INTERMEDIATE CODE: A601 Effective date: 20090309 |
|
| A602 | Written permission of extension of time |
Free format text: JAPANESE INTERMEDIATE CODE: A602 Effective date: 20090312 |
|
| A521 | Request for written amendment filed |
Free format text: JAPANESE INTERMEDIATE CODE: A523 Effective date: 20090408 |
|
| A02 | Decision of refusal |
Free format text: JAPANESE INTERMEDIATE CODE: A02 Effective date: 20090511 |
|
| A521 | Request for written amendment filed |
Free format text: JAPANESE INTERMEDIATE CODE: A523 Effective date: 20090911 |
|
| A521 | Request for written amendment filed |
Free format text: JAPANESE INTERMEDIATE CODE: A523 Effective date: 20091102 |
|
| A911 | Transfer to examiner for re-examination before appeal (zenchi) |
Free format text: JAPANESE INTERMEDIATE CODE: A911 Effective date: 20091109 |
|
| TRDD | Decision of grant or rejection written | ||
| A01 | Written decision to grant a patent or to grant a registration (utility model) |
Free format text: JAPANESE INTERMEDIATE CODE: A01 Effective date: 20100210 |
|
| A01 | Written decision to grant a patent or to grant a registration (utility model) |
Free format text: JAPANESE INTERMEDIATE CODE: A01 |
|
| A61 | First payment of annual fees (during grant procedure) |
Free format text: JAPANESE INTERMEDIATE CODE: A61 Effective date: 20100223 |
|
| R150 | Certificate of patent or registration of utility model |
Free format text: JAPANESE INTERMEDIATE CODE: R150 |
|
| FPAY | Renewal fee payment (event date is renewal date of database) |
Free format text: PAYMENT UNTIL: 20130305 Year of fee payment: 3 |
|
| FPAY | Renewal fee payment (event date is renewal date of database) |
Free format text: PAYMENT UNTIL: 20130305 Year of fee payment: 3 |
|
| S111 | Request for change of ownership or part of ownership |
Free format text: JAPANESE INTERMEDIATE CODE: R313113 |
|
| FPAY | Renewal fee payment (event date is renewal date of database) |
Free format text: PAYMENT UNTIL: 20130305 Year of fee payment: 3 |
|
| R360 | Written notification for declining of transfer of rights |
Free format text: JAPANESE INTERMEDIATE CODE: R360 |
|
| FPAY | Renewal fee payment (event date is renewal date of database) |
Free format text: PAYMENT UNTIL: 20130305 Year of fee payment: 3 |
|
| R360 | Written notification for declining of transfer of rights |
Free format text: JAPANESE INTERMEDIATE CODE: R360 |
|
| R371 | Transfer withdrawn |
Free format text: JAPANESE INTERMEDIATE CODE: R371 |
|
| S111 | Request for change of ownership or part of ownership |
Free format text: JAPANESE INTERMEDIATE CODE: R313113 |
|
| FPAY | Renewal fee payment (event date is renewal date of database) |
Free format text: PAYMENT UNTIL: 20130305 Year of fee payment: 3 |
|
| R350 | Written notification of registration of transfer |
Free format text: JAPANESE INTERMEDIATE CODE: R350 |
|
| FPAY | Renewal fee payment (event date is renewal date of database) |
Free format text: PAYMENT UNTIL: 20140305 Year of fee payment: 4 |
|
| LAPS | Cancellation because of no payment of annual fees |