JP4219552B2 - Apparatus and method for image and signal processing - Google Patents
Apparatus and method for image and signal processing Download PDFInfo
- Publication number
- JP4219552B2 JP4219552B2 JP2000505594A JP2000505594A JP4219552B2 JP 4219552 B2 JP4219552 B2 JP 4219552B2 JP 2000505594 A JP2000505594 A JP 2000505594A JP 2000505594 A JP2000505594 A JP 2000505594A JP 4219552 B2 JP4219552 B2 JP 4219552B2
- Authority
- JP
- Japan
- Prior art keywords
- signal
- processing
- data
- noise
- input
- Prior art date
- Legal status (The legal status is an assumption and is not a legal conclusion. Google has not performed a legal analysis and makes no representation as to the accuracy of the status listed.)
- Expired - Lifetime
Links
Images


Classifications
-
- G—PHYSICS
- G06—COMPUTING OR CALCULATING; COUNTING
- G06T—IMAGE DATA PROCESSING OR GENERATION, IN GENERAL
- G06T1/00—General purpose image data processing
-
- G—PHYSICS
- G06—COMPUTING OR CALCULATING; COUNTING
- G06F—ELECTRIC DIGITAL DATA PROCESSING
- G06F17/00—Digital computing or data processing equipment or methods, specially adapted for specific functions
- G06F17/10—Complex mathematical operations
-
- G—PHYSICS
- G06—COMPUTING OR CALCULATING; COUNTING
- G06T—IMAGE DATA PROCESSING OR GENERATION, IN GENERAL
- G06T5/00—Image enhancement or restoration
- G06T5/70—Denoising; Smoothing
-
- G—PHYSICS
- G06—COMPUTING OR CALCULATING; COUNTING
- G06T—IMAGE DATA PROCESSING OR GENERATION, IN GENERAL
- G06T9/00—Image coding
-
- G—PHYSICS
- G06—COMPUTING OR CALCULATING; COUNTING
- G06T—IMAGE DATA PROCESSING OR GENERATION, IN GENERAL
- G06T2207/00—Indexing scheme for image analysis or image enhancement
- G06T2207/20—Special algorithmic details
- G06T2207/20048—Transform domain processing
Landscapes
- Engineering & Computer Science (AREA)
- Physics & Mathematics (AREA)
- General Physics & Mathematics (AREA)
- Theoretical Computer Science (AREA)
- Data Mining & Analysis (AREA)
- Mathematical Physics (AREA)
- Mathematical Analysis (AREA)
- Computational Mathematics (AREA)
- Algebra (AREA)
- Mathematical Optimization (AREA)
- Multimedia (AREA)
- Pure & Applied Mathematics (AREA)
- Databases & Information Systems (AREA)
- Software Systems (AREA)
- General Engineering & Computer Science (AREA)
- Image Processing (AREA)
- Compression, Expansion, Code Conversion, And Decoders (AREA)
- Facsimile Image Signal Circuits (AREA)
Description
【0001】
(関連出願)
本出願は、ここに参考資料として援用する、1997年7月31日出願の仮出願番号第60/054,399号「属性、位相見積、適合度、量子化容量による信号処理のための方法及び装置」と称する出願人の同時継続米国仮特許出願からの優先権を主張する。
【0002】
本発明は、米国保健学会(U.S.P.H.S.)より授与された許諾番号EY03785の下で米国政府の支援により成された。米国政府は本発明に対し一定の権利を有する。
【0003】
(技術分野)
本発明は、全般的にはアナログ及びディジタル信号処理に関し、特に、信号又は画像データの効率的表示及び処理のための装置と方法に関する。
【0004】
(先行技術)
図1は、先行技術による代表的な信号処理システム100のブロック線図である。図に示すように、このようなシステムは、通常、入力ステージ102、処理ステージ104、出力ステージ106、データ記憶エレメント108を含んでいる。
【0005】
入力ステージ102はセンサー、トランスジューサ、受信機又は記憶エレメントからデータを読み取る手段のようなエレメントを含んでいる。入力ステージは、人工の及び/又は自然に起こる現象の有益なデータを提供する。このデータの有益な構成要素は、通常ノイズと称する無用な信号の存在によりマスクされるか汚染されている。あるアプリケーションでは、入力エレメントは、ユーザー、フィードバックループ、又は外部ソースによる入力又は処理ステージの付加的な制御を提供するために使われる。
【0006】
データストリーム、アレイ、又はパケットの形の入力データは、予め定義された転送プロトコルに従って、直接又は中間記憶装置エレメント108経由で処理ステージに提示される。処理ステージ104は、専用のアナログ又はディジタル装置か、或いは、所望のデータ処理操作のセットを実行するための中央処理装置(CPU)、ディジタル信号プロセッサ(DSP)又はフィールドプログラマブルゲートアレイ(FPGA)のようなプログラム可能な装置の形をとる。処理ステージ104は1つ又はそれ以上のCODEC(コーダー/デコーダー)を含んでいてもよい。
【0007】
出力ステージ106は、ユーザー又は外部装置に影響を与えることのできる信号、ディスプレイ、又はその他の応答を作り出す。通常、出力装置は、インジケータ信号、ディスプレイ、ハードコピー、記憶装置内の処理されたデータの表示を生成し、又、例えばデータを遠隔地に送信し始めるために使用される。出力装置は、後続の処理操作で使用するための中間信号を提供するため、及び/又は処理操作の制御における制御エレメントとして使用される。
【0008】
使用される場合、記憶装置エレメント108は、写真フィルム及び読み取り専用媒体のような永久的なものでもよいし、ダイナミックランダムアクセスメモリーのような揮発性のものでもよい。単一の信号処理システムが、入力、処理及び出力ステージと様々な関係を有するエレメントと共に、幾種類かの記憶装置エレメントを含んでいるのは普通でないわけでもない。そのような記憶エレメントの例には、入力バッファ、出力バッファ、処理キャッシュが含まれる。
【0009】
信号又は情報処理システム100の第1の目的は、入力データを処理して、特定のアプリケーションに意味のある出力を作り出すことである。この目標を達成するために、ノイズ削減又は取消、特徴抽出、データ分類、事象検出、編集、データ選択、データ再コーディング等を始めとした様々な処理操作が用いられる。
信号処理システムの設計は、システムの使用意図と、入力として用いられるソース信号の期待される特性の影響を受ける。大抵の場合、使用できる記憶装置の容量と特定アプリケーションの計算上の複雑さとの影響を受ける、要求される性能効率もまた重要な設計因子である。
【0010】
ある場合には、ソース信号の特性が効率的データ処理という目標に悪影響を及ぼすこともある。入力データが(限られたセットの記号値又は狭い帯域幅のような)狭意に定義可能な特性を有するように自然に又は計画的に拘束されている場合を除き、ソースデータの本来的変動性が、特別目的の技術的仮定から生じるエラーを引き起こすこと無く、信頼でき且つ効率的方法でデータを処理するのに障害となることもある。この点において、拘束の弱いデータを作り出す多くのデータソースは、音声及び視覚画像のように、人々にとって重要なものであることに留意しなければならない。
【0011】
従来型の画像処理法は、遅いデータ通信速度、大きな記憶装置の必要性、妨害性知覚可能人工物の形で顕在化する多数の非能率性の害を被っている。画像データを使用し操作するのに望まれる方法が様々であり、又人が視覚情報に対し有している生来の感受性の故に、これらは深刻な問題となりかねない。
【0012】
特に、「最適」な画像又は信号処理システムは、所望のセットの処理操作を実行するための、他の中でもとりわけ、高速、高効率、高信頼性且つ強力な方法によって特徴付けられる。そのような作用には、変換、記憶、送信、ディスプレイ表示、圧縮、編集、コーディング、増強、分類、類別、特徴検知及び認識、データの美的変換、そのような処理されたデータの他の情報ソースとの統合等が含まれる。同じように重要であるが、画像処理システムの場合、出力は、知覚可能な乱れ及び歪みを引き起こすのを回避し、できるだけ自然に人間の視覚と相互作用できなければならない。
【0013】
信号処理法が強力でなければならないという意味は、その速度、効率、品質が(例えば)入力データの何らかの特別な特性の特質に強く依存するものであってはならない、即ち、あらゆるもっともらしい入力に対して「最適に」又はそれに近いレベルで作動しなければならないということである。
【0014】
信号処理法によって被る通常の不適切性はそれらが強力でないということなので、これは重要な点である。画像処理におけるJPEG型の方法は、例えば、鋭い非連続性を有する図形画像等に対してよりも、色と輝度において緩やかな傾斜を有する「写真」画像に対してよく機能する。一方、GIFフォーマットで実現されるような画像圧縮法は、画像が写真画像で見られる複雑さを殆ど持っていない場合に最も良く機能する。音声及び他種の入力データについて実行される処理操作に関しても同様な例を挙げることができる。
【0015】
一つには、従来型の画像処理法は、可能な画像が無限にある故に強力さを欠いている。これに加えて、事を複雑にするのは、大抵の場合、画像がどんな特徴と複雑さを有しているかを事前に正確に知るのは不可能だということである。このように、画像を完全に描くための1つのアプローチは、画像中の全ての点における輝度と色とを決めることである。しかし、このタスクを完遂するのに必要な情報の量は通常サイズのディジタル画像1枚に対し数メガバイトを超えかねず、そのような情報を記憶し、処理し、送信するのは大変になる。その場合でも、ディジタル表現は、連続するアナログ信号の表現に基づいて2進値を構築するのに付き物の限界の故に、元の画像に対し不正確な記録となる。
どの様な有限期間又は面積に関わる離散的サンプリングであってもソースデータ内の全ての変化を捕捉することはできないので、継続値データのどの様な離散的表現においても情報が失われることになる。同様に、ソースデータ内の全範囲の値を離散値のセットで表現できない場合、どの様な量子化処理においても情報は失われる。
【0016】
処理操作の特性又は実行によって課される困難さに加え、汚染ノイズソースが対象の信号を表すと想定される入力の構成要素をマスクするか又は歪ませる場合は、他の問題にも取り組まなければならない。しかし、論理的にノイズと定義できないが、それにも関わらず信号処理法の品質と強力さに関し問題の源である他の形のランダムさと非予測可能性のあることにはなかなか気が付かない。このような形の非予測可能性は、本来的ランダムさと総体的多様性の点で考慮されている。本来的ランダムさは、データの媒体又はソースから不可分のランダムさに関係する。光子捕捉の量子力学的ランダムさは本来的ランダムさの例である。
【0017】
総体的多様性はデータ又は情報ソースのクラス内のあらゆる非予測性に関係する。視覚情報を表現するデータは、視覚情報が事実上拘束を受けていないので、非常に大きな度合いの総体的多様性を有している。視覚データはどの様な時間的連続、空間パターン、又は光により形成できる時空シーケンスでも表現する。視覚情報をもっと正確に定義する方法はない。音声情報を表現するデータは、大きな総体的多様性を有するもう1つのクラスのデータである。音楽、会話、動物の叫び、木の葉を渡るサラサラという風の音、及びその他の音は、圧力波を表現しているという以外に何の本来的特性も共有していない。人がある音だけを聞くことができ、ある周波数の音に他の周波数の音よりもより敏感であるという事実は、音の特性というより人の音声処理の特性である。同様に変化するデータ及び情報ソースのクラスの例は自然及び人工の現象を通して見つけることができる。
【0018】
ノイズ、本来的ランダムさ、及び総体的多様性からくる非予測可能性は、個々にそして組み合わさって、入力データから、情報伝達の又は信号の構成要素を抽出するのを困難に、そして通常は不可能にする。そうしようとすると常に、信号及び雑音モデルが暗示的に、又は明示的に定義される必要が生じる。しかし、ノイズ、本来的ランダムさ、又は総体的多様性が特性を共有している何らかの可能性がある場合は、入力データの構成要素を非情報伝達のノイズと対照してみた場合の情報伝達における信号の類別に、絶対的信頼性を持って割り当てることのできるどのような信号及び雑音モデルも採用することはできない。
【0019】
信号及び雑音モデルは、信号処理の出力における多様性を制限し、処理操作を扱い易くするために、暗示的又は明示的に信号処理操作の中に構築される。信号プロセッサは通常、データを表現又は解釈する方法にある形の拘束又は構造を課する。その結果、そのような方法は、出力の品質、出力を見る際の信頼度、データ上で信頼して実行できる後に続く処理タスクの型式に影響を与えかねない体系的エラーを引き起こす。
【0020】
信号処理法に用いられる、しばしば述べられないが重要な仮定は、ソースデータは符号又は関数の組合せにより表現又は近似されるということである。そうする際に、そのような処理法は基本的に、入力内の値及び相互関係を定義するか又は十分であると判定する規準を課す。信号処理法は、信号と見られるべきもののあるコンセプトを具象化しなければならない。しかし、あるセットの値又はある種の相互関係を使って信号を完全に定義できるという暗示的又は明示的仮定はしばしば根拠が無く、処理エラー及び非効率に至る。信号を1セットの値又は相互関係の点から定義することにより、処理方法は全ての他の値及び相互関係をノイズの類別に効果的に割り当てることができる。そのようなアプローチは、1)入力データの表現する情報ソースはあるセットの値又は相互関係だけを呈し、2)入力データ内のノイズ又はランダムさは入力にこれらの値又は相互関係を偶然に呈させる事は決してない、ということが知られているときにのみ有効である。この種の状態は良くても希で、議論の余地はあるが実際に起きることはない。これらの条件は、視覚、音声、又は他の非拘束の総体的多様性を有する情報ソースに関しては疑いなく真実ではない。そのようなクラスのデータに関しては、存在する多様性の範囲を完全にカバーするには、有限セットの値又は相互関係では十分ではない。その結果、情報ソースを表す幾つかの値又は相互関係が不可避的且つ誤ってノイズの類別に割り当てられるであろう。本発明的方法はそのようなセットの特定の値又は相互関係を仮定してはいない。
【0021】
一般的に信号及び雑音モデルの限界を幾つか更に例証するために、我々は本節で、画像処理の分野で見られる幾つかの処理技法を論議する。従来の画像及び信号処理技法には、ヒストグラム法、予測的コーディング法、エラーコーディング法、JPEG、MPEG、細(さざ)波ベース技法のような基礎関数のセットの点からデータを表現する方法がある。
【0022】
ヒストグラム法は画像内の輝度及び色の値を類別することに基づいており、パレットのコンセプトを含んでいる。ヒストグラムは、どの様な頻度で特別の値が特定の範囲限界内に入るかを記述する確率密度関数に関係する。ヒストグラム法は、データを表現するのに必要な代替値の数を低減するために、ソースデータを量子化するのに用いられる。いろいろな形で、ヒストグラム法は、連続値ソースデータから導かれた全てのディジタル画像に適用されてきた。ヒストグラム法はヒストグラム均等化、色再マッピング、閾値化等のアプリケーションにおいて美的効果にも使われている。
【0023】
しかし、ヒストグラム技法の欠点は、そのような方法を実行するために使われる処理スキームがどの範囲の値及び色が他より重要又は有益であるかを決めなければならないということである。このことは、画像内の値の分布は、1つの画像から次の画像へと劇的に変化するという事実と対立する。同様に、ヒストグラム中の山と谷の数と位置は画像間で相当に変動する。その結果、ヒストグラム法は計算的に複雑化し、画像の種類が異なれば品質レベルが変わる結果となる。ヒストグラム法は又、気が付くようなボケ及び不自然な色構造を有する出力を作り出し易い。
【0024】
予測的コーディング法は、全体の値の分布に加えて多数の画像点における画像値間の関係を考慮することによりヒストグラム法の限界の幾つかを補償しようと試みる。予測的コーディング技法は、複調性の画像のような、自然に制限された多様性を有するデータに適している。このような方法は、JBIG及びファクシミリ通信に使用されるグループ3/4標準の重要な部分である。しかし、マルチレベルグレースケール及びフルカラー画像のようなより複雑な画像データに関しては、予測的コーディング法はそれほど有効ではなかった。
【0025】
予測的コーディング技法は、画像中の他の点における値に基づいて特定の点における画像の値を予測するために使用することのできる、画像データ内の相互関係があるという仮定に基づいている。このような方法は、予測された値から甚だしく外れた画像内の変動を無視することによりノイズを削除するのに用いることができる。そのような方法は、画像点が予測された値から著しく外れたときにのみ画像点をコーディングすることにより画像圧縮スキームにも使用することができる。
【0026】
しかし、予測コーディングにおいて生じる問題の1つは、画像内の特定の偏差がノイズよりも重要な情報であるということを決定するのが難しいということである。困難さのもう1つの原因は、画像内の相互関係が画像間においてと同様、場所毎に違うことである。現在、従来型予測コーディング法で、現実的な画像の範囲に亘って処理エラーを最小化する十分に強力なアルゴリズムを使っているものはない。その結果、従来型予測コーディング法は画像間の変化を均一化する傾向にある。
【0027】
エラーコーディング法は、予測値と実際の値との間のエラーをコーディングすることにより予測法を拡張する。従来型エラーコーディング法は、大きい値よりもむしろゼロに近い小さな値がより一般的であるような入力データの表現を作り出すのに役立つ。しかしこのような方法は通常、全ダイナミックレンジを入力データのレンジよりも低減することはなく、むしろそのレンジを増大させることさえある。その結果、エラーコーディング法はノイズ及び量子化エラーに敏感となり、特に、エラーコード化された表現から元のソースデータを再構築しようとするときにそうである。更に、エラーコーディングは予測コーディングの拡張なので、これら2つのクラスの方法は多くの同一の問題及び欠点を共有している。
基礎関数のセットを使用するデータの表現はよく知られており、フーリエ技法を使うのが最も一般的であろう。他の変換法としては、高速フーリエ変換(FFT)、離散コサイン変換(DCT)、各種の細波変換がある。そのような変換法に関する合理性は、基礎関数が係数値によりエンコードできること、及び、元のソースデータの情報内容に基づいて、ある計数を他のものよりより重要なものとして取り扱うことができるということである。そうする場合、これらの方法は、基礎関数により近似されたある種類の係数値及び及び相関関係を、他のあらゆる値又は相関関係よりも重要なものと見なす。本質的に、変換法は画像内の相関関係を類別する手段である。このような方法の限界は相関関係の非予測性の結果である。画像を特徴付ける輝度と色における変動はしばしば局部化され、画像の面に亘って変化する。その結果、JPGEのようなFFT及びDCTベースの方法は、しばしば先ず画像を多数のブロックに分割し、相関関係の分析が画像の狭い範囲に限定できるようにする。このアプローチの結果、ブロックの端では厄介な非連続性が生じかねない。
【0028】
細波ベースの方法は、サイン及びコサイン関数よりも局部化された基礎関数を使用することにより、この「ブロック効果」を避ける。しかし細波ベースの方法の問題は、この方法が、ある画像に関しては特定の関数が適切であり、画像内の異なる位置にセンター合わせされたその関数の縮尺バージョンの重ね合わせにより全画像が描写できると仮定していることである。画像データが複雑な場合には、そのような仮説はしばしば正しくない。従って、細波ベースの方法は画像内及び画像間の処理及びコーディング品質における質感的かすみ及び直ぐに分かる変化を作り出す傾向にある。
【0029】
情報ソースとしての画像の複雑さから生じる問題の幾つかに対処するため、人間の知覚のモデルをデータ処理法に組み込もうとする数多くの試みが行われている。これらは、人間の視覚能力をガイドとして使うことにより、処理の間に入り込む多くのエラー及び歪みを取るに足らないものとすることができるという確信に基づいている。基本的に、人間の知覚モデルを使用すれば、ある視覚情報が他の情報よりも重要であると決定するための基礎を作ることができる。例えば、テレビ及び幾つかのコンピューター画像フォーマットは輝度情報を色情報よりも重要なものとして明示的に取り扱い、コーディング及び処理のリソースを優先的にグレースケールデータに使用する。このアプローチはある種の妥協であるが、画像データ処理を支援するのに現在使用できる人間の知覚の十分に正確なモデルはない。その結果、そのようなモデルを組み込んだ処理を設計する試みは、直ぐに気が付くように不完全な画像という結果となる。
【0030】
それ故、従来のアプローチよりも効率的な、一般的信号及び画像データを処理するための装置と方法が所望され、必要とされている。特に、従来の方法に比べ計算的に複雑でなく、データ記憶装置要件の緩やかな、信号及び画像処理の装置及び方法が望まれている。又、従来のアプローチで見られる信号及び画像品質の劣化無しに、処理されたデータから信号及び画像を再構築するための装置と方法が望まれている。
本発明はそのような装置及び方法を提供する。
【0031】
(発明の要約)
本発明は信号及び画像データを効率的に処理するための装置及び方法に向けられている。本発明的方法は、最終製品又は更に処理に供される中間結果として使用できる信号及び画像データの表現を提供する。最終製品としては、データ表現は、異なる信号処理技法を比較し特徴付けるのに、又は処理操作を適用するための制御エレメントとして使用できる数々の利点を提供する。中間結果の提供者としては、本方法は、画像データの変換、記憶、増強、リファイン、特徴抽出、圧縮、コーディング、送信、又はディスプレイ表示のための処理におけるステップとして使用できる。こういう関係で、本発明的方法は従来の信号処理法の計算的及びデータ記憶装置要件を相当に緩和する。本発明は、本来的に予測不可能な、又は部分的にランダムなソースからのデータを操作して、現在可能なものよりも強力且つ効率的な後に続く処理法、記憶装置要求の削減、エラー及び劣化を最小にした元のデータの復旧を考慮した形でデータの簡素なコーディングを行う改良された方法を提供する。本発明は、ノイズが無いか、又はランダムな構成要素により汚染されているか、そしてデータが光子のような自然状態で表現されているか事前処理されているかに関わらず、外部環境から引き出されたコーディングソースデータのシステムを提供する。
本発明のこの他の特徴及び利点は、添付図面を参照しながら好ましい実施例について詳細に述べる以下の説明において明らかになるであろう。
【0032】
(発明の詳細な説明)
本発明は、開示された処理操作のアプリケーションに適するフォーマットで表現されるどの様な形のデータにも都合良く適用できる、信号処理装置及び方法を提供する。制限無しに、データはディジタルデータ、アナログデータの両方を含んでいてもよく、視覚画像、音声信号、レーダー信号を表すデータを含んでいてもよい。以下の説明の部分は視覚画像データ処理に言及し又は直接向けられているが、本発明はそのようなデータと共に使うのに限定されるわけではなく、そのようなデータに言及するのは、例示することだけが目的であるということに留意されたい。同様に、本発明の方法の数学的説明は一般化周波数表記法の形を使用していることにも留意されたい。基本的な処理の原理体系は時間、空間、又は時空と異なるわけではないので、一般化周波数は時間的、空間的又は時空周波数として読め、利用できる。時間的処理には、因果関係の条件を満たすことが必要となるだけである。周波数ドメイン表記法の使用は、データは処理のために周波数ドメインへの変換を必要とするということを意味すると解されるべきではなく、むしろ周波数ドメインの項は象徴的に考えるべきである。データは、例えば同時継続仮出願の中に説明する型式のように、回路を使って時間及び空間において到着するに従って処理するのが好ましい場合がしばしばである。他の処理法では大きな負荷の掛かる計算となるであろうことを、そのような回路を使って簡単に素早く実行するのが本発明による方法の利点の1つである。
【0033】
出願人は、ある種の情報又は相互関係は他よりも重要であるという先行技術において普通に設けられている仮定は、複雑なデータソースの処理において生じる多くの問題の源であることを認知するに至った。この仮定は、どの信号処理法をデータに適用するかという選択においてはっきりと現れ、大部分の従来の信号処理スキームによって実行される作用に関する基礎でもある。例えば、ヒストグラム法は、値の範囲を特定画像に対する視覚重要性の観点で基本的に類別する。いろいろな方法で、予測コーディング法、エラーコーディング法、基礎関数法は、画像データ内のある種の変動は他よりも重要であるということを暗示的又は明示的に仮定している。そのような方法は、たとえある場合には部分的に人間の知覚のような理論的又は経験的モデルにより支援されていても、特別な工学的仮定に基づいているのである。その結果、そのような方法は、ソースデータの本来的特性の結果というよりはむしろ、処理方法からくる体系的エラーを持ち込むことになるため、データ処理に方法的バイアスを掛ける原因となる。
【0034】
そのような体系的エラーは体系的誤情報を引き起こすと考えることができる。このように、大部分の従来の処理法はデータに特定の拘束を課し、結果的にデータの非効率で、ある場合には誤りとなる解釈及び作用を引き起こす。
【0035】
幾つかの従来型処理法が不適切さ又は非効率を有しているということは、特定のアプリケーションに対する利点がないという意味ではない。しかし、そのような方法における暗示的仮定は、その汎用性を拘束し、結果において所望される程度の信頼性を維持しながらデータに関し実行できる処理操作を制限する。例えばブロック型JPEG上で指紋認識作用を行うのは、DCT量子化により持ち込まれるエラーが結果的に効率を下げ、誤識別に至りかねないので、おそらく不適切であろう。ある情報は他の情報よりも重要である、又は、あるデータセットの特性がそれが信号に割り振られるかノイズに割り振られるかを決めると仮定する他の方法についても同様な議論が当てはまる。一旦そのような方法がソースデータに適用されれば、続いて実行することのできる有効な作用の範囲が制限されることになる。
【0036】
本発明の方法の利点の1つは、情報損失を最小化する様なやり方で、離散サンプリング法を採用できるということである。更に、本発明の方法は、ソースデータの連続値表現を離散表現から生成することのできる方法を提供する。
本発明の方法の重要な特徴は、入力データ及び暗示的又は明示的信号及び雑音モデルから従来型信号の表現よりも優れた特性を有する信頼度のメトリックを作り出し、多くの信号処理操作において信号表現の代わりに使用でき、処理操作の品質と効率を制御するのに使用でき、現存の又は仮説の処理操作を特徴付けるのに使用できるということである。従って、本発明の方法は、信号及び雑音モデルの負担によって持ち込まれるエラーを制御し定量化するために使用することができる。
【0037】
信号及び雑音コンセプトは本来的なものであるので、それは疑いのないものであり、その限界は調べられていない。本発明に到達するに際し、出願人は信号及び雑音コンセプトを再考せねばならず、認識するに至ったのは間違っているというよりはむしろ不完全であるということであった。入力データの態様を信号又はノイズの何れかに割り振るのには、通常、そのような割り振りに替えるべき信頼度に関する不確定性が伴う。発明者は、そのような不確定性は、信号の表現及びノイズの表現から独立したやり方で表現できることを認識した。この不確定信号は信号又はノイズの何れかへ単独に帰することのできない入力におけるパワーを表し、即ち信頼度のメトリックとして働く。出願人は又、不確定信号は、信号の表現の代わりに、そして情報処理操作を制御するための制御信号としての両方に使用できる入力データを簡素な方法で生み出す情報ソースを表現することを認識するに至った。
【0038】
従来の(先に述べたような)信号及び情報処理法の欠点を考慮する中で、出願人は、信頼でき且つ効率的信号処理法はある特性を有していなければならないことを認識した。その中には、これに限定するわけではないが、以下のものが含まれる。即ち、
(1)その方法は、体系的エラーを最小化し汎用性を最大化するために方法論的に持ち込まれた最小限の特別な仮定とソースとを具象化しなければならない。
(2)その方法は、計算的に単純且つ効率的でなければならない。
(3)その方法は、信頼性があり、複雑なデータソースに強力に適用可能でなければならない。
(4)その方法は、どのデータ構成要素が情報を伝えどれが汚染物であるかに付いての詳細な知識を必要とすることなく、ソースデータ内のノイズとランダムさとを最小化する手段を提供しなければならない。
(5)その方法は、持ち込まれる歪みが最小量のものでなければならない。
(6)その方法は、入力データが最小の信号劣化で量子化され分類されるようなものでなければならない。
(7)その方法は、高次のデータ圧縮を考慮したものでなければならない。
(8)その方法は、処理されたデータが遠隔地に効率的よく送信できるようなものでなければならない。
(9)その方法は、ソースデータの変化に適応し、処理エラーと非効率性とを低減することのできるものでなければならない。
(10)その方法は、特定のアプリケーションに適切なアナログ及び/又はディジタル技法の何れかを使って実行できるものでなければならない。
【0039】
これらの要件を考慮する中で、出願人は、ある情報は他の情報よりも重要であるものとしてクラス分けできるという伝統的コンセプトを疑問に思った。画像処理に関し、出願人は、画像中の輝度及び色の値は生情報と考えるべきであるという仮定を再考した。出願人は、輝度及び色は、データに関する所望の情報を抽出するために処理できる、画像に関する最も効率的で、強力で信頼できる情報を提供しないということを認知した。この認識と、他の型式の情報ソース及びデータ形式に対するその拡張とは、本発明の基礎を形成する助けとなる数々のコンセプトを生み出す結果となった。
【0040】
(入力データの曖昧な構成要素)
全ての信号及び情報処理方法は、入力のセットからある結果を生み出そうと懸命に試みる。入力は、2個の構成要素、即ち情報若しくはメッセージを保有する信号構成要素と、信号構成要素の歪と例えばランダムな変動(ランダムノイズ)や漏話という形の汚染を反映するノイズ構成要素として説明でき、またそれが一般的な説明でもある。本発明では、信号構成要素とノイズ構成要素を有するものとして入力を定義する最初の段階が、それがデータ上に特定モデルを課するということから、広範な含意を持つものと認識している。全てのデータは信号又はノイズの何れかとして類別されることが必要不可欠であり、ある信号データのセットと別の信号データとの間、信号データとノイズデータとの間、及びあるノイズデータのセットと別のノイズデータとの間の、仮定される大きさ及び位相関係に関しての分岐を伴う。モデル選定の偏りは、信号をノイズから区別する「鮮明な線」を維持しながらデータを処理できる精度に限界を持ち込むことになる。
信号及び雑音モデルが与えられると、入力はX(ν)、信号はS(ν)、ノイズはN(ν)と書き表され、ここに、大文字は周波数ドメイン表示(例:フーリエ変換)を表し、パラメータνは一般化された周波数(時間的、空間的、時空的周波数が典型的)を表す。このような条件で、入力は、信号とノイズの合計として、
X(ν)=S(ν)+N(ν)
と書き表される。
【0041】
このようなデータモデルを使用する際には、入力データX(ν)は既知で、ノイズ寄与N(ν)に対するモデルが仮定される。これらの項に基づき、信号S(ν)の表現が求められる。
【0042】
しかしながら、信号及び雑音構成要素の項でデータを表現するという広く普及している規則にもかかわらず、出願人は、入力データ特に複雑なソースから生じるデータの処理には、より効率的で汎用性のある方法があることを認知した。本発明に対するの1つの動機づけは、入力データは信号とノイズ構成要素に分解することができるとする仮定が、複雑な情報源については、データセットの信号構成要素を演繹的知識から正確に定義することが、たとえできたとしても、ほとんど不可能であるという現実と矛盾するということである。特定の処理スキームにおいて信号の定義を課するという試みは、ノイズを暗示的に定義し、体系的エラーを持ち込み、データ上で信頼を持って実行できる処理操作の型に制限を付す。例えば、上述の従来型画像処理法では、入力データのある態様若しくは特質は、他のもの、例えば相関関係の値の範囲又は型よりも重要であると仮定している。これらの方法は本来信号構成要素を定義するもので、従って結果的に先に説明したある種の処理制限が生じる。
【0043】
このように、本発明では、暗示的に又は明示的に、信号が何でノイズが何かということに対する「決定」は、従来の信号処理スキームを非能率的なものにし、それらを半最適に変えてしまうということを認識している。代わって必要とされるものは、これらの不都合を引き起こさない「翻訳」の方法である。従って、このアプローチを用いて、本発明は、複雑なソースからの入力データを、信号とノイズの項の代わりに曖昧さと不確定性の尺度の項で表す装置と方法を提供する。これらの方法及びこの種のデータ表現には、従来からの信号及び雑音アプローチよりも有利な点が幾つかある。
【0044】
翻訳のコンセプトは、幾つかの点で見積のコンセプトに類似している。見積理論は出発点であるが、本発明の範囲に対する制限と解釈されるべきではない。例えば、一般化のためにはノイズ項を以下の展開に明示的に使用することが含まれるが、それは本発明をノイジーなデータソースに限定するという意味に捉えられるべきではない。古典的な信号見積問題では、目的は、入力から信号構成要素のできる限り最も良好な見積を生成することである。見積信号をS’(ν)と表すと、作用は一般的にX(ν)−S’(ν)と表される。信号の見積を生成することにより、ノイズ構成要素の見積も生成される。
N’(ν)=X(ν)−S’(ν)
しかしながら、見積を生成するためにどんな処理操作を実行するべきかということは、まさに、どのように「最良」を定義し、信号及び雑音の特性にどんな拘束条件を課するかということに依存する。
【0045】
問題は、入力データの信号構成要素とノイズ構成要素の区別がつかないという可能性があるとき、又は信号若しくはノイズの非常に正確な定義が不可能であるとき(視覚画像のような複雑な情報ソースについては多くの場合がそうである)、見積処理は入力データの情報提供する内容のある部分を誤訳したり無視したりする可能性があるということである。これは、ある曖昧さが存在することを意味している。
【0046】
この起こりうる「誤訳」は、入力データ中のある相関関係が、信号構成要素又はノイズ構成要素に確信を持って割り当てられるのではなく、信号構成要素にも又はノイズ構成要素にも帰することがありうるために発生する。実際に、線形であろうがなかろうが、何れの信号見積処理も、信号とノイズに関する幾つかの事前予想又は定義及び幾つかの重み付け判定基準が与えられれば、入力中の相関関係が汚染ではなく情報を提供するメッセージである可能性がどれほどかということに則りそれらが重み付けされる処理として記述してもよい。
【0047】
この潜在的な曖昧さは、想定上の信号構成要素とノイズ構成要素の間の相関関係の項で理解することもできる。相関関係は振幅と位相相関関係の式でしばしば論じられる。入力データは、
X(ν)=|X(ν)|exp(iθX(ν))
と記され、ここに、|X(ν)|はそのデータの振幅スペクトルでθX(ν)は位相スペクトルである。同様に、
S’(ν)=|S’(ν)exp(iθS’(ν)) 及び N’(ν)=|N”(ν)|exp(iθN’(ν))
である。
【0048】
この公式は、入力データと見積との間の線形関係を仮定しておらず、処理方法に左右されない有効な算術記述である点に留意されたい。上の表記法を使用すれば、入力データ中の相関関係に関係するパワーは次のように表される。
|X(ν)|2=|S’(ν)|2+2|S’(ν)‖N’(ν)|cos(θS’(ν)−θN’(ν))+|N’(ν)|2
2乗された振幅スペクトルはパワースペクトルとして読み取られる。式は、入力パワーが、見積信号のパワーに見積ノイズのパワーを足し、更に残りのパワーを表す交差項(中間項)を加えた合計として表せることを示している。この残りのパワーは、互いに独立して見られる見積信号及び雑音によっては説明することのできない入力中のパワーである。ある意味では、それは、採用された信号及び雑音モデルに基づいては、信号だけ又はノイズだけの何れかに十分な確信を持って帰することのできないパワーを表す。それは、信号見積とノイズ見積との間の相関関係に起因する曖味なパワーであって、従って、入力データを信号又はノイズの何れかに割り当てるのに使用されるモデルの限界又は不正確度の尺度であると言える。
【0049】
本願での使用に限り、信号だけにもノイズだけにも確信を持って帰属させることのできない入力データの態様を、入力の「曖昧な」構成要素と呼ぶ。従来の信号及び雑音方法論では曖昧な構成要素は別のエンティティではなく、即ち入力データは信号及び雑音見積により完全に記述され、
X(ν)=S’(ν)+N’(ν)
である。曖昧な構成要素は、最も予測できない入力中の相関関係を差別的に表現したものである。曖昧な構成要素は、従来の信号及び情報処理では、それが、情報の信頼できるソースであることがあまりにも不確なソースデータの態様を表現していると考えられているので、一般に無視されてきた。入力データ中の曖昧な構成要素の重要性の認識に基づき、本発明では、入力データに関してある作用を実行することによりこの構成要素を表現する又は抽出すれば、他の信号処理方法に関係する問題の多くは回避及び/又は制御されうるということを認めている。
【0050】
このように、本発明は、信号及び雑音モデルを入力データの処理に活用すれば、各データは信号又はノイズ何れかに割り当てられることが必要となるので、処理中にエラーのソースが持ち込まれることを認識している。しかしながら、信号にもノイズにも割り当てられないある入力データパワー、即ち曖昧な構成要素が存在する。従来の処理スキームではこの入力データパワーは無視され、その結果入力データに含まれたある情報が失われる。しかしながら、本発明は、以前は失われたこの情報を抽出し、それを使用してデータの処理を改善するための方法を提供する。
【0051】
曖昧な構成要素を抽出するために入力データに関して実行される作用を求めるに当たり、出願人は信頼でき且つ効率の高い処理のために以前に確認された判定基準を拠り所とした。データの歪を最小化する最小数の仮定に基づいて方法を実行することにより、本発明は判定基準の全部ではないにしてもその多くを満たすことができる。更に本発明は、データの性質に対して最小数の仮定を課することが、歪をどのようにして最小化できるかということに直接関与することを認識している。
【0052】
(曖昧な構成要素の見積)
入力データの形態又は性質に関して最小数の仮定を導入するためには、入力データ中の幾つかの相関関係は他の相関関係よりも重要であるかもしれず、データが処理される前にはこのような特性記述に頼ることができる、という見解に戻ることが有益である。画像データでは、例えば、エッジをなめらかなぼかしよりもより際立つように取り扱うべきかどうかという照会である。エッジは知覚的により目立つ特徴であるというのは異論のあるところだが、しかしながら、エッジのコンセプトを処理方法に組み込むためには、エッジの特性を定義づけすることが必要である。これは、思うよりもはるかに難しいタスクである。画像中のエッジとして最も受け入れられそうなものは、通常、急激な繊維ではなくて狭い領域に渡る輝度又は色のぼかしである。無論、一定区域内で一定量だけ変化する特徴としてエッジを定義づけすることも可能ではあるが、これではぼかしが階段や傾斜の形態又は他の遷移関数を採るという事実を無視することになる。更に、エッジが必ずしも最も知覚的に際立つ特徴ではないという点にも気づくべきである。例えば、建物の画像ではエッジは重要であっても、夕焼け風景の画像の中ではそうではないかもしれない。最適な処理汎用性を保証するためには、ある画像内だけでなく異なる種類の画像の間でも有効である重要度の尺度を採用することが望ましい。
【0053】
ソースデータ中の遷移及び変化は、部分的には位相相関関係により定義づけ可能である。位相は、データの異なる部分間の関係と関連するので、絶対的メトリックではない。画像では、例えば位相情報は、ある特徴又は遷移が他のものに対しどの様に配置されているかを示す。このように、相関関係のセットを他のものよりも重要であると定義するためには、例えばカメラが向けられる所又はデータが認知される時といった基準点が必要とされる。しかしながら、複雑なデータソースに関しては、基準点を定義する方法が無いので、入力データは、特定の位相特性を有する傾向があり、入力データがランダムな外乱を含んでいる場合には特にその傾向が強い。例えば、フィルムの多重露出は、ある一定の画像特徴がカメラに関して特定の方法で揃うという見込みがないので、グレーぼけが生じる傾向が強い。
【0054】
このような訳で、仮定の数を最小化し汎用性を最大化するために、本発明は異なる種類の位相相関関係を同様の方法で処理する必要性を認識している。このアプローチの利点は、異なる種類の位相相関関係の重要度についての仮定を具現化する専用の処理操作が、他の可能な処理操作の型式に拘束条件を付けずに続いて実行できる点である。
【0055】
入力データのセットの位相特性への影響が最少となる処理方法は線形である。このような方法により必ず起きる位相歪は、既に認知されているデータに関してしか処理が実行されないという事実に派生するものでしかない。因果率の原理により許容された最小量の位相歪しか起こさない線形処理は、「最小位相処理」と呼ばれる。最小位相処理に関するより詳細な情報は、参考文献、ニューヨーク、ウィリー・アンド・サンズのクオ・FF(1966年)による「ネットワーク分析及び合成第2版」に見られる。
依然として画像についてであるが、時間が因子ではない純粋に空間的な場合、本発明の処理方法では位相歪がゼロになる。出力がリアルタイムで要求される時間的及び時空的な場合、本発明の処理方法は、このような処理の特性が信号処理の当業者には理解されているように、少なくとも最小位相処理にとっての判定基準には合致するであろう。データが処理前に保存される場合、位相歪に相当する遅れが発生するので、本発明の方法の位相特性は拘束されるには及ばない。因果率拘束条件を満たすために、ウィナー−ホップスペクトル因数分解の技法を使用して本発明方法の位相特性を定義してもよい点に留意されたい。ウィナー−ホップスペクトル因数分解に関する詳しい記述は、参考文献、ニューヨーク、ドーバーのピエール・D.A.による(1986年)「アプリケーションに伴う最適化理論」に掲載されている。
【0056】
望ましい処理操作は線形であるべきだとする結論は、それが入力データから信号及び雑音構成要素を見積る又は曖昧さを表現するために望ましいかどうかという問題とは別であることに留意されたい。このように、線形信号見積問題では見積信号は、
S’(ν)=W(ν)X(ν)
と記され、ここに、W(ν)は振幅スペクトル|W(ν)|と位相スペクトルθW(ν)を持つ処理操作を表す。同様に、
|S’(ν)|=|W(ν)‖X(ν)| 及び θS’(ν)=θW(ν)+θX(ν)
である。
処理中に起きる如何なる位相歪も本来的に信号処理問題とは何ら関係ないと認識されるので、非原因的ゼロ位相作用X’(ν)を推測することが可能となり、その結果、
S’(ν)=|W(ν)|X’(ν)
が生成され、ここに、X’(ν)=X(ν)exp(iθW(ν))である。
従って、有効なノイズ見積は、
N’(ν)=(1−|W(ν)|)X’(ν))
となる。
曖昧なパワー構成要素の大きさは、従って、
2|S’(V)‖N’(ν)|=2|W(ν)|(1−|W(ν)|)|X’(ν)|2
と表され、
|X’(ν)|2=|X(ν)|2であることに注意されたい。
【0057】
ある意味では何れの処理操作も信号見積処理と見なすことができるという事実にもかかわらず、処理操作を、サブプロセッサ又はプリプロセッサにより生成される信号或いは信号見積に関してタスクを実行する何ものかと捉えるのがより一般的である。信号見積の概念とタスクの概念の区別は、信号とノイズの従来の観方から派生するものである。
【0058】
図2は、本発明により入力データのセットXを出力Yへと処理する過程を示すブロック線図で、処理操作が2段階作用として表されており、本事例では信号見積作用と処理タスクを組み合わせている。図2aは、出力Y(ν)を生成するためにボックス200で表される処理操作のセットにより処理中である入力X(ν)を示している。図2bに示すように、ボックス200の処理操作はX(ν)=S(ν)+N(ν)について演算を行いて信号見積値S’(ν)を作り出す信号見積処理W(ボックス202)の後に、信号見積について演算を行いて出力Y(ν)=GfS’を生成する処理タスクGfを組み合わせたものとして表すことができる。
【0059】
見積段階(ボックス202)は、汎用型プリプロセッサであることを特徴としていてもよい。例えば、信号処理操作を実行する別々のプロセッサのある配列に入力されるデータは、単一の、共通信号見積処理、及び様々な作用に対して従位的な動きをする処理タスクの列の点から表すこともできる。
【0060】
多くの場合、入力データと見なされるものは、信号及び情報処理操作という観点においては信号見積と見ることもできるという点に注意されたい。例えば、写真のディジタル表現は、現実世界の実際の輝度とスペクトル構成要素の見積値と考えることもできる。本発明の範囲を、従来の観点で入力データがノイジーであると見なす事例に限定することを意図してはいない。信号見積という呼称は、情報を提供するソースを代表すると捉えられる何れのデータをも意味している。
本発明の1つの目的は、起こりうる何れの入力にも対応できるという観点で強力な方法で、入力データの曖昧な構成要素の表現を生成することである。先の式を曖昧な構成要素のパワーに当てはめて調べてみて、|X’(ν)|2=|X(ν)|2であることを認知することにより、本発明者は、線形作用が、
D’(ν)=U(ν)X(ν)
であることを認識したが、ここに、U(ν)は、
![]()
【0061】
何れの処理操作についても、示した通り、不確定処理は信号見積段階と処理タスクの組み合わせとして表すことができる。従って、U(ν)は、
U(ν)=W(ν)GU(ν)
と表すことができるので、
D’(ν)=U(ν)X(ν)=GU(ν)W(ν)X(ν)=GU(ν)S’(ν)
となる。
本願での用途に限り、GUは不確定タスクを意味し、それが表現する処理は、
![]()
不確定タスクの汎用性を最大化するため、他の位相特性が示した通りに適切であっても、それはゼロ位相又は最小位相特性を有する。
不確定信号D’(ν)は、処理操作により信号及び雑音モデルの暗示的又は明示的な義務に関係付けられる品質又は信頼度の簡潔な標示を提供する。そのポイントからポイントまでの値は、信号及び雑音計測に関連して起こりうるエラーの見積を提供する。その2乗平方値(又はそれに相当する値なら何れも)は、入力データのそれに対して判定され、見積処理の全体的な信頼度の測定を行う。不確定信号は、入力データの独立線形変換である。それは、信号又はノイズの表現から生成してもよいが、信号及び雑音見積を生成する必要無しに、入力データから直接に生成することもできる。視覚の場合を始めとして対象となる多くの場合、信号及び雑音見積は、必要に応じて、元の入力データの代わりに不確定信号の線形変換を介して生成することができる。このように、不確定信号は、入力データの1次的表現として、信号見積に代わるものとして使われる。この表現に対する利点は、入力データがより少ないパワーとより狭いダイナミックレンジで表される傾向にあるという点である。不確定信号の態様は、データ圧縮アプリケーションにとって有利である。
【0062】
図3は、本発明による、入力データセットX、処理関数W、不確定オペレータU、不確定信号D’、及び信号見積S’の間の関係を示すブロック線図である。図3aに示すように、入力信号X(ν)は処理関数W(ν)により演算されて信号見積S’(ν)を作り出す。入力データはまた、図3bに示すように、不確定オペレータU(ν)によっても演算が行われ不確定信号D’(ν)を生成する。この処理はまた、図3cに示すように、処理関数W(ν)と不確定処理タスクGUの組み合わせとしても表すことができる。この2段階アプローチには、信号見積と不確定信号の両方がその後の処理操作に利用可能となるという利点がある。不確定信号は、見積処理の出力に関して又はある信号の表現に関して演算を行うことにより入手できる点に留意されたい。
【0063】
不確定処理及び不確定信号は他にも多面的に使えるのであるが、不確定信号を処理操作の品質のインジケータとして使うこともできる。不確定処理は、例えば暗示的又は明示的な信号及び雑音モデルに関して何が最も予測不能且つ不確実かという意味で、最も一意的で予想できない入力の態様を差別的に報告する傾向がある。不確定信号は、普通の信号データよりもよりコンパクトで予測可能なダイナミックレンジを有する傾向があり、信号見積と同じ情報内容を保有する。それは、見積処理又は信号表現に予想される2乗平均エラーの尺度を提供する。それはまた、付加的な処理を必要とすること無く、入力データ及び/又は信号見積の位相特性の評価も提供する。
【0064】
通常、信号処理方法の設計では、特徴強調/抑調、圧縮、処理モニタリング、特徴検知又は抽出、位相抽出、ダイナミックレンジ最適化、送受信等のタスク、及び多岐にわたる制御処理が、別々の処理として扱われ、それぞれが入力データ上で特定且つ一意的な作用を実行する。しかしながら、不確定信号の特性は、このような処理タスクを統合し簡略化するために本発明の不確定処理がどのように作動するかを実証する。
【0065】
それは信号表現と同じ情報提供できる値を保有しているので、信号表現に関して実行されたであろう多くの処理操作を、情報提供可能な値の損失がゼロ又は最小の状態で不確定表現に関して代わりに実行してもよい。都合の良いことに、多くの場合、不確定信号は2乗平均値よりも小さく信号表現よりも有効なダイナミックレンジが狭いのが普通である。また、それはデータの単一的で不確定な態様を強調するので、分かりきったこと若しくは予測可能な構成要素の処理に向けるリソースはより少なくて済む。
【0066】
例えば、カラー画像の色彩情報は、赤、緑、青の輝度値を線形に組み合わせる従来の表現とは反対に、先ず不確定度の項で表現される場合、著しく目立った劣化無しに、より広い範囲に向けてサブサンプリングされる。加えて、不確定度を表現する本発明の方法は、入力データの特性について、特定のこの目的用の仮定を必要としない。このように、不確定信号に基づく処理操作は、不適切な予測に起因するエラーを引き起こしにくい。不確定信号が値のコンパクトで予測可能なダイナミックレンジと分布を有するという事実は、信号見積又は信号表現に関して一般的に可能であるとされるよりも、もっと効率的にそれが量子化されるということを意味する。実際に、ここに述べる量子化方法は、最小のエラーと典型的なヒストグラム方式に比較してより少ない量子化レベルとを備えた、量子化された不確定信号の点から、信号見積の情報提供可能な内容を表現する手段を提供する。
【0067】
不確定信号は暗示的に予測不可能な特徴を差別的に表現する傾向があるので、どの特色が重要であるか重要でないかを前もって決定する必要無しに、単純な算術的手法を用いて特徴を強調したり抑調したりするために使うことができる。同じ特性により、単純な閾値比較技法を使って、データ又は不確定信号自身から特徴が抽出できる。例えば、エッジ、コントラスト不連続、及び顔の両目などのより複雑な特徴は、エッジや目を構成するものを定義するには及ばず、閾値比較処理を画像の不確定信号に対して適用することにより、画像データから抽出することができる。単独でも組み合わせてもよいが、本発明の技法を使えば、データに類別、識別、操作、圧縮、符号化、送信、及び処理を行い、従来の方法より単純なやり方でエラーと情報損失を最小にしながら典型的な信号及び情報処理の目的を達成できる。更に、これらの技法は処理操作を制御しモニターするための新しいやり方を提供する。
【0068】
図4は、本発明の信号処理方法に則り、不確定タスク又はバイアスGU(ボックス400)により演算が行われて不確定信号D’を生成し、更に処理段階(ボックス402)に供され、その次にタスクGUの逆数により演算されて(ボックス404)信号の新しい見積S”(ν)を求める信号表現S’を示すブロック線図である。図に示すように、不確定信号D’(ν)は、処理された不確定信号D”(ν)を求めるために更なる処理段階に供される。この結果は、次にタスクGUの逆数(1/GUとして表される)により演算されて、新しい信号表現S”(ν)が求められる。
ボックス402で実行されるのに適した処理操作には、量子化、量子化解除、サブサンプリング及びあらゆるの形態のディザリングを始めとする解像力を低減させる他の手段、アップサンプリング及び補間法を始めとする明瞭な解像力を増大させる他の手段、DCT、FFT、及びデータを変換したり周波数ドメイン表現を形成する同様の演算、細波ベース及び他のコンボリューション処理、フラクタル型方法、PCM、ランレングス法、ハフマンコーディング、算術的コーディング、レンペル−ジブ型方法、Q−コーディングを始めとするコーディング及びデコーディング法、及びこのような演算又は方法のあらゆる組み合わせを例にあげることができるが、これらに限定する訳ではない。適当な処理操作には、永続的及び/又は一時的なデータ保存、保存ソースからの検索、送信及び受信も含まれる。
【0069】
処理操作に信号表現に代えて不確定信号を使うことの有利な点は、不確定信号のより低いパワーと、値のよりコンパクトで予測可能な歪と、データの暗示的に予想できない態様を差別的に表現する傾向とに関わりがある。例えば、画像処理アプリケーションでは、S’とS”の間の所与の2乗平均差異につき、不確定信号はより粗く量子化されS’よりもより広い範囲に向けてサブサンプリングされる。同様に、サンプリング処理では、線形、指数的、対数的、滴定様、又は類似の方法で、サンプリング速度又は密度を調整するために、不確定信号の振幅を使用することができる。不確定信号内の振幅と相関関係は、基礎関数の位置付けにとってのガイドとして用いてもよい。更に、例えば、圧縮処理で保存される基礎関数係数の数及び/又は値を制御するために、基礎関数の係数値よりむしろ又は係数値と結びつけて不確定信号の絶対値を使ってもよい。コーディング法は、予測可能な値の分布を有する不確定信号のようなデータに、より良好に同調する。その上不確定信号の送信に必要なパワーの量は、S’を送信するのに必要となる量よりも少ない。
【0070】
本発明は、入力データから信号及び/又はノイズを見積するために特定の位相特性が採用されている線形演算に限定されない信号処理方法を提供するということに留意されたい。入力データの属性に関して仮定を最小数とすることにより、出願人は、従来の処理操作が入力データに関してどのように信号及び雑音定義を課すのかを研究することができた。ある意味で、全ての処理操作は、処理操作によりバイアスされるので、処理の結果が特定のアプリケーションに対する入力データの重要な情報内容を表現する信号見積処理と見なすことができる。本発明の方法は、処理中に仮定が暗示的に与えられた場合、入力データを信号かノイズの何れかに結果として割り当てることの曖昧度がどのように表現されるべきかを明らかにした。
【0071】
本発明の方法の利点でもあり通常的でない特徴は、どんな種類の信号及び雑音モデルが処理において暗示的であるのかに関してどんな予断をも必要としないということである。所与の処理にとって、処理の元の設計者がどんな信号及び/又はノイズ特性を心に描いていたとしてもそれとは無関係に、それを任意の数の信号及び雑音モデルに関して翻訳することが可能である。本発明は明示的に定義された信号及び雑音モデルを必要としないという事実は、それが汎用的で強力であるということを意味する。
【0072】
しかしながら、出願人は、例えば、異なる処理、入力データ、信号表現、又は不確定信号を比べるために、本発明の方法を用いたいという状況があることを認識している。そのような場合、暗示的な信号及び雑音モデルを同じ判断基準により判定することのできる方法を持つことが有益であり、即ち翻訳の標準的方法により評価できる場合などである。言及した理由により、本方法はできる限り少ない仮定を作るべきである。それは又、可能性のある全入力に適応できるものという意味で強力でなければならない。
例えば、本発明が入力データや求められた見積信号等の情報に基づき処理関数W(ν)又はそれと等価なものを確定するための手段を提供し、そして本発明が所与の処理関数W(ν)又はそれと等価なものが与えられると信号及び雑音モデルを定義する手段を提供するというように、本発明が信号及び雑音特性記述のための方法を提供するのであれば、本質的に有益であると出願人は認識している。これにより、特定の信号処理システムにより実行されてきた「ブラックボックス」信号処理操作を、本発明の信号処理方法と互換可能な形式で簡潔に表現することが許容される。
【0073】
先に述べたように、信号構成要素を定義づけする能力は、信号がどのような拘束条件を受けているかを知ることに関係している。従来の信号処理方法では、このような知識は入力データを処理する前に入手されねばならない。しかし、画像ソースを始めとして多数のデータソースに関して、「信号」はあまりにも変わりやすいので精密な方式で定義づけできない。その場合には、信号を構成するものを仮定することが試みられる。その結果として起こりうる誤訳のひどさは仮定の妥当性に左右される。反対に、本発明は、特定の信号及び雑音モデルの含意を調べ、その情報を使って、入力データをより効率的に処理したり処理の態様を制御したりする。
【0074】
本発明による信号見積処理は、上に述べた理由によりできうる限り少ない仮定を作ることを意図するもので、これは即ち、処理法は強力に予想可能なもののみを具体化するのが望ましいということである。これは又、処理法は、何らかの特別な信号の特定のものよりむしろ信号のクラス上で作動するように設計されるべきであるということを意味する。これにより、本発明の方法が成功裏に適用される信号及び信号クラスの範囲が広がる。
データの何れかの特定セットについてもパワースペクトルは、
|X(ν)|2=〈|X(ν)|2〉+δ|X(ν)|2
と書き表され、ここに、〈|X(ν)|2〉は、総体平均パワースペクトルで、δ|X(ν)|2は特定のデータセットに対する総体平均からの偏差である。また、
|XS(ν)|2=〈|XS(ν)|2〉+δ|XS(ν)|2
であり、且つ
|XN(ν)|2=〈|XN(ν)|2〉+δ|XN(ν)|2
であり、それぞれ「信号」構成要素と「ノイズ」構成要素を示す。真のパワースペクトルがいつも正の値かゼロであるのに対し、上の式では、偏差の項は、正の値負の値両方をとる可能性があるということに注意されたい。総体平均パワースペクトルは、入力データの考えられる全てのセットに亘る平均である。それは、データのある特定セットの明細を提供しているのではなく、全体についての予想である。
同様に、あらゆるデータセットの観測された分散は、予測可能な構成要素と当該予測可能な構成要素からの偏差の合計であると見なしてもよい。
![]()
![]()
【0075】
総体平均分散は、理論上の予想値であるが、偏差はデータの特定セットに対する理論上の値と実際の値の差異を表す。ポアッソン処理は、例えば、処理の平均輝度と等しい理論上の分散を有するが、実際に観測される分散はたとえ平均輝度が同じであっても観測時間毎に異なる。
総体平均パワースペクトルと総体平均分散の間の関係式は、偏差の項に対して同様の式を用いると、

【0076】
入力データに一般的に関係するランダムさには2つの形態、即ち(1)|XN(ν)|2及び関連項で表されるあらゆるノイズ外乱というランダムさと、(2)δ|X(ν)|2のような項で表される期待値からの偏差というランダムさがある。偏差の項は、総体変動性を反映する。それらは、δ|X(ν)|2=0のときで信号が演繹的に完全に知ることのできると見なされるか、偏差があまりに予想外で演繹的に定義できないかの何れかの理由から、大抵は無視される。
【0077】
古典的な見積問題では、目的はノイジーデータの信号構成要素に対して最良な推測を生成することである。必然的に、推測は、何が予想可能であるかに基づいており、何が予想不可能な偏差であるかに基づくものではない。可能性のある全刺激(例:面や角パルス)の内の特定サブクラスに対して優先的取り扱いを与えることが必要とされる場合を除いて、信号及び/又はノイズ構成要素が特定位相特性を持つであろうことを現実には期待できない。従って、最も推定根拠の乏しい推測は、パワースペクトル(又は、相関関数のような関連関数)だけに係わる期待値に基づくもので、即ち、「信号」及び「ノイズ」構成要素は何らかの予測可能な相関関係を持つと仮定されるのではなく、信号及び雑音は特定の入力ではある範囲までは相関しないと仮定されるのである。本発明では、特定入力中の如何なる信号及び雑音の相関関係も、考えられる全ての入力の信号及び雑音の相関関係を予報するものではないと考える。従って、本発明は、何らかの特定の種類の信号及び雑音の相関関係を考えてはいない。このような条件で、見積処理関数は、
信号及び雑音が処理方法に左右されない客観的定義を持つ場合、ノイズにより乱された信号の見積を生成するために、この公式を有する処理操作を使うことができる。視覚情報を表現するデータを論じる際、発明者は、総体平均信号相関関係が、視覚データのソース中の統計学上安定した相関関係ではなくて、現実には画像処理の結果であることから、そのような処理を属性処理と呼んでいる。このように、フィルタの形態は算術的にはウィーナフィルタの形態に類似していても、信号及び雑音モデルの場合にこのようなフィルタ関数の使用の基礎になる仮定は、本例の状況では用いられない。本発明による信号処理では、ある信号及び雑音モデルを仮定してもよいが、しかしながら、本発明は当該モデルにより持ち込まれうるエラーの評価若しくは分析に着眼している。
【0078】
よく知られ、使われているように、ウィーナのフィルタリング処理は、信号及び雑音の特性が定義され演繹的に設定されていることが必要条件である。ウィーナフィルタ処理は、入力が予め規定された特性を有する信号及び雑音だけで構成されている場合にのみ適切であると判断できるであろう。これらの特性からいくらかでも外れるものは、ウィーナフィルタ処理を実行すると最適には不十分な状態になってしまうであろう。以上の理由により、カルマン型フィルタ及び入力中の変化に対応できる他のフィルタ型が、ウィナーフィルタリング処理に広く取って代わってきた。ウイーナフィルタの算術式は、それが処理操作中に暗示される最も推定の根拠に乏しい信号及び雑音モデルを評価するときの基準としての役目を負っていることから、本発明の信号処理方法の解説に出てくる。このように、それは、発明の不確定処理、タスク、及び信号を翻訳する際の標準規格としての役目も負っている。
【0079】
上述の処理関数は、パワースペクトル密度(特定周波数で評価されたパワースペクトル)に従って入力データに重み付けする。(パワー密度に関して考えたときに)ノイズ構成要素よりも信号構成要素に帰する傾向が強い入力データ中の周波数構成要素は、ノイズ構成要素に帰する傾向の強いものよりも減衰しにくい。属性作用はこのように、相対的に予想可能なパワー密度に関して等級分けされる。
一般的に、見積処理関数は、
|W(ν)|=[1+b2B2(ν)]−1
と書き表され、ここに、
![]()
b2B2(ν)は処理操作において暗示的に具体化される信号及び雑音モデルの最も推定根拠に乏しい特性記述としての役目を負うことに留意されたい。それは又本発明の方法に使われる最も推定根拠に乏しい信号及び雑音モデルとしての役目も果たす。
【0080】
上で与えられた信号見積処理関数を使うと、不確定処理関数は、
|U(ν)|=bB(ν)[1+b2B2(ν)]−1
又は、同等の形をとる。
同様に、不確定タスクは、
|G(ν)|=bB(ν)
又は、等価な形により特徴づけられる。
不確定信号の分散は、見積処理で予測される2乗平均エラーのインジケータである点に留意されたい。
信号見積処理のエラーは、
信号見積処理全体のエラーが、
視覚画像データは、本発明の方法を使って処理が行われるのに特に適した型のデータである。既に説明したように、従来の処理方法にとって難題を生み出す視覚情報の根本的な特性は2つある。第1に、視覚情報は実用上は拘束条件が無いということである。視覚データは、光により形成される時系列、空間パターン、又は時空シーケンスなら何であってもよい。多くの信号処理問題は、前もって定義された信号特性(例:搬送波周波数、レーダーシステムの送信パルス、アルファベット)を利用するが、多くの場合、視覚情報は特定の詳細事項で制御も事前定義もされないソースから発生する。視覚データは、連続した光子誘発事象として記録することしかできず、これらの事象は光度及び反射率のような共通パラメータに統計学的にのみ関連している。
【0081】
本発明は、そのようなデータを処理する際、幾つかの顕著な有益性、即ち
(1)視覚処理に予測されるエラーが低減される、
(2)データの重要な態様が、その目的だけのための仮定を課さなくとも、知覚
的に表現される、
(3)視覚情報が狭いダイナミックレンジと安定した統計性を有する簡潔な形で
表現される、
(4)適用及びエラー制御に適した信号が生成できる、
(5)本発明を実行するには比較的単純な装置が使用でき、それにより製造コス
トを下げることが可能となる、
(6)本発明は、曖昧さ、周波数内容、及び動作の表示を生成する、
という有益性を提供する。
【0082】
何れの配置の空間に分布する対象物の何れの集合に対しても、本質的に唯一確実なのは対象物の画像が画像面では異なる寸法になるだろうということである。関連するパワースペクトルは、画像化が線形現象であるから直線的に合計され、複合スペクトルは、より遠くの対象物がより近くの対象物よりも低周波数に対しての寄与が少ないので周波数に伴い低下しがちになる。考えられる全対象物の考えられる全配置に亘り積分すると、総体平均複合パワースペクトルは、周波数座標の2乗値の逆数に伴い低下する結果になることが分かる。このようなパワースペクトルは、スケール不変パワースペクトルと称される。空間的相関関係につき上に述べた主張は相対運動に合わせて容易に変更され、その結果、時間ドメインでもスケール不変となる。
【0083】
画像の統計上の特性についての研究が、フィールド・D.J.(1987年)によるJ.Opt.Soc.Am.A.第4巻2379−2394「自然画像の統計特性と大脳皮質細胞の応答特性の間における関係」、並びにドン・D.W.、アティック・J.J.(1995年)による神経系の計算第6巻345−358「時間により変化する自然画像の統計」により報告されている。これらの研究は、自然に発生する画像の特性と画像シーケンスに焦点を当てた。彼らは、個々の自然画像の大多数が大凡1/周波数の振幅スペクトルを有することを発見した。しかしながら、出願人はここで、多数のグラフィック画像と人工物の画像が、1/周波数特性を持っていないことを見出した。しかしながら、強力な処理を推し進めるに当たり、ここに説明する本発明の方法は、個々の入力の特異事項ではなく入力のクラスに着眼している。出願人は、クラスとして、画像の総体平均振幅スペクトルが1/周波数特性を持つことを発見した。
【0084】
更に、例えば人工物の画像のような画像のサブクラスに関しては、たとえ個々の画像が総体平均とは著しく異なっていても、サブクラスに対する総体平均振幅スペクトルも1/周波数特質を有する。クラスとしての画像に対する1/周波数特性の適用可能性は、画像を形成するという処理の結果であると考えることもできる。
【0085】
一般的な意味において、視覚画像は、3次元(3−D)環境からの光の2次元(2−D)集積である。その環境自体内の対象物は、お互いに対する予想可能な又は総体平均統計的関係を有しないが、投影の作用により予測可能性が生まれ、即ち遠くの対象物は近くの対象物よりも、より小さな画像に対応し、検知器を通過するのにより時間がかかるということである。この積分は、3−D深度を2−D画像に圧縮する結果であり、これは1/周波数2パワースペクトルにより周波数ドメインに記述される。視覚画像に1/周波数2パワースペクトルのモデルを使うと、発明のモデルの項B2(ν)はν2に等しく設定される。特別な場合、b2は1に等しく設定され、処理関数は、
W(ν)=1/(1+ν2)
という形をとる。
【0086】
上の属性処理特性の周波数依存性は、A+ν2という形の何れの信号及び雑音モデルにとっても当てはまり、ここにAは定数である。
不確定フィルタU(ν)は、
U(ν)=ν/(1+ν2)
という形をとる。
Aを定数として、A+ν2の形の信号及び雑音モデルに当てはまるより一般的な表現は、
W(ν)=W0[α2/(α2+ν2)]
と書き表され、ここにW0は、A=0のとき1の値を持つ倍率である。パラメータα2はb2に関係し、W(ν)が半−最大振幅を有する周波数を求める。
対応する不確定処理関数は、
![]()
当業者は、本発明の内容から、不確定タスクの対応する関数特性を評価するであろう。
【0087】
光子捕捉のランダムさが主要な関心事である場合、又は入力データがポアッソン処理を表現している場合、α2は光度(ポアッソン処理の事象の平均速度)の線形関数であると考えられる。固定ノイズレベルが主要な関心事である場合、例えば、トランスジューサ又はセンサーノイズでは、α2は光度の2乗の関数であると考えられる。一般的に、α2の値は不確定信号のr.m.s.(2乗平均)パワー相当を入力のr.m.s.パワー相当に比較することにより求められる。本発明の方法は関心の対象であるノイズが周波数に半比例する予想可能なパワースペクトルを有する場合まで拡張することができる点に注意されたい。この種のノイズはしばしば電子増幅器で観測される。
【0088】
上記本発明の処理関数のハードウェアの姿は、リアルタイム処理用の回路の形であってもよい。最小位相属性処理は、単極ローパスフィルタの同一2段階処理として実行してもよい。不確定処理は同様の方法で実行してもよく、W0=1のときは特に直接的である。
【0089】
空間データに関しては、属性処理は、αが半径長定数を表している送信ラインの2次元相当物として実行してもよい。そういうものとして、それはセンサーに組み込んでもよいし、別個に手段化してもよい。2次元送信ライン相当物は、メッシュの抵抗エレメントとしての手段でもよい。メッシュのノードは、共通基面への抵抗経路を有するべきである。このような手段の有効半径長定数は、メッシュ内の抵抗又は基面経路の抵抗或いは両方を修正することにより制御される。抵抗修正は、電界効果トランジスタ又は類似デバイスを電圧制御型抵抗器と調和するモードで使用することにより実現される。
【0090】
プログラム可能な装置に実装する場合は、本発明の方法に合わせたディジタルフィルタリング係数を求める形式を採る。代わりに、FFT表現に匹敵するデータ配列を構成し算術的組み合わせで使用してデータを処理してもよい。逆FFT表現の関数記述及び/又は相当物もコンボリューション演算に使用できる。ディジタル計算装置では、ν−1を整数値配列のFFTの絶対値の平方根の逆数として近似することが、時として計算上効率的で有利である。1次元データ用の有用な配列は[・・・−12−1・・・]であり、ここに省略符号は何れかの数のゼロ値エントリを表す。2次元データ用の配列の有用なセットは、
但し、a>0で、周りの省略符号は任意の数のゼロ値エントリーを示す。1次元と2次元の両方の場合、1掛け3及び3掛け3それぞれよりも大きい非ゼロ値の配列も使用できる。説明した型の近似値を使って、例えば逆FFTの手段により、コンボリューション演算に相当するものに使用するための値の配列を生成してもよい。コンボリューション演算の計算効率は、当該値を量子化すること及び/又はコンボリューション配列の非ゼロエレメントの数を制限することにより、顕著な処理エラーを発生させることなく向上させることができる。
【0091】
視覚画像データの処理では、入力の不確定信号と位相特性との関係が、本発明の有益性を実証する。不確定信号は、本質的に情報を入力の位相中に保存し、その使用効果を単純な信号見積以外にも拡張する。信号構成要素の線形変換はどんなものでも、不確定信号を適切な線形フィルタ又は同等物に通すことにより見積ることができる。非線形変換は、信号見積から生成されるのと寸分たがわない品質を保って不確定信号から生成できる。このように、不確定信号が後続の処理操作を排除又は制限することはない。代わりに、不確定信号は、任意の数の特定演算が並行して実行できる、有用なコア信号の役目を負う。本発明に従えば、不確定信号は従来のソース輝度に代わって視覚処理における主要信号と見なされる。
【0092】
視覚データの特定セットだけにある特徴のほとんどは、その位相スペクトルにより表される。振幅スペクトルは、全体的な相関関係を、それらがどこでいつ発現するかに関係なく表現する。位相スペクトルは、全体の相関関係に関係なく、特定の特徴の位置と時を表現する。
【0093】
視覚データ内の全体的相関関係は、予想可能なパワースペクトルに関して表現されてきた。何れの特定のデータセットについてもそれに固有の詳細事項は、従って、位相スペクトルと総体平均からの特定パワースペクトルの偏差により余すところ無く表現される。これらは、不確定信号に寄与する構成要素である。ある意味では、視覚データ又は他のデータにとっての不確定信号は、入力の位相特性の見積を表している。しかしながら実際の白色化処理と違い、不確定信号は総体変動を示す入力の態様をも表すので、不確定処理は位相特性の真の表現を生成しはしない。
【0094】
視覚処理における本発明の1つの利点は、不確定信号が、一般的なデータセットから特定のデータセットを最も区別しそうな入力データの態様を強調することである。これは、固有の特徴というのは人間の視覚系が最も敏感に捉えるところであるので知覚的強調である。本質的には不確定信号は入力データの詳細を強調し、ある態様では本発明はこのように詳細強調の方法と考えてもよい。
他の視覚処理方法で問題になってきたのは、視覚データの拘束条件の欠如である。生物学的視覚性能に関するその目的のためだけの仮定は、知覚的に何が重要で何が重要でないかに関して作成されねばならなかった。本発明の方法は、このような仮定を採用せずに、特徴を強調するので、このような仮定に起因する不都合やバイアス効果を受けにくい。
【0095】
不確定信号は詳細を差別的に表現するので、見積信号構成要素の知覚的品質を向上させるために使用することもできる。見積信号の予測可能な構成要素のパワースペクトルは、
〈|X’S(ν)|2〉=|W(ν)|〈|XS(ν)|2〉
と書き表されることに注意されたい。
曖昧なパワーの予測できる構成要素は、
〈|D(ν)|2〉=(1−|W(ν)|)〈|XS(ν)|2〉
と記される。
従って、それらの合計は、
〈|X’S(ν)|2〉+〈|D(ν)|2〉=(|XS(ν)|2〉
と書き表せる。
別の言い方をすれば、不確定信号のパワーは、信号見積処理における予測可能なエラーの測定値を提供する。
【0096】
視覚処理のための本発明における別の利点は、不確定信号が信号見積の周波数内容を増強する手段を提供することである。不確定信号を信号構成要素の見積に加えることにより、コントラストのくっきりした不連続のエッジや区域等の知覚的に目立つ特徴が先鋭になる傾向にある。減算は逆の効果を持ち、それらの特徴をぼやかす方に進む。減算技法は、解像力の低い画像に表れるボケを目立たせないようにするのに役立つ。加算技法は、ぼやけた情報源をはっきりさせる際や例えば顔等の美的感覚上の操作に有効である。このような画像処理操作が本発明の方法を使って実行するのが容易であることは、本発明の重要な利点である。通常、このような操作には、本発明により可能となる単純で効率的な加算減算ではなくて、バンドパスフィルタ、ハイパスフィルタ、ローパスフィルタ、又それらに匹敵する物を使用する必要がある。
【0097】
(データ量子化)
本発明は、従来型の信号及び雑音モデルを採用することにより発生する処理エラーを低減させるための技法を提供するのと同じく、データを量子化するより効率的な方法を開発するために使うこともできる。本発明のデータ処理方法の基礎となっているのと同じ原理を考えれば、従来の方法の多くの欠点を克服する量子化スキームを開発できるようになる。
【0098】
量子化という用語は、ここでは、本来継続している不確定信号を離散信号に変換する処理を指すのに使う。それは本質的にはアナログーディジタル変換であるが、離散出力を2進形式に変換する必要はない。本発明の量子化方法は、コンセプトが先に述べた属性法に類似している。これは、元のものとの統計的に予想できる差異が最小になるように不確定信号の離散バージョンを生成するので、それにより本発明の基本的仮定と調和する量子化処理を提供することのなる。
【0099】
ここに述べる出願人の量子化方法は、視覚ソースを表すデータに限定されるのではなく、値がどのように分布しているデータを量子化するのにも使うことができる。量子化は、予め規定された量子化レベルを有するという意味では固定されたものかもしれないが、説明する方法は時間経過につれて値の分布に起きる変化に対応するためにも使える。視覚データについては、不確定信号が(総体平均という意味で)ラプラシアン確率分布を持つであろうと期待すること、及びその期待値に従い量子化レベルを設定することに対して、この方法はしばしば有益である。量子化法は、反復的に、即ち元のデータが量子化され、量子化された表現が次に元のデータ又は更新されたデータのセットと比較され、量子化されたデータと基準データの差異がまた量子化されるという具合に用いられる。ソースデータは、量子化を連続的に反復させて合計することにより近似される。この手順はビデオのような時空データに有用である。
【0100】
本発明の量子化方法を理解するには、3セットのパラメータ、即ち,(1)状態境界、(2)状態数、(3)状態値、が必要であり、これらは翻訳値と称される。状態境界のシーケンスペアはビンのエッジを定義する。ビン内の全ての値には状態数が割り当てられる。状態数は、N個のメンバーを有する整数系列を形成し、ここにNは状態の総数である。不確定信号を「ビニング」処理すると、N個の可能な状態を有する離散バージョンとなる。状態数もまたN個であるが、それらは必ずしも整数系列を形成するわけではない。代わりに、それらは量子化の全体的なエラーを最小にするように定められる。状態数は、状態値と状態境界に対してのインデックスである。
【0101】
![]()
![]()
(1)エラーを最小化する状態境界のセットを見つけること、及び
(2)エラーを最小化する状態値のセットを見つけること、がある。
状態境界の選択は、隣接し合うビン(状態)両方に関係するエラーに影響を及
【0102】
状態値は、それ自身の状態に関係するエラーに影響するだけである。微分を使うと、適切な状態値はdp(d)のビンに亘る積分をp(d)のビンに亘る積分で割った値に等しくなる。
ラプラシアン分布に関し、状態値は
![]()
【0103】
ラプラシアンのように指数関数はスケール不変性のソートを表示する。任意のの点δnから∞までの関数の形状は、ゼロから∞までのものと全く同じであり、
![]()
![]()
【0104】
視覚データが離散化される通常の手段には、輝度のA/D変換が含まれる。良品質の画像を求めるなら、採用される状態の数はしばしば256又はそれ以上となる。入力データに代えて不確定信号を量子化する本発明の方法の有利性は、2乗平均エラーに関して判定されるのと同程度の品質が著しく少ない状態(8乃至16が典型)で得られることである。これにより、記憶容量要件が大幅に低減される。
本発明における量子化法の別の利点は、入力データの知覚関連の態様は不確定信号の大きな値と関係する傾向にあるという事実に由来する。量子化されたバージョンは、従って状態値によりソートされるため、情報は保存されるか、又はほぼ知覚的重要度の高い順に送信される。これは、効率的な画像認識、及び最小セットのデータの記憶、送信、操作を暗に意味する。視覚データが離散形態で従来式に記録される先行技術の方法では、このような有益性を享受できない。
【0105】
量子化のエラー(元のものと量子化されたバージョンの差異)も、ラプラシアン分布を有する傾向となることに注意されたい。これは、当該方法が入力データの保存されたバージョン上、又は時間経過に伴い変化する入力データの空間配列上で再帰的に使用される場合、それが何らの追加的な努力又は拘束無しに量子化された情報の品質を継続的に更新することを意味する。
量子化処理過程に関して更に述べると、不確定信号から状態数の離散バージョンへの変換は、それらの状態数を状態値で翻訳することとは無関係である。これは、状態数表現が状態値表現の変わりに記憶されたり送信されたりするということ、即ちダイナミックレンジ要件は、元の不確定信号又は入力データ何れかのパワー又は範囲ではなく、状態の数により設定されるということを意味する。状態数表現のレシーバーは、元の不確定信号の最小エラーバージョンを得るためには、既に知られている状態値を用いるだけでよい。
【0106】
本発明による量子化の効率は、不確定信号又は他の入力を量子化前にその分散の見積により正規化すれば、改善することができる。これは、翻訳値が、個々にではなくグループとして縮尺されるようにしている。状態境界が入力中の変化に自在に対応できる場合、「検索時間」も短縮される傾向になる。ラプラシアン分布を有すると予想されるデータについては、データの分散をデータの平均絶対値から見積り、それにより計算上更に強烈な二乗演算を回避することもできる。
【0107】
(発明の一般的適用)
先の例に関する説明は、視覚データの処理に関する本発明の適用に重点を置いているが、本発明は適用に関して三つの主たるクラスを持つと記述することができる。即ち、
(1)異なる信号処理スキームの有効性について、評価し比較できるようにするための価値の数量を生成するクラス、
(2)信号処理操作の実行を適応させ、変更させ、又は制御するのに用いられる制御項を生成するクラス、
(3)データ記憶装置要件を低減したより効率的な計算方法で次の分析を実行するために、別の信号処理操作が適用可能であるような、処理されたデータの中間形態としてのクラス。本発明を用いるこの形態は、別のものとの間でのデータ送信及び圧縮操作を容易にする。
【0108】
図5は、信号処理操作をモニターする目的で価値の数量を生成するための本発明の利用を示すブロック線図である。図5aに示すように、本発明のそのような適用においては、見積信号S’(ν)を生成するために入力データX(ν)のセット上で実行される信号処理操作は「ブラックボックス」(図では「処理」と表示してある)により特徴付けられる。入力データ及び見積信号は共に、一般化された周波数空間での関数又はデータセットとして示される。
【0109】
本発明のこの実施例では、入力データXは不確定処理Uにより処理されて不確定信号D’を生成し、次に不確定信号D’は一つ又はそれ以上の処理モニターへ入力される。代わりに、図5bに示されているように、D’は信号見積又は表示S’から入手し、不確定タスクGuにより演算してもよい。信号見積又は表示は単独で存在してもよいし、あるいは属性処理Wを用いて入力Xを演算することによって生成してもよい。
【0110】
処理モニタリング操作は、絶対値、量子化値、累積値、又はD’の二乗平均パワーのようなD’を表す値を定義された値又は関数のセットと比較する段階と、FFT変換のようなD’の変換を表す値を定義された値又は関数のセットと比較する段階と、D’における変化を表すデータを細波関数又は別の基礎関数のような定義された関数のセットと比較する段階と、D’と定義された値及び関数との間で、ある関係が満たされる場合、記録、インジケータ、又はアラームを作成する段階とを含む。
【0111】
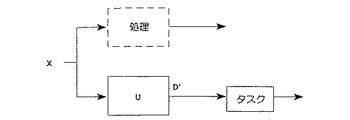
図6は、追加処理操作の適用の代わりに信号表示を用いるため、本発明の不確定信号が、中間形態の処理データとしてどのように用いられるかを示すブロック図である。図6aに示すように、通常は処理に提供される(図では「処理」と表示してある)入力データXが不確定処理Uにより演算されて、不確定信号D’を生成する。不確定信号は、次に一つ又はそれ以上の処理タスク操作へ入力される(図では「タスク」と表示されている)。若しくは、図6bに示すように、D’は信号見積S’から入手され、次に不確定タスクGuにより演算される。信号見積又は表示は単独で存在してもよいし、あるいは属性処理Wを用いて入力Xを演算することによって生成してもよい。
【0112】
図5と結びつけて示されているこれらの可能なタスクに加えて、別の処理タスクは、一定範囲内のD’値だけが通過して出力するような閾値操作と、翻訳及び回転操作と、美的効果を得るために画像データへ適用される歪を変形又は投影するような形態変換と、量子化、閾値及び周波数選択法などの方法を用いる特徴抽出と、特徴強調及び抑調と、二乗平均正規化と、そのような操作又は方法の組み合わせとを、これらに限定することなしに含むことができる。
【0113】
図7は、本発明に従って不確定信号が、処理及び/又は処理タスクの操作を制御するためにどのように用いられるかを示すブロック図である。図7aに示すように、入力データXはプロセッサ(図では「処理」と表示されている)により実行される一式の信号処理操作のセットに供され、不確定処理Uにより演算されて、不確定信号D’を生成する。不確定信号は、制御信号としてプロセッサに提供される。プロセッサは、一つ又はそれ以上の処理タスクと結びつけて属性処理を実行してもよいし、あるいは別々の属性及びタスク段階へ分割されなくてもよい。代替として、図7bに示すように、不確定信号は次に不確定信号は不確定タスクGuによって演算される信号見積S’から得てもよい。信号見積は単独で存在してもよいし、属性処理Wを使って入力Xを演算することにより生成してもよい。いずれの場合でも、D’は制御タスクGcにより選択的に演算される。
【0114】
不確定信号又はその後の制御タスク表示は、処理又は処理タスクの選択と、データがサンプリングされるか又はコード化される速度と、データが強調されるか又は抑調される量と、型、密度及び拡散のようなディザリング特性の選択と、分散又は二乗平均パワーの正規化のような手段による処理のいずれかの段階における信号のダイナミックレンジと、解像度の低下又は増強の量及び/又は種類と、JPEG、MPEG、フラクタル及び細波ベース法のような圧縮スキームで保持される数及び/又は種類又は係数と、データに適用されるべき量子化の規準又は閾値レベルと、属性処理の特性と、又はそれらの操作のいずれかの組み合わせとを制御するために用いられる。
【0115】
制御タスク操作は、二乗平均値D’及び/又はS’及び/又はX’を表す信号を生成するための手段と、整流と、量子化と、閾値化と、ローパス、バンドパス及びハイパスフィルタリング法と、そのような操作のいずれかの組み合わせとを、これに限定すること無しに含むことができる。
【0116】
図8は、処理及び/又は処理タスクの操作を制御するために本発明の不確定信号が用いられる第二方法を示すブロック図である。図8a及び8bと図7a及び7bとの違いは、図8では、不確定信号が、不確定信号上で実行される演算を制御するのに用いられるという点である。
【0117】
図9は、データ強調及び抑調を実行するために、本発明の信号処理方法がどのように用いられるかを示すブロック図である。図9aに示すように、一般的には信号見積又は信号表示である入力データは不確定タスクGuへ提示され、次に定数Aにより縮尺される。その結果は元の入力データに加えら、出力を生成する。図9bは同じ処理を示すが、等価な二つの不確定タスクを直列に有している。定数Aは固定していてもよいし、ユーザー又は外部処理により制御してもよい。
【0118】
図9aに示す方法は、入力データの独特で不確定な特徴を入力データへ選択的に加えるか又は減じて、それらの特徴を強調又は抑調する。図9bに示されている方法は、入力データの事前処理の間に持ち込まれた可能性のあるエラーを補償する手段を提供する。
【0119】
定数Aの値は、実際のアプリケーションではプラス1からマイナス1の範囲内で十分だが、正の無限大から負の無限大までの範囲にある。Aの正値は強調を生成し、負値は抑調を生成する。
【0120】
音声データに適用される場合は、抑調は音を消し、及び/又はヒスを減じる傾向となり、一方強調は逆の効果を有する傾向となる。画像データに適用される場合は、抑調は、ボケ又は平滑さとして感知される傾向があり、一方強調は画像鮮明化及び対照強調として感知される傾向がある。ユーザー又は外部処理により(A)が設定されると、望ましい知覚条件を達成するために、出力のダイナミックレンジ又は二乗平均パワーを制御する手段が提供される。
通常は、強調及び抑調、又は平滑化及び鮮明化の連続する範囲を完成するためには、フィルタ又はコンボリューション法の特性が継続的な方法で調整される必要がある。本来ならば、強調/抑調の各レベルにそれぞれ別のフィルタが必要である。これと対照的に、本発明の方法は、スカラーマルチプライヤを調整することにより同じ効果を達成する。
【0121】
図10は、予め存在しているか又は仮定の信号又はデータの処理操作(図では「処理」と表示されている)から不確定処理を構成するための本発明の信号処理法の利用を示すブロック図である。図10aに示すように、処理の入力及び出力は、入力/出力解析ブロック(I/0解析)へ供給される。入力は又、不確定処理Uによって演算される。若しくは、図10bに示すように、不確定処理及び/又は不確定タスクの特性がI/0解析の結果によって決定される場合は、出力を不確定タスクGuにより演算してもよい。通常は、不確定処理又はタスクによる入力データのそうした実際の処理は、コンボリューション、ディジタルフィルタリング又は周波数ドメイン表示によって行われる算術演算により、プログラム可能な装置で実行されるものである。随意的に、ユーザー又はデータベースシステムのような外部処理は、縮尺及び処理タスク情報をI/0解析方法へ提供する。
【0122】
処理操作の出力がある非線形なやり方で入力データの特性に依存する場合、先述の方法は、処理方法及び関連する曖昧さを特徴付ける手段と同様、入力、出力及び処理方法の間の関係における固有の曖昧さを定量化する適応性のある手段を提供する。例えばマルチプレクシングシステムにおける場合のように入力データが幾つかの異なるソース又は前の処理操作から引き出される場合、本方法のこの特性が利点をもたらす。通常、処理方法は、可能な入力の範囲に許容されている自由度を包含するように設計され、実行されなければならない。多くの場合、入力の範囲及びそれらの自由度は、処理効率の要件を満たすために制約されなければならない。これと対照的に、本発明の方法の利点は、処理モニタリング及び制御に用いられる不確定信号を提供することにより、そうでなければ入力及び処理操作の設計において必要となる厳しい拘束を減じるという点にある。
【0123】
図11a及び11bは、本発明の方法に従って、処理スキームのI/O分析に基づいて不確定フィルタU(ν)及び不確定タスクGuを決定するために実行される主な信号処理段階を示す流れ図である。図11bに示すように、図10a及び10bに関して述べられているI/O解析を、不確定タスクを構成するのに必要な情報を提供するのに用いることができる。これは、属性処理及び不確定処理を構成するのに必要且つ十分である。
【0124】
縮尺定数A及び有効入力/出力応答関数|F|の振幅スペクトルの見積に相当する情報は、不確定タスクを定めるのに十分である。随意的に、既知又は予測される処理タスク|Gf|の振幅スペクトル記述に相当する情報が供給されてもよい。|Gf|が利用できない場合、一般化周波数の全ての値に対して値1を設定するとよい。
【0125】
入力データ及び見積信号が与えられると、処理関数F(ν)は、図に示されているように|F(ν)|=|Y(ν)|/|(Xν)|で決定される。次に処理タスク関数Gf(ν)が仮定されるが、F(ν)=Gf(ν)W(ν)及びW(ν)は一般化された信号翻訳関数である。先述したように、すべてのνに関して0≦1Gf(ν)|≦|F(ν)|という制約を有するGf(ν)は、平滑化オペレータであるか、又は重み付け関数の別の形である。次に、信号翻訳関数に関する続く項は
|W(ν)|=|F(ν)|/(A|Gf(ν)|)
となる。
A=max(|F(ν)|)/max(|Gf(ν)|)
と設定すると、縮尺定数Aは最大|W(ν)|<1の条件を満足させるように、必要に応じて調整される。
【0126】
次に、図11aに示されているように不確定処理関数|U(ν)|関数は、
(|W(ν)|(1−|W(ν)|))1/2
から得られる。図11bに示されているように、不確定処理タスクGuは、I/O解析の結果として
((1−|W(ν)|)/|W(ν)|)1/2
からも形成することができる。
【0127】
|U(ν)|及びGu(ν)に関する表記は、それぞれの処理の位相特性を規定しないということに注目されたい。静止画像の場合のように入力及び/又は出力データが一つのアレイ形式を取る場合、及び、処理を待つ間に入力及び/又は出力データがバッファに記憶される場合、これらの関数はゼロ位相特性を有するのが適切である。そのデータがリアルタイムで(又はそれに近く)処理されるのが望ましい場合に、関数が、最小位相フィルタとして知られるフィルタのクラスを特徴付ける位相特性にできるだけ近い位相特性を有することが望ましい。そのようなフィルタの手段は、関係分野の当業者には既知であり、スペクトル及びセプストラム分析に関連した方法を含んでいてもよい。
【0128】
|F|を見積もる際には、幾つかのアプローチが用いることができる。議論の余地はあるが、最も簡単なアプローチは、入力及び出力データの記憶されている例のスペクトル見積から、又はスペクトル見積の幾つかの例から導き出される平均から、|F|を見積もることである。
【0129】
図11aと11bに関して述べられているI/O分析を行えば、信号処理操作のブラックボックスに固有の信号対雑音特性の表示が得られる。それは、ある状況下では、従来の定義及び処理方法に基づく信号対雑音比よりも、より簡単に決定できる。
【0130】
入力データX(ν)にU(ν)を当てはめると、F(ν)で表されている処理関係の曖昧な構成要素(D’(ν)と先述されている)が得られる。これは、入力データから信号見積を抽出するために用いられる処理操作の質を示す価値の数量である。同様な価値の数量が、多数の可能な処理操作に関して決められ、どの操作が、ノイズモデルに課された信号から生じる処理スキーム内のエラーを低減しながら入力データを処理するかを決定するために比較される。
【0131】
画像処理における本発明の別のアプリケーションは、画像をブロックのセットへ分配し、各ブロックにおける可能な画像処理操作の各グループの有用性を比較するために不確定表示を用いることである。このことにより各ブロック毎の「最適」処理操作の選択が可能となり、それによって画像データを強調又は訂正する別の方法が提供される。
【0132】
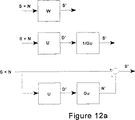
図12は本発明に従って属性処理、不確定処理、不確定タスク、及び関連する逆処理を実行する方法を示すブロック図である。属性処理、不確定処理及び不確定タスクの間の関係が、本発明の有用性を得るのに使われる処理スキームにおける十分な程度の柔軟性を提供するが、これは、いずれの処理又はタスクも自身以外の二つ及び/又はそれらの逆数を使って得ることができるからである。図に示されている操作の順序は、唯一可能なもの、又は望ましい最終結果を提供するものではないことに注目されたい。示されている一連の操作はほとんどのアプリケーションに好適ではあるが、修正も可能である。
【0133】
本発明は、図示されている一連の操作を実行する場合に、幾つかの利点を提供する。プログラム可能な装置で実行される場合、処理関数は離散周波数ドメイン表示、ディジタルフィルタ係数及び/又はコンボリューションマトリックスのような形で表示される。そのような二つの表示を記憶するために必要な記憶スペースは、三つの表示全てを記憶するのに必要なものよりも少なくて済む。更に、他の手段によって処理の一つが実行されると、通常、有意な中間結果が形成される。
【0134】
例えば、属性処理Wを得るためにU及びGuを用いると、信号見積S’に加えて不確定信号D’とノイズ見積N’が生成される。この場合及び類似の場合、S’を生成するために用いられる追加段階は、従来の多くの信号処理スキームにおいて必要なコンボリューション作用又は相当する作用に比べて簡単なので、計算リソースの節約になる。例えば、D’はS’及び/又はN’を生成するのに十分な情報を提供する内容を含んでいるので、データ記憶装置要件が減少される場合もある。従って、この場合、S’を生成するために次の操作用に記憶しなければならないのはD’だけとなる。一つの処理を他の二つの手段によって実行すると、他の中間処理が挿入できるか、又は並行して実行できるようになる。例えば、U及びGuによってWを実行する場合、中間結果D’は、コーディング/デコーディング、解像度低減、圧縮、量子化/量子化解除、送信/受信、記憶/検索、又は類似作用の何れかの組み合わせのような別の処理操作に供せられる。
【0135】
また、中間結果は、処理のモニタリング及び/又は制御に用いるために抽出することができる。このような実行に関するモジュール式の方法の別の利点は、何れか一つの処理の実現可能性に関わる問題を回避するために使うことができるということである。例えば、属性処理の特定の例を直接構成することは不可能か又は恐らく全く効率的ではない。そのような状況は、プログラム可能な装置内に、丸めの誤差及び/又はゼロによる除算問題が生じる場合に起こり得る。ハードウェアでは、位相と振幅両方に関して適切な応答プロフィールを有する処理を実行することは難しいとされているが、一方で、別の処理又はそれらの逆の処理だとより簡単か又は効率良く実行できる。その場合、モジュール式方法は「手際のよい」解を提供する。
【0136】
一例として、二次元画像を表すデータに関する不確定処理は、完全には有効に実行されない。しかし、適切な属性フィルタが、二次元送信ラインに相当するものとして構成され、画像センサーに組み込まれる。従って、不確定処理は、属性処理、次にGuを実行することにより行うことができる。Guは、空間微分法で効率良く解答がされる何れかの手段により実行される。代りに、UはW及び1/Guによっても得ることができる。この例では、Guは、属性処理よりも少なくとも何倍か長い特性ラジアル長定数を有する、別の二次元送信ラインに相当するものを使用することによって近似し得るし、又はアキュムレーターのように空間積分で効率の良い別の何れかの処理により実行することもできる。
【0137】
図12aは、S’を生成するために、入力S+Nを演算する属性処理を実行する二つの代表的方法を示す。一つの例では、Uが入力を演算してD’を生成し、次にD’は1/Guで演算されてS’を生成する。別の例では、Uが入力を演算してD’を生成し、次にD’はGuに演算されてN’を生成し、N’は次に入力から減算されてS’を生成する。
【0138】
図12bは、D’を生成するために、入力S+Nを演算する不確定処理を実行する二つの代表的方法を示す。一つの例ではWが入力を演算してS’を生成し、次にS’はGuで演算されてD’を生成する。別の例では、Wが入力を演算してS’を生成し、次にS’が入力から減算されてN’を生成し、N’は1/Guで演算されてD’を生成する。
【0139】
図12cは、D’を生成するために、入力S’を演算する不確定タスクを実行する二つの代表的方法を示す。一つの例では、Uが入力を演算してUS’を生成し、次にUS’は1/Wで演算されてD’を生成する。別の例では、Wが入力を演算してWS’を生成し、次にWS’は入力から減算されて(1−W)S’を生成し、(1−W)S’は1/Uで演算されてD’を生成する。
【0140】
図12dは、逆属性処理を実行する方法を示す。そのような処理は先に述べたように中間処理として用いられる。信号見積又は表示S’を演算して、信号及び雑音の見積(S+N)’を生成するのにも使われる。図示の例では、等価な不確定タスクGuの二つの段階が入力を演算し、その結果が入力に加えられる。
【0141】
図12eは、逆不確定処理を実行する方法を示す。そのような処理は先に述べたように中間処理として用いられる。不確定信号D’を演算して、信号及び雑音の見積(S+N)’を生成するのにも使われる。図示の例では、1/GuとGuが並行して入力を演算し、その結果が加え合わせられる。
【0142】
(本発明の実施例のハードウェアとソフトウェアの実行)
この明細書で開示されている本発明の信号及び画像処理法の様々な実施例は様々な形で実行することができる。これには(1)本明細書に記載されているフローチャートと処理に基づいて、本方法の段階をソフトウェアとして実行するためのディジタルコンピューターのプログラミングと、(2)同時継続仮特許出願に開示されている型の回路による入力信号の処理と、(3)専用処理構成による入力信号処理とが含まれる。
【0143】
実際には、コンピューターシステムと関連している記憶装置に記憶されているか又は記憶可能であるのが望ましい一つ又はそれ以上のソフトウェアルーチンを実行するペンティアムクラスの中央処理装置(CPU)を有するコンピューターシステムであれば、本発明を実施するのに十分である。CPUは本明細書に記載されている一つ又はそれ以上の方法を具体化しているルーチンを実行する。必要であれば、コンピューターシステムの代わり汎用プログラム可能信号プロセッサを用いることもできる。そのような信号プロセッサは当業者には既知であり、多数の商社、例えば、テキサスインスツルメント社から購入できる。
【0144】
本発明の様々な実施例および実行に関する追加補足は有用であろう。
(総体平均パワースペクトル)
総体平均パワースペクトルを表すデータを生成するため、以下の手順を提案する。
(1)入力のクラスを選択する(例えば静止画像)。
(2)適切なセンサーを使って前記入力クラスのメンバーを表すデータを記録する。
(3)センサーの出力をサンプリングする。
(4)アナログ/ディジタル変換器(ADC)を使ってサンプリングされたデータを変換する。
(5)規定数のサンプルを記憶する。
(6)記憶されているデータに高速フーリエ変換(FFT)を実行する。
(7)パワースペクトルの見積を得るため、FFTデータの絶対値を二乗する。
(8)見積られたパワースペクトルを記憶する。
(9)入力クラスを表す別のものに対し段階(2)から(7)までを繰り返し、新しい見積パワースペクトルが現在記憶されているデータに加えられ、記憶されているデータが計算された全ての見積パワースペクトルの合計を表示するように段階(7)を修正する。
(10)所望の数の入力クラスのメンバーが処理されるまで処理を繰り返す。
(11)合計されたパワースペクトルデータを反複数で割って、結果が平均を表し、結果が入力クラスに関する総体平均パワースペクトルの見積となるようにする。信頼できる総体平均パワースペクトルの見積を得るために必要な反復数は、入力クラスによって変化するが、一般的には20未満の反復で十分である。見積パワースペクトルは、先に挙げた段階により得られた平均パワースペクトルにカーブ、スプライン及び/又は解析関数を当てはめることによって得ることもできる。パワースペクトルは、各データポイントを全データポイントの合計で割って正規化してもよい。
【0145】
入力データが元々ディジタル形式で存在する場合は、段階(1)から(5)は必要ない。
【0146】
ノイズ構成要素に関する総体平均パワースペクトルの見積は、入力データの特性に関する知識、又は感知装置、増幅器及び他の構成要素の特性に関する知識に基づいてモデル化できることがよくある。例えば、光子捕捉の量子的ランダムさは、本来的ランダムさの形式であったとしても、白色雑音処理としてモデル化できる。ほとんどのセンサーは、先に述べたように入力信号が無い状態で記録され見積パワースペクトルを生成する熱雑音を有するが、製造業者により供給される情報に基づいてモデル化することができる。通常は、センサー及び増幅器の雑音は白色雑音処理及び/又は1/f雑音処理としてモデル化できる。雑音の決定又は特徴づけに関して信頼できる方法が無い場合は、何れかの特定周波数領域が他の周波数領域以上に不確定の原因であると推測する理由がないので、白色雑音としてモデル化することが望ましい。
【0147】
(処理関数)
処理関数W(ν)、U(ν)及び/又はGu(ν)のディジタル表示を構成する場合、B(ν)は線形アレイ又はエレメントのマトリックス形式を取っていることは注目されるべきである。項B2(ν)は、B(ν)の各エレメントを二乗すると得られる、即ちB(ν)は一エレメントづつB(ν)倍される。割り算も一エレメントづつ実行される。同様に、[1+B(ν)]のような操作は、B(ν)の各エレメントに1を加えることを示す。
周波数ドメイン表示として、処理関数には入力データのFFTバージョンが掛けられ所望の結果が作り出される。代りに、処理関数の周波数ドメイン表示に逆FFT操作が実行されて、コンボリューション操作に適合する表示を作り出すこともできる。
【0148】
処理関数の最小位相バージョンは、次の手順を使って得ることができる。
(1)位相特性に関係なく処理関数を構成する。
(2)処理関数の絶対値を取る
(3)逆FFTを実行する。
(4)マスワーク社から入手できる、逆FFTの最小位相バージョンを戻すrcep()のような関数を使う。最小位相結果は、入力データにコンボルブされる。若しくは、最小位相結果のFFTを計算して、処理関数の最小位相周波数ドメインバージョンを算出することもできる。
【0149】
(データ処理)
本発明による好適なデータ処理方法は、次のとおりである。
(1)入力クラスのメンバーを表すデータをセンサーを使って記録する。
(2)センサーの出力をサンプリングする。
(3)アナログ/ディジタル変換器(ADC)を使って、サンプリングされたデータを変換する。
(4)規定数のサンプルを記憶する
(5)記憶されているデータに高速フーリエ変換(FFT)を実行する。
(6)FFTデータのエレメント毎に処理関数のFFTバージョン(周波数ドメイン表示)を掛ける。
(7)前記結果に逆FFTを実行する。
(8)必要なだけ処理を繰り返す。
これと等価に、上に述べたように段階(1)から(4)を実行し、(5)記憶されているデータを処理関数の適切な表示でコンボルブすることにより、本発明の方法を使いデータを処理することもできる。
【0150】
(適応)
本明細書に記載されている用語b2は、雑音分散と信号分散の比を表す「最適パラメータ」である。この値を設定する方法が幾つかある。
【0151】
ある場合には、ユーザーがb2の値を設定できるようにするのが有益である。例えばユーザーは、所望の値をコンピュータプログラムへ入力するか、又はその値をポテンシオメーターと接続されているダイアルを使って制御する。ユーザーが、例えば画像、ビデオ又は音声のデータの知覚様態を制御したいと望む場合には、このような方法が適している。
雑音のr.m.s.パワーが固定されているか又は比較的定まっていることがわかっているか、又はそのように仮定されている場合に、b2の値は次の手順を使って見積できる。
(1)入力データのr.m.s.値を計算する。
(2)r.m.s.入力値を二乗して入力分散の見積を算出する。
(3)入力分散と既知であるか、見積られるか、又は仮定される雑音分散との差を計算して、信号分散の見積を算出する。
(4)雑音分散と分散の差との比を計算する。
雑音分散が既知であるか、又は入力分散に対して小さいことが仮定されている場合、段階(3)は実行する必要はなく、信号分散の見積として入力分散がとられる。当業者は、仮定された信号構成要素の分散又は入力分散が既知であるか、あるいは固定されているか又は比較的定まっていると予測される場合、等価な手順を用いうることを理解するであろう。分散は、ディジタルデータに関してデータの平均二乗値を決定することによって見積ることもできる。
【0152】
光から導き出されたデータの場合、光子捕捉によるランダムな変動は平均光度に比例して分散を入力へ付与することが分かっている。「信号」構成要素の分散は平均光度の二乗で増加する。従って、光センサー内の暗騒音を考慮すると、b2の値は、例えば入力分散からよりも平均光度から決定される。光子のランダムさが「雑音」の優勢なソースである場合、b2の値は光度の一次関数に逆比例するはずである。固定されたr.m.s.パワーを有する別の雑音ソースが優勢である場合、b2の値は二乗された光度の関数に逆比例するはずである。平均光度は光センサーと接続されている低域フィルタ又は平均値算出手段により見積される。
【0153】
別の場合、b2の値は、入力のr.m.s.値に関して不確定信号のr.m.s.値を最小にする方法によって設定される。そのような一つの方法では、次の段階を実行するのが望ましい。
(1)入力を記録及び記憶する段階
(2)b2の初期値を選択する段階
(3)本発明の方法により入力を処理して不確定信号を生成する段階
(4)不確定信号のr.m.s.値と入力のr.m.s.値との比を形成し、記憶する段階
(5)b2の新しい値を選択する段階。
(6)新しい不確定信号を生成する段階。
(7)r.m.s.値の新しい比を形成する段階。
(8)第一比と第二比を比較する段階。b2の新しい値が第一値よりも大きい場合、及び第二比の値が第一比の値より大きい場合は、次に必ず新しい小さいb2値を選択し、値が増加又は減少してr.m.s.値がより大きな値になるようなb2値が見つかるまで処理を繰り返す。当業者は、最小値を検索するためのアルゴリズムが既知であることを理解するであろう。
【0154】
(データ操作)
先に述べたように、本発明は不確定信号の値に基づいてデータから特徴を抽出する手段を提供するので有益である。例えば、目、鼻、口、髪の生え際及び顔の輪郭近くの領域は、一定の範囲を超える不確定信号の値を保持することにより、顔の画像から優先的に抽出される。特徴抽出を達成する一つの方法は次の段階を含むのが望ましい。
(1)入力データを得る段階。
(2)不確定信号を生成する段階。
(3)標準偏差により不確定信号を正規化する段階。
(4)不確定信号の絶対値を設定レベルと比較する段階。
(5)閾値を超える各ポイントでは数値1を記憶し、そうでないポイントでは数値0を記憶する段階
顔の画像には、1から3の範囲内の閾値が上手く作用する。結果としての二進マップの非ゼロ値は、最大曖昧さ又は不確かさの位置を印す傾向にある。画像にとって、これらの範囲は知覚的に重要で、且つ認識処理において役立つことがよくある。二進マップで1に相当する入力又は信号データのこれらの範囲だけが保持されるように、マップには入力データ又は信号表示が掛けられる。代りに、二進マップに不確定信号を掛けてもよい。この結果は、本発明の方法の逆不確定タスクにより処理されて、不確定信号の特大数値に相当する範囲内にだけ信号の表示が生成される。閾値比較の前又は後に、不確定信号を量子化する追加の段階が含まれる。
【0155】
本特徴抽出方法は、数値の大きい不確定信号に相当するデータが優先的に保持されるように、サブサンプリング/補間操作と共に用いられる。一例として、不確定信号を得て、次の段階が実施されるのが望ましい。
(1)不確定信号の絶対値が規定された範囲を超える位置を示す二進マップを作成する段階。
(2)二進法マップに不確定信号を掛けて、その結果を記憶する段階。
(3)結果のエレメントが元の不確定信号が有するエレメントよりも少なくなるように、付近のエレメントの平均値を取ることにより不確定信号をサブサンプリングする段階。
(4)結果が元のものと同じ数のエレメントを有するように、サブサンプリングされた不確定信号を補間する段階。
(5)結果に、元の二進マップにNOT演算を実行することにより作成された二進マップを掛ける段階。
(6)元々の二進マップと元々の不確定信号の記憶されている積に結果を加える段階。
【0156】
更に、結果は本発明の方法の逆不確定タスクにより処理され、大きい不確定信号値の位置付近の詳細が保持されているのが好ましい信号の表示を生成する。記載されている段階は、一定範囲の不確定信号が各解像度レベルで保持されるピラミッド法で用いられる。
【0157】
一定範囲の解像度を優先的に保持する同様の方法は、不確定信号の値に従ってサンプリング率又は密度を調節する段階を含む。例えば不確定信号の絶対値は、入力、信号、又は不確定データが各持続時間の最後にサンプリングされるようにサンプル間持続時間を決定する線形関数におけるパラメータとして用いられる。不確定信号の絶対値が増加するに従ってサンプル持続時間が減少すれば、データは特大値の不確定信号近くの位置では高率でサンプリングされる。持続時間は、直前の間隔の最後に不確定信号の数値により、又は例えば直前の間隔の間の平均絶対値により設定される。この種の方法は、負値及び正値が同じ効果を及ぼさないように、不確定信号の符号を保持していてもよい。
【0158】
解像度及び品質を制御するもう一つの方法は、不確定信号を得て、次の段階を含むのが望ましい。
(1)一定の持続時間又は範囲に関して、不確定信号の平均絶対値又は分散を決定する段階。
(2)段階1の結果の関数として有効帯域幅を設定する段階。
(3)処理されたデータの一定の帯域幅だけが保持されるように、段階(2)の規準に従ってデータを処理する段階。段階(2)の例として、平均絶対値はハイパスフィルタの低周波数カットオフに線形に対応するか、又はローパスフィルタの高周波数カットオフに対応する。JPEGのような基礎関数方法でも同様に、不確定信号を多数の係数を制御するのに用いて、処理されたデータが一定の持続時間又は範囲保持されるようにしてもよい。細波ベースの方法では、許容される倍率の範囲が制御される。
【0159】
要約すると、本発明は、データの特定の信号及び雑音モデルにより持ち込まれる曖昧さ又はエラーを見積るために用いられるデータを分析し、表示する方法を提供する。このことは、データの特性又は異なるデータ間の関係に関する仮定からのバイアスを持ち込むことなく、データが計算上効率的に表示及び操作できるようにする。本発明の方法は、特定の特徴を強調するか又は抑調するための画像データの処理と同時に、データの圧縮及び送信に関する特定の利用法を提供する。
【0160】
本明細書に記載されている用語及び表現は、説明のための用語として用いられており、限定するものではなく、更にそのような用語及び表現の使用に関して、図示及び記載されている特徴に相当するもの、又はその一部を排除する意図はなく、請求されている本発明の範囲内で様々な修正が可能であることは理解されたい。従って、請求項に定義される本発明の目的と精神から逸脱することなく、開示されている実施例に修正及び変更を加えることができる。
【図面の簡単な説明】
【図1】 代表的な先行技術による信号処理システムのブロック線図である。
【図2】 本発明の方法による、入力データのセットの出力への処理を示すブロック線図であり、処理操作は2段階操作として示されている。
【図3】 本発明による、入力データセット、処理関数、不確定オペレータ、不確定信号、信号見積の間の関係を示すブロック線図である。
【図4】 不確定タスクにより操作された、又は、不確定信号を生成し、更なる処理ステップに供し、それからタスクの逆により操作されて新しい信号の見積を得るようにバイアスする信号見積を示すブロック線図である。
【図5】 信号処理操作をモニターするための数々の利点を生成するために、どのように本発明が使用されるかを示すブロック線図である。
【図6】 どの様に本発明の不確定信号を処理されたデータの中間形態として使って、追加の処理操作のアプリケーションの前に信号表現と置き換えるのかを示すブロック線図である。
【図7】 どの様に本発明の不確定信号を使って処理及び/又は処理タスクの操作を制御するのかを示すブロック線図である。
【図8】 本発明の不確定信号を使って処理及び/又は処理タスクの操作を制御する第2のやり方を示すブロック線図である。
【図9】 どの様に本発明の信号処理法を使ってデータ強調及び抑調を行うかを示すブロック線図である。
【図10】 本発明の信号処理法を使って、先に存在している又は仮説の信号又はデータ処理操作から不確定処理を構築するのを示すブロック線図である。
【図11】 本発明の方法に従って、処理スキームのI/O分析より不確定フィルタ及び不確定タスクを決めるために実行される1次信号処理段階を示す。
【図12】 本発明に従って、属性処理、不確定処理、不確定タスク、関連逆処理を実行する方法を示すブロック線図である。[0001]
(Related application)
This application is hereby incorporated by reference as provisional application No. 60 / 054,399, filed July 31, 1997, “Method for signal processing by attributes, phase estimation, fitness, quantization capacity and Claims priority from Applicant's co-pending US provisional patent application entitled "Apparatus".
[0002]
This invention was made with US government support under grant number EY03785 awarded by the American Health Association (USPHS). The US government has certain rights to the invention.
[0003]
(Technical field)
The present invention relates generally to analog and digital signal processing, and more particularly to an apparatus and method for efficient display and processing of signal or image data.
[0004]
(Prior art)
FIG. 1 is a block diagram of a typical
[0005]
[0006]
Input data in the form of a data stream, array, or packet is presented to the processing stage either directly or via the
[0007]
The output stage 106 produces a signal, display, or other response that can affect the user or an external device. Typically, output devices are used to generate indicator signals, displays, hard copies, displays of processed data in storage devices, and for example, to begin transmitting data to a remote location. The output device is used to provide an intermediate signal for use in subsequent processing operations and / or as a control element in the control of processing operations.
[0008]
If used,
[0009]
The primary purpose of the signal or
The design of the signal processing system is influenced by the intended use of the system and the expected characteristics of the source signal used as input. The required performance efficiency, which is often affected by the amount of storage available and the computational complexity of the specific application, is also an important design factor.
[0010]
In some cases, the characteristics of the source signal can adversely affect the goal of efficient data processing. Inherent variations in source data unless the input data is naturally or intentionally constrained to have a narrowly definable characteristic (such as a limited set of symbol values or narrow bandwidth) Can be an obstacle to processing data in a reliable and efficient manner without causing errors resulting from special purpose technical assumptions. In this regard, it should be noted that many data sources that produce less constrained data are important to people, such as audio and visual images.
[0011]
Conventional image processing methods suffer from the inefficiencies of slow data communication, the need for large storage devices, and the manifestation of disturbing perceptible artifacts. Because of the various methods that are desired for using and manipulating image data, and because of the inherent sensitivity humans have to visual information, these can be serious problems.
[0012]
In particular, an “optimal” image or signal processing system is characterized by a fast, highly efficient, reliable and powerful method, among other things, for performing a desired set of processing operations. Such actions include conversion, storage, transmission, display display, compression, editing, coding, enhancement, classification, classification, feature detection and recognition, aesthetic conversion of data, and other information sources of such processed data And integration with. Equally important, for an image processing system, the output must be able to avoid perceptible disturbances and distortions and interact with human vision as naturally as possible.
[0013]
The meaning that the signal processing method must be powerful means that its speed, efficiency and quality (for example) must not depend strongly on the characteristics of any particular characteristic of the input data, ie for any plausible input On the other hand, it must operate at a level "optimally" or close to it.
[0014]
This is important because the usual inadequacies suffered by signal processing methods are that they are not powerful. JPEG-type methods in image processing work better for “photo” images that have a gradual slope in color and brightness than for example, graphic images with sharp discontinuities. On the other hand, image compression methods such as those realized in the GIF format work best when the image has little complexity as seen in a photographic image. Similar examples can be given for processing operations performed on voice and other types of input data.
[0015]
For one, conventional image processing methods lack power because of the infinite number of possible images. In addition to this, complicating matters is that it is often impossible to know in advance exactly what features and complexity an image has. Thus, one approach to completely drawing an image is to determine the brightness and color at every point in the image. However, the amount of information needed to accomplish this task can exceed several megabytes for a normal size digital image, making it difficult to store, process and transmit such information. Even then, the digital representation is an inaccurate record for the original image due to the inherent limitations in constructing binary values based on the representation of the continuous analog signal.
Discrete sampling over any finite period or area cannot capture all changes in the source data, so information will be lost in any discrete representation of continuous value data . Similarly, if the entire range of values in the source data cannot be represented by a set of discrete values, information is lost in any quantization process.
[0016]
In addition to the difficulties imposed by the characteristics or performance of the processing operation, other issues should be addressed if the noise source masks or distorts the input components that are supposed to represent the signal of interest. Don't be. However, although it cannot be logically defined as noise, it is nevertheless difficult to realize that there are other forms of randomness and unpredictability that are the source of the problem with regard to the quality and power of signal processing. This form of non-predictability is considered in terms of inherent randomness and overall diversity. Intrinsic randomness relates to inseparable randomness from the data medium or source. Quantum mechanical randomness of photon trapping is an example of intrinsic randomness.
[0017]
Gross diversity relates to any non-predictability within the class of data or information source. Data representing visual information has a very large degree of overall diversity because visual information is virtually unconstrained. Visual data represents any temporal sequence, spatial pattern, or spatio-temporal sequence that can be formed by light. There is no way to define visual information more accurately. Data representing speech information is another class of data that has a large overall diversity. Music, conversations, animal screams, breeze sounds across the leaves, and other sounds share no intrinsic characteristics other than representing pressure waves. The fact that a person can only hear certain sounds and is more sensitive to sounds at one frequency than sounds at other frequencies is a human speech processing characteristic rather than a sound characteristic. Examples of similarly changing data and information source classes can be found through natural and man-made phenomena.
[0018]
Non-predictability resulting from noise, inherent randomness, and overall diversity, individually and in combination, makes it difficult to extract informational or signal components from input data, and usually Make impossible. Any attempt to do so will require that the signal and noise models be implicitly or explicitly defined. However, if there is any possibility that noise, inherent randomness, or overall diversity share characteristics, in the transmission of information when the components of the input data are compared with non-information transfer noise Any signal and noise model that can be assigned with absolute reliability by signal class cannot be employed.
[0019]
Signal and noise models are built into signal processing operations either implicitly or explicitly to limit diversity in the output of signal processing and to make processing operations easier to handle. Signal processors typically impose some form of constraint or structure on how to represent or interpret the data. As a result, such methods cause systematic errors that can affect the quality of the output, the confidence in viewing the output, and the type of subsequent processing tasks that can be reliably performed on the data.
[0020]
An important but often stated assumption used in signal processing is that the source data is represented or approximated by a combination of signs or functions. In doing so, such a processing method basically imposes criteria that define or determine that the values and interrelationships in the inputs are sufficient. Signal processing methods must embody certain concepts that should be seen as signals. However, the implicit or explicit assumption that a signal can be fully defined using a set of values or some sort of correlation is often unfounded, leading to processing errors and inefficiencies. By defining the signal in terms of a set of values or correlations, the processing method can effectively assign all other values and correlations to noise categories. Such an approach is: 1) the source of information represented by the input data presents only a certain set of values or correlations, and 2) noise or randomness in the input data happens to present these values or correlations to the input. It is only useful when it is known that it will never be allowed to. This kind of condition is rare at best and is controversial but never really happens. These conditions are undoubtedly not true for information sources with visual, audio, or other unconstrained general diversity. For such classes of data, a finite set of values or interrelationships is not sufficient to fully cover the range of diversity that exists. As a result, some values or interrelationships representing the information source will inevitably and incorrectly be assigned a noise category. The inventive method does not assume such a set of specific values or correlations.
[0021]
In order to further illustrate some of the limitations of signal and noise models in general, we discuss in this section some processing techniques found in the field of image processing. Conventional image and signal processing techniques include methods of representing data in terms of a set of basis functions such as histogram methods, predictive coding methods, error coding methods, JPEG, MPEG, fine wave-based techniques. is there.
[0022]
The histogram method is based on categorizing luminance and color values in an image and includes a palette concept. A histogram relates to a probability density function that describes how often a particular value falls within a particular range limit. The histogram method is used to quantize the source data in order to reduce the number of substitution values needed to represent the data. In various ways, the histogram method has been applied to all digital images derived from continuous value source data. The histogram method is also used for aesthetic effects in applications such as histogram equalization, color remapping and thresholding.
[0023]
However, a drawback of the histogram technique is that the processing scheme used to perform such a method must determine which range of values and colors are more important or useful than others. This is in conflict with the fact that the distribution of values in an image changes dramatically from one image to the next. Similarly, the number and position of peaks and valleys in the histogram vary considerably between images. As a result, the histogram method is computationally complicated, and results in different quality levels for different image types. The histogram method also tends to produce output with noticeable blur and unnatural color structure.
[0024]
Predictive coding attempts to compensate for some of the limitations of the histogram method by considering the relationship between image values at multiple image points in addition to the overall value distribution. Predictive coding techniques are suitable for data with naturally limited diversity, such as bitonic images. Such a method is an important part of the
[0025]
Predictive coding techniques are based on the assumption that there is a correlation in the image data that can be used to predict the value of the image at a particular point based on values at other points in the image. Such a method can be used to remove noise by ignoring variations in the image that deviate significantly from the predicted values. Such a method can also be used in an image compression scheme by coding an image point only when the image point deviates significantly from the predicted value.
[0026]
However, one problem that arises in predictive coding is that it is difficult to determine that certain deviations in the image are more important information than noise. Another cause of difficulty is that the interrelationships in the images differ from place to place as well as between the pictures. Currently, no conventional predictive coding method uses a sufficiently powerful algorithm to minimize processing errors over realistic image ranges. As a result, conventional predictive coding methods tend to equalize changes between images.
[0027]
The error coding method extends the prediction method by coding an error between the predicted value and the actual value. Conventional error coding techniques help to create a representation of input data where small values near zero rather than large values are more common. However, such methods typically do not reduce the overall dynamic range over the range of input data, but rather increase the range. As a result, error coding methods are sensitive to noise and quantization errors, especially when attempting to reconstruct the original source data from error-coded representations. Furthermore, since error coding is an extension of predictive coding, these two classes of methods share many of the same problems and disadvantages.
The representation of data using a set of basis functions is well known, and it will be most common to use Fourier techniques. Other conversion methods include fast Fourier transform (FFT), discrete cosine transform (DCT), and various fine wave transforms. The rationale for such a conversion method is that the basis functions can be encoded with coefficient values and that certain counts can be treated as more important than others based on the information content of the original source data. It is. In doing so, these methods consider certain types of coefficient values and correlations approximated by basis functions to be more important than any other value or correlation. In essence, the transformation method is a means of categorizing correlations in the image. The limitation of such a method is a result of the unpredictability of the correlation. Variations in brightness and color that characterize an image are often localized and vary across the plane of the image. As a result, FFT and DCT based methods such as JPG often first divide the image into multiple blocks, allowing correlation analysis to be limited to a narrow range of images. This approach can result in troublesome discontinuities at the end of the block.
[0028]
Fine wave based methods avoid this “blocking effect” by using a localized function that is more localized than the sine and cosine functions. However, the problem with the narrow wave-based method is that it is appropriate for a particular function for an image and that the entire image can be described by superimposing scaled versions of that function centered at different positions in the image. It is assumed. Such hypotheses are often incorrect when the image data is complex. Thus, the fine wave based method tends to produce textured haze and readily visible changes in processing and coding quality within and between images.
[0029]
In order to address some of the problems arising from the complexity of images as information sources, many attempts have been made to incorporate models of human perception into data processing methods. These are based on the belief that by using human visual ability as a guide, one can make a few errors and distortions that go into the process. Basically, using human perception models can provide the basis for determining that certain visual information is more important than other information. For example, television and some computer image formats explicitly treat luminance information as more important than color information and preferentially use coding and processing resources for grayscale data. While this approach is a kind of compromise, there is no sufficiently accurate model of human perception currently available to support image data processing. As a result, attempts to design a process that incorporates such a model will result in an imperfect image, as you will immediately notice.
[0030]
Therefore, there is a need and need for an apparatus and method for processing general signal and image data that is more efficient than conventional approaches. In particular, there is a need for a signal and image processing apparatus and method that is less computationally complex than conventional methods and has less data storage requirements. There is also a need for an apparatus and method for reconstructing signals and images from processed data without the degradation of signal and image quality found with conventional approaches.
The present invention provides such an apparatus and method.
[0031]
(Summary of the Invention)
The present invention is directed to an apparatus and method for efficiently processing signal and image data. The inventive method provides a representation of the signal and image data that can be used as a final product or as an intermediate result for further processing. As a final product, the data representation provides a number of advantages that can be used to compare and characterize different signal processing techniques or as a control element for applying processing operations. As a provider of intermediate results, the method can be used as a step in the process for converting, storing, enhancing, refining, extracting features, compressing, coding, transmitting or displaying the image data. In this context, the inventive method considerably relaxes the computational and data storage requirements of conventional signal processing methods. The present invention manipulates data from a source that is inherently unpredictable or partially random to provide a more powerful and efficient subsequent processing method, reduced storage requirements, errors And an improved method for simple coding of data in consideration of the restoration of the original data with minimal degradation. The present invention provides coding derived from the external environment, whether it is noise-free or contaminated with random components, and whether the data is represented in a natural state like photons or pre-processed. Provide a source data system.
Other features and advantages of the present invention will become apparent from the following description in which the preferred embodiment is described in detail with reference to the accompanying drawings.
[0032]
(Detailed description of the invention)
The present invention provides a signal processing apparatus and method that can be conveniently applied to any form of data expressed in a format suitable for the disclosed processing operation application. Without limitation, the data may include both digital data and analog data, and may include data representing visual images, audio signals, and radar signals. Although the following description refers to or is directly directed to visual image data processing, the present invention is not limited to use with such data, and reference to such data is illustrative. Note that the only purpose is to do. Similarly, it should be noted that the mathematical description of the method of the present invention uses a form of generalized frequency notation. Since the basic principle of processing is not different from time, space, or spacetime, the generalized frequency can be read and used as a time, space, or spacetime frequency. Temporal processing only needs to meet the causal relationship. The use of frequency domain notation should not be construed to mean that the data needs to be converted to the frequency domain for processing, but rather the frequency domain terms should be considered symbolically. Often it is preferred to process the data as it arrives in time and space using circuitry, such as the type described in the co-pending provisional application. It is one of the advantages of the method according to the invention that simple and quick execution using such a circuit would be a computationally intensive calculation with other processing methods.
[0033]
Applicants recognize that the assumptions commonly made in the prior art that certain information or interrelationships are more important than others are the source of many problems that arise in the processing of complex data sources. It came to. This assumption clearly appears in the choice of which signal processing method to apply to the data and is also the basis for the actions performed by most conventional signal processing schemes. For example, the histogram method basically categorizes the range of values in terms of visual importance for a particular image. In various ways, predictive coding, error coding, and basis function methods implicitly or explicitly assume that certain variations in image data are more important than others. Such methods are based on special engineering assumptions, even in some cases supported by theoretical or empirical models such as human perception. As a result, such a method introduces systematic errors that come from the processing method rather than the result of the intrinsic characteristics of the source data, thereby causing a methodic bias in data processing.
[0034]
Such systematic errors can be considered to cause systematic error information. As such, most conventional processing methods impose specific constraints on the data, resulting in inefficient and sometimes erroneous interpretation and action of the data.
[0035]
The fact that some conventional processing methods are inadequate or inefficient does not mean that there is no advantage for a particular application. However, the implicit assumptions in such methods constrain its versatility and limit the processing operations that can be performed on the data while maintaining the desired degree of reliability in the results. For example, performing fingerprint recognition on block JPEG is probably inappropriate because errors introduced by DCT quantization can result in inefficiencies and lead to misidentification. Similar arguments apply to other methods that assume that some information is more important than others, or that a characteristic of a data set determines whether it is assigned to a signal or noise. Once such a method is applied to the source data, it limits the range of useful actions that can be subsequently performed.
[0036]
One advantage of the method of the present invention is that a discrete sampling method can be employed in such a way as to minimize information loss. Furthermore, the method of the present invention provides a method by which a continuous value representation of source data can be generated from a discrete representation.
An important feature of the method of the present invention is that it produces a reliable metric with better characteristics than conventional signal representations from input data and implicit or explicit signal and noise models, and signal representation in many signal processing operations. Can be used to control the quality and efficiency of processing operations and can be used to characterize existing or hypothetical processing operations. Thus, the method of the present invention can be used to control and quantify errors introduced by signal and noise model burden.
[0037]
Since the signal and noise concept is inherent, it is unquestionable and its limitations have not been investigated. In arriving at the present invention, the applicant had to reconsider the signal and noise concept, and it was incomplete rather than wrong to have recognized. Allocating aspects of input data to either signals or noise usually involves uncertainties regarding the reliability that should be substituted for such allocation. The inventor has recognized that such uncertainties can be expressed in a manner that is independent of the representation of the signal and the representation of noise. This indeterminate signal represents the power at the input that cannot be attributed solely to either signal or noise, i.e. serves as a reliability metric. Applicant also recognizes that an indeterminate signal represents an information source that produces input data in a simple manner that can be used both as a signal representation and as a control signal to control information processing operations. It came to do.
[0038]
In considering the shortcomings of conventional signal and information processing methods (as described above), Applicants have recognized that a reliable and efficient signal processing method must have certain characteristics. These include, but are not limited to: That is,
(1) The method must embody the minimal special assumptions and sources introduced methodologically to minimize systematic errors and maximize versatility.
(2) The method must be computationally simple and efficient.
(3) The method must be reliable and powerfully applicable to complex data sources.
(4) The method provides a means to minimize noise and randomness in the source data without requiring detailed knowledge of which data components convey information and which are pollutants. Must be provided.
(5) The method must have the least amount of distortion introduced.
(6) The method must be such that the input data is quantized and classified with minimal signal degradation.
(7) The method must take into account higher order data compression.
(8) The method must be such that the processed data can be transmitted efficiently to a remote location.
(9) The method must be able to adapt to changes in the source data and reduce processing errors and inefficiencies.
(10) The method must be capable of being performed using any analog and / or digital technique appropriate to the particular application.
[0039]
In considering these requirements, applicants wondered the traditional concept that some information could be classified as more important than others. With regard to image processing, Applicants have reconsidered the assumption that luminance and color values in the image should be considered raw information. Applicants have recognized that brightness and color do not provide the most efficient, powerful and reliable information about images that can be processed to extract the desired information about the data. This recognition and its extension to other types of information sources and data formats has resulted in a number of concepts that help form the basis of the present invention.
[0040]
(Vague components of input data)
All signal and information processing methods try hard to produce a result from a set of inputs. Input can be described as two components: a signal component that holds information or a message, and a noise component that reflects signal component distortion and contamination, for example in the form of random fluctuations or crosstalk. It is also a general explanation. The present invention recognizes that the first stage of defining an input as having a signal component and a noise component has broad implications because it imposes a specific model on the data. It is essential that all data be categorized as either signal or noise, between one set of signal data and another signal data, between signal data and noise data, and some set of noise data. There is a branch with respect to the assumed magnitude and phase relationship between and other noise data. The bias in model selection introduces a limit to the accuracy with which data can be processed while maintaining a “clear line” that distinguishes signals from noise.
Given a signal and noise model, the input is written as X (ν), the signal as S (ν), and the noise as N (ν), where the capital letters represent the frequency domain representation (eg, Fourier transform). The parameter ν represents a generalized frequency (typically temporal, spatial, spatio-temporal). Under these conditions, the input is the sum of signal and noise,
X (ν) = S (ν) + N (ν)
Is written.
[0041]
When using such a data model, the input data X (ν) is known and a model for the noise contribution N (ν) is assumed. Based on these terms, a representation of the signal S (ν) is determined.
[0042]
However, despite the widespread rules for representing data in terms of signal and noise components, Applicants are more efficient and versatile in processing input data, especially data originating from complex sources. Recognized that there is a way. One motivation for the present invention is that the assumption that the input data can be decomposed into signal and noise components, but for complex sources, the signal components of the data set are precisely defined from a priori knowledge. It is inconsistent with the reality that, if you can, it is almost impossible. Attempts to impose signal definitions in specific processing schemes implicitly define noise, introduce systematic errors, and limit the types of processing operations that can be performed reliably on data. For example, the conventional image processing methods described above assume that certain aspects or characteristics of the input data are more important than others, such as the range or type of correlation values. These methods inherently define signal components and thus result in certain processing limitations as described above.
[0043]
Thus, in the present invention, implicitly or explicitly, “decision” on what the signal is and what the noise is makes the conventional signal processing scheme inefficient and changes them semi-optimally. We recognize that we end up. What is needed instead is a “translation” method that does not cause these disadvantages. Thus, using this approach, the present invention provides an apparatus and method for representing input data from complex sources in terms of ambiguity and uncertainty measures instead of signal and noise terms. These methods and this type of data representation have several advantages over traditional signal and noise approaches.
[0044]
The concept of translation is similar in some ways to the concept of quotation. Estimated theory is a starting point, but should not be construed as a limitation on the scope of the invention. For example, generalization includes explicitly using noise terms in the following developments, but it should not be taken in the sense of limiting the present invention to noisy data sources. In the classical signal estimation problem, the goal is to generate the best possible estimate of the signal components from the input. When the estimated signal is expressed as S ′ (ν), the action is generally expressed as X (ν) −S ′ (ν). By generating a signal estimate, a noise component estimate is also generated.
N ′ (ν) = X (ν) −S ′ (ν)
However, what processing operations should be performed to generate an estimate depends on how exactly the “best” is defined and what constraints are imposed on the signal and noise characteristics. .
[0045]
The problem is when there is a possibility that the signal and noise components of the input data are indistinguishable, or when a very accurate definition of the signal or noise is not possible (complex information such as visual images). This is often the case with sources), and the estimation process can mistranslate or ignore certain parts of the input data's information content. This means that there is some ambiguity.
[0046]
This possible “mistranslation” can be attributed to either the signal component or the noise component, rather than a certain correlation in the input data being assigned to the signal component or noise component with certainty. It occurs because it is possible. In fact, any signal estimation process, whether linear or not, may be contaminated if the correlation in the input is contaminated, given some prior predictions or definitions of signal and noise and some weighting criteria. However, it may be described as a process in which they are weighted according to how likely they are messages that provide information.
[0047]
This potential ambiguity can also be understood in terms of the correlation between the assumed signal component and the noise component. Correlation is often discussed in terms of amplitude and phase correlation. The input data is
X (ν) = | X (ν) | exp (iθX(Ν))
Where | X (ν) | is the amplitude spectrum of the data and θX (ν) is the phase spectrum. Similarly,
S ′ (ν) = | S ′ (ν) exp (iθS '(Ν)) and N ′ (ν) = | N ″ (ν) | exp (iθN '(Ν))
It is.
[0048]
Note that this formula is a valid arithmetic description that does not assume a linear relationship between the input data and the estimate and is independent of the processing method. Using the above notation, the power related to the correlation in the input data is expressed as:
| X (ν) |2= | S '(ν) |2+2 | S ′ (ν) ‖N ′ (ν) | cos (θS '(Ν) −θN '(Ν)) + | N ′ (ν) |2
The squared amplitude spectrum is read as a power spectrum. The equation shows that the input power can be expressed as the sum of the estimated signal power plus the estimated noise power plus a cross term (intermediate term) representing the remaining power. This remaining power is the power in the input that cannot be explained by estimated signals and noise seen independently of each other. In a sense, it represents power that cannot be attributed with sufficient confidence to either signal alone or noise alone, based on the signal and noise model employed. It is an ambiguous power due to the correlation between the signal estimate and the noise estimate, and thus the limit or inaccuracy of the model used to assign the input data to either signal or noise. It can be said that it is a scale.
[0049]
For purposes of this application only, aspects of input data that cannot be reliably attributed to either signals alone or noise are referred to as “ambiguous” components of the input. In conventional signal and noise methodologies, the ambiguous component is not a separate entity, i.e. the input data is fully described by the signal and noise estimates,
X (ν) = S ′ (ν) + N ′ (ν)
It is. The ambiguous component is a discriminative representation of the most unpredictable correlation in the input. An ambiguous component is generally ignored in conventional signal and information processing because it is considered to represent an aspect of the source data that is too insecure to be a reliable source of information. I came. Based on the recognition of the importance of ambiguous components in the input data, the present invention presents problems related to other signal processing methods if this component is expressed or extracted by performing certain actions on the input data. Recognizes that many can be avoided and / or controlled.
[0050]
Thus, according to the present invention, if a signal and noise model is used for processing input data, each data needs to be assigned to either signal or noise, so that an error source is introduced during processing. Recognize. However, there are certain input data powers that are not assigned to signals or noise, i.e. ambiguous components. In conventional processing schemes, this input data power is ignored, so that some information contained in the input data is lost. However, the present invention provides a method for extracting this previously lost information and using it to improve the processing of the data.
[0051]
In determining the action to be performed on the input data to extract the ambiguous components, Applicant relied on previously confirmed criteria for reliable and efficient processing. By performing the method based on a minimum number of assumptions that minimize data distortion, the present invention can satisfy many if not all of the criteria. Furthermore, the present invention recognizes that imposing a minimum number of assumptions on the nature of the data directly relates to how distortion can be minimized.
[0052]
(Estimation of ambiguous components)
In order to introduce a minimum number of assumptions regarding the form or nature of the input data, some correlations in the input data may be more important than other correlations, and so before the data is processed It is useful to go back to the view that you can rely on simple characterization. In the image data, for example, an inquiry as to whether the edge should be handled more prominently than smooth blurring. It is controversial that edges are perceptually more prominent features, however, in order to incorporate the edge concept into a processing method, it is necessary to define the characteristics of the edge. This is a much more difficult task than you think. The most likely accepted edge in an image is usually brightness or color blur over a small area rather than a sharp fiber. Of course, it is also possible to define an edge as a feature that changes by a certain amount within a certain area, but this ignores the fact that the blur takes the form of a staircase or slope or other transition function. It should also be noted that edges are not necessarily the most perceptually distinguishing feature. For example, an edge may be important in a building image, but not in a sunset landscape image. In order to ensure optimal processing versatility, it is desirable to employ a measure of importance that is effective not only within a certain image but also between different types of images.
[0053]
Transitions and changes in the source data can be defined in part by phase correlation. Phase is not an absolute metric because it relates to the relationship between different parts of the data. In an image, for example, phase information indicates how certain features or transitions are arranged relative to others. Thus, in order to define a set of correlations as more important than others, a reference point is needed, for example where the camera is pointed or when data is recognized. However, for complex data sources, there is no way to define a reference point, so input data tends to have a specific phase characteristic, especially when the input data contains random disturbances. strong. For example, multiple exposure of film is more prone to gray blurring because there is no expectation that certain image features will be aligned in a particular way with respect to the camera.
[0054]
Thus, in order to minimize the number of assumptions and maximize versatility, the present invention recognizes the need to handle different types of phase correlations in a similar manner. The advantage of this approach is that a dedicated processing operation that embodies assumptions about the importance of different types of phase correlations can be subsequently performed without constraining other possible processing operation types. .
[0055]
The processing method that minimizes the influence on the phase characteristics of the set of input data is linear. The phase distortion necessarily caused by such a method can only be derived from the fact that the processing is only performed on already known data. Linear processing that causes only the minimum amount of phase distortion allowed by the causality principle is called “minimum phase processing”. More detailed information on minimum phase processing can be found in the reference, "Network Analysis and Synthesis 2nd Edition" by Quo FF (1966), Willie and Sons, New York.
If it is still about an image, but purely spatial, where time is not a factor, the processing method of the present invention results in zero phase distortion. If the output is temporally and spatio-temporally required in real time, the processing method of the present invention can determine at least for minimum phase processing, as such processing characteristics are understood by those skilled in signal processing. It will meet the criteria. If the data is stored before processing, a delay corresponding to phase distortion occurs, so the phase characteristics of the method of the present invention need not be constrained. It should be noted that in order to satisfy the causality constraint, the phase characteristics of the method of the present invention may be defined using the technique of Wiener-Hop spectrum factorization. A detailed description of the Wiener-Hop spectral factorization can be found in the reference, Pierre D., Dover, New York. A. (1986) “Optimization theory associated with applications”.
[0056]
Note that the conclusion that the desired processing operation should be linear is separate from the question of whether it is desirable to estimate signal and noise components from input data or to express ambiguity. Thus, in the linear signal estimation problem, the estimated signal is
S ′ (ν) = W (ν) X (ν)
Where W (ν) is the amplitude spectrum | W (ν) | and the phase spectrum θ.WRepresents a processing operation with (ν). Similarly,
| S ′ (ν) | = | W (ν) ‖X (ν) | and θS '(Ν) = θW(Ν) + θX(Ν)
It is.
It is recognized that any phase distortion that occurs during processing is inherently unrelated to the signal processing problem, so it is possible to infer the non-causal zero phase action X '(ν), and as a result,
S ′ (ν) = | W (ν) | X ′ (ν)
Where X ′ (ν) = X (ν) exp (iθW(Ν)).
Therefore, a valid noise estimate is
N ′ (ν) = (1− | W (ν) |) X ′ (ν))
It becomes.
The size of the ambiguous power component is therefore
2 | S ′ (V) ‖N ′ (ν) | = 2 | W (ν) | (1- | W (ν) |) | X ′ (ν) |2
And
| X ′ (ν) |2= | X (ν) |2Please note that.
[0057]
Despite the fact that in any sense any processing operation can be regarded as a signal estimation process, it can be seen as something that performs a task on a signal or signal estimation generated by a subprocessor or preprocessor. More general. The distinction between the concept of signal estimation and the concept of tasks derives from the traditional view of signal and noise.
[0058]
FIG. 2 is a block diagram showing the process of processing the input data set X into the output Y according to the present invention, in which the processing operation is represented as a two-stage operation. In this example, the signal estimation operation and the processing task are combined. ing. FIG. 2a shows an input X (ν) being processed by the set of processing operations represented by
[0059]
The estimating stage (box 202) may be characterized by being a general purpose preprocessor. For example, data input to an array of separate processors that perform signal processing operations can be a single, common signal estimation process, and a sequence of processing tasks that are dependent on various actions. It can also be expressed as
[0060]
It should be noted that what is often considered as input data can also be viewed as a signal estimate in terms of signal and information processing operations. For example, a digital representation of a photograph can be thought of as an estimate of the actual brightness and spectral components of the real world. It is not intended to limit the scope of the invention to cases where the input data is considered noisy from a conventional point of view. The term signal estimation refers to any data that can be viewed as representing a source that provides information.
One object of the present invention is to generate an ambiguous component representation of input data in a powerful way in that it can accommodate any possible input. Applying the previous equation to the power of the ambiguous component and examining it, | X '(ν) |2= | X (ν) |2By recognizing that
D ′ (ν) = U (ν) X (ν)
Where U (ν) is
![]()
[0061]
For any processing operation, as shown, the uncertain processing can be expressed as a combination of a signal estimation stage and a processing task. Therefore, U (ν) is
U (ν) = W (ν) GU(Ν)
Can be expressed as
D ′ (ν) = U (ν) X (ν) = GU(Ν) W (ν) X (ν) = GU(Ν) S ′ (ν)
It becomes.
G only for use in this applicationUMeans an indeterminate task, and the process it represents is
![]()
In order to maximize the versatility of the indeterminate task, it has zero phase or minimum phase characteristics, even if other phase characteristics are appropriate as indicated.
The indeterminate signal D '(ν) provides a concise indication of quality or confidence that is related to the implicit or explicit obligation of the signal and noise model by the processing operation. The point-to-point value provides an estimate of possible errors associated with signal and noise measurements. The squared square value (or any equivalent value) is determined against that of the input data and measures the overall reliability of the estimation process. The uncertain signal is an independent linear transformation of the input data. It may be generated from a signal or noise representation, but can also be generated directly from the input data without having to generate a signal and noise estimate. In many cases of interest, including the visual case, signal and noise estimates can be generated via a linear transformation of an indeterminate signal, if desired, instead of the original input data. Thus, the indeterminate signal is used as an alternative to signal estimation as a primary representation of input data. The advantage over this representation is that the input data tends to be represented with less power and a narrower dynamic range. The aspect of the indeterminate signal is advantageous for data compression applications.
[0062]
FIG. 3 is a block diagram illustrating the relationship between input data set X, processing function W, uncertain operator U, uncertain signal D ', and signal estimate S' according to the present invention. As shown in FIG. 3a, the input signal X (ν) is computed by a processing function W (ν) to produce a signal estimate S ′ (ν). The input data is also computed by an uncertain operator U (ν) to generate an uncertain signal D ′ (ν), as shown in FIG. 3b. This process also includes a processing function W (ν) and an indeterminate processing task G, as shown in FIG.UIt can also be expressed as a combination of This two-stage approach has the advantage that both signal estimation and indeterminate signals are available for subsequent processing operations. Note that an indeterminate signal can be obtained by performing an operation on the output of the estimation process or on a representation of a signal.
[0063]
The uncertain processing and the uncertain signal can be used in many other ways, but the uncertain signal can also be used as an indicator of the quality of the processing operation. Uncertainty processing tends to discriminately report the most unique and unpredictable input aspects, for example in terms of what is most unpredictable and uncertain with respect to implicit or explicit signal and noise models. Indeterminate signals tend to have a more compact and predictable dynamic range than ordinary signal data and possess the same information content as signal estimates. It provides a measure of the mean square error expected for the estimation process or signal representation. It also provides an assessment of the phase characteristics of the input data and / or signal estimate without requiring additional processing.
[0064]
In general, signal processing method design handles tasks such as feature enhancement / suppression, compression, process monitoring, feature detection or extraction, phase extraction, dynamic range optimization, transmission and reception, and various control processes as separate processes. Each performs a specific and unique action on the input data. However, the characteristics of the uncertainty signal demonstrate how the uncertainty processing of the present invention operates to integrate and simplify such processing tasks.
[0065]
Since it possesses the same informative value as the signal representation, many processing operations that would have been performed on the signal representation would replace the uncertain representation with zero or minimal loss of the informable value. It may be executed. Fortunately, indeterminate signals are often smaller than the mean square value and often have a narrower dynamic range than the signal representation. It also emphasizes a single and uncertain aspect of the data, so fewer resources are available for processing what is known or predictable.
[0066]
For example, the color information of a color image is broader without significant noticeable degradation when first expressed in terms of uncertainty, as opposed to conventional representations that linearly combine red, green, and blue luminance values. Subsampled to range. In addition, the inventive method of expressing uncertainty does not require any specific assumptions for this purpose with respect to the characteristics of the input data. Thus, processing operations based on indeterminate signals are less likely to cause errors due to inappropriate predictions. The fact that an indeterminate signal has a compact and predictable dynamic range and distribution of values means that it is quantized more efficiently than is generally possible with respect to signal estimation or signal representation Means that. In fact, the quantization method described here provides signal estimation information in terms of quantized uncertain signals with minimal error and a lower level of quantization compared to typical histogram methods. Provide a means to express possible content.
[0067]
Indeterminate signals tend to discriminately represent features that are implicitly unpredictable, so features can be characterized using simple arithmetic techniques without having to determine in advance which features are important or not important. Can be used to emphasize or depress. With the same characteristics, features can be extracted from the data or the uncertain signal itself using a simple threshold comparison technique. For example, more complex features such as edges, contrast discontinuities, and both eyes of the face do not define what constitutes an edge or eye, and threshold comparison processing is applied to the image indeterminate signal Thus, it can be extracted from the image data. Although they can be used alone or in combination, the techniques of the present invention classify, identify, manipulate, compress, encode, transmit, and process data, minimizing errors and information loss in a simpler manner than traditional methods. However, typical signal and information processing objectives can be achieved. In addition, these techniques provide a new way to control and monitor processing operations.
[0068]
FIG. 4 illustrates an indeterminate task or bias G according to the signal processing method of the invention.U(Box 400) performs an operation to generate an indeterminate signal D ', which is further provided to a processing stage (box 402), followed by task GU(Box 404) is a block diagram illustrating a signal representation S ′ that is calculated by a reciprocal of the signal to obtain a new estimate S ″ (ν) of the signal. As shown, the indeterminate signal D ′ (ν) In order to determine the determined indeterminate signal D ″ (ν), it is subjected to further processing steps. The result is the next task GUReciprocal of (1 / GUTo obtain a new signal representation S ″ (ν).
Suitable processing operations to be performed in
[0069]
The advantages of using an indeterminate signal instead of a signal representation for processing operations are the discrimination between the lower power of the indeterminate signal, the more compact and predictable distortion of the value, and the implicitly unpredictable aspects of the data. It has to do with the tendency to express it. For example, in an image processing application, for a given root mean square difference between S ′ and S ″, the uncertain signal is coarser quantized and subsampled to a wider range than S ′. In the sampling process, the amplitude of the indeterminate signal can be used to adjust the sampling rate or density in a linear, exponential, logarithmic, titration-like, or similar manner. And the correlation may be used as a guide to the positioning of the basis function, and rather than the coefficient value of the basis function, eg, to control the number and / or value of the basis function coefficients stored in the compression process. Alternatively, the absolute value of the indeterminate signal may be used in conjunction with the coefficient value, and the coding method tunes better to data such as an indeterminate signal with a predictable value distribution. The amount of power required for transmission of the upper uncertainty signal is less than the amount required to transmit S '.
[0070]
It should be noted that the present invention provides a signal processing method that is not limited to linear operations where specific phase characteristics are employed to estimate signal and / or noise from input data. By minimizing assumptions regarding the attributes of the input data, Applicants were able to study how conventional processing operations impose signal and noise definitions on the input data. In a sense, all processing operations are biased by the processing operation, so that the processing result can be regarded as a signal estimation process that represents important information content of input data for a specific application. The method of the present invention has clarified how the ambiguity of assigning input data as a result to either signal or noise should be expressed if assumptions are given implicitly during processing.
[0071]
An unusual and unusual feature of the method of the present invention is that it does not require any prejudice as to what kind of signal and noise model is implicit in the process. For a given process, it can be translated for any number of signal and noise models, regardless of what signal and / or noise characteristics the original designer of the process has in mind. is there. The fact that the present invention does not require an explicitly defined signal and noise model means that it is versatile and powerful.
[0072]
However, the Applicant has recognized that there are situations where it is desirable to use the method of the present invention, for example, to compare different processes, input data, signal representations, or indeterminate signals. In such a case, it would be beneficial to have a method by which the implicit signal and noise model can be determined by the same criteria, i.e., by a standard method of translation. For the reasons mentioned, the method should make as few assumptions as possible. It must also be powerful in the sense that it can adapt to all possible inputs.
For example, the present invention provides a means for determining a processing function W (ν) or equivalent based on information such as input data or a determined estimated signal, and the present invention provides a given processing function W ( v), or equivalent thereof, is essentially useful if the present invention provides a method for signal and noise characterization, such as providing a means to define a signal and noise model. Applicant recognizes that there is. This allows a “black box” signal processing operation that has been performed by a particular signal processing system to be concisely expressed in a format compatible with the signal processing method of the present invention.
[0073]
As mentioned earlier, the ability to define signal components is related to knowing what constraints the signal is subject to. In conventional signal processing methods, such knowledge must be obtained before processing the input data. However, for many data sources, including image sources, “signals” are so variable that they cannot be defined in a precise manner. In that case, an attempt is made to assume what constitutes the signal. The severity of possible mistranslations depends on the validity of the assumptions. Conversely, the present invention examines the implications of a particular signal and noise model and uses that information to process input data more efficiently and control aspects of processing.
[0074]
The signal estimation process according to the present invention is intended to make as few assumptions as possible for the reasons described above, which means that it is desirable that the processing method only embodies what is strongly predictable. That is. This also means that the processing method should be designed to operate on a class of signals rather than a particular one of some special signals. This broadens the range of signals and signal classes to which the method of the present invention can be successfully applied.
For any particular set of data, the power spectrum is
| X (ν) |2= <| X (ν) |2> + Δ | X (ν) |2
Where, <| X (ν) |2> Is the total average power spectrum, δ | X (ν) |2Is the deviation from the global mean for a particular data set. Also,
| XS(Ν) |2= <| XS(Ν) |2> + Δ | XS(Ν) |2
And
| XN(Ν) |2= <| XN(Ν) |2> + Δ | XN(Ν) |2
, Respectively indicating a “signal” component and a “noise” component. Note that in the above equation, the deviation term can take both positive and negative values, whereas the true power spectrum is always positive or zero. The overall average power spectrum is an average over all possible sets of input data. It is not an offer for a specific set of data, but a prediction for the whole.
Similarly, the observed variance of any dataset may be considered the sum of the predictable component and the deviation from that predictable component.
![]()
![]()
[0075]
The overall mean variance is the theoretical expected value, while the deviation represents the difference between the theoretical and actual values for a particular set of data. The Poisson process, for example, has a theoretical variance equal to the average brightness of the process, but the actually observed variance differs for each observation time even if the average brightness is the same.
The relation between the gross average power spectrum and the gross mean variance is similar to the deviation term:
[0076]
There are two forms of randomness generally associated with input data: (1) | XN(Ν) |2And randomness of any noise disturbance expressed in terms of and related terms, and (2) δ | X (ν) |2There is a randomness of the deviation from the expected value expressed in terms such as The deviation term reflects the overall variability. They are δ | X (ν) |2It is often ignored because either the signal is considered a priori fully known when = 0 or the deviation is too unexpected to be deductively defined.
[0077]
In classical estimation problems, the goal is to generate the best guess for the signal components of noisy data. Naturally, the guess is based on what is predictable and not on what is an unpredictable deviation. The signal and / or noise components have specific phase characteristics unless it is required to give priority treatment to specific subclasses of all possible stimuli (eg, surfaces and angular pulses). I can't really expect to have it. Therefore, the poorest guesses are based on expected values related only to the power spectrum (or related functions such as correlation functions), ie, the “signal” and “noise” components have some predictable correlation. Rather than being assumed to be related, it is assumed that the signal and noise are not correlated to a certain extent at a particular input. The present invention considers that any signal and noise correlation in a particular input is not predictive of all possible input signal and noise correlations. Thus, the present invention does not consider any particular type of signal and noise correlation. Under these conditions, the estimation processing function is
If the signal and noise have an objective definition that does not depend on the processing method, a processing operation with this formula can be used to generate an estimate of the signal disturbed by the noise. When discussing data representing visual information, the inventor found that the overall mean signal correlation is not a statistically stable correlation in the source of visual data, but is actually the result of image processing. Such processing is called attribute processing. Thus, even though the filter form is arithmetically similar to the Wiener filter form, the assumptions underlying the use of such a filter function in the case of signal and noise models are used in the context of this example. I can't. In signal processing according to the present invention, a signal and noise model may be assumed, however, the present invention focuses on the evaluation or analysis of errors that can be introduced by the model.
[0078]
As is well known and used, Wiener filtering requires that signal and noise characteristics be defined and a priori set. Wiener filtering will only be deemed appropriate if the input consists only of signals and noise with predefined characteristics. Any deviation from these characteristics will result in an optimally insufficient state when Wiener filtering is performed. For these reasons, Kalman filters and other filter types that can accommodate changes during input have been widely replaced by Wiener filtering processes. The arithmetic expression of the Weiner filter serves as a reference when evaluating the least-estimated signal and noise models implied during processing operations, so the signal processing method of the present invention Come out in the commentary. As such, it also serves as a standard for translating indeterministic processing, tasks, and signals of the invention.
[0079]
The processing function described above weights the input data according to the power spectral density (power spectrum evaluated at a specific frequency). Frequency components in the input data that are more likely to be attributed to signal components than noise components (when considered in terms of power density) are less likely to attenuate than those that are more likely to be attributed to noise components. Attribute effects are thus graded with respect to relatively predictable power density.
In general, the estimate processing function is
| W (ν) | = [1 + b2B2(Ν)]-1
And here,
![]()
b2B2Note that (ν) serves as the least descriptive characterization of the signal and noise models that are implicitly embodied in the processing operation. It also serves as the least estimated signal and noise model used in the method of the present invention.
[0080]
Using the signal estimation processing function given above, the uncertainty processing function is
| U (ν) | = bB (ν) [1 + b2B2(Ν)]-1
Or take an equivalent form.
Similarly, indeterminate tasks
| G (ν) | = bB (ν)
Or it is characterized by an equivalent form.
Note that the variance of the indeterminate signal is an indicator of the mean square error predicted by the estimation process.
Signal estimation processing errors are
Errors in the overall signal estimation process
Visual image data is a type of data that is particularly suitable for processing using the method of the present invention. As already explained, there are two fundamental characteristics of visual information that create challenges for conventional processing methods. First, visual information is practically free of constraints. The visual data may be any time series, spatial pattern, or space-time sequence formed by light. Many signal processing problems make use of predefined signal characteristics (eg, carrier frequency, radar system transmit pulses, alphabets), but in many cases visual information is not controlled or predefined with specific details It originates from the source. Visual data can only be recorded as successive photon-induced events, and these events are only statistically related to common parameters such as light intensity and reflectance.
[0081]
The present invention has several significant benefits in processing such data:
(1) The error expected in visual processing is reduced.
(2) Even if an important aspect of the data imposes assumptions only for that purpose, perception
Expressed
(3) Visual information in a concise form with a narrow dynamic range and stable statistics
Expressed,
(4) A signal suitable for application and error control can be generated.
(5) A relatively simple device can be used to carry out the present invention, thereby reducing manufacturing costs.
Can be lowered,
(6) The present invention generates a display of ambiguity, frequency content, and behavior;
Provide the benefit.
[0082]
For any set of objects distributed in any arrangement of space, essentially the only certainty is that the image of the object will have different dimensions in the image plane. The associated power spectrum is linearly summed because imaging is a linear phenomenon, and the composite spectrum is associated with frequency because farther away objects contribute less to lower frequencies than closer objects. It tends to decline. It can be seen that when integrated over all possible configurations of all possible objects, the overall average composite power spectrum results in a decrease with the inverse of the square value of the frequency coordinate. Such a power spectrum is referred to as a scale invariant power spectrum. The assertions made above for spatial correlation can be easily altered to accommodate relative motion and, as a result, are invariant in the time domain.
[0083]
Research on the statistical properties of images has J. et al. (1987). Opt. Soc. Am. A. Vol. 4, 2379-2394, “Relationships Between Statistical Characteristics of Natural Images and Response Characteristics of Cerebral Cortical Cells,” and Don D. W. Attic J. J. et al. (1995), 6: 345-358, “Statistics of natural images that change with time”. These studies focused on the characteristics of naturally occurring images and image sequences. They have found that the majority of individual natural images have an amplitude spectrum of approximately 1 / frequency. However, the applicant has now found that many graphic images and artifact images do not have 1 / frequency characteristics. However, in advancing powerful processing, the method of the present invention described herein focuses on the input class, not the individual input singularities. Applicants have discovered that as a class, the overall average amplitude spectrum of an image has a 1 / frequency characteristic.
[0084]
Furthermore, for image subclasses, such as artifact images, the overall average amplitude spectrum for the subclass also has a 1 / frequency characteristic, even though the individual images are significantly different from the overall average. The applicability of the 1 / frequency characteristic to an image as a class can also be considered as a result of the process of forming an image.
[0085]
In a general sense, a visual image is a two-dimensional (2-D) accumulation of light from a three-dimensional (3-D) environment. Objects in the environment itself do not have a predictable or overall average statistical relationship to each other, but the projection effects create predictability, i.e. distant objects are smaller than nearby objects Corresponding to the image, it takes more time to pass through the detector. This integration is the result of compressing the 3-D depth into a 2-D image, which is 1 / frequency2It is described in the frequency domain by the power spectrum. 1 / frequency on visual image2Using the power spectrum model, the invention model term B2(Ν) is ν2Is set equal to In special cases, b2Is set equal to 1 and the processing function is
W (ν) = 1 / (1 + ν2)
It takes the form of
[0086]
The frequency dependence of the above attribute processing characteristics is A + ν2This is true for any signal and noise model of the form where A is a constant.
The uncertain filter U (ν) is
U (ν) = ν / (1 + ν2)
It takes the form of
A is a constant and A + ν2A more general representation that applies to signal and noise models of the form
W (ν) = W0[Α2/ (Α2+ Ν2]]
Written here, W0Is a magnification having a value of 1 when A = 0. Parameter α2Is b2, And find the frequency at which W (ν) has a half-maximum amplitude.
The corresponding uncertainty processing function is
![]()
Those skilled in the art will appreciate the corresponding functional properties of the indeterminate task from the context of the present invention.
[0087]
If photon capture randomness is a major concern, or if the input data represents a Poisson process, α2Is considered to be a linear function of light intensity (average rate of Poisson processing events). If a fixed noise level is a major concern, for example for transducer or sensor noise, α2Is considered to be a function of the square of luminous intensity. In general, α2The value of r. m. s. (Root mean square) power equivalent to the input r. m. s. It is obtained by comparing with power equivalent. It should be noted that the method of the present invention can be extended to cases where the noise of interest has a predictable power spectrum that is half proportional to frequency. This type of noise is often observed with electronic amplifiers.
[0088]
The hardware of the processing function of the present invention may be a circuit for real-time processing. The minimum phase attribute process may be executed as the same two-stage process of the single pole low pass filter. The indeterminate process may be executed in the same way as W0When = 1, it is particularly direct.
[0089]
For spatial data, the attribute processing may be performed as a two-dimensional equivalent of a transmission line where α represents a radius length constant. As such, it may be incorporated into the sensor or may be instrumented separately. The two-dimensional transmission line equivalent may be a means as a resistance element of the mesh. The nodes of the mesh should have a resistance path to the common ground plane. The effective radius length constant of such means is controlled by modifying the resistance in the mesh and / or the resistance of the ground path. Resistance correction is achieved by using a field effect transistor or similar device in a mode that matches the voltage controlled resistor.
[0090]
When implemented on a programmable device, it takes the form of finding digital filtering coefficients tailored to the method of the present invention. Alternatively, a data array comparable to the FFT representation may be constructed and used in arithmetic combinations to process the data. A function description and / or equivalent of an inverse FFT representation can also be used for the convolution operation. For digital computing devices, v-1Is sometimes computationally efficient and advantageous to approximate as the inverse of the square root of the absolute value of the FFT of an integer array. A useful array for one-dimensional data is [...- 12-1 ...], where the ellipsis represents any number of zero value entries. A useful set of arrays for two-dimensional data is
However, when a> 0, the surrounding ellipsis indicates an arbitrary number of zero value entries. For both one and two dimensions, arrays of non-zero values that are larger than 1 × 3 and 3 × 3 respectively can also be used. The approximate value of the type described may be used to generate an array of values for use in the equivalent of a convolution operation, for example by means of inverse FFT. The computational efficiency of the convolution operation can be improved without causing significant processing errors by quantizing the value and / or limiting the number of non-zero elements of the convolution array.
[0091]
In the processing of visual image data, the relationship between the input uncertainty signal and the phase characteristic demonstrates the benefits of the present invention. Indeterminate signals inherently store information in the phase of the input, extending its use effects beyond simple signal estimation. Any linear transformation of the signal components can be estimated by passing the uncertain signal through a suitable linear filter or equivalent. The non-linear transformation can be generated from an indeterminate signal with a quality that is exactly the same as that generated from a signal estimate. In this way, the indeterminate signal does not eliminate or limit subsequent processing operations. Instead, the indeterminate signal serves as a useful core signal that allows any number of specific operations to be performed in parallel. In accordance with the present invention, the indeterminate signal is considered the primary signal in visual processing instead of conventional source luminance.
[0092]
Most of the features that are only in a particular set of visual data are represented by their phase spectrum. The amplitude spectrum represents the overall correlation regardless of where and when they appear. The phase spectrum represents the position and time of a particular feature regardless of the overall correlation.
[0093]
The overall correlation within the visual data has been expressed in terms of a predictable power spectrum. The details specific to any particular data set are therefore fully represented by the deviation of the specific power spectrum from the phase spectrum and the gross average. These are components that contribute to the indeterminate signal. In a sense, an indeterminate signal for visual data or other data represents an estimate of the phase characteristics of the input. However, unlike the actual whitening process, the indeterminate signal also represents an input mode that indicates total variation, so the indeterminate process does not generate a true representation of the phase characteristic.
[0094]
One advantage of the present invention in visual processing is that the indeterminate signal emphasizes the aspect of the input data that is most likely to distinguish the particular data set from the general data set. This is perceptual emphasis because the unique feature is where the human visual system perceives the most sensitively. Indeterminate signals in essence emphasize the details of the input data, and in one aspect the invention may thus be considered a method of detail enhancement.
A problem with other visual processing methods is the lack of constraints on visual data. Assumptions only for that purpose on biological visual performance had to be made as to what is perceptually important and what is not. Since the method of the present invention emphasizes features without adopting such assumptions, it is less susceptible to inconveniences and bias effects due to such assumptions.
[0095]
Since indeterminate signals represent discriminating details, they can also be used to improve the perceptual quality of the estimated signal component. The power spectrum of the predictable component of the estimated signal is
<| X ’S(Ν) |2> = | W (ν) | <| XS(Ν) |2>
Note that it is written as:
The components that can predict ambiguous power are:
<| D (ν) |2> = (1- | W (ν) |) <| XS(Ν) |2>
It is written.
Therefore, their sum is
<| X ’S(Ν) |2> + <| D (ν) |2> = (| XS(Ν) |2>
Can be written.
In other words, the power of the indeterminate signal provides a predictable error measurement in the signal estimation process.
[0096]
Another advantage in the present invention for visual processing is that the indeterminate signal provides a means to enhance the frequency content of the signal estimate. Adding an indeterminate signal to the signal component estimate tends to sharpen perceptually distinct features such as sharply discontinuous edges and areas of contrast. Subtraction has the opposite effect and proceeds to blur those features. The subtraction technique is useful for preventing blurring that appears in an image with low resolution. The addition technique is effective in clarifying a blurred information source or in an aesthetic sense operation such as a face. It is an important advantage of the present invention that such image processing operations are easy to perform using the method of the present invention. Typically, such operations require the use of bandpass filters, highpass filters, lowpass filters, or equivalents, rather than the simple and efficient addition and subtraction enabled by the present invention.
[0097]
(Data quantization)
The present invention can be used to develop more efficient methods for quantizing data as well as providing techniques for reducing processing errors caused by employing conventional signal and noise models. You can also. Given the same principles underlying the data processing method of the present invention, it is possible to develop a quantization scheme that overcomes many of the disadvantages of conventional methods.
[0098]
The term quantization is used here to refer to the process of converting an originally uncertain signal into a discrete signal. It is essentially an analog-to-digital conversion, but it is not necessary to convert the discrete output to binary form. The quantization method of the present invention is similar in concept to the attribute method described above. This produces a discrete version of the indeterminate signal so that the statistically predictable difference from the original is minimized, thereby providing a quantization process that is consistent with the basic assumptions of the present invention. Become.
[0099]
Applicant's quantization method described herein is not limited to data representing visual sources, but can also be used to quantize data in which values are distributed. Although quantization may be fixed in the sense of having a predefined quantization level, the described method can also be used to accommodate changes that occur in the distribution of values over time. For visual data, this method is often useful for expecting an indeterminate signal to have a Laplacian probability distribution (in the sense of a gross mean) and setting the quantization level according to that expectation. is there. The quantization method is iterative, that is, the original data is quantized, the quantized representation is then compared to the original data or a set of updated data, and the difference between the quantized data and the reference data Is used in such a way that it is also quantized. The source data is approximated by summing with repeated iterations of quantization. This procedure is useful for space-time data such as video.
[0100]
To understand the quantization method of the present invention, three sets of parameters are required: (1) state boundaries, (2) number of states, and (3) state values, which are called translated values. . A sequence pair of state boundaries defines bin edges. Every value in the bin is assigned a number of states. The number of states forms an integer sequence with N members, where N is the total number of states. The “binning” processing of the indeterminate signal results in a discrete version with N possible states. The number of states is also N, but they do not necessarily form an integer sequence. Instead, they are defined to minimize the overall quantization error. The number of states is an index for state values and state boundaries.
[0101]
![]()
![]()
(1) finding a set of state boundaries that minimizes errors; and
(2) Finding a set of state values that minimizes errors.
The choice of state boundary affects errors related to both adjacent bins (states).
[0102]
The state value only affects errors related to its own state. Using differentiation, the appropriate state value is equal to the integral over the bin of dp (d) divided by the integral over the bin of p (d).
For the Laplacian distribution, the state value is
![]()
[0103]
Like Laplacian, exponential functions display a scale-invariant sort. Any point δnThe shape of the function from to ∞ is exactly the same as that from zero to ∞,
![]()
![]()
[0104]
A typical means for visual data being discretized includes luminance A / D conversion. If a good quality image is desired, the number of states employed is often 256 or more. The advantage of the method of the present invention for quantizing an indeterminate signal instead of input data is that it is obtained with significantly less quality (typically 8 to 16) as good as determined with respect to the mean square error. It is. This greatly reduces storage capacity requirements.
Another advantage of the quantization method in the present invention stems from the fact that perceptual aspects of the input data tend to be associated with large values of the indeterminate signal. Since the quantized versions are therefore sorted by state values, the information is stored or transmitted in order of almost perceptual importance. This implies efficient image recognition and storage, transmission and manipulation of a minimal set of data. Prior art methods in which visual data is conventionally recorded in discrete form do not enjoy this benefit.
[0105]
Note that quantization errors (difference between original and quantized version) also tend to have a Laplacian distribution. This means that if the method is used recursively on a stored version of the input data or on a spatial array of input data that changes over time, it can be quantized without any additional effort or constraints. Means to continuously update the quality of information.
To further describe the quantization process, the conversion from an indeterminate signal to a discrete version of the number of states is irrelevant to translating those number of states with state values. This means that the state number representation is stored or transmitted instead of the state value representation, ie the dynamic range requirement depends on the number of states, not the power or range of either the original uncertain signal or the input data. It means that it is set. The state number representation receiver only needs to use the already known state values to obtain the minimum error version of the original indeterminate signal.
[0106]
The efficiency of quantization according to the present invention can be improved by normalizing an indeterminate signal or other input by estimating its variance before quantization. This allows translation values to be scaled as a group rather than individually. When the state boundary can freely cope with the change during input, the “search time” tends to be shortened. For data that is expected to have a Laplacian distribution, the variance of the data can be estimated from the mean absolute value of the data, thereby avoiding a more computationally squaring operation.
[0107]
(General application of the invention)
Although the description for the previous example focuses on the application of the present invention for processing visual data, the present invention can be described as having three main classes of application. That is,
(1) a class that generates a quantity of value to enable evaluation and comparison of the effectiveness of different signal processing schemes;
(2) a class that generates control terms used to adapt, change or control the execution of signal processing operations;
(3) A class as an intermediate form of processed data such that another signal processing operation can be applied to perform the next analysis with a more efficient calculation method with reduced data storage requirements. This form of using the present invention facilitates data transmission and compression operations with another.
[0108]
FIG. 5 is a block diagram illustrating the use of the present invention to generate a quantity of value for the purpose of monitoring signal processing operations. As shown in FIG. 5a, in such an application of the present invention, the signal processing operation performed on the set of input data X (ν) to generate the estimated signal S ′ (ν) is a “black box”. (Denoted as “processing” in the figure). Both the input data and the estimated signal are shown as a function or data set in a generalized frequency space.
[0109]
In this embodiment of the invention, the input data X is processed by an indeterminacy process U to generate an indeterminacy signal D ', which is then input to one or more processing monitors. Instead, as shown in FIG. 5b, D 'is obtained from the signal estimate or display S' and the indeterminate task GuYou may calculate by. The signal estimate or display may exist alone, or may be generated by calculating the input X using the attribute process W.
[0110]
The process monitoring operation includes comparing a value representing D ′, such as an absolute value, a quantized value, a cumulative value, or a root mean square power of D ′, with a set of defined values or functions, such as an FFT transform. Comparing a value representing a transformation of D ′ with a defined set of values or functions, and comparing data representing a change in D ′ with a defined set of functions such as a wave function or another basis function. And creating a record, indicator, or alarm if a relationship is satisfied between D ′ and the defined values and functions.
[0111]
FIG. 6 is a block diagram illustrating how the indeterminate signal of the present invention is used as intermediate form processing data because signal display is used instead of applying additional processing operations. As shown in FIG. 6a, the input data X that is normally provided to the process (shown as "Process" in the figure) is computed by the indeterminacy process U to generate the indeterminacy signal D '. The indeterminate signal is then input to one or more processing task operations (shown as “task” in the figure). Alternatively, as shown in FIG. 6b, D 'is obtained from the signal estimate S' and then the indeterminate task GuIs calculated by The signal estimate or display may exist alone, or may be generated by calculating the input X using the attribute process W.
[0112]
In addition to these possible tasks shown in conjunction with FIG. 5, another processing task includes threshold operations such that only D ′ values within a certain range pass through and output, translation and rotation operations, Shape transformation that transforms or projects distortion applied to image data to obtain aesthetic effects, feature extraction using methods such as quantization, threshold and frequency selection, feature enhancement and suppression, and root mean square Normalization and combinations of such operations or methods can be included without limitation.
[0113]
FIG. 7 is a block diagram illustrating how indeterminate signals are used to control the operation of processing and / or processing tasks in accordance with the present invention. As shown in FIG. 7a, the input data X is subjected to a set of signal processing operations to be performed by a processor (shown as "Process" in the figure), and is calculated by an indeterministic process U to be indeterminate. A signal D ′ is generated. The indeterminate signal is provided to the processor as a control signal. The processor may perform attribute processing in conjunction with one or more processing tasks, or may not be divided into separate attribute and task stages. Alternatively, as shown in FIG. 7b, the uncertain signal is then the uncertain signal is the uncertain task G.uMay be obtained from the signal estimate S ′ calculated by The signal estimate may exist alone, or may be generated by calculating the input X using the attribute process W. In either case, D 'is the control task GcIs selectively calculated.
[0114]
The indeterminate signal or subsequent control task display indicates the choice of processing or processing task, the rate at which the data is sampled or encoded, the amount by which the data is emphasized or suppressed, the type, density And the selection of dithering characteristics such as diffusion, the dynamic range of the signal at any stage of processing by means such as variance or mean square power normalization, and the amount and / or type of resolution reduction or enhancement. The number and / or type or coefficient retained in compression schemes such as JPEG, MPEG, fractal and microwave based methods, the quantization criteria or threshold level to be applied to the data, the characteristics of the attribute processing, or Used to control any combination of these operations.
[0115]
The control task operation comprises means for generating a signal representative of the mean square value D ′ and / or S ′ and / or X ′, rectification, quantization, thresholding, low pass, band pass and high pass filtering methods And any combination of such operations can be included without limitation.
[0116]
FIG. 8 is a block diagram illustrating a second method in which the indeterminate signal of the present invention is used to control processing and / or operation of processing tasks. The difference between FIGS. 8a and 8b and FIGS. 7a and 7b is that in FIG. 8, the uncertain signal is used to control the operations performed on the uncertain signal.
[0117]
FIG. 9 is a block diagram illustrating how the signal processing method of the present invention is used to perform data enhancement and suppression. As shown in FIG. 9a, the input data, typically signal estimation or signal display, is an indeterminate task G.uAnd then scaled by a constant A. The result adds to the original input data and produces an output. FIG. 9b shows the same process, but with two equivalent indeterminate tasks in series. The constant A may be fixed or controlled by a user or an external process.
[0118]
The method shown in FIG. 9a selectively adds or subtracts unique and uncertain features of the input data to the input data to emphasize or suppress those features. The method shown in FIG. 9b provides a means to compensate for errors that may have been introduced during preprocessing of the input data.
[0119]
The value of the constant A is sufficient in the range of
[0120]
When applied to audio data, the suppression tends to silence the sound and / or reduce hiss while the emphasis tends to have the opposite effect. When applied to image data, suppression tends to be perceived as blur or smoothness, while enhancement tends to be perceived as image sharpening and contrast enhancement. Once (A) is set by the user or external processing, means are provided to control the dynamic range or root mean square power of the output to achieve the desired perceptual conditions.
Usually, to complete a continuous range of enhancement and suppression, or smoothing and sharpening, the characteristics of the filter or convolution method need to be adjusted in a continuous manner. Originally, a separate filter is required for each level of emphasis / suppression. In contrast, the method of the present invention achieves the same effect by adjusting the scalar multiplier.
[0121]
FIG. 10 is a block diagram illustrating the use of the signal processing method of the present invention to construct an indeterminate process from pre-existing or hypothesized signal or data processing operations (shown as “Process” in the figure). FIG. As shown in FIG. 10a, the inputs and outputs of the process are supplied to an input / output analysis block (I / 0 analysis). The input is also computed by the indeterminacy process U. Alternatively, as shown in FIG. 10b, if the characteristics of the uncertain process and / or uncertain task are determined by the result of the I / 0 analysis, the output is output to the uncertain task GuYou may calculate by. Typically, such actual processing of input data by indeterminate processing or tasks is performed on a programmable device by arithmetic operations performed by convolution, digital filtering or frequency domain display. Optionally, external processing, such as a user or database system, provides scale and processing task information to the I / O analysis method.
[0122]
If the output of the processing operation depends on the characteristics of the input data in a non-linear manner, the method described above is inherent in the relationship between the input, output and processing method as well as the means of characterizing the processing method and the associated ambiguity. Provide an adaptive means to quantify ambiguity. This property of the method provides an advantage when input data is derived from several different sources or previous processing operations, as for example in a multiplexing system. Typically, the processing method must be designed and implemented to encompass the degrees of freedom allowed for the range of possible inputs. In many cases, the range of inputs and their degrees of freedom must be constrained to meet processing efficiency requirements. In contrast, the advantage of the method of the present invention is that it provides uncertain signals used for process monitoring and control, thereby reducing the tight constraints otherwise required in the design of input and processing operations. It is in.
[0123]
FIGS. 11a and 11b show an uncertain filter U (ν) and an uncertain task G based on the I / O analysis of the processing scheme according to the method of the present invention.uIs a flow diagram illustrating the main signal processing steps performed to determine As shown in FIG. 11b, the I / O analysis described with respect to FIGS. 10a and 10b can be used to provide the information necessary to construct an indeterminate task. This is necessary and sufficient to configure attribute processing and indeterminate processing.
[0124]
Information corresponding to an estimate of the amplitude spectrum of the scale constant A and the effective input / output response function | F | is sufficient to define an uncertain task. Optionally, a known or predicted processing task | GfInformation corresponding to the amplitude spectrum description of | may be provided. | GfIf | cannot be used, the
[0125]
Given input data and an estimated signal, the processing function F (ν) is determined by | F (ν) | = | Y (ν) | / | (Xν) | as shown in the figure. Next, processing task function Gf(Ν) is assumed, but F (ν) = Gf(Ν) W (ν) and W (ν) are generalized signal translation functions. As mentioned above, 0 ≦ 1G for all νfG having a constraint of (ν) | ≦ | F (ν) |f(Ν) is a smoothing operator or another form of weighting function. Next, the following section on signal translation functions
| W (ν) | = | F (ν) | / (A | Gf(Ν) |)
It becomes.
A = max (| F (ν) |) / max (| Gf(Ν) |)
, The scale constant A is adjusted as necessary so as to satisfy the condition of maximum | W (ν) | <1.
[0126]
Next, as shown in FIG. 11a, the uncertain processing function | U (ν) |
(| W (ν) | (1- | W (ν) |))1/2
Obtained from. As shown in FIG. 11b, the indeterminate processing task GuAs a result of I / O analysis
((1- | W (ν) |) / | W (ν) |)1/2
Can also be formed.
[0127]
Note that the notation for | U (ν) | and Gu (ν) does not define the phase characteristics of the respective processes. These functions have zero phase characteristics if the input and / or output data takes the form of an array, as in the case of a still image, and if the input and / or output data is stored in a buffer while waiting for processing. It is appropriate to have Where the data is desired to be processed in real time (or close to it), it is desirable for the function to have a phase characteristic that is as close as possible to the phase characteristic that characterizes a class of filters known as minimum phase filters. Such filter means are known to those skilled in the relevant art and may include methods related to spectral and cepstrum analysis.
[0128]
Several approaches can be used in estimating | F |. Although controversial, the simplest approach is to estimate | F | from the spectral estimates of the stored examples of input and output data, or from the averages derived from some examples of spectral estimates. .
[0129]
The I / O analysis described with respect to FIGS. 11a and 11b provides an indication of the signal-to-noise characteristics inherent in the black box of signal processing operations. It can be more easily determined under certain circumstances than the signal-to-noise ratio based on conventional definitions and processing methods.
[0130]
When U (ν) is applied to the input data X (ν), an ambiguous component of processing relation represented by F (ν) (described above as D ′ (ν)) is obtained. This is a quantity of value indicating the quality of the processing operation used to extract the signal estimate from the input data. A quantity of similar value is determined for a number of possible processing operations to determine which operations process the input data while reducing errors in the processing scheme resulting from the signal imposed on the noise model. To be compared.
[0131]
Another application of the present invention in image processing is to distribute the image into a set of blocks and use an indeterminate display to compare the usefulness of each group of possible image processing operations in each block. This allows the selection of “optimal” processing operations for each block, thereby providing another way to enhance or correct image data.
[0132]
FIG. 12 is a block diagram illustrating a method for performing attribute processing, uncertain processing, uncertain tasks, and related inverse processing in accordance with the present invention. The relationship between attribute processing, indeterminate processing and indeterminate tasks provides a sufficient degree of flexibility in the processing scheme used to obtain the usefulness of the present invention, but this is not the case for any process or task. This is because it can be obtained using two other than itself and / or their reciprocal. Note that the order of operations shown in the figure is not the only possible or desired end result. The sequence of operations shown is suitable for most applications, but can be modified.
[0133]
The present invention provides several advantages when performing the illustrated sequence of operations. When implemented on a programmable device, the processing functions are displayed in the form of discrete frequency domain displays, digital filter coefficients and / or convolution matrices. The storage space required to store such two displays is less than that required to store all three displays. Furthermore, when one of the processes is performed by other means, a significant intermediate result is usually formed.
[0134]
For example, U and G to obtain attribute processing WuIs used to generate an indeterminate signal D 'and a noise estimate N' in addition to the signal estimate S '. In this case and similar cases, the additional steps used to generate S 'are simpler than the convolution action or equivalent action required in many conventional signal processing schemes, thus saving computational resources. For example, data storage requirements may be reduced because D 'includes content that provides sufficient information to generate S' and / or N '. Thus, in this case, only D 'has to be stored for the next operation to generate S'. When one process is executed by the other two means, another intermediate process can be inserted or can be executed in parallel. For example, U and GuThe intermediate result D ′ may be different, such as coding / decoding, resolution reduction, compression, quantization / dequantization, transmission / reception, storage / retrieval, or any combination of similar actions. It is used for processing operations.
[0135]
Intermediate results can also be extracted for use in process monitoring and / or control. Another advantage of such a modular approach to execution is that it can be used to avoid problems with the feasibility of any one process. For example, it is not possible, or perhaps not at all efficient, to construct a specific example of attribute processing directly. Such a situation can occur when rounding errors and / or division by zero problems occur in a programmable device. In hardware, it is difficult to perform a process that has an appropriate response profile with respect to both phase and amplitude, but it can be performed more easily or efficiently with another process or vice versa. . In that case, the modular method provides a “smart” solution.
[0136]
As an example, the indeterminacy process regarding data representing a two-dimensional image is not completely effectively executed. However, a suitable attribute filter is constructed corresponding to the two-dimensional transmission line and incorporated into the image sensor. Therefore, indeterminate processing is attribute processing, then G processing.uThis can be done by executing GuIs executed by any means that can be efficiently solved by the spatial differentiation method. Instead, U is W and 1 / GuCan also be obtained. In this example, GuCan be approximated by using the equivalent of another two-dimensional transmission line, which has a characteristic radial length constant that is at least several times longer than attribute processing, or is efficient in spatial integration like an accumulator It can also be executed by any other process.
[0137]
FIG. 12a shows two representative ways of performing attribute processing to compute the input S + N to generate S '. In one example, U computes the input to generate D ', then D' is 1 / GuTo generate S '. In another example, U computes the input to produce D ', then D'uTo generate N ', which is then subtracted from the input to generate S'.
[0138]
FIG. 12b shows two exemplary methods of performing an indeterminacy process that computes the input S + N to generate D '. In one example, W computes the input to generate S ', then S'uTo generate D '. In another example, W computes the input to produce S ', then S' is subtracted from the input to produce N ', where N' is 1 / GuTo generate D '.
[0139]
FIG. 12c shows two exemplary methods of performing an indeterminate task that computes the input S 'to generate D'. In one example, U computes the input to generate US ', which is then computed at 1 / W to produce D'. In another example, W computes the input to produce WS ′, then WS ′ is subtracted from the input to produce (1-W) S ′, where (1-W) S ′ is 1 / U To generate D ′.
[0140]
FIG. 12d shows a method for performing inverse attribute processing. Such a process is used as an intermediate process as described above. It is also used to compute the signal estimate or display S 'to generate a signal and noise estimate (S + N)'. In the example shown, the equivalent indeterminate task GuThe two stages compute the input and the result is added to the input.
[0141]
FIG. 12e shows a method for performing reverse uncertainty processing. Such a process is used as an intermediate process as described above. It is also used to compute the indeterminate signal D 'to generate a signal and noise estimate (S + N)'. In the example shown, 1 / GuAnd GuCalculate the inputs in parallel and add the results.
[0142]
(Execution of hardware and software of an embodiment of the present invention)
The various embodiments of the signal and image processing methods of the present invention disclosed herein can be implemented in various ways. This includes (1) programming a digital computer to perform the method steps as software, based on the flowcharts and processes described herein, and (2) disclosed in a co-pending provisional patent application. Input signal processing by a certain type of circuit and (3) input signal processing by a dedicated processing configuration.
[0143]
In practice, a computer system having a Pentium class central processing unit (CPU) that executes one or more software routines that are preferably stored or storable in a storage device associated with the computer system. If so, it is sufficient to implement the present invention. The CPU executes a routine that embodies one or more methods described herein. If desired, a general purpose programmable signal processor can be used instead of a computer system. Such signal processors are known to those skilled in the art and can be purchased from a number of trading companies, such as Texas Instruments.
[0144]
Additional supplements regarding various embodiments and implementations of the invention may be useful.
(Overall average power spectrum)
In order to generate data representing the overall average power spectrum, the following procedure is proposed.
(1) Select an input class (for example, a still image).
(2) Record data representing members of the input class using an appropriate sensor.
(3) Sampling the sensor output.
(4) The sampled data is converted using an analog / digital converter (ADC).
(5) Store a specified number of samples.
(6) Perform fast Fourier transform (FFT) on the stored data.
(7) To obtain an estimate of the power spectrum, the absolute value of the FFT data is squared.
(8) Store the estimated power spectrum.
(9) Repeat steps (2) to (7) for another representing the input class, the new estimated power spectrum is added to the currently stored data, and all the stored data is calculated Modify step (7) to display the sum of the estimated power spectrum.
(10) Repeat the process until the desired number of members of the input class has been processed.
(11) Divide the summed power spectrum data by the anti-plurality so that the result represents an average and the result is an estimate of the overall average power spectrum for the input class. The number of iterations required to obtain a reliable overall average power spectrum estimate varies with the input class, but generally less than 20 iterations are sufficient. The estimated power spectrum can also be obtained by fitting a curve, spline and / or analytic function to the average power spectrum obtained by the steps listed above. The power spectrum may be normalized by dividing each data point by the sum of all data points.
[0145]
If the input data originally exists in digital form, steps (1) to (5) are not necessary.
[0146]
The estimate of the overall average power spectrum for the noise component can often be modeled based on knowledge of the characteristics of the input data or knowledge of the characteristics of the sensing device, amplifier and other components. For example, the quantum randomness of photon capture can be modeled as white noise processing even if it is in the form of inherent randomness. Most sensors have thermal noise that is recorded in the absence of an input signal to produce an estimated power spectrum as described above, but can be modeled based on information supplied by the manufacturer. Typically, sensor and amplifier noise can be modeled as white noise processing and / or 1 / f noise processing. If there is no reliable method for determining or characterizing noise, there is no reason to assume that any particular frequency domain is more uncertain than other frequency domains, so it can be modeled as white noise. desirable.
[0147]
(Processing function)
Processing function W (ν), U (ν) and / or GuIt should be noted that when constructing a digital representation of (ν), B (ν) takes the form of a linear array or a matrix of elements. Term B2(Ν) is obtained by squaring each element of B (ν), that is, B (ν) is multiplied by B (ν) element by element. Division is also performed element by element. Similarly, an operation such as [1 + B (ν)] indicates that 1 is added to each element of B (ν).
As a frequency domain representation, the processing function is multiplied by the FFT version of the input data to produce the desired result. Alternatively, an inverse FFT operation can be performed on the frequency domain representation of the processing function to create a display that is compatible with the convolution operation.
[0148]
The minimum phase version of the processing function can be obtained using the following procedure.
(1) A processing function is constructed regardless of the phase characteristics.
(2) Take the absolute value of the processing function
(3) Perform inverse FFT.
(4) Use a function such as rcep () that returns a minimum phase version of the inverse FFT, available from Masswork. The minimum phase result is convolved with the input data. Alternatively, the minimum phase frequency domain version of the processing function can be calculated by calculating the FFT of the minimum phase result.
[0149]
(Data processing)
A preferred data processing method according to the present invention is as follows.
(1) Record data representing members of the input class using a sensor.
(2) Sampling the sensor output.
(3) Convert the sampled data using an analog / digital converter (ADC).
(4) Store a specified number of samples
(5) Perform fast Fourier transform (FFT) on the stored data.
(6) Multiply the FFT version (frequency domain display) of the processing function for each element of the FFT data.
(7) Perform inverse FFT on the result.
(8) Repeat the process as necessary.
Equivalently, using the method of the present invention by performing steps (1) to (4) as described above and (5) convolving the stored data with an appropriate representation of the processing function. Data can also be processed.
[0150]
(Adaptation)
The term b described in this specification2Is an “optimal parameter” representing the ratio of noise variance to signal variance. There are several ways to set this value.
[0151]
If there is a user b2It is useful to be able to set the value of. For example, a user inputs a desired value into a computer program or controls the value using a dial connected to a potentiometer. Such a method is suitable when the user wants to control the perception of image, video or audio data, for example.
Noise r. m. s. If the power is known to be fixed or relatively fixed, or is assumed to be so, b2The value of can be estimated using the following procedure.
(1) r. m. s. Calculate the value.
(2) r. m. s. The input value is squared to calculate the input variance estimate.
(3) Calculate the difference between the input variance and the known, estimated or assumed noise variance to obtain an estimate of the signal variance.
(4) Calculate the ratio between noise variance and variance difference.
If the noise variance is known or assumed to be small relative to the input variance, step (3) need not be performed and the input variance is taken as an estimate of the signal variance. One skilled in the art will understand that an equivalent procedure can be used if the assumed signal component variance or input variance is known or is expected to be fixed or relatively fixed. Let's go. The variance can also be estimated by determining the mean square value of the data with respect to the digital data.
[0152]
In the case of data derived from light, it has been found that random variations due to photon capture impart dispersion to the input in proportion to the average luminous intensity. The variance of the “signal” component increases with the square of the average luminous intensity. Therefore, considering the background noise in the light sensor, b2Is determined from the average luminous intensity rather than from the input variance, for example. If photon randomness is the dominant source of “noise”, b2The value of should be inversely proportional to a linear function of light intensity. Fixed r. m. s. If another noise source with power is dominant, b2The value of should be inversely proportional to the squared luminous intensity function. The average luminous intensity is estimated by a low-pass filter connected to the optical sensor or an average value calculating means.
[0153]
In another case, b2The value of r. m. s. Value of the indeterminate signal r. m. s. Set by the method that minimizes the value. In one such method, it is desirable to perform the following steps.
(1) Recording and storing input
(2) b2To select the initial value of
(3) Processing the input by the method of the present invention to generate an indeterminate signal
(4) r. m. s. Value and input r. m. s. Forming and storing the ratio with the value
(5) b2Selecting a new value for.
(6) generating a new indeterminate signal;
(7) r. m. s. Forming a new ratio of values.
(8) A step of comparing the first ratio and the second ratio. b2If the new value of is greater than the first value, and if the value of the second ratio is greater than the value of the first ratio, then it is always the new smaller b2A value is selected and the value increases or decreases to r. m. s. B such that the value is larger2Repeat the process until a value is found. One skilled in the art will understand that algorithms for finding the minimum are known.
[0154]
(Data operation)
As previously mentioned, the present invention is beneficial because it provides a means for extracting features from data based on the value of an indeterminate signal. For example, the area near the eyes, nose, mouth, hairline, and face outline is preferentially extracted from the face image by holding an indeterminate signal value exceeding a certain range. One method for achieving feature extraction preferably includes the following steps.
(1) A step of obtaining input data.
(2) A step of generating an indeterminate signal.
(3) Normalizing the indeterminate signal by the standard deviation.
(4) A step of comparing the absolute value of the indeterminate signal with a set level.
(5) A step of storing a
A threshold in the range of 1 to 3 works well on the face image. The resulting non-zero value of the binary map tends to mark the position of maximum ambiguity or uncertainty. For images, these ranges are perceptually important and are often useful in the recognition process. The map is multiplied by the input data or signal representation so that only those ranges of input or signal data corresponding to 1 in the binary map are retained. Alternatively, an indeterminate signal may be applied to the binary map. This result is processed by the inverse uncertain task of the method of the present invention to produce a signal representation only within a range corresponding to the extra large value of the uncertain signal. An additional step of quantizing the indeterminate signal is included before or after the threshold comparison.
[0155]
This feature extraction method is used together with the subsampling / interpolation operation so that data corresponding to an uncertain signal having a large numerical value is preferentially held. As an example, it is desirable to obtain an indeterminate signal and perform the following steps.
(1) A step of creating a binary map indicating a position where the absolute value of the indeterminate signal exceeds a specified range.
(2) A step of multiplying the binary map by an indeterminate signal and storing the result.
(3) Subsampling the uncertainty signal by taking the average value of nearby elements so that the resulting elements are less than the elements of the original uncertainty signal.
(4) Interpolating the subsampled uncertain signal so that the result has the same number of elements as the original.
(5) Multiply the result by a binary map created by performing a NOT operation on the original binary map.
(6) adding the result to the stored product of the original binary map and the original indeterminate signal;
[0156]
In addition, the results are processed by the inverse uncertainty task of the method of the present invention, producing a display of signals that preferably retain details near the location of large uncertainty signal values. The steps described are used in a pyramid method in which a range of uncertain signals is maintained at each resolution level.
[0157]
A similar method that preferentially preserves a range of resolution includes adjusting the sampling rate or density according to the value of the indeterminate signal. For example, the absolute value of the indeterminate signal is used as a parameter in a linear function that determines the inter-sample duration such that the input, signal, or indeterminate data is sampled at the end of each duration. If the sample duration decreases as the absolute value of the uncertain signal increases, the data is sampled at a high rate at locations near the oversized uncertain signal. The duration is set by the value of the indeterminate signal at the end of the previous interval, or for example by the average absolute value during the previous interval. This type of method may retain the sign of the indeterminate signal so that negative and positive values do not have the same effect.
[0158]
Another way to control resolution and quality is to obtain an indeterminate signal and include the following steps.
(1) determining an average absolute value or variance of the indeterminate signal for a certain duration or range;
(2) setting the effective bandwidth as a function of the result of
(3) processing the data according to the criteria of step (2) such that only a certain bandwidth of the processed data is retained; As an example of stage (2), the mean absolute value corresponds linearly to the low frequency cutoff of the high pass filter or to the high frequency cutoff of the low pass filter. Similarly in basic function methods such as JPEG, the indeterminate signal may be used to control a number of coefficients so that the processed data is held for a certain duration or range. In the narrow wave based method, the range of magnification allowed is controlled.
[0159]
In summary, the present invention provides a method for analyzing and displaying data used to estimate ambiguities or errors introduced by specific signal and noise models of the data. This allows the data to be displayed and manipulated computationally efficiently without introducing bias from assumptions about the characteristics of the data or the relationships between the different data. The method of the present invention provides specific uses for data compression and transmission while simultaneously processing image data to emphasize or suppress specific features.
[0160]
The terms and expressions described herein are used as terms for description, are not limiting, and correspond to the features illustrated and described with respect to the use of such terms and expressions. It is to be understood that there is no intention to exclude any part or parts thereof, and that various modifications are possible within the scope of the claimed invention. Accordingly, modifications and changes may be made to the disclosed embodiments without departing from the purpose and spirit of the invention as defined in the claims.
[Brief description of the drawings]
FIG. 1 is a block diagram of a representative prior art signal processing system.
FIG. 2 is a block diagram illustrating the processing of a set of input data to output according to the method of the present invention, where the processing operation is shown as a two-stage operation.
FIG. 3 is a block diagram illustrating the relationship between an input data set, processing function, uncertain operator, uncertain signal, and signal estimate according to the present invention.
FIG. 4 shows a signal estimate that has been manipulated by an indeterminate task or biased to generate an indeterminate signal, subject to further processing steps, and then manipulated by reverse of the task to obtain a new signal estimate. It is a block diagram.
FIG. 5 is a block diagram showing how the present invention can be used to generate a number of advantages for monitoring signal processing operations.
FIG. 6 is a block diagram illustrating how the indeterminate signal of the present invention is used as an intermediate form of processed data to replace a signal representation before application of additional processing operations.
FIG. 7 is a block diagram illustrating how processing and / or processing task operations are controlled using the indeterminate signal of the present invention.
FIG. 8 is a block diagram illustrating a second way of controlling processing and / or operation of processing tasks using the indeterminate signal of the present invention.
FIG. 9 is a block diagram showing how data enhancement and suppression are performed using the signal processing method of the present invention.
FIG. 10 is a block diagram illustrating the construction of an indeterminate process from a previously existing or hypothesized signal or data processing operation using the signal processing method of the present invention.
FIG. 11 shows the primary signal processing steps performed to determine uncertain filters and uncertain tasks from the I / O analysis of the processing scheme according to the method of the present invention.
FIG. 12 is a block diagram illustrating a method for performing attribute processing, uncertain processing, uncertain tasks, and related inverse processing in accordance with the present invention.
Claims (8)
信号構成要素の総体平均パワースペクトル〈|KS(ν)|2〉を得る段階と、
汚染構成要素の総体平均パワースペクトル〈|KN(ν)|2〉を得る段階と、
項B2=〈|KN(ν)|2〉/〈|KS(ν)|2〉を形成する段階と、
フィルター関数W(ν)、但し|W(ν)|=[1+b2B(ν)2]-1、且つbは正、を形成する段階と、
項U(ν)、但し|U(ν)|=[W(ν)(1−W(ν))]1/2、を形成する段階と、
結果U(ν)X(ν)を形成するためにX(ν)を処理する段階とから成ることを特徴とする方法。In a method of processing a set of input data X (ν) representing a desired signal component plus an unwanted contamination component,
A step of obtaining a gross average power spectrum of the signal components <| 2 | K S (ν )>
Obtaining a total average power spectrum <| K N (ν) | 2 > of the contaminating component;
Forming the term B 2 = <| K N (ν) | 2 > / <| K S (ν) | 2 >;
Forming a filter function W (ν), where | W (ν) | = [1 + b 2 B (ν) 2 ] −1 , and b is positive;
Forming the term U (ν), where | U (ν) | = [W (ν) (1-W (ν))] 1/2 ,
Processing X (ν) to form the result U (ν) X (ν).
前記基準値対の間に存在する結果のそれらの値を選択するステップと、
を更に含むことを特徴とする請求項1に記載の方法。Comparing the result XU to a set of reference value pairs;
Selecting those values of the results that exist between the reference value pairs;
The method of claim 1 further comprising:
Applications Claiming Priority (3)
| Application Number | Priority Date | Filing Date | Title |
|---|---|---|---|
| US5439997P | 1997-07-31 | 1997-07-31 | |
| US60/054,399 | 1997-07-31 | ||
| PCT/US1998/015767 WO1999006941A2 (en) | 1997-07-31 | 1998-07-30 | Apparatus and methods for image and signal processing |
Publications (2)
| Publication Number | Publication Date |
|---|---|
| JP2001512298A JP2001512298A (en) | 2001-08-21 |
| JP4219552B2 true JP4219552B2 (en) | 2009-02-04 |
Family
ID=21990808
Family Applications (1)
| Application Number | Title | Priority Date | Filing Date |
|---|---|---|---|
| JP2000505594A Expired - Lifetime JP4219552B2 (en) | 1997-07-31 | 1998-07-30 | Apparatus and method for image and signal processing |
Country Status (7)
| Country | Link |
|---|---|
| US (1) | US6014468A (en) |
| EP (1) | EP0998720A4 (en) |
| JP (1) | JP4219552B2 (en) |
| KR (1) | KR20010022487A (en) |
| AU (1) | AU8671098A (en) |
| CA (1) | CA2298738A1 (en) |
| WO (1) | WO1999006941A2 (en) |
Families Citing this family (53)
| Publication number | Priority date | Publication date | Assignee | Title |
|---|---|---|---|---|
| DE19740565A1 (en) * | 1997-09-15 | 1999-03-18 | Max Planck Gesellschaft | Mode detection method for dynamic system |
| JP3695084B2 (en) * | 1997-09-19 | 2005-09-14 | コニカミノルタビジネステクノロジーズ株式会社 | Similar image retrieval apparatus, similar image retrieval method, and program storage medium |
| KR100294890B1 (en) * | 1998-07-01 | 2001-07-12 | 윤종용 | Digital video coder and decoder using watermarking and method therefor |
| JP2000057695A (en) * | 1998-08-13 | 2000-02-25 | Sony Corp | Information recording / reproducing apparatus and method, and providing medium |
| US8406498B2 (en) | 1999-01-25 | 2013-03-26 | Amnis Corporation | Blood and cell analysis using an imaging flow cytometer |
| US8885913B2 (en) | 1999-01-25 | 2014-11-11 | Amnis Corporation | Detection of circulating tumor cells using imaging flow cytometry |
| US6707551B2 (en) * | 2000-01-24 | 2004-03-16 | Amnis Corporation | Multipass cavity for illumination and excitation of moving objects |
| US7057732B2 (en) * | 1999-01-25 | 2006-06-06 | Amnis Corporation | Imaging platform for nanoparticle detection applied to SPR biomolecular interaction analysis |
| US8131053B2 (en) | 1999-01-25 | 2012-03-06 | Amnis Corporation | Detection of circulating tumor cells using imaging flow cytometry |
| US7450229B2 (en) * | 1999-01-25 | 2008-11-11 | Amnis Corporation | Methods for analyzing inter-cellular phenomena |
| US6975400B2 (en) * | 1999-01-25 | 2005-12-13 | Amnis Corporation | Imaging and analyzing parameters of small moving objects such as cells |
| US20060257884A1 (en) * | 2004-05-20 | 2006-11-16 | Amnis Corporation | Methods for preparing and analyzing cells having chromosomal abnormalities |
| US6633679B1 (en) | 1999-03-23 | 2003-10-14 | Teletechnologies, Ltd. | Visually lossless still image compression for CMYK, CMY and Postscript formats |
| US6690488B1 (en) * | 1999-09-30 | 2004-02-10 | Polaroid Corporation | Method and apparatus for estimating the spatial frequency response of a digital image acquisition system from the images it produces |
| US7123166B1 (en) | 2000-11-17 | 2006-10-17 | Haynes Michael N | Method for managing a parking lot |
| US6816085B1 (en) | 2000-01-14 | 2004-11-09 | Michael N. Haynes | Method for managing a parking lot |
| US7146055B2 (en) * | 2000-05-05 | 2006-12-05 | Hewlett-Packard Development Company, L.P. | Image processing decompression apparatus and method of using same different scaling algorithms simultaneously |
| US6875973B2 (en) * | 2000-08-25 | 2005-04-05 | Amnis Corporation | Auto focus for a flow imaging system |
| US6934408B2 (en) * | 2000-08-25 | 2005-08-23 | Amnis Corporation | Method and apparatus for reading reporter labeled beads |
| US6583865B2 (en) | 2000-08-25 | 2003-06-24 | Amnis Corporation | Alternative detector configuration and mode of operation of a time delay integration particle analyzer |
| US6778263B2 (en) * | 2000-08-25 | 2004-08-17 | Amnis Corporation | Methods of calibrating an imaging system using calibration beads |
| AU2001297843A1 (en) | 2000-10-12 | 2002-12-23 | Amnis Corporation | Imaging and analyzing parameters of small moving objects such as cells |
| AU2002324422A1 (en) * | 2001-02-21 | 2002-12-23 | Amnis Corporation | Method and apparatus for labeling and analyzing cellular components |
| AU2002308693A1 (en) * | 2001-04-25 | 2002-11-05 | Amnis Corporation | Method and apparatus for correcting crosstalk and spatial resolution for multichannel imaging |
| US6618140B2 (en) | 2001-06-18 | 2003-09-09 | Amnis Corporation | Spectral deconvolution of fluorescent markers |
| US20030016294A1 (en) * | 2001-07-17 | 2003-01-23 | Sean Chiu | Compensation apparatus for digital image signal |
| US7190832B2 (en) * | 2001-07-17 | 2007-03-13 | Amnis Corporation | Computational methods for the segmentation of images of objects from background in a flow imaging instrument |
| JP4427258B2 (en) * | 2002-07-18 | 2010-03-03 | 株式会社ミツトヨ | Signal processing method, signal processing program, recording medium recording this signal processing program, and signal processing apparatus |
| WO2004019164A2 (en) * | 2002-08-20 | 2004-03-04 | Fusionarc, Inc. | Method of multiple algorithm processing of biometric data |
| US7742651B2 (en) * | 2003-04-04 | 2010-06-22 | Thomson Licensing | Method and apparatus for enhancing detail in an image |
| DE10317367B4 (en) * | 2003-04-15 | 2007-01-11 | Siemens Ag | Method of performing digital subtraction angiography using native volume data sets |
| US8953866B2 (en) | 2004-03-16 | 2015-02-10 | Amnis Corporation | Method for imaging and differential analysis of cells |
| EP1725854B1 (en) | 2004-03-16 | 2019-05-08 | Luminex Corporation | Method for imaging and differential analysis of cells |
| WO2005098430A2 (en) | 2004-03-16 | 2005-10-20 | Amnis Corporation | Image based quantitation of molecular translocation |
| US20050210756A1 (en) * | 2004-03-25 | 2005-09-29 | Saint-Gobain Ceramics & Plastics, Inc. | Coated abrasive products and processes for forming same |
| JP2006081156A (en) * | 2004-08-13 | 2006-03-23 | Fuji Photo Film Co Ltd | Image processing apparatus, method, and program |
| US7609882B2 (en) * | 2005-05-25 | 2009-10-27 | Himax Technologies Limited | Image compression and decompression method capable of encoding and decoding pixel data based on a color conversion method |
| WO2007067999A2 (en) * | 2005-12-09 | 2007-06-14 | Amnis Corporation | Extended depth of field imaging for high speed object analysis |
| US7822223B2 (en) * | 2006-01-13 | 2010-10-26 | New Jersey Institute Of Technology | Method for identifying marked images using statistical moments based at least in part on a JPEG array |
| US20110044501A1 (en) * | 2006-07-14 | 2011-02-24 | Ailive, Inc. | Systems and methods for personalized motion control |
| US8253752B2 (en) | 2006-07-20 | 2012-08-28 | Qualcomm Incorporated | Method and apparatus for encoder assisted pre-processing |
| US8155454B2 (en) | 2006-07-20 | 2012-04-10 | Qualcomm Incorporated | Method and apparatus for encoder assisted post-processing |
| JP5215945B2 (en) * | 2008-08-12 | 2013-06-19 | 株式会社ソニー・コンピュータエンタテインメント | Image processing device |
| US8767127B2 (en) | 2009-04-17 | 2014-07-01 | General Instrument Corporation | System for reducing noise in video processing |
| US8451524B2 (en) * | 2009-09-29 | 2013-05-28 | Amnis Corporation | Modifying the output of a laser to achieve a flat top in the laser's Gaussian beam intensity profile |
| EP2315358A1 (en) * | 2009-10-09 | 2011-04-27 | Thomson Licensing | Method and device for arithmetic encoding or arithmetic decoding |
| US8817115B1 (en) | 2010-05-05 | 2014-08-26 | Amnis Corporation | Spatial alignment of image data from a multichannel detector using a reference image |
| US9503756B2 (en) | 2011-12-09 | 2016-11-22 | Arris Enterprises, Inc. | Encoding and decoding using perceptual representations |
| US20130195206A1 (en) | 2012-01-31 | 2013-08-01 | General Instrument Corporation | Video coding using eye tracking maps |
| US9661328B2 (en) | 2013-03-15 | 2017-05-23 | Arris Enterprises, Inc. | Method of bit allocation for image and video compression using perceptual guidance |
| US10264263B2 (en) | 2016-07-06 | 2019-04-16 | Morpho Detection, Llc | Systems and methods for compressing image data generated by a computed tomography (CT) imaging system |
| JP6911930B2 (en) * | 2017-10-19 | 2021-07-28 | 日本電気株式会社 | Signal processing equipment, signal processing methods and programs |
| CN111311525A (en) * | 2019-11-20 | 2020-06-19 | 重庆邮电大学 | A dual-interval equalization algorithm for image gradient field based on histogram probability correction |
Family Cites Families (4)
| Publication number | Priority date | Publication date | Assignee | Title |
|---|---|---|---|---|
| EP0525408A3 (en) * | 1991-07-01 | 1993-12-22 | Eastman Kodak Co | Method for multiframe wiener restoration of noisy and blurred image sequences |
| GB9321372D0 (en) * | 1993-10-15 | 1993-12-08 | Avt Communications Ltd | Video signal processing |
| KR100316116B1 (en) * | 1993-12-06 | 2002-02-28 | 요트.게.아. 롤페즈 | Noise reduction systems and devices, mobile radio stations |
| US5694484A (en) * | 1995-05-15 | 1997-12-02 | Polaroid Corporation | System and method for automatically processing image data to provide images of optimal perceptual quality |
-
1998
- 1998-07-30 US US09/126,666 patent/US6014468A/en not_active Expired - Lifetime
- 1998-07-30 JP JP2000505594A patent/JP4219552B2/en not_active Expired - Lifetime
- 1998-07-30 AU AU86710/98A patent/AU8671098A/en not_active Abandoned
- 1998-07-30 EP EP98938111A patent/EP0998720A4/en not_active Withdrawn
- 1998-07-30 KR KR1020007001073A patent/KR20010022487A/en not_active Abandoned
- 1998-07-30 CA CA002298738A patent/CA2298738A1/en not_active Abandoned
- 1998-07-30 WO PCT/US1998/015767 patent/WO1999006941A2/en not_active Ceased
Also Published As
| Publication number | Publication date |
|---|---|
| EP0998720A2 (en) | 2000-05-10 |
| EP0998720A4 (en) | 2005-03-23 |
| US6014468A (en) | 2000-01-11 |
| CA2298738A1 (en) | 1999-02-11 |
| WO1999006941A3 (en) | 1999-10-14 |
| AU8671098A (en) | 1999-02-22 |
| JP2001512298A (en) | 2001-08-21 |
| KR20010022487A (en) | 2001-03-15 |
| WO1999006941A2 (en) | 1999-02-11 |
Similar Documents
| Publication | Publication Date | Title |
|---|---|---|
| JP4219552B2 (en) | Apparatus and method for image and signal processing | |
| US6360021B1 (en) | Apparatus and methods of image and signal processing | |
| US7046857B2 (en) | Apparatus and methods for image and signal processing | |
| CN110246089B (en) | Bayer domain image noise reduction system and method based on non-local mean filtering | |
| CN116664450A (en) | Image enhancement method, device, equipment and storage medium based on diffusion model | |
| US5909516A (en) | Method and apparatus for decomposing an image stream into units of local contrast | |
| EP1274250A2 (en) | A method for utilizing subject content analysis for producing a compressed bit stream from a digital image | |
| Ma et al. | Difference based median filter for removal of random value impulse noise in images | |
| WO2022213825A1 (en) | Neural network-based end-to-end speech enhancement method and apparatus | |
| CN118657679A (en) | A method and device for enhancing details of high dynamic range infrared images | |
| EP3490255B1 (en) | Intelligent compression of grainy video content | |
| Alanazi | An Optimized Implementation of a Novel Nonlinear Filter for Color Image Restoration. | |
| Asha et al. | Satellite image enhancement using contrast limited adaptive histogram equalization | |
| EP4485925A1 (en) | Image noise compression | |
| Vyas et al. | Image enhancement | |
| Bouzidi et al. | Revertible tone mapping of high dynamic range imagery: integration to JPEG 2000 | |
| Garg et al. | Enhanced Image Compression and Reconstruction Using DWT and IDWT with Multiple Wavelet Functions | |
| Cafforio et al. | Edge enhancement for subband-coded images | |
| Lee et al. | Dynamic range compression and contrast enhancement for digital images in the compressed domain | |
| CN121903889A (en) | A method, system, device and medium for dehazing remote sensing images | |
| Vishalakshi et al. | Wavelet energy-based adaptive retinex algorithm for low light mobile video enhancement | |
| Mei | ABS-CSV_VAE: a compressed image quality optimization and feature enhancement method based on singular value decomposition | |
| Reddy et al. | UNDERWATER IMAGE ENHANCEMENT USING VERY DEEP SUPER RESOLUTION TECHNIQUE. | |
| CN121462764A (en) | Image compression and decompression method, model, system, device and storage medium | |
| Amin | Removal of Blocking Artifacts from Jpeg-Compressed Images Using Neural Network |
Legal Events
| Date | Code | Title | Description |
|---|---|---|---|
| A621 | Written request for application examination |
Free format text: JAPANESE INTERMEDIATE CODE: A621 Effective date: 20050622 |
|
| A977 | Report on retrieval |
Free format text: JAPANESE INTERMEDIATE CODE: A971007 Effective date: 20080306 |
|
| A131 | Notification of reasons for refusal |
Free format text: JAPANESE INTERMEDIATE CODE: A131 Effective date: 20080317 |
|
| A601 | Written request for extension of time |
Free format text: JAPANESE INTERMEDIATE CODE: A601 Effective date: 20080617 |
|
| A602 | Written permission of extension of time |
Free format text: JAPANESE INTERMEDIATE CODE: A602 Effective date: 20080624 |
|
| A521 | Request for written amendment filed |
Free format text: JAPANESE INTERMEDIATE CODE: A523 Effective date: 20080917 |
|
| TRDD | Decision of grant or rejection written | ||
| A01 | Written decision to grant a patent or to grant a registration (utility model) |
Free format text: JAPANESE INTERMEDIATE CODE: A01 Effective date: 20081104 |
|
| A01 | Written decision to grant a patent or to grant a registration (utility model) |
Free format text: JAPANESE INTERMEDIATE CODE: A01 |
|
| A61 | First payment of annual fees (during grant procedure) |
Free format text: JAPANESE INTERMEDIATE CODE: A61 Effective date: 20081112 |
|
| FPAY | Renewal fee payment (event date is renewal date of database) |
Free format text: PAYMENT UNTIL: 20111121 Year of fee payment: 3 |
|
| R150 | Certificate of patent or registration of utility model |
Free format text: JAPANESE INTERMEDIATE CODE: R150 |
|
| FPAY | Renewal fee payment (event date is renewal date of database) |
Free format text: PAYMENT UNTIL: 20121121 Year of fee payment: 4 |
|
| FPAY | Renewal fee payment (event date is renewal date of database) |
Free format text: PAYMENT UNTIL: 20131121 Year of fee payment: 5 |
|
| R250 | Receipt of annual fees |
Free format text: JAPANESE INTERMEDIATE CODE: R250 |
|
| R250 | Receipt of annual fees |
Free format text: JAPANESE INTERMEDIATE CODE: R250 |
|
| R250 | Receipt of annual fees |
Free format text: JAPANESE INTERMEDIATE CODE: R250 |
|
| R250 | Receipt of annual fees |
Free format text: JAPANESE INTERMEDIATE CODE: R250 |
|
| EXPY | Cancellation because of completion of term |