JP4160258B2 - A new perceptual threshold determination for gradient-based local contour detection - Google Patents
A new perceptual threshold determination for gradient-based local contour detection Download PDFInfo
- Publication number
- JP4160258B2 JP4160258B2 JP2000524756A JP2000524756A JP4160258B2 JP 4160258 B2 JP4160258 B2 JP 4160258B2 JP 2000524756 A JP2000524756 A JP 2000524756A JP 2000524756 A JP2000524756 A JP 2000524756A JP 4160258 B2 JP4160258 B2 JP 4160258B2
- Authority
- JP
- Japan
- Prior art keywords
- image
- contour
- gradient
- pixel
- threshold
- Prior art date
- Legal status (The legal status is an assumption and is not a legal conclusion. Google has not performed a legal analysis and makes no representation as to the accuracy of the status listed.)
- Expired - Fee Related
Links
Images


Classifications
-
- G—PHYSICS
- G06—COMPUTING; CALCULATING OR COUNTING
- G06V—IMAGE OR VIDEO RECOGNITION OR UNDERSTANDING
- G06V10/00—Arrangements for image or video recognition or understanding
- G06V10/40—Extraction of image or video features
- G06V10/46—Descriptors for shape, contour or point-related descriptors, e.g. scale invariant feature transform [SIFT] or bags of words [BoW]; Salient regional features
-
- G—PHYSICS
- G06—COMPUTING; CALCULATING OR COUNTING
- G06T—IMAGE DATA PROCESSING OR GENERATION, IN GENERAL
- G06T7/00—Image analysis
- G06T7/10—Segmentation; Edge detection
- G06T7/12—Edge-based segmentation
-
- G—PHYSICS
- G06—COMPUTING; CALCULATING OR COUNTING
- G06T—IMAGE DATA PROCESSING OR GENERATION, IN GENERAL
- G06T2207/00—Indexing scheme for image analysis or image enhancement
- G06T2207/10—Image acquisition modality
- G06T2207/10016—Video; Image sequence
-
- G—PHYSICS
- G06—COMPUTING; CALCULATING OR COUNTING
- G06T—IMAGE DATA PROCESSING OR GENERATION, IN GENERAL
- G06T2207/00—Indexing scheme for image analysis or image enhancement
- G06T2207/20—Special algorithmic details
- G06T2207/20172—Image enhancement details
- G06T2207/20192—Edge enhancement; Edge preservation
Description
【0001】
(発明の背景)
(1.発明の分野)
本発明は画像処理に関する。より具体的には、本発明は画像内のフィーチャの検出に関する。
【0002】
(2.関連技術の説明)
画像処理の技術では、一定のフィーチャによって被写体/シーンの画像を特色づけることが可能である。重要な当該画像フィーチャの1つとして画像の「輪郭線」フィーチャがある。画像の輪郭線は、輝度の急な変化の度合および/または画素の第1の領域と画素の第2の領域との間の色彩変化によって定められる。2つの領域の間の境界に沿って、いずれかの側の画素のグループを「輪郭線」画素または輪郭線フィーチャに属する画素として分類することができる。たとえば、輪郭線フィーチャの極端な例として、純粋な青色を有する3列の画素とそれら青色の画素に連続的に続く2列の白色の画素を考えてみる。青色を有する第3列の画素と白色を有する第4列の画素の各々を輪郭線と見なすことができる。第3列と第4列の間には急激かつ大きな色彩および輝度の差があるため、これらの画素は「輪郭線」上にあり、集合的に輪郭線フィーチャを表わしている。それに対して、1列の白色画素とそれに隣接する1列の灰色の画素は、輝度の差が輪郭線として分類されるほど大きく急激でないため、輪郭線フィーチャであるとは考えにくい。輪郭線検出として知られる技術分野は、輪郭線を検出および区別するための技術を提供するとともに、画像処理のアプリケーションにおける画像の輪郭線情報に関する様々な形式の有益なデータおよび統計を提供する。
【0003】
輪郭線フィーチャへの画像の分類は、画像処理およびレンダリングの数多くの重要なアプリケーションに応用されている。1つの重要なアプリケーションとしては、ぼけを除去して輪郭線を強調することによる画像の鮮鋭化がある。他のアプリケーションとしては、コンピュータ・ビジョンまたはOCR(光学式文字認識)に使用することができる形状またはパターン認識が挙げられる。これらのアプリケーションは、輪郭線検出方法の成功に著しく依存する。輪郭線を検出することができなければ輪郭線を強調することができず、輪郭線境界に対して非輪郭線を正しく識別しなければ、ぼけが除去されない。輪郭線検出の失敗は、次の2つの場合のいずれかで生じるものと考えられる。「偽」輪郭線が形成される場合、すなわち輪郭線ではないフィーチャが輪郭線として分類される場合、または輪郭線が破壊される場合、すなわち輪郭線であるフィーチャが非輪郭線フィーチャとして分類され非輪郭線として処理されて輪郭線が破壊される場合である。
【0004】
輪郭線検出の問題については、多くの異なる角度から取り組みが行われてきた。1つのアプローチは、輪郭線を、1つの画素または領域から他の画素または領域までの輝度レベルの変化と見なすことである。この変化を測定することができる勾配演算子(gradient operator)のような演算子(データ集合に適用される数学関数)を輪郭線検出に使用することが可能である。何らかの形の演算子を使用して輝度レベルの変化を計算するのに加えて、輪郭線検出器は、またある特定の輝度値の変化が輪郭線領域または輪郭線画素であるか、あるいは非輪郭線領域または非輪郭線画素であるかを示すしきい値を有していなければならない。そのしきい値と測定された輝度変化を比較することによって画素が輪郭線に属するか否かを判断する。しきい値に基づく輪郭線検出器のほとんどは、画像全体に適用可能でさらに特定の画像作成デバイスまたは工程によって生成されるあらゆる画像に適用される所定のしきい値を固定しようとする。ある画像内で陰影のような特定のフィーチャが輪郭線検出工程を損なう可能性があるため、これには問題がある。たとえば、画像の一部が光源の陰影の中にあるのに対して画像の他の領域が光源のより輝度の高いエリアにある場合は、陰影エリア内の輝度変化はさほど明確ではなく、輝度の高いエリア内の輪郭線ほど十分に輪郭線を検出することはできない。陰影領域は、輪郭線フィーチャが同じであっても輝度の高いエリアに比べてその輝度が低く狭い範囲にあるため、小さな輝度変化を示す。その結果、高いしきい値が設定される場合、画像の陰影領域に存在する輪郭線フィーチャは非輪郭線フィーチャに誤分類されることになる。
【0005】
この問題を是正するために、より低いしきい値を設定することが必要になる。しかし、低いしきい値を設定することによって、しばしば偽輪郭線を導くという反対の問題がもたらされる。低いしきい値は、ある1つの画像または1つのタイプの画像については有効であっても、他のタイプの画像については偽輪郭線を導くことによって不正確な輪郭線検出結果がもたらされる可能性がある。したがって、画像ごとに、ユーザが特定の画像に対するしきい値を選択するマニュアル工程によってしばしばしきい値が設定されてきた。しきい値の選択は試行錯誤、すなわちすべての画像に対してあるしきい値を試して後にその結果を解析することによって達成されることが多い。さらに、たいていの輪郭線検出器は、画像のあらゆる部分にしきい値を適用するため、局部輝度範囲の問題を無視するものである。開発された輪郭線検出器のなかで最もよく知られており最も効果的な輪郭線検出器の1つ、すなわちキャニー(Canny)輪郭線検出器はヒステリシスしきい値決定を採用している。ヒステリシスしきい値決定では、高しきい値と低しきい値を設定し、第1のパスにおいてしきい値の変化(勾配)が高しきい値よりも大きいすべての画素を輪郭線画素と見なす。次のパスにおいて、低しきい値よりも大きい輪郭線画素に隣接または近接するあらゆる画素もまた輪郭線画素として分類される。現在では、キャニー輪郭線検出器を用いた場合でも、ヒステリシスを構成する高しきい値と低しきい値の両方がマニュアルで選択されている。
【0006】
したがって、ユーザの手を介さずに画像ごとにしきい値を自動的に選択する改良型の輪郭線検出器を提供することが望ましい。さらに、前述したように、同一の画像の領域内でしきい値を調整することができるように、画像内の潜在的な局部輝度特性を考慮することが望ましい。さらに、輪郭線検出は一般に計算コストを伴うソフトウェアにおいて実施されているため、ディジタル・カメラまたはロボット・アイが自動的なハードウェアに基づく輪郭線検出機能を備えることができるように、高速のハードウェア実施態様に適した技術を考案することが望ましい。
【0007】
(発明の概要)
画像の選択部分である画像の局部化した領域を定め、次いでユーザの手を介さずに、局部化した領域内の輪郭線検出に適用するしきい値を自動的に決定する方法を開示する。そのしきい値は、局部化した領域内の画素の輝度情報に基づく。
【0008】
本発明の方法および装置の目的、特徴および利点は、以下の説明を読めば明らかになるであろう。
【0009】
(発明の詳細な説明)
次に、図を参照しながら、本発明の例示的な実施形態を説明する。それらの例示的な実施形態は本発明の態様を例示するものであり、本発明の範囲を制限するものとして解釈されるべきではない。これらの例示的な実施形態は、主にブロック図またはフローチャートを参照しながら説明されている。フローチャートに関しては、フローチャート内の各ブロックは方法のステップと方法のステップを実行するための装置構成部の両方を表している。実施態様に応じて、対応する装置構成部はハードウェア、ソフトウェア、ファームウェアまたはそれらの組合せによって構成される。
【0010】
センサまたはカメラまたは他の画像作成デバイスによって取り込まれた画像あるいは他の手段によって得られた画像を解析するときは、その画像は、輪郭線フィーチャであるフィーチャを有し、その他のすべてのフィーチャは非輪郭線フィーチャであるといわれる。何が輪郭線を形成しているかを決定するのは困難で、正確な処理ではない。輪郭線検出は、しばしば輝度の変化を測定し、次いでその輝度変化をあるしきい値と比較することに基づく。しきい値が低すぎると偽輪郭線が生成され、しきい値が高すぎると輪郭線が見逃されるため、このしきい値の選択は輪郭線検出における根本的な問題である。単一のしきい値があらゆる画像に適するわけではないため、しきい値を画像ごとに調整しなければならない。これはしばしばユーザによってマニュアルで実施される。そうでなければ、あらかじめしきい値を設定することになるが、輪郭線を検出する目的に応じて特定の画像が特定のしきい値に十分に対応しえないため、これは望ましいことではない。さらに、伝統的な画像検出における画像ベースによってある画像に対するしきい値を決定したとしても、そのしきい値は画像全体に均一に適用される。他の領域と異なる1つの画像領域内で輝度のフィールドまたは範囲が変化しうる異なる光源を有する画像では、一定のしきい値は不適切であり、不正確な輪郭線検出結果が導かれることになる。
【0011】
正確な輪郭線検出は、パターン認識、コンピュータ・ビジョン、画像強調および画像処理についての他の多くの分野において重要である。しきい値の設定においてユーザが介在する必要性を取り除き、さらに画像の輝度特性に基づいてしきい値を決定することが望ましい。好ましくは、低輝度変動の輪郭線でも正確に検出されるように、それらの技術を局部領域に適用すべきである。また、要望に応じて、デジタル・カメラまたは画像パターンを生成する画像生成デバイスにおいてその技術を実施できるように、高速ハードウェア実施態様が可能な技術を使用すべきである。図1および以下に記述する他の様々な実施形態には、当該可能な輪郭線検出手法の1つが示されている。
【0012】
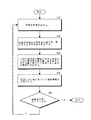
図1は本発明の一実施形態を示す流れ図である。
【0013】
最初に、画像内の局部化した領域を定める(ステップ10)。画像内のその局部化領域はM行N列の長方形の領域で、要望に応じてMとNを等しくすることにより正方形の領域とすることができる。全取り込み画像のサイズ中のある比率を占める局部化領域は、所望の実施態様および利用可能なハードウェア/ソフトウェア資源、ならびに所望の画像処理速度に対する速度制約に応じて大きくしたり、または小さくすることができる。たとえば、たいていのコンピュータ・システムのハードウェアおよびソフトウェアを使用するには、8行8列または16行16列の局部化領域を備えるのが有効である。局部化領域は、画像内の特定の画素に関して通常定められる。画像が比較的大きな領域に対してより均一な特性を示す場合は、局部化領域を大きく設定することができる。しかし、微小な差異が重要であったり、または画像が小さな領域内で大きな特性変化を示す場合は、局部化領域を小さく設定することができる。
【0014】
局部化領域が設定されると、次のステップとして、3つの値、すなわち局部化領域内のすべての輝度値の平均値、最小値(min)および最大値(max)を決定する(ステップ120)。局部化領域についてM行M列の正方形の近隣領域を考えると、これにはM*M−1の比較が使用される。局部化領域内の輝度値の最小、最大および平均は、しきい値の設定における画像内の微小な差異を考慮したものである。画像内の局部化領域の輝度特性は、その領域内の画素についての特定の輝度変化に割り当てる度合いを決定する輪郭線検出を可能にする。それに対して、一般的な輪郭線検出には、局部的な輝度変化が考慮されていない。
【0015】
勾配情報が決定されたら、しきい値を定める(ステップ130)。そのしきい値を輝度変化と比較し(通常は勾配として測定される)、輝度の変化がしきい値を上回っている場合は、その画素または領域を輪郭線として分類することができる。従来型の輪郭線検出器では、しきい値が既に設定されており、画像ごとに変えられることはない。画像ごとにしきい値を変えたい場合は、ユーザがマニュアルで変えなければならないことが多い。さらに、しきい値に基づく従来型の輪郭線検出器は特定画像の局部領域におけるしきい値を動的に調節するようなされておらず、指定画像に対して調整されたか否かにかかわらず、特定画像全体を通じて同一のしきい値が適用される。
【0016】
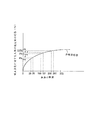
それに対して、ステップ130によれば、本発明の一実施形態による輪郭線検出のためのしきい値は自動的に決定される。この決定は輝度の変化に対する人間の視覚系の応答(人間の眼の光学的機能および人間の頭脳による心理的知覚)に基づく。図2は、以下に説明するように、輝度の変化に対する人間の視覚系の応答を概略的に示したグラフである。一般に、輝度値の範囲が高くなるに従って、人間の視覚系が輝度の変化を見分けるのが困難になる。しきい値は、人間の視覚系の応答に対して調節された場合ははるかに精度が高くなり、画像輪郭線の強調においても、当該強調画像の人間に対する視覚的クオリティは「知覚的」しきい値決定を行わずに強調された同一画像よりも良好である。
【0017】
ステップ130による知覚的しきい値決定にも局部化領域の輝度特性、すなわちステップ120において決定された最小値、平均値および最大値が使用される。局部化領域内の相対的輝度領域および相対的輝度値を表す1つの方法は、局部化領域内の輝度値の全体差を平均値と最小値の差と比較する百分率または比率を定めることである。したがって、しきい値決定のための「相対的局部化輝度」(RI)は以下のように定義することができる。
RI=(平均値−最小値)/(最大値−最小値)
【0018】
RIをしきい値の決定に使用することができるが、RIファクタは、人間の視覚系に関連していない、または輪郭線検出のためのアプリケーションが採用されていないという意味において最適なファクタではない。図2に示されているように、そして光学およびイメージングの分野においてよく知られているように、輝度変化に対する人間の視覚系の応答は概ね対数パターンに従う。したがって、人間の視覚系の知覚力を考慮して、べき関数演算子もしきい値決定におけるファクタとすべきである。そこで、輪郭線検出のためのしきい値を「a」をべき因子とするRIaとするのが好ましい。人間の視覚系を近似的に示すべき因子は0.45であることがシミュレーション結果や試験結果によって証明されている。したがって、人間の視覚を考慮して輪郭線検出に採用されるしきい値「T」は以下の式で与えられる。
T={(平均値−最小値)/(最大値−最小値)}0.45
【0019】
このべき関数演算子は例示的なものにすぎず、人間の視覚系に関する分野において取得された新しい情報に従って、または輪郭線検出が採用されているアプリケーションに応じて修正することができる。たとえば、OCRのようなパターン認識では、人間の視覚系から逸脱して異なるべき因子を用いたべき関数に変えたり、または演算子のタイプをたとえば線形演算子に変更することが有益である。
【0020】
本発明のこの実施形態の主要な態様は、しきい値が自動的に決定され、ユーザの手を介さずに局部的活動的に変えられることである。このしきい値決定は、追加的に人間の視覚系の知覚をベースとすることができるが、要望に応じて、他の視覚系、または実施されている輪郭線検出を使用するアプリケーションに合わせて修正することができる。
【0021】
しきい値が決定されたら、次に局部しきい値を使用して輪郭線検出を実行することができる(ステップ140)。図3は、知覚的かつ局部的に調整されたしきい値決定を利用する勾配ベースの輪郭線検出器を示す図である。この輪郭線検出は要望に応じて画素ごとに、または画像部ごとに実施することができる。すなわち、局部化領域内のすべての画素を動的に求められた同一のしきい値に当てたり、またはそれを中心として局部化領域が定められる中心的な画素のみをそのしきい値に当てることができる。それに応じて、ステップ150は、輪郭線検出のための画像部が残存していないかどうかを確認する。画像部を単一の画素と同じくらい小さく設定することによって、動的に求められるしきい値を各々かつあらゆる画素について再決定し、局部化領域を各々かつあらゆる画素について移動することができる(そして、それによって新しい領域にすることができる)。何らかの画像部が残存している場合は、局部化領域を再び定めて(ステップ110)、ステップ120〜150を繰り返す。輪郭線検出の対象となる画像が残存していない場合は、その手順を終了する。
【0022】
図2は、輝度変化に対する人間の視覚系の応答を概略的に示す図である。
【0023】
図2のグラフは、画素に対する可能輝度値を示す水平軸を有している。画素当たり8ビットの解像度の画像を例にとると、その輝度値の可能範囲は0から255である。垂直軸は、本質が明らかに対数的である著しい非線形応答を示す人間の視覚系の知覚輝度変化を表している。基本的には、変化が測定されている輝度値が大きいほど、輝度差を識別する人間の視覚系の能力が低下する。たとえば、輝度値が25から26に変化した場合、人間の視覚系によって知覚される輝度変化は4%である。それに対して、輝度値が100から101に同じだけ変化した場合は、人間の視覚系による知覚的変化は1%にすぎない。知覚能力はさらに低下し、200から201の輝度変化に対してわずか0.5%の輝度変化が知覚されるにすぎない。201から200への変化に対する輝度値は、25から26への変化に対する輝度値ほど大きくない。
【0024】
そこで、陰影のためにすべての値が下限、たとえば0から50の間に存在する画像部があり、その画像の他の部分がそれより高い範囲の値を示す場合を考えてみる。その画像に一定のしきい値、たとえば当業界においてしばしば使用されるT=0.6が適用されたとすると、変化量がきわめて高い最大値の60%を上回ることがないため、その画像部内で輪郭線フィーチャを検出することは不可能である。その画像部内のすべての輪郭線フィーチャが見逃されることになる。それに対して、局部的な知覚的しきい値決定は、局部領域に定められる画像部または画像部の一部の中の最大、最小および平均輝度に従ってしきい値を設定することになる。最大輝度が50、最小輝度が0、そして平均輝度が20であれば、適用されるしきい値は20/50または0.45.45になる。さらに、以下に記載するように、輝度の変化または勾配を局部領域に対して正規化または調整するならば、輪郭線検出のための比較がより有意味なものになるであろう。
【0025】
図2の曲線は当業界でよく知られており、当業者は、その曲線を記述するべき関数を表すのに0.4から0.5の間の値を様々に使用してきた。本発明の一実施形態ではべき関数演算子のべき因子に0.45を使用するのが好ましいが、あらゆるべき因子、またはアプリケーションまたは実施態様に適した他のあらゆる演算子を選択してRIファクタに適用することができる。
【0026】
図3は、本発明の一実施形態による勾配ベースの輪郭線検出を示す流れ図である。
【0027】
最初に、画素Pに関して、画像内の最初の局部化領域を定める(ステップ310)。その最初の局部化領域はM行N列の長方形の画像領域であり、要望に応じてMとNを等しくすることによって正方形の領域を定めることができる。画像が比較的大きな領域に対してより均一な特性を示す場合は、局部化領域を大きく設定することができる。しかし、微小な差異が重要である場合、または画像が小さな領域内で大きな特性変化を示す場合は、局部化領域を小さく設定することができる。
【0028】
局部化領域が定められたら、次のステップは、何らかのマスクまたは演算子を適用することによって局部化領域内の各々かつあらゆる画素に関連する勾配値を決定することである(ステップ320)。このマスクまたは勾配演算子は各々の画素の周囲の小さな近隣領域に適用され、その近隣領域は通常は局部化領域よりも小さなサイズを有する。図4(a)および4(b)ならびにそれに関連する記述は、勾配が決定されている画素に関する、かつその画素を含む3行3列の近隣領域を用いて当該マスクのパラメータおよび構成を例示するものである。局部化領域内の各々の画素に演算子またはマスクを繰り返して当てはめ、それにより勾配を決定することによって、局部化領域全体についての勾配情報を完結することができる。勾配は、特定の画素に関する(マスクサイズの)小さな隣接領域におけるその画素から様々な方向への相対的な輝度変化を測るものである。
【0029】
たいていの勾配ベースの輪郭線検出では、勾配を画像全体における最大勾配で割ることによって画像全体に対して勾配値を正規化する。しかし、当該正規化は、ハードウェア内で実施される場合、画像全体の中のすべてのすべての画素についての勾配情報を決定し、次いで各勾配を画像内の最大勾配値で割る2パス・アプローチを必要とする。局部化領域は局部的なしきい値を決定する目的で定められるため、この同じ局部化領域を使用して、その局部化領域内の最大勾配に従って画素Pの勾配を正規化しなければならない(ステップ325)。これによって、勾配比較に対するしきい値が局部的な画像動向をより明確に反映することになる。画像全体における最大勾配に従って勾配を正規化した場合、局部しきい値を、対象となる局部領域ではなく画像全体に関する勾配と比較することになる。
【0030】
勾配情報が定められたら、局部的な輝度情報に基づいてしきい値が自動的に決定される(ステップ330)。しきい値「T」の自動決定については図1のステップ130に関する説明の中で詳しく記載したが、繰り返すと、T={(平均値−最小値)/(最大値−最小値)}aで表すことができ、この場合の「平均値」は局部化領域内のすべての輝度値の平均を表し、「最小値」はすべての輝度値の最小値を表し、「最大値」はその領域内の輝度値の最大値を表し、「a」は輪郭線検出が適用されるアプリケーションまたは視覚系に基づくべき因子である。アプリケーションまたは視覚系が輝度変化に対してフラットな直線応答を示す場合はべき因子は「1」であるが、ほとんどのケースとして人間の視覚系を表す場合、べき因子は約「0.45」であることが当業界において証明された。
【0031】
画素Pが画像の輪郭線フィーチャに属する画素であるか否かを判断するために、正規化勾配を動的に決定された局部しきい値と比較する(ステップ335)。画素Pに対する正規化勾配がそのしきい値を上回っている場合は、ラインのような画像の輪郭線フィーチャに属する画素である「輪郭線」画素として画素Pを分類することができる(ステップ340)。そうでない場合は、画素Pは非輪郭線画素として分類される(ステップ350)。輪郭線検出の1つの方法、すなわち勾配ベースの輪郭線検出を図3の流れ図に示したが、ある種のしきい値決定を利用するあらゆる適切な輪郭線検出器に本発明の様々な実施形態のしきい値決定概念を適用して輪郭線検出器の機能を改善することができる。たとえば、画像スペースに取り巻かれたガウス・マスクを使用して輪郭線画素と非輪郭線画素を分類する有名なキャニー輪郭線検出器を局部的かつ知覚的な動的しきい値決定の技術と併用し、そのヒステリシスに対して局部輝度情報に基づいて下限しきい値と上限しきい値の両方を設定することができる。ポータブル静止画ディジタル・カメラなどのディジタル画像作成デバイスには、計算速度が速く、デバイス内に使用されているシリコンが比較的少ないために、図3、4(a)および4(b)に示されている輪郭線検出器が効果的である。
【0032】
次に、局部化領域内に処理すべき画素が残存している場合(ステップ370においてチェックされる)、ステップ320〜375を繰り返す。残存している画素を輪郭線画素または非輪郭線画素に分類する場合、次の画素Pに関する新しい局部化領域を定めることができる(ステップ380)。局部化領域は画像内の各々の画素について異なるため、各々の画素はそれ独自の調整された局部しきい値、および画素がそれに関して正規化される局部最大勾配を有する。特定の画素についての勾配情報を決定する方法を図4(a)および4(b)に示す。
【0033】
図4(a)は第1の方向差分を求めるためのマスクを示す図である。
【0034】
ある画素に対する勾配を決定する1つの手段は、マスクがカバーする近隣境界に関する画素の「強度」を本質的に特定するマスクAを適用することである。この強度は、本質的に、画素の2つの境界に沿う特定の方向の差分である。この第1の方向は、第2の方向の境界に沿う強度に対する同様の計算に併用すれば、近隣の画素に対する中心画素の相対的強度についての良好な推定値を与える。図4(a)には、第1列と第3列にゼロ以外の係数を有し、中央すなわち第2列にゼロの係数を有する3行3列のマスクが示されている。マスクAは6つのゼロ以外の係数、A1、A2、A3、A4、A5およびA6を有している。輝度値がI0、I1、I2、I3、I4、I5、I6、I7およびI8の画素を有する画像領域Iにそのマスクを適用したときに得られる差分Δxは、Δx=A1*I0+A2*I3+A3*I6+A4*I2+A5*15+A6*18で表される。画像領域Iの中心にある輝度値14の画素の勾配を計算するのに差分Δxを使用することができる。通常は、マスクAは合計するとゼロになる係数を有する。よく知られているソーベル・マスクでは、係数A1、A2およびA3はすべて−1の値を有し、係数A4、A5およびA6はすべて+1の値を有する。したがって、ソーベル・マスクの係数を用いると、Δx、すなわち差分はΔx=I2+I5+I8−I0−I3−I6になる。したがって、当業界では有意味な勾配値を与えるものとして知られるこのソーベル・マスクの選択は、差分計算を、ハードウェア内で加算器により容易に実施される画素の輝度値の単なる加減に単純化する。したがって、差分計算が容易かつ迅速になる。プレウィット・マスク(Prewitt mask)のような他のマスクも、応用すれば容易に実施することができる。プレウィット・マスクは−1に等しい係数A1およびA3と、−2に等しい係数A2を有する。対称として、プレウィット・マスクは他方の方向境界に+1に等しい係数A4およびA6と+2に等しい係数A5を有する。プレウィット・マスクを使用すると、Δxすなわち差分値はΔx=I2+2*I5+I8−I0−2*I3−I6となる。2を掛ける乗算が導入されているが、これはI5またはI3のシフト演算子によって、あるいはハードウェアでは加減計算しか実施されない場合は、Δxの計算をΔx=I2+I5+I5+I8−I0−I3−I3−I6のように分割することによって容易に実施することができる。
【0035】
輪郭線は画像スペース内に特定の方向を有することが想定されるため、輪郭線検出に勾配演算子が使用される。画素I4を輪郭線画素と見なすならば、その画素のサイド境界に沿う画素(一方のサイド−I0、I3、I6、もう一方のサイド−I2、I5、I8)は、画素I4よりも小さな強度または相対的な複合輝度レベルを有する。この点において、本質的に水平方向にある第1の方向差分(マスクが画像の左側と右側に強度を決定する値を有する)は、上述のように計算することができる。画像スペースは垂直方向と水平方向の2つの次元を有しているため、画素I4に関するもう1つの方向差分を計算すればよい。
【0036】
図4(b)は第2の方向差分を求めるためのマスクを示す図である。
【0037】
図4(b)には、第1行と第3行にゼロ以外の係数を有し、中央すなわち第2行にゼロの係数を有する3行3列のマスクが示されている。マスクBは6つのゼロ以外の係数、B1、B2、B3、B4、B5およびB6を有している。輝度値がI0、I1、I2、I3、I4、I5、I6、I7およびI8の画素を有する画像領域Iにそのマスクを適用したときに得られる差分Δyは、Δy=B1*I0+B2*I1+B3*I2+B4*I6+B5*17+B6*18で表される。画像領域Iの中心にある輝度値14の画素の勾配を計算するのに差分Δyを使用することができる。通常は、マスクBは合計するとゼロになる係数を有する。よく知られているソーベル・マスクでは、係数B1、B2およびB3はすべて−1の値を有し、係数B4、B5およびB6はすべて+1の値を有する。したがって、ソーベル・マスクの係数を用いると、Δy、すなわち差分はΔy=I6+I7+I8−I0−I1−I2になる。したがって、当業界では有意味な勾配値を与えるものとして知られるこのソーベル・マスクの選択は、差分計算を、ハードウェア内で加算器により容易に実施される画素の輝度値の単なる加減に単純化する。したがって、差分計算が容易かつ迅速になる。プレウィット・マスクのような他のマスクも、応用すれば容易に実施することができる。プレウィット・マスクは−1に等しい係数B1およびB3と、−2に等しい係数B2を有する。対称として、プレウィット・マスクは他方の方向境界に+1に等しい係数B4およびB6と+2に等しい係数B5を有する。プレウィット・マスクを使用すると、画像境界に沿う第2の方向におけるΔyすなわち差分値はΔy=I6+2*I7+I8−I0−2*I1−I2となる。2を掛ける乗算が導入されているが、これはI5またはI3のシフト演算子によって、あるいはハードウェアでは加減計算しか実施されない場合は、Δyの計算をΔy=I6+I7+I7+I8−I0−I1−I1−I2のように分割することによって容易に実施することができる。Δxすなわち第1の方向差分を特定するのに使用されるマスクAは、第2の方向差分を特定するのに使用されるマスクBと同じタイプであることが好ましい。画像作成デバイス正方形の画素群でなく、長方形または他の形の画素群を生成するため、1つの方向にソーベル・マスクを使用し、もう1つの方向にプレウィット・マスクを使用して補償するのが望ましい。そのような場合は、マスク係数の選択に画素の幾何学が考慮される。
【0038】
上述のようにして求められた第2の方向差分Δyについては、水平方向と垂直方向の両方の境界方向のペアが考慮される。次いで、画像スペースIのなかの中心画素であるI4の勾配は、各方向において求められたベクトルの合計であるベクトルによって求められたベクトルの絶対値である。そこで、勾配Gは単に√(Δx2+Δy2)、あるいはΔxとΔyを結合させることによって形成されるベクトルの絶対値になる。したがって、近隣領域、好ましくは各画素を囲む3行3列の小さな近隣領域を考慮し、次いで2つの方向の各々の画素およびそれらの対応する境界ペアにマスクを適用して直接接するあらゆる画素を勾配決定に含めることによって、各画素の勾配を求めることができる。上述したように、勾配測定値に相対的な重みが与えられるように、勾配値を局部化領域内に存在する最大勾配に対して正規化することができる。たとえば、ラインのようなハード・エッジではなくテクスチャを有するが増量域では、勾配値が狭い領域内に存在する。その局部領域内の最大勾配に対してそれらを正規化するのであれば、勾配値をより効果的に解析することができる。正規化された勾配はG=√(Δx2+Δy2)/GLMAXで示され、GLMAXは局部化領域内のすべての画素の最大勾配を表す。
【0039】
図5は、本発明の一実施形態を示す系統図である。
【0040】
図5は、PC(パーソナル・コンピュータ)などの汎用的な、または特殊用途の判断あるいはデータ処理装置でありうるコンピュータ・システム510とそれに接続されたカメラ530を示している。カメラ530はデジタル・カメラ、ディジタル・ビデオ・カメラ、あるいは任意の画像キャプチャデバイスまたは画像作成システムであってもよく、被写体またはシーン540のセンサ画像を取り込むのに使用される。本質的には、取り込まれた画像を、RAMまたは固定ディスクや小形カードなどの他の記憶デバイスでありうる画像記憶装置534に効果的に記憶できるように、圧縮し、画像処理回路532によって処理する。たいていのディジタル・カメラでは、センサなどの画像キャプチャ機構から得られた生画像を最初にカメラ530に記憶し、後にダウンロードして出力、表示または処理する。これによって、カメラ530は付加的な遅延を生じることなく次の被写体を迅速に取り込むことができる。1つの便利な生画像表現は、ある色(赤、緑または青)を各画素のグレー・スケール輝度値に関連づける上述の8ビット・ベイヤ・パターンCFAである。
【0041】
一実施形態では、画像が生の8ビット・ベイヤ・パターンCFAとしてカメラ530によって取り込まれ、次いで他のデータまたは符号化フォーマットに圧縮される。本発明の一実施形態による輪郭線検出のための局部しきい値決定は、以下のように行われる。最初に、圧縮画像がカメラ530から入出力ポート517を介してディスク518、またはコンピュータ・システム510上の他のデバイスにダウンロードされる。次に、コンピュータ・システムが、本発明の様々な実施形態において説明したように、プロセッサ512をしきい値決定を行うように構成した命令を実行することによって、復元されたCFA画像上で輪郭線検出のためのしきい値決定を実施する。
【0042】
本発明の様々な実施形態において説明した方法は、Pentium(商標)(インテル・コーポレーションの製品)などのプロセッサ512、ならびに命令、アドレスおよび結果データを記憶およびロードするのに使用されるRAMなどのメモリ511を使用して実行することができる。知覚的しきい値決定および輪郭線検出を実行するのに使用するアプリケーションはC++などの言語で書かれたソースからコンパイルされた実行可能モジュールであってもよい。勾配値の決定、局部的輝度特性の特定、および局部しきい値の自動決定を支援する当該実行可能モジュールの命令をディスク518またはメモリ511に記憶し、何らかのコンピュータ読み取り媒体を介してロードすることができる。判断装置をプログラムして本発明の様々な実施形態において説明した補間方法を実行できることをコンピュータ科学の当業者なら容易に理解するであろう。
【0043】
コンピュータ・システム510は、プロセッサ512およびメモリ511へおよびそれらからの情報の転送を促すシステム・バス513を有し、またシステム・バス513を入出力バス515に結合するブリッジ514を有する。入出力バス515は、ディスプレイ・アダプタ516、ディスク518およびシリアル・ポートのような入出力ポートなどの様々な入出力デバイスを接続する。そのような入出力デバイス、バスおよびブリッジなどの多くの組合せを本発明に使用することが可能であり、示された組合せは当該可能な1つの組合せを例示したものにすぎない。
【0044】
被写体/シーンの画像540のような画像が取り込まれるときは、その画像はよく知られたベイヤ・パターンのようなCFAにおける赤、緑および青の画素輝度値として感知される。これらの画素輝度値は画像処理回路532に送られる。画像処理回路532はIC、およびその他の機能に加えてカメラ530とコンピュータ・システム510の間の転送のサイズを縮小する画像圧縮方式を実行する他のコンポーネントから構成されている。色彩補間の必要性は画像を表示または出力するときに大きな意味をもつため、カメラ530上で実行する必要はない。ユーザまたはアプリケーションが画像のダウンロードを希望または要求するときに、画像記憶装置に記憶された圧縮画像が画像記憶装置534から入出力ポート517に転送される。入出力ポート517は、示された(入出力バス515からブリッジ514を経てシステム・バス513へと続く)バス・ブリッジ階層フィーチャを使用して、画像データをメモり511または任意にディスク518に一時的に記憶する。圧縮画像は適切なソフトウェア・アプリケーション(または専用ハードウェア)によって圧縮解除され、プロセッサ512を使用してそれを実行することができる。圧縮画像は、カメラ530のセンサによって取り込まれた画像データと類似または同一の画素当たり8ビットの一連の輝度値として復元される。
【0045】
したがって、一度圧縮解除されたダウンロード画像は、それらのベイヤ・パターン形式、すなわち画素当たりの輝度値は8ビットであるが、赤、緑または青の3つのカラー・プレーンのいずれか1つに関連しているにすぎないパターンのなかに画素を有することになる。1つのアプリケーションにおいて、画像の輪郭線強調バージョンをモニタ520上に出力することが望まれる場合は、本発明の様々な実施形態による局部しきい値決定および輪郭線検出を採用すべきである。ダウンロードおよび圧縮解除された画像を画素ごとに解析し、上述の技術を適用することによって各画素を輪郭線または非輪郭線に分類する。輪郭線が検出されたら、それらの輪郭線を強調したり、あるいは他のアプリケーションまたはコード・モジュールによって処理することができる。局部しきい値決定および輪郭線検出を実行する一方、勾配値および正規化勾配値をメモり511またはディスク518に1つの配列を成して記憶することができる。記憶された配列の各要素が単一のデータではなくデータの集合を記憶することができれば、その画素についての正規化勾配、勾配および画素輝度の局部しきい値をすべて、他のアプリケーションに再使用できるように記憶することができる。輪郭線強調が輪郭線検出の目的である場合は、適切な表示装置(モニタ520およびアダプタ516)が提供されれば、従来的な輪郭線検出方法に比べてより詳細かつ鮮鋭な輪郭線を有する描画像550が視覚的に表示されることになる。輪郭線強調画像をディスプレイ・アダプタを介して表示した後にディスク518およびメモリ511に記憶したり、かつ/またはモニタ520に直接出力することができる。本発明の様々な実施形態に関して上述したように、しきい値決定におけるファクタとして人間の視覚系を使用することによって、描画像550がユーザにとってより高質の画像になる。一部においてコンピュータ・システム500上で実施することができるOCRなどの広範囲な画像作成およびコンピュータ・ビジョン・アプリケーションに、本発明の様々な実施形態による局部しきい値決定および輪郭線検出を使用することができる。さらに、本明細書に記載された以外の他の輪郭線検出方式が好まれる場合は、輪郭線検出方式がより効果的に実施されるように、わずかな修正を加えることによって局部しきい値決定技術をそれに適用することができる。
【0046】
局部しきい値決定および輪郭線検出のためのコンピュータ・プログラム・コードをフロッピ・ディスクやCD−ROMなどの取外し可能なコンピュータ読み取り可能媒体に実装し、カメラ530からダウンロードした画像の圧縮解除を実行するソフトウェアに付随させることができる。他のあらゆるソフトウェアのように、それを通信システム上のネットワークにダウンロードおよび配布したり、またはファームウェア内で使用することができる。これらのダウンロード画像を、それらがユーザに対してより正確に被写体/シーン540を視覚的に提供するように、それらの輪郭線フィーチャに従って強調することが可能である。本発明の他の実施形態による輪郭線検出および局部しきい値決定も、カメラ530上のハードウェア内で実施することができる。
【0047】
本発明の代替的な実施形態では、画像記憶装置534内の記憶画像が雑音除去画像になるように、画像処理回路532を適応させて、カメラ上で局部しきい値決定および輪郭線検出を実行する回路を含めることができる。したがって、コンピュータ・システム510またはレンダリング・デバイスにダウンロードするときには、輪郭線フィーチャが既に分類されていることになる。当該実施形態では、雑音除去や色彩補間などの技術がより正確かつ良好に実施されるように、画像の輪郭線フィーチャを前もって分類することができる。画像勾配および局部しきい値を特定および正規化し、輪郭線を検出する上述の方法はVLSI(超大規模集積回路)または他の集積回路において容易に実施することができる。
【0048】
図6は、直接的なハードウェア実施態様に適用可能な、図3の勾配ベースの輪郭線検出の変更を示す流れ図である。
【0049】
図5に示されたカメラ530のようなハードウェア内で実施される場合は、図3の方法にいくつかの変更を加えることができる。M行M列の正方形の局部化領域を想定すると、最初に、第1のM2の画素勾配値を決定して(ステップ600)、勾配アレイに記憶しなければならない。以下に説明するように、このM2回の計算は特定の画像について一度だけ実施すればよい。次に、ステップ620に従って、局部化領域内の最大勾配を決定する。ハードウェアでは、M2の画素すべての勾配値を計算しながら最大値の決定も実施できるように、ステップ600にコンパレータやレジスタを採用することができる。それに関する局部化領域が定められるピクセルPについてのみ勾配値の正規化を実施することができる(ステップ630)。次に、輝度値の最小および最大を見いだす(ステップ640)。ハードウェアについては、一対のレジスタとコンパレータによって、ステップ600によるM2のすべての画素の勾配値を決定しながら、このステップも実施することができる。次に、輝度値の平均を決定する(ステップ650)。最後に、局部しきい値を決定し、それを画素Pについての正規化勾配と比較することによって輪郭線検出を完了することができる(ステップ660)。
【0050】
輪郭線検出のための次の画素を取り込む(ステップ670)ときには、2つの可能性が考えられる。その画素が画像の新しい行に属しているか、あるいはそうでないかである(ステップ678でチェックする)。その画素が画像の新しい行に属していなければ、同一の行の一部であり、画素に対する左から右へのスキャンを想定して、Mの画素の勾配値の第1列を勾配アレイからシフト・アウトまたは消去する(ステップ680)。次いで、同じ行で1つ上の列にある次の画素について、Mの画素の勾配値の新しい列のみを計算すればよい(ステップ685)。ステップ680における勾配アレイ内の列の左からのシフト(左から右へのスキャン)または右からのシフト(右から左へのスキャン)が実施される場合は、そのアレイ内のまさに最後の列を新たに計算された勾配値で更新すればよいだけである。これによってハードウェアの速度が著しく高まる。
【0051】
新しい画素Pが同じ行になければ、行変更が行われたことになり、勾配アレイの列をシフト・アウトするのでなく、Mの値の行をシフト・アウトする(ステップ690)。上から下へのスキャンを想定して、第1行をシフト・アウトし、すべての行をシフト・アップし、勾配アレイ内の最後の空行を新たに計算されたMの勾配値に代える(ステップ695)。行ごとの画素のスキャンを実施する場合、行が変わるたびにスキャンの方向(左から右、および右から左)が変わる。このように、勾配計算の回数が最小限にとどめられる。ジグザグ・パターンの画素のスキャンおよび処理が採用される場合は、M2の勾配計算が一度だけ実施される。スキャン方向を変えれば、勾配アレイの列および行のシフト方向も変える必要がある。そのような実施態様は、画像全体に対する勾配値を記憶することができない場合、または速度が制約されるため単パス・アプローチが好まれる場合に望ましい。
【0052】
勾配計算を削減しても、シフト・アウトおよび消去されたアレイ値は強度および勾配値の最小値および/または最大値を含んでいる可能性があるため、Mの新しい値をこれらの最小および最大値と比較するだけでは十分でなく、誤った結果が得られる可能性があるため、画素ごとにこれらの最小値および最大値の特定を繰り返さなければならない。
【0053】
本明細書に説明されている例示的な実施形態は本発明の原理を例示するためのものにすぎず、本発明の範囲を制限するものと解釈されるべきではない。むしろ、本発明の原理を広範囲なシステムに適用して、本明細書に記載された効果ならびに他の効果を達成し、または同様に他の目的を満たすことができる。
【図面の簡単な説明】
【図1】 本発明の一実施形態を示す流れ図である。
【図2】 輝度の変化に対する人間の視覚系の応答を示す概略図である。
【図3】 本発明の一実施形態による勾配に基づく輪郭線検出を示す図である。
【図4】 第1と第2の方向差分を求めて勾配決定を行うためのマスクを示す図である。
【図5】 本発明の一実施形態を示す系統図である。
【図6】 直接的なハードウェア実施態様に適用可能な、図3の勾配ベースの輪郭線検出の変更を示す流れ図である。[0001]
(Background of the Invention)
(1. Field of the Invention)
The present invention relates to image processing. More specifically, the present invention relates to the detection of features in an image.
[0002]
(2. Explanation of related technology)
In image processing technology, an image of a subject / scene can be characterized by a certain feature. One important image feature of interest is the “contour” feature of the image. The contour of the image is defined by the degree of sudden change in brightness and / or the color change between the first region of the pixel and the second region of the pixel. Along a boundary between two regions, a group of pixels on either side can be classified as a “contour” pixel or a pixel belonging to a contour feature. For example, as an extreme example of a contour feature, consider three columns of pixels that have a pure blue color and two columns of white pixels that follow the blue pixels in succession. Each of the third column of pixels having a blue color and the fourth column of pixels having a white color can be considered as contour lines. Due to the steep and large color and brightness differences between the third and fourth columns, these pixels are on the “contour” and collectively represent the contour features. On the other hand, one row of white pixels and one row of gray pixels adjacent thereto are not considered to be contour features because the difference in luminance is not so large and sharp as to be classified as contours. A technical field known as contour detection provides techniques for detecting and distinguishing contour lines, as well as various forms of useful data and statistics regarding image contour information in image processing applications.
[0003]
The classification of images into contour features has been applied to many important applications in image processing and rendering. One important application is image sharpening by removing blur and enhancing contour lines. Other applications include shape or pattern recognition that can be used for computer vision or OCR (optical character recognition). These applications depend heavily on the success of the contour detection method. If the contour line cannot be detected, the contour line cannot be emphasized, and the blur is not removed unless the non-contour line is correctly identified with respect to the contour boundary. The failure in contour detection is considered to occur in either of the following two cases. If a “false” contour is formed, that is, a feature that is not a contour is classified as a contour, or if the contour is destroyed, that is, a feature that is a contour is classified as a non-contour feature This is a case where the contour line is broken by being processed as a contour line.
[0004]
The problem of contour detection has been addressed from many different angles. One approach is to view the contour line as a change in brightness level from one pixel or region to another pixel or region. An operator such as a gradient operator (a mathematical function applied to the data set) that can measure this change can be used for contour detection. In addition to calculating the change in brightness level using some form of operator, the contour detector can also detect whether a particular brightness value change is a contour region or contour pixel, or non-contour. It must have a threshold indicating whether it is a line region or a non-contour pixel. It is determined whether the pixel belongs to the contour line by comparing the threshold value with the measured luminance change. Most threshold-based contour detectors attempt to fix a predetermined threshold that can be applied to the entire image and applied to any image generated by a particular imaging device or process. This is problematic because certain features, such as shadows, in certain images can compromise the contour detection process. For example, if part of the image is in the shadow of the light source, but other areas of the image are in a brighter area of the light source, the brightness change in the shaded area is not so obvious, A contour line in a high area cannot be detected sufficiently. The shaded region shows a small change in luminance because the luminance is lower and narrower than the high luminance area even if the outline feature is the same. As a result, when a high threshold value is set, the contour feature existing in the shaded area of the image is misclassified as a non-contour feature.
[0005]
To correct this problem, it is necessary to set a lower threshold. However, setting a low threshold results in the opposite problem of often leading to false contours. A low threshold may be valid for one image or one type of image, but leading to false contours for other types of images can lead to inaccurate contour detection results. There is. Thus, for each image, the threshold has often been set by a manual process in which the user selects a threshold for a particular image. The selection of thresholds is often accomplished by trial and error, i.e., by trying a certain threshold on all images and later analyzing the results. In addition, most contour detectors apply thresholds to every part of the image, thus ignoring the problem of local luminance range. One of the best known and most effective contour detectors developed, the Canny contour detector, employs hysteresis threshold determination. In the hysteresis threshold determination, a high threshold value and a low threshold value are set, and all pixels whose threshold change (gradient) is larger than the high threshold value in the first pass are regarded as contour pixels. . In the next pass, any pixel that is adjacent or close to a contour pixel that is greater than the low threshold is also classified as a contour pixel. At present, even when the canny contour detector is used, both the high threshold value and the low threshold value constituting the hysteresis are manually selected.
[0006]
Therefore, it would be desirable to provide an improved contour detector that automatically selects a threshold value for each image without user intervention. Furthermore, as described above, it is desirable to consider the potential local luminance characteristics in the image so that the threshold can be adjusted within the same image region. In addition, contour detection is typically implemented in software with computational cost, so high-speed hardware can be used so that a digital camera or robot eye can be equipped with automatic hardware-based contour detection. It is desirable to devise techniques suitable for the embodiment.
[0007]
(Summary of Invention)
Disclosed is a method for determining a localized region of an image that is a selected portion of an image, and then automatically determining a threshold to be applied to contour detection within the localized region without user intervention. The threshold is based on the luminance information of the pixels in the localized area.
[0008]
Objects, features and advantages of the method and apparatus of the present invention will become apparent upon reading the following description.
[0009]
(Detailed description of the invention)
Next, exemplary embodiments of the present invention will be described with reference to the drawings. These exemplary embodiments are illustrative of aspects of the invention and should not be construed as limiting the scope of the invention. These exemplary embodiments are described primarily with reference to block diagrams or flowcharts. With respect to the flowchart, each block in the flowchart represents both a method step and a device component for performing the method step. Depending on the embodiment, the corresponding device configuration is configured by hardware, software, firmware, or a combination thereof.
[0010]
When analyzing an image captured by a sensor or camera or other imaging device or obtained by other means, the image has features that are contour features and all other features are non- It is said to be a contour feature. Determining what forms the contour is difficult and not an accurate process. Contour detection is often based on measuring the change in brightness and then comparing that change to a threshold. This threshold selection is a fundamental problem in contour detection because false contours are generated if the threshold is too low and contours are missed if the threshold is too high. Since a single threshold is not appropriate for every image, the threshold must be adjusted for each image. This is often done manually by the user. Otherwise, a threshold will be set in advance, but this is not desirable because a particular image cannot adequately correspond to a particular threshold depending on the purpose of detecting the contour line. . Furthermore, even if the threshold for an image is determined by the image base in traditional image detection, the threshold is uniformly applied to the entire image. For images with different light sources where the luminance field or range can vary within one image area different from other areas, certain thresholds are inappropriate and can lead to inaccurate contour detection results. Become.
[0011]
Accurate contour detection is important in many other areas of pattern recognition, computer vision, image enhancement and image processing. It is desirable to eliminate the need for user intervention in setting the threshold and to determine the threshold based on the luminance characteristics of the image. Preferably, these techniques should be applied to the local area so that even contours with low brightness fluctuations can be detected accurately. Also, on demand, technology capable of high speed hardware implementation should be used so that the technology can be implemented in a digital camera or image generating device that generates image patterns. One possible contour detection technique is shown in FIG. 1 and various other embodiments described below.
[0012]
FIG. 1 is a flowchart showing an embodiment of the present invention.
[0013]
First, a localized area in the image is defined (step 10). The localized region in the image is a rectangular region of M rows and N columns, and can be made a square region by making M and N equal if desired. Localized areas that occupy a proportion of the size of the total captured image should be made larger or smaller depending on the desired implementation and available hardware / software resources and speed constraints on the desired image processing speed. Can do. For example, to use most computer system hardware and software, it is useful to have a localized region of 8 rows 8 columns or 16
[0014]
When the localized area is set, as the next step, three values, that is, an average value, a minimum value (min), and a maximum value (max) of all luminance values in the localized area are determined (step 120). . Considering a square neighborhood of M rows and M columns for the localized region, this includes M*A comparison of M-1 is used. The minimum, maximum and average luminance values in the localized area take into account small differences in the image in setting the threshold. The luminance characteristics of the localized area in the image allow for contour detection that determines the degree to which the pixels in that area are assigned to a specific luminance change. On the other hand, local brightness changes are not considered in general contour detection.
[0015]
Once the gradient information is determined, a threshold is set (step 130). That threshold is compared to the luminance change (usually measured as a slope), and if the luminance change exceeds the threshold, the pixel or region can be classified as an outline. In the conventional contour detector, the threshold value is already set and is not changed for each image. When it is desired to change the threshold value for each image, the user often has to change it manually. In addition, conventional contour detectors based on thresholds are not designed to dynamically adjust the threshold in the local area of a particular image, regardless of whether it has been adjusted for a specified image. The same threshold is applied throughout the specific image.
[0016]
In contrast, according to
[0017]
The luminance characteristics of the localized area, that is, the minimum value, the average value, and the maximum value determined in
RI = (average value−minimum value) / (maximum value−minimum value)
[0018]
Although RI can be used to determine the threshold, the RI factor is not the optimal factor in the sense that it is not relevant to the human visual system or has no application for contour detection. . As shown in FIG. 2, and as is well known in the field of optics and imaging, the response of the human visual system to luminance changes generally follows a logarithmic pattern. Therefore, the power function operator should be a factor in threshold determination in consideration of the perceptual power of the human visual system. Therefore, the threshold value for contour detection is RI with “a” as a power factor.aIs preferable. It is proved by simulation results and test results that the factor that should approximately represent the human visual system is 0.45. Accordingly, the threshold value “T” employed for contour detection in consideration of human vision is given by the following equation.
T = {(average value−minimum value) / (maximum value−minimum value)}0.45
[0019]
This power function operator is only exemplary and can be modified according to new information obtained in the field of the human visual system or depending on the application in which contour detection is employed. For example, in pattern recognition such as OCR, it is useful to deviate from the human visual system and change to a function that should use different factors or change the operator type to, for example, a linear operator.
[0020]
The main aspect of this embodiment of the present invention is that the threshold is automatically determined and can be changed locally and actively without user intervention. This threshold determination can additionally be based on the perception of the human visual system, but can be tailored to other visual systems or applications that use contour detection as desired. It can be corrected.
[0021]
Once the threshold is determined, contour detection can then be performed using the local threshold (step 140). FIG. 3 illustrates a gradient-based contour detector that utilizes perceptual and locally adjusted threshold determination. This contour detection can be performed on a pixel-by-pixel or image-by-image basis as desired. That is, all the pixels in the localized area are applied to the same dynamically determined threshold value, or only the central pixel in which the localized area is determined around that is applied to the threshold value. Can do. In response,
[0022]
FIG. 2 is a diagram schematically showing the response of the human visual system to changes in luminance.
[0023]
The graph of FIG. 2 has a horizontal axis that indicates the possible luminance values for the pixel. Taking an image with a resolution of 8 bits per pixel as an example, the possible range of the luminance value is from 0 to 255. The vertical axis represents the perceived luminance change of the human visual system that exhibits a marked non-linear response that is clearly logarithmic in nature. Basically, the greater the luminance value whose change is being measured, the less the human visual system's ability to identify the luminance difference. For example, when the luminance value changes from 25 to 26, the luminance change perceived by the human visual system is 4%. On the other hand, when the luminance value changes from 100 to 101 by the same amount, the perceptual change by the human visual system is only 1%. The perception ability is further reduced, with only a 0.5% change in brightness per 200-201 change in brightness. The luminance value for the change from 201 to 200 is not as great as the luminance value for the change from 25 to 26.
[0024]
Therefore, consider a case where there is an image portion in which all values exist between 0 and 50 due to shading, and other portions of the image show values in a higher range. If a certain threshold is applied to the image, for example T = 0.6, which is often used in the industry, the amount of change will not exceed 60% of the very high maximum value, so that the contour in the image area It is impossible to detect line features. All contour features in the image area will be missed. In contrast, local perceptual threshold determination will set the threshold according to the maximum, minimum and average brightness in the image portion or part of the image portion defined in the local region. If the maximum brightness is 50, the minimum brightness is 0, and the average brightness is 20, the applied threshold is 20/50 or 0.45..45become. Further, as described below, if the luminance change or gradient is normalized or adjusted to a local region, the comparison for contour detection will be more meaningful.
[0025]
The curve of FIG. 2 is well known in the art, and those skilled in the art have used various values between 0.4 and 0.5 to represent the function to describe the curve. In one embodiment of the present invention, it is preferred to use 0.45 for the power factor of the power function operator, but any power factor or any other operator suitable for the application or implementation can be selected for the RI factor. Can be applied.
[0026]
FIG. 3 is a flow diagram illustrating gradient-based contour detection according to one embodiment of the present invention.
[0027]
First, for pixel P, the first localized region in the image is defined (step 310). The first localized region is a rectangular image region of M rows and N columns, and a square region can be defined by making M and N equal as desired. If the image shows more uniform characteristics for a relatively large area, the localized area can be set larger. However, if a small difference is important, or if the image shows a large characteristic change in a small area, the localized area can be set small.
[0028]
Once the localized region is defined, the next step is to determine a gradient value associated with each and every pixel in the localized region by applying some mask or operator (step 320). This mask or gradient operator is applied to a small neighboring area around each pixel, which usually has a smaller size than the localized area. FIGS. 4 (a) and 4 (b) and the associated description illustrate the mask parameters and configuration with respect to the pixel for which the gradient is determined and using a 3-by-3 neighborhood that includes the pixel. Is. Gradient information for the entire localized area can be completed by repeatedly applying an operator or mask to each pixel in the localized area, thereby determining the gradient. Gradient measures the relative luminance change from a pixel in various directions in a small adjacent region (of mask size) for a particular pixel.
[0029]
Most gradient-based contour detection normalizes the gradient value for the entire image by dividing the gradient by the maximum gradient in the entire image. However, when the normalization is performed in hardware, a two-pass approach that determines gradient information for all pixels in the entire image and then divides each gradient by the maximum gradient value in the image. Need. Since the localized region is defined for the purpose of determining a local threshold, this same localized region must be used to normalize the gradient of pixel P according to the maximum gradient in that localized region (step 325). ). This allows the threshold for gradient comparison to more clearly reflect local image trends. If the gradient is normalized according to the maximum gradient in the entire image, the local threshold will be compared to the gradient for the entire image rather than the local region of interest.
[0030]
Once the gradient information is determined, a threshold value is automatically determined based on the local luminance information (step 330). The automatic determination of the threshold value “T” has been described in detail in the description of
[0031]
To determine whether pixel P is a pixel belonging to the image outline feature, the normalized gradient is compared to a dynamically determined local threshold (step 335). If the normalized gradient for pixel P is above its threshold, pixel P can be classified as a “contour” pixel, which is a pixel belonging to the contour feature of the image, such as a line (step 340). . Otherwise, pixel P is classified as a non-contour pixel (step 350). Although one method of contour detection, gradient-based contour detection, is illustrated in the flow diagram of FIG. 3, various embodiments of the present invention may be applied to any suitable contour detector that utilizes some sort of threshold determination. The threshold determination concept can be applied to improve the function of the contour detector. For example, a well-known canny contour detector that classifies contour and non-contour pixels using a Gaussian mask surrounded by image space, combined with local and perceptual dynamic threshold determination techniques For this hysteresis, both the lower threshold value and the upper threshold value can be set based on the local luminance information. Digital imaging devices such as portable still image digital cameras are shown in FIGS. 3, 4 (a) and 4 (b) because of the high computational speed and relatively little silicon used in the device. The contour detector is effective.
[0032]
Next, if pixels to be processed remain in the localized area (checked in step 370), steps 320 to 375 are repeated. If the remaining pixels are classified as contour pixels or non-contour pixels, a new localized area for the next pixel P can be defined (step 380). Since the localized region is different for each pixel in the image, each pixel has its own adjusted local threshold, and a local maximum gradient with which the pixel is normalized. A method for determining gradient information for a particular pixel is shown in FIGS. 4 (a) and 4 (b).
[0033]
FIG. 4A is a diagram showing a mask for obtaining the first direction difference.
[0034]
One means of determining the gradient for a pixel is to apply a mask A that essentially specifies the “intensity” of the pixel with respect to the neighboring boundaries covered by the mask. This intensity is essentially the difference in a particular direction along the two boundaries of the pixel. This first direction, when used in conjunction with a similar calculation for the intensity along the boundary of the second direction, gives a good estimate of the relative intensity of the central pixel relative to neighboring pixels. FIG. 4 (a) shows a 3-by-3 mask having non-zero coefficients in the first and third columns and a zero coefficient in the middle or second column. Mask A has six non-zero coefficients, A1, A2, A3, A4, A5 and A6. The difference Δx obtained when the mask is applied to the image region I having pixels with luminance values of I0, I1, I2, I3, I4, I5, I6, I7 and I8 is Δx = A1*I0 + A2*I3 + A3*I6 + A4*I2 +
[0035]
Since the contour is assumed to have a specific direction in the image space, a gradient operator is used for contour detection. If pixel I4 is considered a contour pixel, the pixels along the side boundary of that pixel (one side -I0, I3, I6, the other side -I2, I5, I8) It has a relative composite luminance level. In this respect, a first directional difference that is essentially in the horizontal direction (the mask has a value that determines the intensity on the left and right sides of the image) can be calculated as described above. Since the image space has two dimensions, the vertical direction and the horizontal direction, another direction difference for the pixel I4 may be calculated.
[0036]
FIG. 4B is a diagram showing a mask for obtaining the second direction difference.
[0037]
FIG. 4B shows a 3-by-3 mask having non-zero coefficients in the first and third rows and a zero coefficient in the middle or second row. Mask B has six non-zero coefficients, B1, B2, B3, B4, B5 and B6. The difference Δy obtained when the mask is applied to the image area I having pixels with luminance values of I0, I1, I2, I3, I4, I5, I6, I7 and I8 is Δy = B1*I0 + B2*I1 + B3*I2 + B4*I6 +
[0038]
As for the second direction difference Δy obtained as described above, a pair of boundary directions in both the horizontal direction and the vertical direction is considered. Then, the gradient of I4 which is the central pixel in the image space I is the absolute value of the vector determined by the vector which is the sum of the vectors determined in each direction. Therefore, the gradient G is simply √ (Δx2+ Δy2), Or the absolute value of the vector formed by combining Δx and Δy. Thus, consider a neighboring region, preferably a small 3 × 3 neighboring region surrounding each pixel, and then apply a mask to each pixel in their two directions and their corresponding boundary pair to gradient every pixel that is in direct contact By including it in the determination, the slope of each pixel can be determined. As described above, the gradient value can be normalized to the maximum gradient present in the localized region so that a relative weight is given to the gradient measurement. For example, in the increase area, which has a texture instead of a hard edge such as a line, the gradient value exists in a narrow area. The gradient values can be analyzed more effectively if they are normalized to the maximum gradient in the local region. The normalized gradient is G = √ (Δx2+ Δy2) / GLMAXGLMAXRepresents the maximum gradient of all pixels in the localized region.
[0039]
FIG. 5 is a system diagram showing an embodiment of the present invention.
[0040]
FIG. 5 shows a computer system 510 and a camera 530 connected thereto, which may be a general purpose or special purpose judgment or data processing device such as a PC (personal computer). Camera 530 may be a digital camera, a digital video camera, or any image capture device or image creation system, and is used to capture a sensor image of a subject or
[0041]
In one embodiment, the image is captured by camera 530 as a raw 8-bit Bayer pattern CFA and then compressed to other data or encoding formats. The local threshold value determination for contour detection according to an embodiment of the present invention is performed as follows. First, the compressed image is downloaded from camera 530 via input /
[0042]
The methods described in the various embodiments of the present invention include a processor 512, such as Pentium ™ (a product of Intel Corporation), and a memory, such as RAM, used to store and load instruction, address and result data. 511 can be used. The application used to perform perceptual threshold determination and contour detection may be an executable module compiled from a source written in a language such as C ++. The instructions of the executable module supporting the determination of gradient values, identification of local luminance characteristics, and automatic determination of local thresholds can be stored in
[0043]
Computer system 510 has a
[0044]
When an image such as a subject /
[0045]
Thus, once decompressed downloaded images are associated with any one of their three Bayer pattern formats, i.e. 8 bits of brightness value per pixel, but red, green or blue. It will have pixels in a pattern that is only there. If it is desired in one application to output a contour-enhanced version of the image on the monitor 520, local threshold determination and contour detection according to various embodiments of the present invention should be employed. The downloaded and decompressed image is analyzed pixel by pixel and each pixel is classified as a contour or non-contour by applying the technique described above. If contours are detected, they can be highlighted or processed by other applications or code modules. While performing local threshold determination and contour detection, gradient values and normalized gradient values can be stored in
[0046]
A computer program code for local threshold determination and contour detection is mounted on a removable computer readable medium such as a floppy disk or CD-ROM, and the image downloaded from the camera 530 is decompressed. Can accompany the software. Like any other software, it can be downloaded and distributed to a network on a communication system, or used in firmware. These downloaded images can be enhanced according to their contour features so that they visually provide the subject /
[0047]
In an alternative embodiment of the invention, the
[0048]
FIG. 6 is a flow diagram illustrating a modification of the gradient-based contour detection of FIG. 3, applicable to a direct hardware implementation.
[0049]
When implemented in hardware such as the camera 530 shown in FIG. 5, several modifications can be made to the method of FIG. Assuming a square localized region of M rows and M columns, first the first M2Pixel gradient values must be determined (step 600) and stored in the gradient array. As explained below, this M2It is only necessary to perform the calculation once for a specific image. Next, according to
[0050]
There are two possibilities when capturing the next pixel for contour detection (step 670). Whether the pixel belongs to a new row of the image or not (check in step 678). Shift the first column of gradient values of M pixels out of the gradient array, assuming that the pixel does not belong to a new row of the image and is part of the same row and scanning left to right for the pixel Out or erase (step 680). Then, for the next pixel in the same row and one column above, only the new column of gradient values for M pixels need be calculated (step 685). If a shift from left (left to right scan) or right shift (right to left scan) of a column in the gradient array at
[0051]
If the new pixel P is not in the same row, then a row change has occurred and the M value row is shifted out (step 690) rather than shifting out the columns of the gradient array. Assuming a scan from top to bottom, the first row is shifted out, all the rows are shifted up, and the last empty row in the gradient array is replaced with the newly calculated gradient value of M ( Step 695). When scanning a pixel for each row, the scan direction (left to right and right to left) changes each time the row changes. In this way, the number of gradient calculations is kept to a minimum. If scanning and processing of a zigzag pattern of pixels is employed, M2The gradient calculation is performed only once. Changing the scan direction also requires changing the column and row shift directions of the gradient array. Such an implementation is desirable when gradient values for the entire image cannot be stored, or when a single pass approach is preferred due to speed constraints.
[0052]
Even if the slope calculation is reduced, the shifted out and erased array values may contain minimum and / or maximum values of intensity and gradient values, so the new values of M are reduced to these minimum and maximum values. Since it is not sufficient to compare only with values, and erroneous results may be obtained, the identification of these minimum and maximum values must be repeated for each pixel.
[0053]
The exemplary embodiments described herein are merely illustrative of the principles of the present invention and should not be construed as limiting the scope of the present invention. Rather, the principles of the present invention can be applied to a wide range of systems to achieve the effects described herein as well as other effects, or to meet other objectives as well.
[Brief description of the drawings]
FIG. 1 is a flow diagram illustrating one embodiment of the present invention.
FIG. 2 is a schematic diagram showing the response of the human visual system to changes in luminance.
FIG. 3 illustrates gradient-based contour detection according to one embodiment of the present invention.
FIG. 4 is a diagram illustrating a mask for determining a gradient by obtaining a first and second direction difference.
FIG. 5 is a system diagram showing an embodiment of the present invention.
6 is a flow diagram illustrating a modification of the gradient-based contour detection of FIG. 3, applicable to a direct hardware implementation.
Claims (1)
前記局部化領域内の画素の輝度情報に基づいて前記局部化領域内の輪郭線検出に適用されるしきい値を、ユーザの手を介さずに自動的に決定するステップであって、前記しきい値が人間の視覚系の輝度に関連する知覚特性を反映するべき関数演算子によって決定され、前記べき関数演算子がべき因子を累乗した相対的局部輝度の測定値であるとともに、
前記相対的局部輝度が、前記局部化した領域内のすべての輝度値の平均値と最小値の差と、前記局部化した領域内のすべての輝度値の最大値と前記最小値の差との比率であるステップを含む方法。Determining a localized region of the image that is a selected portion of the image;
Automatically determining a threshold value applied to contour detection in the localized region based on luminance information of pixels in the localized region without intervention of a user, The threshold is determined by a function operator that should reflect a perceptual characteristic related to the luminance of the human visual system, said power function operator being a measure of relative local luminance raised to a power factor;
The relative local luminance is a difference between an average value and a minimum value of all luminance values in the localized region, and a difference between a maximum value and a minimum value of all luminance values in the localized region. A method comprising the step of being a ratio.
Applications Claiming Priority (3)
| Application Number | Priority Date | Filing Date | Title |
|---|---|---|---|
| US08/986,461 US6094508A (en) | 1997-12-08 | 1997-12-08 | Perceptual thresholding for gradient-based local edge detection |
| US08/986,461 | 1997-12-08 | ||
| PCT/US1998/024420 WO1999030270A1 (en) | 1997-12-08 | 1998-11-16 | A new perceptual thresholding for gradient-based local edge detection |
Publications (3)
| Publication Number | Publication Date |
|---|---|
| JP2002503840A JP2002503840A (en) | 2002-02-05 |
| JP2002503840A5 JP2002503840A5 (en) | 2006-01-05 |
| JP4160258B2 true JP4160258B2 (en) | 2008-10-01 |
Family
ID=25532448
Family Applications (1)
| Application Number | Title | Priority Date | Filing Date |
|---|---|---|---|
| JP2000524756A Expired - Fee Related JP4160258B2 (en) | 1997-12-08 | 1998-11-16 | A new perceptual threshold determination for gradient-based local contour detection |
Country Status (8)
| Country | Link |
|---|---|
| US (1) | US6094508A (en) |
| EP (1) | EP1058909B1 (en) |
| JP (1) | JP4160258B2 (en) |
| KR (1) | KR100371470B1 (en) |
| AU (1) | AU1412199A (en) |
| DE (1) | DE69828909T2 (en) |
| TW (1) | TW440801B (en) |
| WO (1) | WO1999030270A1 (en) |
Families Citing this family (115)
| Publication number | Priority date | Publication date | Assignee | Title |
|---|---|---|---|---|
| US6415053B1 (en) | 1998-04-20 | 2002-07-02 | Fuji Photo Film Co., Ltd. | Image processing method and apparatus |
| US6240208B1 (en) * | 1998-07-23 | 2001-05-29 | Cognex Corporation | Method for automatic visual identification of a reference site in an image |
| US6614474B1 (en) * | 1998-08-27 | 2003-09-02 | Polycom, Inc. | Electronic pan tilt zoom video camera with adaptive edge sharpening filter |
| JP2000241117A (en) * | 1999-02-22 | 2000-09-08 | Keyence Corp | Edge detection method of image, inspecting device, and storage medium |
| SE513728C2 (en) * | 1999-03-26 | 2000-10-30 | Goesta Granlund | Artificial vision procedure and system |
| US7095164B1 (en) | 1999-05-25 | 2006-08-22 | Intel Corporation | Display screen |
| US6697534B1 (en) | 1999-06-09 | 2004-02-24 | Intel Corporation | Method and apparatus for adaptively sharpening local image content of an image |
| US6744532B1 (en) * | 1999-08-31 | 2004-06-01 | Lite-On Technology Corporation | Method for enhancing printing quality |
| US6658399B1 (en) | 1999-09-10 | 2003-12-02 | Intel Corporation | Fuzzy based thresholding technique for image segmentation |
| US6625308B1 (en) | 1999-09-10 | 2003-09-23 | Intel Corporation | Fuzzy distinction based thresholding technique for image segmentation |
| US7053944B1 (en) | 1999-10-01 | 2006-05-30 | Intel Corporation | Method of using hue to interpolate color pixel signals |
| US7106910B2 (en) * | 1999-10-01 | 2006-09-12 | Intel Corporation | Color video coding scheme |
| US6628827B1 (en) | 1999-12-14 | 2003-09-30 | Intel Corporation | Method of upscaling a color image |
| US7158178B1 (en) | 1999-12-14 | 2007-01-02 | Intel Corporation | Method of converting a sub-sampled color image |
| US6961472B1 (en) | 2000-02-18 | 2005-11-01 | Intel Corporation | Method of inverse quantized signal samples of an image during image decompression |
| US6748118B1 (en) | 2000-02-18 | 2004-06-08 | Intel Corporation | Method of quantizing signal samples of an image during same |
| US6337925B1 (en) * | 2000-05-08 | 2002-01-08 | Adobe Systems Incorporated | Method for determining a border in a complex scene with applications to image masking |
| US6738520B1 (en) | 2000-06-19 | 2004-05-18 | Intel Corporation | Method of compressing an image |
| US7046728B1 (en) | 2000-06-30 | 2006-05-16 | Intel Corporation | Method of video coding the movement of a human face from a sequence of images |
| US6775413B1 (en) | 2000-09-18 | 2004-08-10 | Intel Corporation | Techniques to implement one-dimensional compression |
| US6563439B1 (en) | 2000-10-31 | 2003-05-13 | Intel Corporation | Method of performing Huffman decoding |
| US6636167B1 (en) | 2000-10-31 | 2003-10-21 | Intel Corporation | Method of generating Huffman code length information |
| US6422082B1 (en) | 2000-11-27 | 2002-07-23 | General Electric Company | Laser shock peening quality assurance by ultrasonic analysis |
| US20020118746A1 (en) * | 2001-01-03 | 2002-08-29 | Kim Hyun Mun | Method of performing video encoding rate control using motion estimation |
| US6947605B2 (en) * | 2001-02-28 | 2005-09-20 | Pts Corporation | Dynamic chain-based thresholding using local characteristics |
| US6766286B2 (en) | 2001-03-28 | 2004-07-20 | Intel Corporation | Pyramid filter |
| US20020184276A1 (en) * | 2001-03-30 | 2002-12-05 | Tinku Acharya | Two-dimensional pyramid filter architecture |
| US6889237B2 (en) * | 2001-03-30 | 2005-05-03 | Intel Corporation | Two-dimensional pyramid filter architecture |
| US7342681B2 (en) * | 2001-07-13 | 2008-03-11 | Transpacific Ip, Ltd | High-speed calibration method and system for an image-capture apparatus |
| CN1184796C (en) * | 2001-07-26 | 2005-01-12 | 佳能株式会社 | Image processing method and equipment, image processing system and storage medium |
| US7110612B1 (en) | 2001-10-11 | 2006-09-19 | Pixelworks, Inc. | Weighted absolute difference based noise reduction method and apparatus |
| AUPR891701A0 (en) * | 2001-11-16 | 2001-12-13 | Proteome Systems Ltd | Method for locating the edge of an object |
| US6891549B2 (en) * | 2002-01-11 | 2005-05-10 | Applied Materials, Inc. | System and method for edge enhancement of images |
| US7154556B1 (en) | 2002-03-21 | 2006-12-26 | Pixelworks, Inc. | Weighted absolute difference based deinterlace method and apparatus |
| CN1313979C (en) * | 2002-05-03 | 2007-05-02 | 三星电子株式会社 | Apparatus and method for generating 3-D cartoon |
| US7146057B2 (en) * | 2002-07-10 | 2006-12-05 | Northrop Grumman Corporation | System and method for image analysis using a chaincode |
| US7116823B2 (en) * | 2002-07-10 | 2006-10-03 | Northrop Grumman Corporation | System and method for analyzing a contour of an image by applying a Sobel operator thereto |
| US7149356B2 (en) * | 2002-07-10 | 2006-12-12 | Northrop Grumman Corporation | System and method for template matching of candidates within a two-dimensional image |
| US7239314B2 (en) * | 2002-08-29 | 2007-07-03 | Warner Bros. Animation | Method for 2-D animation |
| US7266151B2 (en) * | 2002-09-04 | 2007-09-04 | Intel Corporation | Method and system for performing motion estimation using logarithmic search |
| US20040042551A1 (en) * | 2002-09-04 | 2004-03-04 | Tinku Acharya | Motion estimation |
| US20040057626A1 (en) * | 2002-09-23 | 2004-03-25 | Tinku Acharya | Motion estimation using a context adaptive search |
| GB0224357D0 (en) * | 2002-10-19 | 2002-11-27 | Eastman Kodak Co | Image processing |
| US7502525B2 (en) * | 2003-01-27 | 2009-03-10 | Boston Scientific Scimed, Inc. | System and method for edge detection of an image |
| US6993187B2 (en) * | 2003-02-14 | 2006-01-31 | Ikonisys, Inc. | Method and system for object recognition using fractal maps |
| US7062079B2 (en) * | 2003-02-14 | 2006-06-13 | Ikonisys, Inc. | Method and system for image segmentation |
| US20040174446A1 (en) * | 2003-02-28 | 2004-09-09 | Tinku Acharya | Four-color mosaic pattern for depth and image capture |
| US7274393B2 (en) * | 2003-02-28 | 2007-09-25 | Intel Corporation | Four-color mosaic pattern for depth and image capture |
| US20040169748A1 (en) * | 2003-02-28 | 2004-09-02 | Tinku Acharya | Sub-sampled infrared sensor for use in a digital image capture device |
| JP4522054B2 (en) * | 2003-05-07 | 2010-08-11 | キヤノン株式会社 | Diagnosis support apparatus and method |
| US7200279B1 (en) * | 2003-09-11 | 2007-04-03 | Magnachip Semiconductor, Inc. | Method and system for image chroma suppression |
| US7302099B2 (en) * | 2003-11-10 | 2007-11-27 | Microsoft Corporation | Stroke segmentation for template-based cursive handwriting recognition |
| US7805003B1 (en) * | 2003-11-18 | 2010-09-28 | Adobe Systems Incorporated | Identifying one or more objects within an image |
| US7496237B1 (en) | 2004-01-02 | 2009-02-24 | The United States Of America As Represented By The Administrator Of The National Aeronautics And Space Administration | Image processing for binarization enhancement via fuzzy reasoning |
| US7672507B2 (en) * | 2004-01-30 | 2010-03-02 | Hewlett-Packard Development Company, L.P. | Image processing methods and systems |
| US7298897B1 (en) | 2004-02-11 | 2007-11-20 | United States Of America As Represented By The Administrator Of The National Aeronautics And Space Administration | Optimal binarization of gray-scaled digital images via fuzzy reasoning |
| US7400766B1 (en) | 2004-02-19 | 2008-07-15 | The United States Of America As Represented By The Administrator Of The National Aeronautics And Space Administration | Image edge extraction via fuzzy reasoning |
| US20050254728A1 (en) * | 2004-05-13 | 2005-11-17 | Zhuo-Ya Wang | Automatic cutting method for digital images |
| KR101108435B1 (en) * | 2005-05-31 | 2012-02-16 | 서강대학교산학협력단 | False contour correction method and display apparatus to be applied to the same |
| US8463065B2 (en) * | 2005-12-07 | 2013-06-11 | Commonwealth Scientific And Industrial Research Organisation | Linear feature detection method and apparatus |
| US20070154089A1 (en) * | 2006-01-03 | 2007-07-05 | Chang-Jung Kao | Method and apparatus for calculating image histogram with configurable granularity |
| US20070206844A1 (en) * | 2006-03-03 | 2007-09-06 | Fuji Photo Film Co., Ltd. | Method and apparatus for breast border detection |
| JP4523926B2 (en) * | 2006-04-05 | 2010-08-11 | 富士通株式会社 | Image processing apparatus, image processing program, and image processing method |
| WO2007134447A1 (en) * | 2006-05-18 | 2007-11-29 | Resonant Medical Inc. | Methods and systems for segmentation using boundary reparameterization |
| KR100780932B1 (en) * | 2006-05-30 | 2007-11-30 | 엠텍비젼 주식회사 | Color interpolation method and device |
| JP2009541838A (en) * | 2006-06-23 | 2009-11-26 | コーニンクレッカ フィリップス エレクトロニクス エヌ ヴィ | Method, system and computer program for determining a threshold in an image including image values |
| GB0616293D0 (en) | 2006-08-16 | 2006-09-27 | Imp Innovations Ltd | Method of image processing |
| US9451928B2 (en) * | 2006-09-13 | 2016-09-27 | Elekta Ltd. | Incorporating internal anatomy in clinical radiotherapy setups |
| AU2006252019B2 (en) * | 2006-12-13 | 2012-06-28 | Canon Kabushiki Kaisha | Method and Apparatus for Dynamic Connector Analysis |
| KR100850561B1 (en) * | 2007-01-03 | 2008-08-06 | (주)폴리다임 | Method of eliminating horizontal pixel-line from digital image |
| KR100835380B1 (en) * | 2007-01-15 | 2008-06-05 | 한국과학기술원 | Method for detecting edge of an image and apparatus thereof and computer readable medium processing the method |
| US7881497B2 (en) * | 2007-03-08 | 2011-02-01 | Honeywell International Inc. | Vision based navigation and guidance system |
| US8249317B2 (en) * | 2007-07-20 | 2012-08-21 | Eleckta Ltd. | Methods and systems for compensating for changes in anatomy of radiotherapy patients |
| US10531858B2 (en) * | 2007-07-20 | 2020-01-14 | Elekta, LTD | Methods and systems for guiding the acquisition of ultrasound images |
| US7882177B2 (en) * | 2007-08-06 | 2011-02-01 | Yahoo! Inc. | Employing pixel density to detect a spam image |
| US8135198B2 (en) * | 2007-08-08 | 2012-03-13 | Resonant Medical, Inc. | Systems and methods for constructing images |
| US8264591B2 (en) * | 2007-10-22 | 2012-09-11 | Candela Microsystems (S) Pte. Ltd. | Method and system for generating focus signal |
| TWI370673B (en) * | 2007-11-05 | 2012-08-11 | Altek Corp | Method for an image adjustment and digital image processing device thereof |
| US8036468B2 (en) | 2007-12-24 | 2011-10-11 | Microsoft Corporation | Invariant visual scene and object recognition |
| US8200022B2 (en) * | 2008-03-24 | 2012-06-12 | Verint Systems Ltd. | Method and system for edge detection |
| US8189738B2 (en) * | 2008-06-02 | 2012-05-29 | Elekta Ltd. | Methods and systems for guiding clinical radiotherapy setups |
| JP5271031B2 (en) * | 2008-08-09 | 2013-08-21 | 株式会社キーエンス | Image data compression method, pattern model positioning method in image processing, image processing apparatus, image processing program, and computer-readable recording medium |
| US20100166257A1 (en) * | 2008-12-30 | 2010-07-01 | Ati Technologies Ulc | Method and apparatus for detecting semi-transparencies in video |
| TWI430649B (en) * | 2009-05-26 | 2014-03-11 | Silicon Motion Inc | Edge parameter computing method for image and image noise omitting method utilizing the edge parameter computing method |
| US8270754B2 (en) * | 2009-06-22 | 2012-09-18 | Qualcomm Incorporated | Lens roll-off correction operation using values corrected based on brightness information |
| US10542962B2 (en) * | 2009-07-10 | 2020-01-28 | Elekta, LTD | Adaptive radiotherapy treatment using ultrasound |
| US8345106B2 (en) * | 2009-09-23 | 2013-01-01 | Microsoft Corporation | Camera-based scanning |
| JP5507962B2 (en) * | 2009-11-05 | 2014-05-28 | キヤノン株式会社 | Information processing apparatus, control method therefor, and program |
| BR112012013721A2 (en) * | 2009-12-07 | 2016-03-15 | Hiok Nam Tay | autofocus imaging system |
| KR101268520B1 (en) * | 2009-12-14 | 2013-06-04 | 한국전자통신연구원 | The apparatus and method for recognizing image |
| US20110172526A1 (en) | 2010-01-12 | 2011-07-14 | Martin Lachaine | Feature Tracking Using Ultrasound |
| US9248316B2 (en) | 2010-01-12 | 2016-02-02 | Elekta Ltd. | Feature tracking using ultrasound |
| GB2505318B (en) | 2010-05-26 | 2014-08-13 | Hiok-Nam Tay | Auto-focus image system |
| US8396876B2 (en) | 2010-11-30 | 2013-03-12 | Yahoo! Inc. | Identifying reliable and authoritative sources of multimedia content |
| US8942917B2 (en) | 2011-02-14 | 2015-01-27 | Microsoft Corporation | Change invariant scene recognition by an agent |
| TWI450155B (en) * | 2011-02-15 | 2014-08-21 | Wistron Corp | Method and system for calculating calibration information for an optical touch apparatus |
| JP5178860B2 (en) | 2011-02-24 | 2013-04-10 | 任天堂株式会社 | Image recognition program, image recognition apparatus, image recognition system, and image recognition method |
| JP4989768B2 (en) | 2011-02-24 | 2012-08-01 | 任天堂株式会社 | Image processing program, image processing apparatus, image processing system, and image processing method |
| JP5016723B2 (en) | 2011-02-24 | 2012-09-05 | 任天堂株式会社 | Image recognition program, image recognition apparatus, image recognition system, and image recognition method |
| JP2011134343A (en) | 2011-02-24 | 2011-07-07 | Nintendo Co Ltd | Image processing program, image processing apparatus, image processing system, and image processing method |
| JP5026604B2 (en) * | 2011-02-24 | 2012-09-12 | 任天堂株式会社 | Image recognition program, image recognition apparatus, image recognition system, and image recognition method |
| JP4967065B2 (en) | 2011-02-24 | 2012-07-04 | 任天堂株式会社 | Image processing program, image processing apparatus, image processing system, and image processing method |
| US9065999B2 (en) | 2011-03-24 | 2015-06-23 | Hiok Nam Tay | Method and apparatus for evaluating sharpness of image |
| US9726486B1 (en) * | 2011-07-29 | 2017-08-08 | Rockwell Collins, Inc. | System and method for merging enhanced vision data with a synthetic vision data |
| CN103959335B (en) * | 2011-11-28 | 2018-03-09 | 皇家飞利浦有限公司 | Image processing apparatus |
| CN102920477B (en) * | 2012-03-05 | 2015-05-20 | 杭州弘恩医疗科技有限公司 | Device and method for determining target region boundary of medical image |
| JP5772675B2 (en) * | 2012-03-23 | 2015-09-02 | トヨタ車体株式会社 | Gray image edge extraction method, edge extraction device, and gray image edge extraction program |
| US8971637B1 (en) | 2012-07-16 | 2015-03-03 | Matrox Electronic Systems Ltd. | Method and system for identifying an edge in an image |
| CN105210115B (en) * | 2013-06-10 | 2020-10-30 | 英特尔公司 | Performing gesture recognition using 2D image data |
| CN108369420B (en) | 2015-11-02 | 2021-11-05 | 星船科技私人有限公司 | Apparatus and method for autonomous positioning |
| US9727793B2 (en) * | 2015-12-15 | 2017-08-08 | Honda Motor Co., Ltd. | System and method for image based vehicle localization |
| US10769776B2 (en) | 2016-02-12 | 2020-09-08 | Cognex Corporation | System and method for efficiently scoring probes in an image with a vision system |
| EP3293672A1 (en) * | 2016-09-07 | 2018-03-14 | Malvern Panalytical Limited | Particle boundary identification |
| EP3555851B1 (en) * | 2016-12-14 | 2021-09-22 | Eyes Ltd | Edge detection in digitized images |
| CN110189349B (en) * | 2019-06-03 | 2022-03-25 | 湖南国科微电子股份有限公司 | Image processing method and device |
Family Cites Families (10)
| Publication number | Priority date | Publication date | Assignee | Title |
|---|---|---|---|---|
| US5014124A (en) * | 1988-02-25 | 1991-05-07 | Ricoh Company, Ltd. | Digital image processing apparatus |
| JP2885823B2 (en) * | 1989-04-11 | 1999-04-26 | 株式会社豊田中央研究所 | Visual recognition device |
| US5457754A (en) * | 1990-08-02 | 1995-10-10 | University Of Cincinnati | Method for automatic contour extraction of a cardiac image |
| US5210799A (en) * | 1991-03-28 | 1993-05-11 | Texas Instruments Incorporated | System and method for ranking and extracting salient contours for target recognition |
| US5231580A (en) * | 1991-04-01 | 1993-07-27 | The United States Of America As Represented By The Secretary Of The Department Of Health And Human Services | Automated method and apparatus for determining characteristics of nerve fibers |
| US5778107A (en) * | 1993-12-24 | 1998-07-07 | Kabushiki Kaisha Komatsu Seisakusho | Position recognition method |
| US5734739A (en) * | 1994-05-31 | 1998-03-31 | University Of Washington | Method for determining the contour of an in vivo organ using multiple image frames of the organ |
| US5572565A (en) * | 1994-12-30 | 1996-11-05 | Philips Electronics North America Corporation | Automatic segmentation, skinline and nipple detection in digital mammograms |
| FR2731819B1 (en) * | 1995-03-17 | 1997-04-11 | Alsthom Cge Alcatel | CONTOUR EXTRACTION METHOD USING MULTI-FRACTAL ANALYSIS |
| US5845007A (en) * | 1996-01-02 | 1998-12-01 | Cognex Corporation | Machine vision method and apparatus for edge-based image histogram analysis |
-
1997
- 1997-12-08 US US08/986,461 patent/US6094508A/en not_active Expired - Lifetime
-
1998
- 1998-11-16 KR KR10-2000-7006177A patent/KR100371470B1/en not_active IP Right Cessation
- 1998-11-16 WO PCT/US1998/024420 patent/WO1999030270A1/en active IP Right Grant
- 1998-11-16 AU AU14121/99A patent/AU1412199A/en not_active Abandoned
- 1998-11-16 DE DE69828909T patent/DE69828909T2/en not_active Expired - Lifetime
- 1998-11-16 EP EP98957993A patent/EP1058909B1/en not_active Expired - Lifetime
- 1998-11-16 JP JP2000524756A patent/JP4160258B2/en not_active Expired - Fee Related
- 1998-11-30 TW TW087119801A patent/TW440801B/en not_active IP Right Cessation
Also Published As
| Publication number | Publication date |
|---|---|
| KR100371470B1 (en) | 2003-02-07 |
| WO1999030270A1 (en) | 1999-06-17 |
| EP1058909A4 (en) | 2002-06-19 |
| AU1412199A (en) | 1999-06-28 |
| JP2002503840A (en) | 2002-02-05 |
| TW440801B (en) | 2001-06-16 |
| US6094508A (en) | 2000-07-25 |
| EP1058909A1 (en) | 2000-12-13 |
| KR20010032850A (en) | 2001-04-25 |
| EP1058909B1 (en) | 2005-02-02 |
| DE69828909T2 (en) | 2006-04-06 |
| DE69828909D1 (en) | 2005-03-10 |
Similar Documents
| Publication | Publication Date | Title |
|---|---|---|
| JP4160258B2 (en) | A new perceptual threshold determination for gradient-based local contour detection | |
| JP4792109B2 (en) | Image defect removal considering image features | |
| JP5781743B2 (en) | Image processing apparatus, image processing method, and image processing program | |
| EP2515273B1 (en) | Multiple exposure high dynamic range image capture | |
| US7324701B2 (en) | Image noise reduction | |
| US20050089239A1 (en) | Method for improving digital images and an image sensor for sensing the same | |
| US8406561B2 (en) | Methods and systems for estimating illumination source characteristics from a single image | |
| WO2003069559A2 (en) | Assessing the photo quality of a captured image in a digital still camera | |
| WO2015070723A1 (en) | Eye image processing method and apparatus | |
| WO2004023787A2 (en) | Signal intensity range transformation apparatus and method | |
| US9396411B2 (en) | Method and system for generating intrinsic images using a single reflectance technique | |
| US6577775B1 (en) | Methods and apparatuses for normalizing the intensity of an image | |
| JP2005165387A (en) | Method and device for detecting stripe defective of picture and display device | |
| JP2003167529A (en) | Method and device for picture defect detection, and program for picture defect detection | |
| JP2017085570A (en) | Image correction method and image correction device | |
| CN110310235B (en) | Fundus image processing method, device and equipment and storage medium | |
| JP2009258770A (en) | Image processing method, image processor, image processing program, and imaging device | |
| JP4247993B2 (en) | Image inspection apparatus, image inspection method, control program, and readable storage medium | |
| JPH10269352A (en) | Image processor and method | |
| Le’Win et al. | Results Analysis of Real-Time Edge Detection Techniques using LabView | |
| JP3941403B2 (en) | Image density unevenness detection method and inspection apparatus | |
| JP4089780B2 (en) | Color image processing method | |
| JP4230962B2 (en) | Image processing apparatus, image processing method, and image processing program | |
| CN117745552A (en) | Self-adaptive image enhancement method and device and electronic equipment | |
| JP2021033502A (en) | Image processing device, method, and program |
Legal Events
| Date | Code | Title | Description |
|---|---|---|---|
| A521 | Request for written amendment filed |
Free format text: JAPANESE INTERMEDIATE CODE: A523 Effective date: 20051110 |
|
| A621 | Written request for application examination |
Free format text: JAPANESE INTERMEDIATE CODE: A621 Effective date: 20051110 |
|
| A977 | Report on retrieval |
Free format text: JAPANESE INTERMEDIATE CODE: A971007 Effective date: 20080606 |
|
| TRDD | Decision of grant or rejection written | ||
| A01 | Written decision to grant a patent or to grant a registration (utility model) |
Free format text: JAPANESE INTERMEDIATE CODE: A01 Effective date: 20080617 |
|
| A01 | Written decision to grant a patent or to grant a registration (utility model) |
Free format text: JAPANESE INTERMEDIATE CODE: A01 |
|
| A61 | First payment of annual fees (during grant procedure) |
Free format text: JAPANESE INTERMEDIATE CODE: A61 Effective date: 20080717 |
|
| R150 | Certificate of patent or registration of utility model |
Free format text: JAPANESE INTERMEDIATE CODE: R150 |
|
| FPAY | Renewal fee payment (event date is renewal date of database) |
Free format text: PAYMENT UNTIL: 20110725 Year of fee payment: 3 |
|
| FPAY | Renewal fee payment (event date is renewal date of database) |
Free format text: PAYMENT UNTIL: 20110725 Year of fee payment: 3 |
|
| FPAY | Renewal fee payment (event date is renewal date of database) |
Free format text: PAYMENT UNTIL: 20120725 Year of fee payment: 4 |
|
| FPAY | Renewal fee payment (event date is renewal date of database) |
Free format text: PAYMENT UNTIL: 20120725 Year of fee payment: 4 |
|
| FPAY | Renewal fee payment (event date is renewal date of database) |
Free format text: PAYMENT UNTIL: 20130725 Year of fee payment: 5 |
|
| R250 | Receipt of annual fees |
Free format text: JAPANESE INTERMEDIATE CODE: R250 |
|
| R250 | Receipt of annual fees |
Free format text: JAPANESE INTERMEDIATE CODE: R250 |
|
| R250 | Receipt of annual fees |
Free format text: JAPANESE INTERMEDIATE CODE: R250 |
|
| R250 | Receipt of annual fees |
Free format text: JAPANESE INTERMEDIATE CODE: R250 |
|
| R250 | Receipt of annual fees |
Free format text: JAPANESE INTERMEDIATE CODE: R250 |
|
| LAPS | Cancellation because of no payment of annual fees |