JP3589983B2 - Method for detecting traffic condition of vehicle and device for detecting traffic condition - Google Patents
Method for detecting traffic condition of vehicle and device for detecting traffic condition Download PDFInfo
- Publication number
- JP3589983B2 JP3589983B2 JP2000560565A JP2000560565A JP3589983B2 JP 3589983 B2 JP3589983 B2 JP 3589983B2 JP 2000560565 A JP2000560565 A JP 2000560565A JP 2000560565 A JP2000560565 A JP 2000560565A JP 3589983 B2 JP3589983 B2 JP 3589983B2
- Authority
- JP
- Japan
- Prior art keywords
- image
- area
- vehicle
- recorded
- density
- Prior art date
- Legal status (The legal status is an assumption and is not a legal conclusion. Google has not performed a legal analysis and makes no representation as to the accuracy of the status listed.)
- Expired - Fee Related
Links
Images


Classifications
-
- G—PHYSICS
- G08—SIGNALLING
- G08G—TRAFFIC CONTROL SYSTEMS
- G08G1/00—Traffic control systems for road vehicles
- G08G1/01—Detecting movement of traffic to be counted or controlled
- G08G1/04—Detecting movement of traffic to be counted or controlled using optical or ultrasonic detectors
Abstract
Description
【0001】
本発明は、車両の交通状況を検出する方法およびこのような交通状況を検出する装置に関する。
【0002】
交通案内システムを有効に使用するためにも、灯火信号装置の切り換えフェーズを有利に調整するためにも、また交通道路工事を交通に適合させて決定するためにも、できる限り広範囲に及ぶ、計算機によって支援されたシミュレーションと交通流の予測とが必要である。しかしながらこのために使用されるプログラムと実際の状況とを適合させるためには、考察すべき領域における実際の交通状況について広範囲な知識が必要である。ここでは殊に密集地域では、個別の交通路を交通流について検出するだけでは十分ではなく、できる限り完全な交通状況図が、場合に応じて代替えルート、回避区間などを含めて必要である。
【0003】
交通の流れを最適化するために重要な実際の交通状況の検出は、これまでインフラストラクチャーの測定装置を介して、例えば道路交通では走行車線の測定ループを介して、または多くの人手を要する交通量カウントによって行われている。しかしながらこれらの手段は極めて局所に限定されており、全体的な見通しは不可能である。さらにこれらの手段は、測定個所を正しく選択したか、または誤って選択したかに応じて、極めてわずかな予測力しか有しない。さらにインフラストラクチャーの測定装置は、場所が固定されており、実装時にも維持の際にも大きなコストと結びついている。これらの理由からこのような測定手法は通例わずかな箇所に限定されている。
【0004】
本発明の課題は、車両の交通状況を広範囲に検出する方法を提供することである。
【0005】
この課題は、請求項1に記載された方法によって解決される。
【0006】
この解決手段では、地表の上方に距離をおいて存在する物体から、この物体の下の地表および/または地表の上方にあり、かつ少なくとも1キロメートルの横方向の直径を有する領域の画像を、レーダビームを用いて十分に小さなグリッドピッチで記録し、領域に存在する所定の少なくとも1種類の車両の密度が、所定の最大密度まで識別されるようにし、かつ記録したこの画像を、少なくとも1種類の車両の少なくとも1つの密度について評価し、区別できない複数の車両からなりつながって見える列に含まれる車両の密度に対する下限値を前記グリッドピッチ(r)を用いて設定する。
【0007】
物体として有利には地球を周回する地球衛星を使用する(請求項2)。このような衛星は、地表からの距離が100kmのオーダーと大きいため、例えば50x100kmの面積の殊に大きな領域、少なくとも10kmのオーダーの直径を有する領域(請求項3)を監視することができるという利点を有する。
【0008】
したがって有利にもあらゆるカテゴリおよび/または種類の車両を、従来公知でなく、かつ不可能であった広範囲において迅速かつ確実に監視することができる。このような車両には、軌道に拘束されない陸上車両、例えばあらゆる種類の乗用車および/または貨物自動車、軌道に拘束された車両、例えば乗客または貨物輸送のためのあらゆる種類の鉄道列車、海上および内陸水路の水上輸送手段、例えばあらゆる種類の客船および/または貨物船、ならびに空中輸送手段、例えばあらゆる種類の旅客機および貨物機が含まれる。殊に有利にも車両をカテゴリおよび/または種類が異なっても、車両のカテゴリおよび/または種類を考慮しなくても例えば同時に監視することができる。
【0009】
地球を周回するただ1つの衛星によって2日〜4日毎に同一領域の個別画像と、画像の時系列が作成される。
【0010】
物体として静止地球衛星を使用することも可能である(請求項4)。この静止地球衛星によって有利にもほぼ半球全体の大きさの領域における交通、例えば大西洋または太平洋の船舶交通を常時監視することができる。
【0011】
地球衛星からは、広大な領域の画像を十分に高い分解能で光学的に作成することが可能である。しかしながらこの記録方式は昼夜区別および天候に依存している。これに対して画像を記録するためにレーダビームを使用すれば、画像を有利にも昼夜の別なく、どのような天候であっても記録することができる。しかしながら、十分に高い分解能に相応する十分に小さなグリッドピッチを有する画像を可能にするレーダビームとレーダシステムとが必要である。グリッドピッチの下限として、少なくとも道路交通については車線位置を区別するために2mの尺度が考慮される。この場合、道路の車両密度を一義的に識別して割り当てることが可能である。それは車両は道路とは異なる反射率を有しており、このため相応する輝度の違いを記録した画像において有するからである。
【0012】
本発明の方法では衛星の形態の物体の代わりに、空中輸送手段の形態の物体を使用することができる(請求項5)。ここでは空中輸送手段として主に航空機が使用されるが、例えば気球および類似のものも使用される。このような航空機からは例えば、5〜7km幅の領域の画像を実現することができ、少なくとも領域は1kmのオーダーの直径を有する(請求項6)。
【0013】
この場合にも昼夜の区別と天候とに依存しないようにするために、画像を光学的に記録するのではなく、レーダ、有利にはSARによって記録することが推奨される。ここでも少なくとも道路交通については2mを、グリッドピッチの下限として使用する。
【0014】
したがっていずれの場合においても、画像をレーダビームによって記録することが有利である(請求項7)。
【0015】
画像を干渉法(請求項8)および/またはドップラー効果(請求項9)を用いて記録する場合、有利にも車両密度の他に車両の速度を検出可能である。
【0016】
本発明の方法は大都市における道路交通の状況の広域的な検出と、道路交通の監視と、案内とに殊に有利であるが、小都市および/または地方の地域においても有利である。しかしこれらに限定されることはなく、すでに述べたように基本的に鉄道列車、船舶および/または航空機の動きの監視のために例えば港の領域および空港の領域に使用することができる。
【0017】
本発明の方法の利点は、ジオレファレンシング(Georefenrenzierung)の手段を使用するのに適していることである。この手段によって迅速かつ精確な対応づけが、領域の点と、これに相応する、この領域から記録した画像の点との間で可能である。本発明の方法の有利な実施形態では、領域の画像で識別した車両密度と、領域の交通路との間の位置的な対応付けがジオレファレンシングによって作成され(請求項10)、このジオレファレンシングによって、例えば人口地球衛星から記録した画像において、車両密度と各交通路とを位置的に対応付けることができる。
【0018】
交通状況の変化の監視は有利には、領域の画像を記録した後、同じ領域の少なくとも別の1つの画像を記録し、この領域に存在する車両密度について同様に評価し、記録したこれらの少なくとも2つの画像を相互に比較することによって行われる(請求項11)。これによって有利にも、例えば道路交通について、交通案内システムおよび信号機フェーズの制御アルゴリズムの直接的な最適化が、この最適化手段の前と後とを比較することによって実現される。さらに有利にも道路工事によって得られる変化をチェックしたり、既存のシミュレーションプログラムを精確に調整することができる。
【0019】
殊に有利であるのは、領域(10)の2つの画像(3)からなる少なくとも1つの列を、時間的に1時間以内で連続する個別の瞬時記録によって作成する場合である(請求項12)。このような画像の列は有利にも、交通状況およびその時間的な変化の検出にリアルタイムで使用することも、後の時点で使用することも可能である。これは例えば道路交通については、交通情報および交通案内システムの直接的な制御に対して目下の交通状況を作成するためと、交通流シミュレーションを調整するために使用することができ、ここでは付加的に交通案内システムおよび信号機フェーズの制御アルゴリズムの直接的な最適化が、前後の比較により実現される。記録の評価は手動もしくは短期間かつ比較的わずかな人員だけを使用することにより機械によって行われる。これが行われるのは、画像の自動車の密度を検出しかつこの車両密度と各交通路とを位置的に対応付けるシステムが設けられている場合である。
【0020】
記録の実際の評価はすでに物体において、例えば衛星内または空中輸送手段内で行うことができる。この目的に適した有利な、交通状況を検出する装置は請求項13に記載した特徴を有しており、ここで地表の上方に距離をおいて存在するこの物体は、例えば地球を周回する地球衛星、静止地球衛星または空中輸送手段である。
【0021】
請求項14に示した本発明の装置の有利な実施形態では、評価装置は、記録した画像の所定の情報内容を符号化されたデータ信号に変換する。
【0022】
この評価装置は有利にはジオレファレンシングされた符号化データ信号を形成し(請求項15)、これらのデータ信号によって有利にも、地図と調査すべき交通路との関係、ひいては車両密度と各交通路との位置的な対応付けが作成される。
【0023】
符号化されたデータ信号からは、関連する領域の交通状況についての情報が得られ、これは有利には、信号を処理して領域の交通状況についての情報を得る処理装置によって行われる(請求項16)。この処理装置は有利には例えば地表に固定して設けられている。
【0024】
交通状況について得られた領域の情報は別の利用部に供給され、ここで供給は有利にはこの利用部にだけ関係するデータの形態で、かつこの利用に対して設けられた利用装置において行われる(請求項17)。単一の交通状況についての種々の種類の利用部に対して、別個の利用装置を使用することができ、これらの装置は有利には例えば地表に固定して設けられている。
【0025】
本発明を以下、図面を用いて実施例に基づき詳しく説明する。ここで、
図1は、地表から距離をおいて存在する物体の透視図を示しており、この物体から地表における領域の少なくとも1つの画像が記録され、
図2は、地表における領域の画像の部分図を示しており、これは地球を周回する人口衛星から写真によって記録したものであり、
図3は、地表における領域の画像の部分図を示しており、これは地球を周回する人口衛星からレーダビームによって記録したものであり、
図4は、地表における領域の画像の部分図を示しており、これは飛行中の航空機から写真によって記録したものであり、
図5は、地表における領域の画像の部分図を示しており、これは飛行中の航空機からレーダビームによって記録したものであり、
図6は、交通状況を検出する装置の実施例を示している。
【0026】
これらの図は概略的であり、縮尺は正しくない。
【0027】
図1では距離aで地表1の上方に物体2があり、この物体から領域10の画像が記録される。この領域は物体2の下方において地表1または地表1の上方の空中にある。物体2は地球衛星でも空中輸送手段でもよい。地表1の下は陸地の表面だけでなく、地球の水面でもあると理解されたい。
【0028】
ここで前提としているのは物体2が人工衛星であることであり、これは地球をこのような衛星に通例の、100kmのオーダーの距離で周回する。
【0029】
この衛星2から例えば、約100kmの長さlと約50kmの幅bを有するストライプ状領域10の画像が記録される。図1では地表1の湾曲は無視されている。
【0030】
この画像はビーム5によって記録することができ、ここでこのビームによって保証されるのは、画像においてグリッドピッチが十分に小さく、このために領域10に存在する所定の少なくとも1種類の車両の密度が、所定の最大密度まで識別されることである。
【0031】
図2には、衛星2から記録した、領域10の画像3の部分図11′が示されており、ここでの前提は、領域10の画像3が写真によるものであること、すなわち光学的なビーム5によって作成されたことであり、また部分図11′は図1の領域10の比較的小さい部分11に相応することである。光学的ビーム5は、紫外線、可視光線および/または赤外線とすることができる。
【0032】
写真によって記録した領域10の画像3、ひいては部分図11′には、使用した光学的ビーム5の波長および記録光学系の分解能によって決まるグリッドピッチがある。この場合にグリッドピッチは0.5mをはるかに下回ることができ、これによって個別の車両のような対象物の輪郭をある程度鮮明にコピーすることができる。
【0033】
例えば領域10は、幹線道路と高速道路とからなる網によって覆われた、地表1の部分であり、かつ領域10の部分11を通って車両の通行する高速道路110が通じているとする。領域10の部分11における景観のその他の識別可能な構造体、例えば樹木、灌木、家屋、別の道路、河川、橋などは図2の部分図11′において簡単のために省略されている。
【0034】
高速道路110は、例えばグリーンベルト111によって相互に分離された2つの車道112および113からなり、これらの車道はそれぞれ、例えば分離線1123ないしは1133によって相互に分離された2つの走行車線1121,1122ないしは1131,1132を有する。
【0035】
車道112は下から上への走行方向114のためのものであり、車道113は上から下への走行方向115のためのものであるとする。
【0036】
車道112および113にある車両は通常、乗用車、バス、およびトレーラー付きまたはトレーラーのない貨物自動車からなる。図2では例えば1台だけ、貨物自動車またはバスがあり、これは走行車線1131にあり参照符合4′で示されている。高速道路110の残りの車両はすべて乗用車であるとする。これらの乗用車はそれぞれ、貨物自動車またはバスの長さe′よりも短い長さeだけで見た目にもすでに区別される。2,3の個別の乗用車は、残りの乗用車の代表であり、参照符合4で示されている。合計して13台の乗用自動車が、部分図11′の高速道路110の部分にある。
【0037】
右側通行であるとすると、例えば、車道113の右側の走行車線1131で貨物自動車またはバス4′の後方に例えば3台の乗用車4が密に連続して走行している。例えば4′のこの貨物自動車またはバスは、より高速に走行する左側の走行車線1132の乗用車4によっていままさに追い越されるため、4′の貨物自動車またはバスの後方の3台の乗用車4は、左側の走行車線1132が再び空くまで待たなければならない。
【0038】
走行車線の車両の密度は、走行方向(または走行方向の逆方向に)つながっている車両間の間隔dによって決まる。連続する車両間の間隔dが大きければ大きいほど、車両の密度は小さい。
【0039】
図2の例では、貨物自動車またはバス4′と、その後方で密に追突しそうに走行する3台の乗用車4とからなる車両グループ40において車両の最大密度が発生している。それはこのグループ40では連続する車両4′と4との間の間隔d0は、グループ40に所属しない連続する車両4間の間隔dに比べて明らかに極めて小さいからである。
【0040】
走行車線における絶対車両最大密度が得られるのは、車両が隙間なく続いている場合、すなわちdが0に等しい場合である。道路交通では絶対車両最大密度は、特別な場合を除けば発生しない。それは車両運転者が、最小間隔dをつねに0以上に維持するようにしているからである。
【0041】
グリッドピッチrは、一般的に車両最大密度を決め、この車両最大密度を上回ると、間隔0≦d≦rによって決まる車両密度は相互に区別されず、したがって検出することができない。それはこれらの車両はもはや区別できないからである。これに対して間隔d>rを有する車両は区別することができ、これらの車両の密度は相互に区別され、ひいては識別することができる。これらの車両密度は、間隔dによって、整数でグリッドピッチrの何倍であるかが決定される。
【0042】
車両の最大密度d=rが発生する場合、グリッドピッチrによって下限値を、区別できない車両からなるつながって見える列に含まれる複数台の車両に対して得ることができる。
【0043】
図2については例えば、使用した写真による記録光学系が十分な分解能を有していることを前提としており、これによってグリッドピッチrが約0.1mであり、したがってあらかじめ決定した車両最大密度と、絶対最大密度とは実質的に同じ意味である。それは車両の大きさに対して0.1mは無視できるほど小さいからである。
【0044】
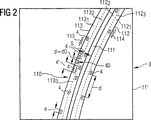
図3については前提としているのは、部分図11′が、写真によって記録された領域10の画像から得られたのではなく、レーダビーム5を用いて記録された領域10の画像3から得られたことである。
【0045】
図3の部分図11′では、図2の部分図11′と同様に高速道路110と、そこにある車両だけが示されており、簡単のために景観のその他の詳細は示されていない。
【0046】
ここでさらに前提とされているのは、レーダビーム5によって記録した画像3が、写真による画像3と同じ時点に衛星2から記録されたことである。したがって図3の部分図11′において車両4′および4は、図2の部分図11′と同じ交通状況で高速道路110に存在する。
【0047】
図3のレーダビーム5によって記録した画像、ひいては部分図11′は、図2の写真による部分図11′とは大きさの異なるグリッドピッチ>0.5mを有しており、したがってより低い、異なった幾何学的分解能を有する。このグリッドピッチrは図3に示されている。
【0048】
比較的粗いこのグリッドピッチrに起因して、図3の部分図11′では図2の部分図11′と異なり、車道112および113、ならびに車道112および113の車両4′および4の境界はそれぞれ不鮮明である。分離線1123および1133ももはや識別不能である。グリッドピッチrが粗いことの第1の原因は、レーダビーム5が光学的波長とは異なる長い波長を有することにある。
【0049】
いずれにしろ車道112および/または113の各車両は、不定形のシミとして現れており、これはこの車道によって与えられた背景に対して有利にも格段に際立っている。この原因は、状況が有利であれば車道または一般的に地面は、そこにある車両と比べてレーダビーム5に対して全く異なる反射率を有するためである。
【0050】
レーダビーム5によって記録した画像、ひいては部分図11′においては、グリッドピッチrよりも小さい対象物および間隔を感知することはできない。
【0051】
ここに記載した方法では有利にも、実質的に2メートルに等しいグリッドピッチで十分である。
【0052】
このグリッドピッチr=2mで、交通が少ない場合、交通が中程度である場合、および交通が多い場合にそれぞれ相応する、車両のわずかな密度から、中程度の密度を経て高い密度までを領域10の画像3で識別し、相互に区別することがができる。これができるのは、これら車両と、連続する車両間のこれら間隔とが実質的に個々に識別でき、これらの間隔が概して交通が少ない場合、交通が中程度である場合、および交通が多い場合にそれぞれ明確に相互に区別できる場合である。
【0053】
他方、このグリッドピッチr=2mで、渋滞した交通ないしは道路停滞は、画像3の車両が大部分において相互に分離されず、実質的につながった列として認識されることによって識別される。それは連続する車両の間隔は2mに近いからである。例えばこのような列は、長さが1または数キロメートルであれば、異なる時点に記録した2つまたはそれ以上の画像3を比較して少なくとも一方の端部に動きがない場合には確実に停滞を表しており、またこのような比較によって列の動きが検出される場合には渋滞を表している。
【0054】
図2および3において例でやや非現実的に仮定したのは、車両グループ40のつながった4つの車両4′および4間の間隔d0がそれぞれ2mに近いか等しいことである。したがってこのグループ40は、つながった車両の列のように見える。
【0055】
乗用車の相互の長さの違いは明らかに2m以下であり、2m以上の間隔dがあれば、ここで説明している方法でそのような間隔として識別される。同じ重量クラスの貨物自動車とバスの相互の長さの違いも明らかに2m以下であるが、これらの貨物自動車とバスと乗用車の長さと、乗用車の長さの違いは多くの場合に2m以上である。この場合にここで説明している方法では、同じ重量クラスの貨物自動車およびバスは、交通が流れておりかつ間隔dが2m以上であれば、そのように識別され、かつ乗用車と区別することができる。したがって車両のカテゴリおよび/または種類を区別することができ、その密度も2mのグリッドピッチrを形成するレーダビームによって個別に決定することができる。
【0056】
図4および5について前提としたのは、図1の物体2が地表1から8〜10kmの間隔で飛行する航空機であることである。この航空機から例えば、地表1のストライプ状領域10の画像が記録され、ここでこの領域10は約9kmの長さlおよび約5〜7kmの幅bを有する。
【0057】
図4には航空機2から記録した領域10の画像3から得られた部分図11′が示されており、ここで前提としたのは、この画像3が写真によって形成されており、かつ部分図11′が図1の領域10の比較的小さな部分11に相応することである。
【0058】
ここでは例えば領域10は都市の道路交通網であり、領域10の部分11はこの道路交通網のうち、航空機が通過した交通交差点120を示している。領域10の部分11における都市景観の識別可能なその他の構造体、例えば樹木、灌木、家屋、別の道路、河川、橋などは図4の部分図11′では簡単のため省略されている。
【0059】
交差点120では例えば2つの道路121および122が交差している。各道路121および122は、例えば分離線1213ないしは1223によって相互に分離された2つの車道1211,1212ないしは1221,1222を有する。
【0060】
道路121には、走行方向1214に対する車道1211と、走行方向1214とは反対の走行方向1215に対する車道1212とがある。道路122には、走行方向1224に対する車道1221と、走行方向1224とは反対の走行方向1225に対する車道1222とがある。
【0061】
交差点120には、図示しない信号装置が設けられており、これは画像を記録した瞬間はつぎのようにスイッチングされている。すなわち道路122が赤であり、かつ例外なく乗用車4からなる車両は、道路122の2つの車道1221および1222において交差点120の手前で待たなければならず、これに対して例えば、やはり例外なく乗用車4からなる、道路122の2つの車道1211および1222の車両は青を有しており、交差点120を横断することができるようにスイッチングされているのである。
【0062】
これによれば道路122では交差点120の手前で車道1221に複数の、例えば4台の乗用車4からなるグループ41が、また車道1222に複数の例えば5台の乗用車4からなるグループ42が停滞している。
【0063】
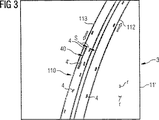
図5について前提としたのは、部分図11′が、写真によって記録した領域10の画像3から得られたのではなく、リーダービーム5によって記録した領域10の画像3から得られたことである。
【0064】
図5の部分図11′には、図4の部分図11′と同様に、道路121および122を有する交差点120と、そこにある車両とだけが示されており、簡単のなめに都市景観の別の詳細は示されていない。
【0065】
図5のレーダビーム5によって記録した画像3、ひいては部分図11′は、図4の写真によって記録した画像3および部分図11′とは大きさ異なる、例えば2mのグリッドピッチrを有しており、したがってより低い異なる幾何学分解能を有する。
【0066】
ここで前提としているのは、レーダビーム5によって記録した画像3が写真による画像3と同じ時点に航空機2から記録されていることであり、したがって図5の部分図11′において車両4は、図4の部分図11′と同じ交通状況で、相互に交差する道路121および122に存在する。
【0067】
この比較的粗いグリッドピッチrに起因して、図5の部分図11′においても図4の部分図11′とは異なり、道路121および122ならびに道路121および122の車両4の境界はそれぞれ不鮮明である。分離線1213ないしは1223ももはや識別不能である。
【0068】
この場合も道路121および122の各車両4は、不定形のシミとして現れている。これはこの道路によって与えられた背景に対して有利にも格段に際立っている。この原因は上記と同様に、状況が有利であれば車道または一般的に地面は、そこにある車両と比べてレーダビーム5に対して全く異なる反射率を有するためである。
【0069】
前提としているのは、道路122の車両4からなる各グループ41および42において、連続する車両4の各間隔d0がグリッドピッチrよりも小さく、これに対して各車道1211および1212と道路121とにおいて、連続する車両4の各間隔dがグリッドピッチrよりも大きいことである。したがってこれらのグループ41および42はそれぞれ、つながった車両の列のように見え、これに対して道路121の車両4は個別に識別される。
【0070】
図4および5の道路121および122はそれぞれ、対向交通を有する道路であり、すなわち一方の走行方向専用の車道と、反対の走行方向専用の車道とを有する道路である。ここでこれらの2つの車道は、分離線だけによって相互に分離されているか、または少なくとも極めてわずかな間隔で隣接して延在している。このような道路では領域10の画像3で、車両を個別の車道に割り当て、ひいては走行方向を割り当て可能でなければならない。これは殊に渋滞した交通または交通停滞の際に当てはまることである。この場合には、このような交通状況を示す車両の列を画像3において正しい走行方向に割り当てなければならない。それは交通関与者に、例えば停滞を誤った方向で通知すると大変なことになってしまうからである。有利にも車両を正しい車道に一義的にかつ確実に割り当て、ひいては正しい走行方向を割り当てるためには、2mのグリッドピッチrで十分である。
【0071】
さらにこのグリッドピッチr=2mにおいて有利にも、例えば都市における道路および駐車場の駐車状況を識別することができる。すなわち道路および駐車場が、駐車した車両によって占められているかを識別することができる。
【0072】
比較的粗い2mのグリッドピッチrは上に示した特徴の他に、有利なレーダビーム5によって簡単に実現できるという利点を有する。しかし本発明はこの粗いグリッドピッチに限定されることはなく、個別の場合の状況にしたがって目下どれが有利であるかに応じて、より小さなまたは大きなグリッドピッチを使用することができる。例えば2mよりも小さな詳細な識別が重要である場合には、より小さなグリッドピッチを使用することができる。
【0073】
衛星2または航空機2のどちらから領域10の画像をレーダビーム5によって記録したかにかかわらず、領域10のこのような画像をこのように記録した後に、領域10の別の画像を少なくとも1つ記録し、かつ同様に領域10に存在する所定の少なくとも1種類の車両4を少なくとも1つの密度について評価し、このように記録した少なくとも2つの画像を比較することは有利である。有利には領域10の少なくとも2つの画像からなる列を、時間的に連続する個別の瞬時記録によって作成する。
【0074】
図6に示した、交通状況を検出する装置では、画像記録装置20が設けられており、この画像記録装置は距離aで地表1の上方にある物体2に取り付けられている。この画像記録装置20は、領域10の画像3を記録するために使用される。ここでこの領域は、物体2の下方において地表1および/または地表1の上方にあり、少なくとも1キロメートルの横方向の直径を有する。
【0075】
画像は十分に小さなグリッドピッチrで記録されるため、領域10に存在する所定の少なくとも1種類の車両、例えば図2および3の乗用車4、またはバスないしは貨物自動車4′を、グリッドピッチrによって決まる最大密度まで識別可能である。
【0076】
さらに記録した画像3を、少なくとも1種類の車両の少なくとも1つの密度について評価する評価装置21が設けられている。この評価装置は物体2に設けることができる。
【0077】
グリッドピッチrはすでに述べたように十分に小さくして、領域10の画像で少なくとも1種類の車両、例えば車両4または4′の少なくとも1つの密度と、この種類の車両4に対する、領域10の少なくとも1つの交通路110,121,122との間の位置的な対応付けが識別されるようにしなければならない。2mのグリッドピッチrはこのために十分である。
【0078】
評価装置21は、例えばこれが、記録した画像3の所定の情報内容を、符号化されたデータ信号22に変換するように構成される。
【0079】
画像記録装置20および評価装置21は、地形測量に対して、交通状況の検出とは別の目的のために開発されたレーダによって実現可能であり、ここでこのレーダはフルにジオコーディングされた(vollgeokodierten)同期的なアパーチャを有する干渉式のレーダである。このようなレーダはドイツ連邦共和国ケルンのMST Aerospace社のTRANSカタログから公知である。このカタログは、本発明に示唆ないしはヒントを与えるものではない。完成した発明の視点から振り返って考察すると、このシステムは、地球衛星を経由しているか航空機を経由しているかにかかわらず、例えば道路交通の状態を広範囲に検出するために殊に有利である。
【0080】
評価装置21によって形成された符号化されたデータ信号22は、処理装置30に伝送され、この処理装置はデータ信号22を例えば計算機による支援によって処理し、領域10における交通状況についての情報を得る。処理装置30は有利には地表1の地上局に収容される。符号化されたデータ信号22の伝送は有利には電磁波の形態で物体2から自由空間を通して地上局に伝送される。
【0081】
処理装置30においてデータ信号22から得られた、領域10における交通状況に付いての情報は、種々の伝送経路または情報チャネルを介して、このような情報を利用する1つまたは複数の利用装置に供給される。利用装置は例えば、交通関与者にラジオを介して領域10の交通状況を伝えることができる放送送信機40、前後比較によって例えば、領域10の交通の展開について予想を立てる装置50、および多数の別の装置とすることができる。例えば装置50はその予想を交通案内センタ60に伝え、これらのセンタが予を用いて道路の交通流を、例えば、交通関与者に目標速度を示す変更可能な表示装置70を介して制御することがきる。
【0082】
相異なる物体2、例えば衛星および航空機から記録した同一領域10の複数の画像3を評価および/または相互に比較することもできる。これは例えばこれらの画像が相互に異なるグリッドピッチを有する場合であっても可能である。
【図面の簡単な説明】
【図1】地表における領域の少なくとも1つの画像を記録する、地表から距離をおいて存在する物体の透視図である。
【図2】地球を周回する人口衛星から写真によって記録した地表における領域の画像の部分図である。
【図3】地球を周回する人口衛星からレーダビームによって記録した地表における領域の画像の部分図である。
【図4】飛行中の航空機から写真によって記録した地表における領域の画像の部分図である。
【図5】飛行中の航空機からレーダビームによって記録した地表における領域の画像の部分図である。
【図6】交通状況を検出する装置の実施例を示す図である。[0001]
The present invention relates to a method for detecting a traffic situation of a vehicle and an apparatus for detecting such a traffic situation.
[0002]
The widest possible range of computers for the effective use of the traffic guidance system, for the advantageous adjustment of the switching phase of the light signaling system, and for the determination of traffic road work adaptation to traffic. Simulations and traffic flow predictions assisted by are needed. However, in order to adapt the program used for this to the actual situation, extensive knowledge of the actual traffic situation in the area to be considered is required. It is not sufficient here to detect individual traffic routes for traffic flow, especially in dense areas, and it is necessary to have as complete a traffic picture as possible, including alternative routes, avoidance zones and the like.
[0003]
The detection of actual traffic conditions, which is important for optimizing traffic flow, has hitherto been performed via measuring devices in the infrastructure, for example via roadway measuring loops in road traffic, or traffic requiring a lot of manpower. It is done by quantity counting. However, these measures are very localized and an overall outlook is not possible. Furthermore, these measures have very little predictive power, depending on whether the measuring point was selected correctly or incorrectly. In addition, infrastructure measurement devices are fixed in location and are associated with significant costs both during installation and maintenance. For these reasons, such measurement techniques are usually limited to a few places.
[0004]
It is an object of the present invention to provide a method for detecting the traffic situation of a vehicle over a wide range.
[0005]
This problem is solved by a method according to
[0006]
In this solution, an image of an area at a distance above the surface of the earth and from the ground below the object and / or of a region above the surface of the earth and having a lateral diameter of at least one kilometer is obtained by radar. The beam is recorded at a sufficiently small grid pitch so that the density of the predetermined at least one type of vehicle present in the area is identified to a predetermined maximum density, and the recorded image is converted to at least one type of the image. Assess at least one density of the vehicle and cannot distinguish plural From the vehicle R Included in connected columns Vehicle density The lower limit is set using the grid pitch (r).
[0007]
An earth satellite orbiting the earth is preferably used as the object (claim 2). The advantage of such a satellite being that the distance from the earth's surface is of the order of 100 km, it is possible, for example, to monitor particularly large areas with an area of, for example, 50 × 100 km, areas having a diameter of at least 10 km (claim 3). Having.
[0008]
Thus, vehicles of all categories and / or types can advantageously be monitored quickly and reliably over a wide range which has heretofore been unknown and impossible. Such vehicles include land vehicles that are not track-bound, such as passenger cars and / or lorries of any type, vehicles that are track-bound, such as railway trains of any kind for passenger or freight transport, marine and inland waterways. Water vehicles, such as all types of passenger and / or cargo ships, and airborne vehicles, such as all types of passenger and cargo aircraft. It is particularly advantageous that the vehicles can be monitored in different categories and / or types, for example simultaneously, without taking into account the category and / or type of the vehicles.
[0009]
A single satellite orbiting the earth creates individual images of the same area every two to four days and a time series of images.
[0010]
It is also possible to use a geostationary earth satellite as the object (claim 4). This geosynchronous earth satellite advantageously allows constant monitoring of traffic in an area of approximately the entire hemisphere, for example, marine traffic in the Atlantic or Pacific Ocean.
[0011]
From an earth satellite, it is possible to optically create an image of a vast area with sufficiently high resolution. However, this recording method depends on day / night distinction and weather. In contrast, if a radar beam is used to record the image, the image can advantageously be recorded day or night, whatever the weather. However, there is a need for a radar beam and a radar system that enables images with a sufficiently small grid pitch corresponding to a sufficiently high resolution. As a lower limit of the grid pitch, at least for road traffic, a scale of 2 m is considered to distinguish lane positions. In this case, the vehicle density on the road can be uniquely identified and assigned. This is because the vehicle has a different reflectivity than the road and therefore has a corresponding brightness difference in the recorded image.
[0012]
In the method of the present invention, an object in the form of an air vehicle can be used instead of an object in the form of a satellite (claim 5). Here, airplanes are mainly used as air vehicles, but also balloons and the like, for example. For example, an image of a region having a width of 5 to 7 km can be realized from such an aircraft, and at least the region has a diameter on the order of 1 km (claim 6).
[0013]
In this case, too, it is recommended that the images be recorded not by optical recording but by radar, preferably by SAR, in order to be independent of day and night and of the weather. Here, at least for road traffic, 2 m is used as the lower limit of the grid pitch.
[0014]
Therefore, in any case, it is advantageous to record the image with a radar beam (claim 7).
[0015]
If the images are recorded using interferometry (claim 8) and / or the Doppler effect (claim 9), advantageously the speed of the vehicle as well as the vehicle density can be detected.
[0016]
The method according to the invention is particularly advantageous for the global detection of road traffic conditions in large cities, for monitoring and guidance of road traffic, but also for small cities and / or rural areas. However, the invention is not limited thereto, and as described above, it can be basically used for monitoring the movement of railway trains, ships and / or aircraft, for example, in the area of ports and the area of airports.
[0017]
An advantage of the method according to the invention is that it is suitable for using means of georefenrenzierung. By this means a quick and precise correspondence is possible between the points of the area and the corresponding points of the image recorded from this area. In an advantageous embodiment of the method according to the invention, a positional association between the vehicle density identified in the image of the area and the traffic path of the area is created by georeferencing (claim 10). By singing, for example, in an image recorded from an artificial earth satellite, it is possible to positionally associate the vehicle density with each traffic route.
[0018]
The monitoring of changes in traffic conditions is preferably such that after recording an image of the area, at least one further image of the same area is recorded and the density of vehicles present in this area is also evaluated and recorded at least. This is performed by comparing two images with each other (claim 11). Advantageously, a direct optimization of the control algorithm of the traffic guidance system and of the traffic light phase, for example for road traffic, is thereby advantageously realized by comparing before and after this optimizing means. Further advantageously, it is possible to check the changes obtained by road works and to precisely adjust existing simulation programs.
[0019]
It is particularly advantageous if at least one sequence of two images (3) of the area (10) is created by successive individual instantaneous recordings within one hour in time (claim 12). ). Such a sequence of images can advantageously be used in real time for detecting traffic conditions and their changes over time, or at a later time. This can be used, for example, for road traffic to create the current traffic situation for direct control of traffic information and traffic guidance systems and to adjust traffic flow simulations, where additional Direct optimization of the traffic guidance system and the control algorithm of the traffic light phase is realized by comparison before and after. Evaluation of the records is performed manually or by machine using short-term and relatively few personnel. This is done when a system is provided that detects the density of the vehicles in the image and correlates this vehicle density with each traffic path in position.
[0020]
The actual evaluation of the recording can already take place on the object, for example in a satellite or in an air vehicle. An advantageous device for detecting traffic conditions which is suitable for this purpose has the features described in claim 13, wherein this object located at a distance above the earth's surface is, for example, an earth orbiting earth. A satellite, geostationary satellite or airborne vehicle.
[0021]
In an advantageous embodiment of the device according to the invention, the evaluation device converts the predetermined information content of the recorded image into an encoded data signal.
[0022]
The evaluation device preferably generates coded data signals that have been georeferenced (claim 15), and by means of these data signals the relationship between the map and the traffic path to be investigated, and thus the vehicle density and the vehicle density, is advantageously determined. A positional association with a traffic route is created.
[0023]
From the encoded data signal, information about the traffic situation in the relevant area is obtained, which is advantageously performed by a processing device which processes the signal to obtain information about the traffic situation in the area. 16). The processing device is advantageously mounted, for example, on the ground.
[0024]
The information of the area obtained about the traffic situation is supplied to a further user interface, where the supply is preferably carried out in the form of data relevant only to this user and in a user device provided for this use. (Claim 17). Separate utilization devices can be used for the various types of utilization for a single traffic situation, which are advantageously fixed, for example, on the ground.
[0025]
Hereinafter, the present invention will be described in detail with reference to the drawings based on embodiments. here,
FIG. 1 shows a perspective view of an object present at a distance from the ground, from which at least one image of an area on the ground is recorded;
FIG. 2 shows a partial view of an image of an area on the earth's surface, photographed from an artificial satellite orbiting the earth,
FIG. 3 shows a partial view of an image of an area on the earth's surface, recorded by a radar beam from a satellite orbiting the earth,
FIG. 4 shows a partial view of an image of an area on the ground surface, which was photographically recorded from a flying aircraft;
FIG. 5 shows a partial view of an image of an area on the ground, recorded by a radar beam from a flying aircraft;
FIG. 6 shows an embodiment of a device for detecting a traffic situation.
[0026]
These figures are schematic and not to scale.
[0027]
In FIG. 1, an object 2 is located above the
[0028]
It is assumed here that the object 2 is an artificial satellite, which orbits the earth at a distance of the order of 100 km, customary for such satellites.
[0029]
From this satellite 2, for example, an image of a stripe-shaped
[0030]
This image can be recorded by the beam 5, where the beam guarantees that the grid pitch in the image is small enough that the density of at least one given vehicle present in the
[0031]
FIG. 2 shows a
[0032]
In the
[0033]
For example, it is assumed that the
[0034]
The
[0035]
The
[0036]
Vehicles on
[0037]
If the vehicle is traveling on the right side, for example, the traveling
[0038]
The density of vehicles in the traveling lane is determined by the distance d between vehicles connected in the traveling direction (or in the opposite direction to the traveling direction). The greater the distance d between successive vehicles, the lower the density of the vehicles.
[0039]
In the example of FIG. 2, a lorry or bus 4 'and a densely Drive in a rear-end collision The maximum density of vehicles occurs in a
[0040]
The absolute maximum vehicle density in the driving lane is obtained when the vehicle continues without a gap, that is, when d is equal to zero. In road traffic, the absolute maximum vehicle density does not occur except in special cases. This is because the vehicle driver always keeps the minimum distance d at 0 or more.
[0041]
The grid pitch r generally determines the maximum vehicle density, above which the vehicle densities determined by the interval 0 ≦ d ≦ r are not distinguishable from one another and therefore cannot be detected. That is because these vehicles are no longer distinguishable. On the other hand, vehicles with a distance d> r can be distinguished, and the densities of these vehicles can be distinguished from one another and thus distinguished. These vehicle densities are determined by the interval d to be an integer multiple of the grid pitch r.
[0042]
If a maximum density d = r of the vehicle occurs, the lower limit is included in a series of connected vehicles consisting of indistinguishable vehicles by the grid pitch r. Multiple vehicles Can be obtained for
[0043]
For example, FIG. 2 assumes that the photographic recording optics used have sufficient resolution, so that the grid pitch r is about 0.1 m, and thus the vehicle maximum density determined in advance, Absolute maximum density has substantially the same meaning. This is because 0.1 m is negligibly small with respect to the size of the vehicle.
[0044]
It is assumed for FIG. 3 that the
[0045]
3 shows only the
[0046]
It is further assumed here that the
[0047]
The image recorded by the radar beam 5 of FIG. 3, and thus the partial view 11 ', has a grid pitch> 0.5 m, which is different in size from the photographic partial view 11' of FIG. Has a high geometric resolution. This grid pitch r is shown in FIG.
[0048]
Due to this relatively coarse grid pitch r, in the partial view 11 'of FIG. 3, unlike the partial view 11' of FIG. 2, the boundaries of the
[0049]
In any case, each vehicle on the
[0050]
In the image recorded by the radar beam 5, and thus in the partial view 11 ', objects and intervals smaller than the grid pitch r cannot be sensed.
[0051]
In the method described here, a grid pitch substantially equal to 2 meters is advantageously sufficient.
[0052]
With this grid pitch r = 2 m, the
[0053]
On the other hand, at the grid pitch r = 2 m, traffic congestion or road congestion is almost impossible because the vehicles in the
[0054]
In FIGS. 2 and 3 it has been assumed somewhat unrealistic in the examples that the distance d0 between the four
[0055]
The difference between the lengths of the passenger cars is clearly less than 2 m, and any spacing d of more than 2 m is identified as such in the manner described here. The difference in length between trucks and buses of the same weight class is clearly less than 2 m, but the difference between the lengths of these trucks, buses and passenger cars and the length of passenger cars is often more than 2 m. is there. In this case, in the method described here, lorries and buses of the same weight class are so identified and distinguished from passenger cars if the traffic is flowing and the distance d is greater than 2 m. it can. Thus, the category and / or type of vehicle can be distinguished and its density can also be determined individually by radar beams forming a grid pitch r of 2 m.
[0056]
The assumption for FIGS. 4 and 5 is that the object 2 of FIG. 1 is an aircraft flying at a distance of 8 to 10 km from the
[0057]
FIG. 4 shows a
[0058]
Here, for example, the
[0059]
At the
[0060]
The
[0061]
The
[0062]
According to this, on the
[0063]
The assumption for FIG. 5 is that the
[0064]
Similar to the partial view 11 'of FIG. 4, the partial view 11' of FIG. 5 shows only the
[0065]
The
[0066]
It is assumed here that the
[0067]
Due to this relatively coarse grid pitch r, the boundary of
[0068]
Also in this case, the
[0069]
It is assumed that, in each of the
[0070]
[0071]
Furthermore, at this grid pitch r = 2 m, it is advantageously possible to identify, for example, the parking conditions of roads and parking lots in cities. That is, it is possible to identify whether the road and the parking lot are occupied by parked vehicles.
[0072]
The relatively coarse grid pitch r of 2 m has, in addition to the features described above, the advantage that it can be easily realized with the advantageous radar beam 5. However, the invention is not limited to this coarse grid pitch, but it is possible to use smaller or larger grid pitches, depending on which is currently advantageous according to the particular case. If detailed identification, for example smaller than 2 m, is important, a smaller grid pitch can be used.
[0073]
Regardless of whether the image of the
[0074]
In the device for detecting a traffic condition shown in FIG. 6, an
[0075]
Since the images are recorded at a grid pitch r which is sufficiently small, at least one type of vehicle present in the
[0076]
Further, an
[0077]
The grid pitch r is sufficiently small, as already mentioned, that in the image of the
[0078]
The
[0079]
The
[0080]
The encoded data signal 22 formed by the
[0081]
The information about the traffic situation in the
[0082]
It is also possible to evaluate and / or compare a plurality of
[Brief description of the drawings]
FIG. 1 is a perspective view of an object at a distance from the ground, recording at least one image of an area on the ground.
FIG. 2 is a partial view of an image of an area on the surface of the earth recorded photographically from an artificial satellite orbiting the earth.
FIG. 3 is a partial view of an image of an area on the surface of the earth recorded by a radar beam from an artificial satellite orbiting the earth.
FIG. 4 is a partial view of an image of an area on the surface of the earth recorded photographically from an aircraft in flight.
FIG. 5 is a partial view of an image of an area on the ground surface recorded by a radar beam from a flying aircraft.
FIG. 6 is a diagram showing an embodiment of an apparatus for detecting a traffic situation.
Claims (17)
当該記録した画像(3)を、少なくとも1種類の車両(4,4′)の少なくとも1つの密度(d)について評価し、
区別できない複数の車両からなりつながって見える列に含まれる車両の密度に対する下限値を、前記グリッドピッチ(r)を用いて設定することを特徴とする、
車両の交通状況を検出する方法。From an object (2) present at a distance (a) above the ground surface (1), from the object surface (1) below the object (2) and / or above the earth surface (1) and at least 1 An image (3) of a region (10) having a lateral diameter of kilometers is recorded with a sufficiently small grid pitch (r) by means of a radar beam, whereby at least one of the at least one type present in the region (10) is present. The density (d) of the vehicle (4, 4 ') to a predetermined maximum density (d = r),
Evaluating the recorded image (3) for at least one density (d) of at least one vehicle (4, 4 ');
The lower limit against the density of vehicles included a plurality of vehicles can not be distinguished Do Ri led look column, and setting using the grid pitch (r),
A method to detect the traffic situation of a vehicle.
請求項1に記載の方法。Using an earth satellite orbiting the earth as said object (2) ;
The method of claim 1.
請求項1または2に記載の方法。Recording an image (3) of an area (10) having a diameter (b, l) on the order of at least 10 kilometers ;
The method according to claim 1.
請求項1から3までのいずれか1項に記載の方法。Using a stationary earth satellite as said object (2) ;
A method according to any one of claims 1 to 3.
請求項1から4までのいずれか1項に記載の方法。Using an air vehicle as said object (2) ;
A method according to any one of claims 1 to 4.
請求項5に記載の方法。Record an image (3) of an area (10) having a diameter (b, l) on the order of one kilometer ;
The method of claim 5.
請求項1から6までのいずれか1項に記載の方法。Recording said image (3) with a radar beam (5) ;
The method according to any one of claims 1 to 6.
請求項1から7までのいずれか1項、例えば請求項7に記載の方法。Recording the image (3) by applying an interferometry ;
A method according to any one of claims 1 to 7, for example a method according to claim 7.
請求項1から8までのいずれか1項、例えば請求項7に記載の方法。Recording the image (3) by applying the Doppler effect ;
A method according to any one of claims 1 to 8, for example, according to claim 7.
請求項1から9までのいずれか1項に記載の方法。Created by associating the density (d) of the vehicles (4, 4 ') identified by the image (3) in the area (10) with the traffic routes (110, 121, 122) in the area (10) by georeferencing. to,
A method according to any one of the preceding claims.
記録した少なくとも2つの当該画像(3)を相互に比較する、
請求項1から10までのいずれか1項に記載の方法。After recording the image (3) of the area (10), at least one other image of the area (10) is recorded, and the predetermined at least one vehicle (4, 4) existing in the area (10) is similarly recorded. ') For at least one density;
Comparing at least the two recorded images (3) with one another ,
The method according to any one of the preceding claims.
請求項11に記載の方法。Creating at least one column of two images (3) of the area (10) by means of individual instantaneous recordings that are continuous within one hour in time ;
The method according to claim 11.
該画像記録装置は、所定の間隔(a)で地表(1)の上方に存在する物体(2)に取り付けられており、
前記画像装置は、領域(10)の画像(3)を記録するために使用され、ここで当該領域は、物体(2)の下方にて地表(1)および/または地表(1)の上方に存在しかつ少なくとも1キロメートルの横方向の直径を有しており、前記記録はレーダビームを用いて十分に小さなグリッドピッチ(r)で行われ、これによって領域(10)に存在する所定の少なくとも1種類の車両(4,4′)を所定の最大密度(d=r)まで識別することができ、
記録した画像(3)を、少なくとも1種類の車両(4,4′)の少なくと1つの密度について評価し、
区別できない複数の車両からなりつながって見える列に含まれる車両の密度に対する下限値が前記グリッドピッチ(r)を用いて設定される評価装置(21)を有していることを特徴とする、
交通状況を検出する装置。An image recording device (20);
The image recording device is attached to an object (2) existing above the ground surface (1) at a predetermined interval (a),
Said imaging device is used for recording an image (3) of an area (10), wherein said area is below the object (2) and above the ground (1) and / or above the ground (1). Being present and having a lateral diameter of at least one kilometer, said recording is performed with a sufficiently small grid pitch (r) using a radar beam, whereby a predetermined at least one Vehicle types (4, 4 ') can be identified up to a predetermined maximum density (d = r),
The recorded image (3) is evaluated for at least one density of at least one vehicle (4, 4 '),
Characterized in that it has an evaluation device which lower limit against the density of the vehicle contained in the columns that appear connected Do Ri from a plurality of vehicles can not be distinguished is set with the grid pitch (r) (21) ,
A device that detects traffic conditions.
請求項13に記載の装置。The evaluation device (2 1 ) converts predetermined information content of the recorded image (3) into an encoded data signal (22) .
An apparatus according to claim 13.
請求項14に記載の装置。The evaluation device (2 1) forms a geo-referencing coded data signals (22),
An apparatus according to claim 14.
請求項15に記載の装置。A processing unit (30) is provided for processing said data signal (22) to obtain information about traffic conditions in the area (10) ;
The device according to claim 15.
請求項16に記載の装置。A use device (40, 50) that uses information obtained on the traffic situation in the area (10) is provided ;
An apparatus according to claim 16.
Applications Claiming Priority (3)
| Application Number | Priority Date | Filing Date | Title |
|---|---|---|---|
| DE19832311 | 1998-07-17 | ||
| DE19832311.5 | 1998-07-17 | ||
| PCT/DE1999/002214 WO2000004524A2 (en) | 1998-07-17 | 1999-07-16 | Method for detecting a vehicle traffic status and system for detecting said traffic status |
Publications (2)
| Publication Number | Publication Date |
|---|---|
| JP2002520754A JP2002520754A (en) | 2002-07-09 |
| JP3589983B2 true JP3589983B2 (en) | 2004-11-17 |
Family
ID=7874495
Family Applications (1)
| Application Number | Title | Priority Date | Filing Date |
|---|---|---|---|
| JP2000560565A Expired - Fee Related JP3589983B2 (en) | 1998-07-17 | 1999-07-16 | Method for detecting traffic condition of vehicle and device for detecting traffic condition |
Country Status (10)
| Country | Link |
|---|---|
| US (1) | US6489920B1 (en) |
| EP (1) | EP1099203B1 (en) |
| JP (1) | JP3589983B2 (en) |
| AT (1) | ATE250262T1 (en) |
| AU (1) | AU6078099A (en) |
| DE (2) | DE59907035D1 (en) |
| DK (1) | DK1099203T3 (en) |
| ES (1) | ES2209510T3 (en) |
| PT (1) | PT1099203E (en) |
| WO (1) | WO2000004524A2 (en) |
Families Citing this family (21)
| Publication number | Priority date | Publication date | Assignee | Title |
|---|---|---|---|---|
| US6356841B1 (en) | 1999-12-29 | 2002-03-12 | Bellsouth Intellectual Property Corporation | G.P.S. management system |
| US7167187B2 (en) * | 2000-03-29 | 2007-01-23 | Sourceprose Corporation | System and method for georeferencing digital raster maps using a georeferencing function |
| US7148898B1 (en) | 2000-03-29 | 2006-12-12 | Sourceprose Corporation | System and method for synchronizing raster and vector map images |
| US7038681B2 (en) | 2000-03-29 | 2006-05-02 | Sourceprose Corporation | System and method for georeferencing maps |
| US7444284B1 (en) * | 2001-01-24 | 2008-10-28 | Bevocal, Inc. | System, method and computer program product for large-scale street name speech recognition |
| JP3487346B2 (en) * | 2001-03-30 | 2004-01-19 | 独立行政法人通信総合研究所 | Road traffic monitoring system |
| US7298866B2 (en) * | 2001-10-15 | 2007-11-20 | Lockheed Martin Corporation | Two dimensional autonomous isotropic detection technique |
| US7046827B2 (en) * | 2002-02-15 | 2006-05-16 | International Business Machines Corporation | Adapting point geometry for storing address density |
| US7409286B2 (en) * | 2002-06-24 | 2008-08-05 | Jorge Osvaldo Ambort | Application for diminishing or avoiding the unwanted effects of traffic congestion |
| US6798357B1 (en) | 2002-09-19 | 2004-09-28 | Navteq North America, Llc. | Method and system for collecting traffic information |
| DE60219176D1 (en) * | 2002-10-30 | 2007-05-10 | Monnier Bernard | Device for monitoring the speed of vehicles |
| US7583818B2 (en) | 2003-05-20 | 2009-09-01 | Navteq North America, Llc | Method and system for collecting traffic information using thermal sensing |
| US10438483B2 (en) * | 2008-10-27 | 2019-10-08 | James Jacob Free | Mobile “fast lane on warning” (FLOW) output readout and mobile-sequencer features for green light scheduling |
| JP2010230373A (en) * | 2009-03-26 | 2010-10-14 | Mitsubishi Space Software Kk | Device, method and program for calculating vehicle speed |
| US8576069B2 (en) * | 2009-10-22 | 2013-11-05 | Siemens Corporation | Mobile sensing for road safety, traffic management, and road maintenance |
| CN103198666B (en) * | 2013-03-19 | 2015-03-04 | 东南大学 | Highway traffic stream space average speed observation method based on fixed wing model airplane |
| US9978270B2 (en) | 2014-07-28 | 2018-05-22 | Econolite Group, Inc. | Self-configuring traffic signal controller |
| KR102652023B1 (en) * | 2016-10-28 | 2024-03-26 | 삼성에스디에스 주식회사 | Method and apparatus for real time traffic information provision |
| CN110874926A (en) * | 2018-08-31 | 2020-03-10 | 百度在线网络技术(北京)有限公司 | Intelligent road side unit |
| CN110874927A (en) * | 2018-08-31 | 2020-03-10 | 百度在线网络技术(北京)有限公司 | Intelligent road side unit |
| US11948454B2 (en) | 2020-10-30 | 2024-04-02 | Honda Research Institute Europe Gmbh | Method and system for enhancing traffic estimation using top view sensor data |
Family Cites Families (9)
| Publication number | Priority date | Publication date | Assignee | Title |
|---|---|---|---|---|
| US3239653A (en) * | 1960-09-08 | 1966-03-08 | Lab For Electronics Inc | Traffic density computer |
| US3626413A (en) * | 1970-02-02 | 1971-12-07 | Howard C Zachmann | Traffic surveillance and control system |
| US5559516A (en) | 1981-11-27 | 1996-09-24 | Northrop Grumman Corporation | Dual cancellation interferometric AMTI radar |
| US5818383A (en) * | 1981-11-27 | 1998-10-06 | Northrop Grumman Corporation | Interferometric moving vehicle imaging apparatus and method |
| US5235506A (en) * | 1991-08-30 | 1993-08-10 | The United States Of America As Represented By The Secretary Of The Navy | Process which aids to the laying out of locations of a limited number of 100, personnel and equipments in functional organization |
| FR2695742B1 (en) * | 1992-09-15 | 1994-10-21 | Thomson Csf | System for calculating at least one vehicle traffic control parameter. |
| FR2728094A1 (en) | 1994-12-07 | 1996-06-14 | Dassault Electronique | DEVICE FOR DETECTION AND LOCATION OF OBJECTS ON THE GROUND |
| US5663720A (en) * | 1995-06-02 | 1997-09-02 | Weissman; Isaac | Method and system for regional traffic monitoring |
| DE19746570A1 (en) | 1997-10-22 | 1999-05-06 | Daimler Chrysler Ag | Method and device for large-area traffic situation monitoring |
-
1999
- 1999-07-16 DE DE59907035T patent/DE59907035D1/en not_active Expired - Fee Related
- 1999-07-16 US US09/744,008 patent/US6489920B1/en not_active Expired - Fee Related
- 1999-07-16 AT AT99947231T patent/ATE250262T1/en not_active IP Right Cessation
- 1999-07-16 JP JP2000560565A patent/JP3589983B2/en not_active Expired - Fee Related
- 1999-07-16 ES ES99947231T patent/ES2209510T3/en not_active Expired - Lifetime
- 1999-07-16 AU AU60780/99A patent/AU6078099A/en not_active Abandoned
- 1999-07-16 DE DE19981341T patent/DE19981341D2/en not_active Ceased
- 1999-07-16 WO PCT/DE1999/002214 patent/WO2000004524A2/en active IP Right Grant
- 1999-07-16 DK DK99947231T patent/DK1099203T3/en active
- 1999-07-16 EP EP99947231A patent/EP1099203B1/en not_active Expired - Lifetime
- 1999-07-16 PT PT99947231T patent/PT1099203E/en unknown
Also Published As
| Publication number | Publication date |
|---|---|
| WO2000004524A3 (en) | 2000-04-20 |
| AU6078099A (en) | 2000-02-07 |
| EP1099203A2 (en) | 2001-05-16 |
| JP2002520754A (en) | 2002-07-09 |
| DK1099203T3 (en) | 2003-12-22 |
| ATE250262T1 (en) | 2003-10-15 |
| ES2209510T3 (en) | 2004-06-16 |
| EP1099203B1 (en) | 2003-09-17 |
| WO2000004524A2 (en) | 2000-01-27 |
| PT1099203E (en) | 2004-02-27 |
| DE19981341D2 (en) | 2001-08-09 |
| DE59907035D1 (en) | 2003-10-23 |
| US6489920B1 (en) | 2002-12-03 |
Similar Documents
| Publication | Publication Date | Title |
|---|---|---|
| JP3589983B2 (en) | Method for detecting traffic condition of vehicle and device for detecting traffic condition | |
| US11410332B2 (en) | Map system, method and non-transitory computer-readable storage medium for autonomously navigating vehicle | |
| US11840254B2 (en) | Vehicle control device, method and non-transitory computer-readable storage medium for automonously driving vehicle | |
| US11821750B2 (en) | Map generation system, server, vehicle-side device, method, and non-transitory computer-readable storage medium for autonomously driving vehicle | |
| JP7251394B2 (en) | VEHICLE-SIDE DEVICE, METHOD AND STORAGE MEDIUM | |
| JP7156206B2 (en) | Map system, vehicle side device, and program | |
| US20210005085A1 (en) | Localized artificial intelligence for intelligent road infrastructure | |
| JP7147712B2 (en) | VEHICLE-SIDE DEVICE, METHOD AND STORAGE MEDIUM | |
| Al-Sobky et al. | Traffic density determination and its applications using smartphone | |
| CN108961767B (en) | Highway inspection chases fee alarm system based on four-dimensional outdoor traffic simulation | |
| CN106340197A (en) | Auxiliary cooperative vehicle infrastructure driving system and method | |
| DE10149206A1 (en) | Method and device for mapping a road and accident prevention system | |
| US11914041B2 (en) | Detection device and detection system | |
| US20230204386A1 (en) | Map server and map distribution method | |
| CN111383456B (en) | Localized artificial intelligence system for intelligent road infrastructure system | |
| US20210208282A1 (en) | Detection device and detection system | |
| US6285949B1 (en) | Method and device for extensive traffic situation monitoring | |
| CN107044856B (en) | Centimeter-level online positioning device for expressway running vehicle | |
| CN113470389B (en) | Intelligent traffic control method | |
| JP2023531806A (en) | Systems and methods for interactive vehicle transportation networks | |
| Cherrett et al. | Traffic management parameters from single inductive loop detectors | |
| McCasland | Comparison of two techniques of aerial photography for application in freeway traffic operations studies | |
| RU2779971C1 (en) | Method for automatic determination in the video surveillance field of statistical characteristics of dispersion of trajectories of characteristic points of vehicles | |
| JP7315988B1 (en) | Moving body travel control system | |
| US20220406178A1 (en) | Connected reference marker system |
Legal Events
| Date | Code | Title | Description |
|---|---|---|---|
| A131 | Notification of reasons for refusal |
Free format text: JAPANESE INTERMEDIATE CODE: A131 Effective date: 20040116 |
|
| A521 | Request for written amendment filed |
Free format text: JAPANESE INTERMEDIATE CODE: A523 Effective date: 20040413 |
|
| TRDD | Decision of grant or rejection written | ||
| A01 | Written decision to grant a patent or to grant a registration (utility model) |
Free format text: JAPANESE INTERMEDIATE CODE: A01 Effective date: 20040721 |
|
| A61 | First payment of annual fees (during grant procedure) |
Free format text: JAPANESE INTERMEDIATE CODE: A61 Effective date: 20040818 |
|
| R150 | Certificate of patent or registration of utility model |
Free format text: JAPANESE INTERMEDIATE CODE: R150 |
|
| LAPS | Cancellation because of no payment of annual fees |