JP3556076B2 - Image position error measuring device - Google Patents
Image position error measuring device Download PDFInfo
- Publication number
- JP3556076B2 JP3556076B2 JP18541497A JP18541497A JP3556076B2 JP 3556076 B2 JP3556076 B2 JP 3556076B2 JP 18541497 A JP18541497 A JP 18541497A JP 18541497 A JP18541497 A JP 18541497A JP 3556076 B2 JP3556076 B2 JP 3556076B2
- Authority
- JP
- Japan
- Prior art keywords
- window
- line
- scanning direction
- center
- gravity
- Prior art date
- Legal status (The legal status is an assumption and is not a legal conclusion. Google has not performed a legal analysis and makes no representation as to the accuracy of the status listed.)
- Expired - Fee Related
Links
Images


Description
【0001】
【発明の属する技術分野】
この発明は、読取装置で読み取ったビットマップ形式の画像データの位置誤差を測定する装置に関する。
【0002】
【従来の技術】
この種の画像読取装置として例えば日本機械学会第71期通常総会講演会講演論文集(IV)で発表された「高精細画像入力装置の開発」(従来例1)が知られている。ここでは、副走査方向に並べて配置された等ピッチラインのテストチャートを読み取った画像、すなわち、副走査方向のライン間隔で離散化された画像データに対して補間演算を行い、演算された結果から、等ピッチラインの黒線、白線の中心位置を求め、テストチャートの基準ピッチとの差を読み取ることで、装置の振動などに起因する画像データの読み取り位置誤差を検出するようになっている。
【0003】
他の従来例として特開平6−297758号公報「走査線ピッチ計測方法」(従来例2)がある。この公知例は、等ピッチパターンのデータを書き込んだハードコピーのパターンを読み取ってハードコピー装置の書き込みの走査線のピッチムラを計測するようになっている。
【0004】
光学的リニアスケールとして、例えばオーム社から出版された「サーボセンサの基礎と応用」(大島康次郎、秋山勇治共著)〔昭和63年2月20日発行〕(従来例3)が知られている。この刊行物に記載された技術を図32ないし図34を参照して説明する。
【0005】
こではリニアスケールの一例としてポジションスケールを例に挙げている。例に挙げられたリニアスケールは、図32に示すように全く等しいピッチの明暗の格子をもった2枚1組のメインスケール81とインデックススケール82とからなるガラススケール83と、そのスケール83を照明するLEDからなる光源84と、スケール83を透過した光を検知するフォトダイオード85から構成される。通常はインデックスケール82が固定され、メインスケール81が移動するが、その移動に連れてフォトダイオード85の出力が変化する。
【0006】
図33(a)に示すように2枚のガラスの透過部が一致したとき、出力は最大となり、透過部とクロム蒸着された不透明部86が重なったときには、出力は理想状態では0となる。したがって、その出力波形は理想的には図33(b)に示したような光量変化となるが、実際には明暗の格子ピッチが8μmと小さいため、光の回折の影響やクロム烝着面での反射の影響があり、図33(c)に示すような出力波形のように近似正弦波の形で出力される。この出力波形の山の間隔がスケールのピッチに相当するので、山の数を数えることにより移動量を知ることができる。これがポジションスケールの基本原理であるが、実際には図32のフォトダイオードA,B,/A,/B(なお、「/」は反転を示す。)の4個を用いて各種の処理が行われている。
【0007】
A,B,/A,/Bのおのおのに対応するインデックススケール82の格子は、0°、90°、180°、270°の位相関係になっている。これをAと/A、Bと/Bを組み合わせて差動方式で検出し、スケール82の汚れや光量変化に対して強くなるように設定し、信頼性を高めている。このようにして得られた信号をおのおの改めてA、Bとし、さらに電気的に反転された信号をそれぞれ/A、/Bとする。そして、これらの信号を用いてさらに細かい寸法まで読み取るための処理が実行されている。
【0008】
スケール83の移動方向は図34に示すようにA信号とB信号のどちらの信号の位相が進んでいるかを知ることで判定できる。スケール83のピッチよりも細かく読む手法としては、A信号だけ用いると基準レベルを下からよぎるときと上からよぎるときの両方をとらえて4μm単位で読める。さらにB信号を用いると2μmまで読める。これ以上細かく読むためには、AとBの信号を用いて45°位相差の信号、Bと/Aの信号から135°位相差の信号を作る必要がある。
【0009】
ところで、上記従来例1では、等ピッチラインのパターンのエッジと読み取りのサンプリングのタイミングとの位置関係との相違により同じ形状のパターンを読み取って得られるデータがそれぞれ異なってしまうモアレという現象がある。読み取ったデータはこのモアレによって必ずしもパターンのエッジの位置と対応しないので、位置誤差の測定精度を劣化させる。モアレの影響は、等ピッチラインパターンを精細にして読み取り装置の分解能に近づけると非常に顕著になり、条件によっては位置誤差の測定ができなくなるほどになる。したがってこの方式では、読み取り装置の分解能に近い、あるいはそれ以下の位置誤差を高精度で測定することはできない。
【0010】
また、等ピッチラインのパターンを使うので、モアレの影響を無視しても、高い周波数成分の位置誤差を測定するためにパターンのピッチを精細にすると、結像光学系のMTF(Modulation Transfer Ratio)の限界によって得られた画像の濃淡の信号の差が小さくなり、測定精度が劣化せざるを得ない。
【0011】
さらに、パターンの精細化では、測定の周波数帯域を高い方向に広げ、精度を上げることができないのでサンプリングしたデータを補間する処理を行っている。より良い補間を行うには、より多くの周辺データを使ったり、複雑な演算処理が必要になり、処理時間が長くなる。さらに補間はあくまでも補間であり、真のデータとのずれが生じることは避けられず、測定精度を劣化させる要因になる。また、光電変換装置の中の特定の1つの受光素子が副走査方向に走査することによって得られる画像データを使用しているので、受光素子そのものが持つノイズが測定そのものの精度に影響を与えて、精度を劣化させる。
【0012】
従来例2では、計測時には光電変換装置でパターンを読み込んだデータを使うので、計測に当たってはハードコピーの読み取り時の走査ムラはないという条件で読み取ってハードコピーのピッチムラを計測している。その他、特に説明しないが、前述の従来例1と同様のモアレの問題を有する。
【0013】
従来例3では、上述のようなリニアスケールにおいては、光源(LED)84の発する光をコリメートレンズ87で平行光線にしてメインスケール81とインデックススケール82の重なりを通過してくる光を受光素子で検出するようにしているので、微細かつ高精度のメインスケール、インデックススケール、および精密なコリメートが必要になる。その結果、当然コストも高くなってしまう。
【0014】
そこで、本出願人は、特願平7−256481号や特願平7−311015号において、これらの問題点を解決するための発明をすでに提案している。
【0015】
【発明が解決しようとする課題】
しかし、これらの先願に係る発明では、読み取り装置が等倍で読み取った場合を対象としており、変倍の場合についてまで配慮されてはいなかった。
【0016】
ここで、変倍時の現象について考える。通常、読み取り装置の変倍は、副走査方向はキャリッジの走査速度を変化させて変倍の画像を生成するのに対して、主走査方向の変倍は画像処理によって行っている。したがって、主走査方向の変倍処理の後段に位置誤差測定装置を置いた場合に、斜線パターンの読み取り画像の角度は、斜線パターンが45度の場合には主走査方向変倍後の画像も45度となるが、主走査方向変倍後の画像は、変倍の値に応じて斜線の主走査方向の線幅が変化する。すなわち、倍率が大きければ線幅も大きくなり、倍率が小さければ線幅も小さくなる。そのため、ウインドウの大きさを変倍率に応じて変化させる必要もでてくる。このようにウインドウの大きさを変倍率に応じて変化させると重心の測定時間が異なってきてしまい、位置誤差の測定に誤差が生じる場合も起こり得る。
【0017】
本発明は、このような点に鑑みてなされたもので、その目的は、倍率が変化しても正確に位置誤差を測定することができる画素の位置誤差測定装置を提供することにある。
【0019】
【課題を解決するための手段】
前記第1の目的は、有効画像領域外に設置され、主走査方向に対して一定の傾きの複数の線から構成された斜線パターンと、該斜線パターンを有効画像領域内に載置された原稿とともに読み取る主走査方向に延伸した読み取り手段と、原稿の変倍率を設定する設定手段と、副走査方向の原稿走査速度を前記変倍率に応じて変更する副走査手段と、前記読み取り手段によって得られた前記斜線パターンの画像データにウインドウを設定してウインドウ内の画像データの重心を計算する計算手段と、該計算手段によって得られた重心の値によりウインドウの移動を制御する制御手段と、前記重心の値と前記変倍率とに基づき、各ラインの画像の位置誤差のデータを得る演算手段とを備えた画像の位置誤差測定装置によって達成される。
【0022】
【発明の実施の形態】
以下、図面を参照し、本発明の実施の形態について説明する。なお、以下の説明において、同等と見なせる各部に同一の参照符号を付し重複する説明は適宜省略する。
【0023】
1.第1の実施形態
1.1.測定原理
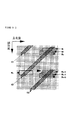
図1は、本出願の測定原理を典型的な場合を前提にして説明するための図である。図の主走査と書いた矢印101は線順次で画像を読み取る装置が同時に読み取る1ラインの画像の画素の並びと、この並列のデータを直線のデータに変換したときの時間軸上の順序を示す。図の副走査と書いた矢印102は主走査の1列が読み取る範囲を順次移動させながら読み取って行く方向を示している。移動する手段としては、原稿の画像を光電変換素子に投影するミラー、照明ランプなどを機械的に移動させるもの、原稿を移動させるもの、光電変換素子とその結像光学系を一体にして移動させるものなどがある。ここではこの主走査方向と副走査方向に平行な線で囲まれたそれぞれの4角形を画素ということにする。画素によって構成される平面は、原稿の画像を電気信号に変換されたデータが原稿の画像の写像がそのまま並んでいるというイメージでとらえることができ、ビットマップということもある。読み取り装置からリアルタイムで出力されるときには、主走査、副走査の方向が時間的な順序を示すが、出力されたデータをメモリに取り込んだ状態では、それぞれの画素を任意にアクセスすることも可能であり、主走査、副走査、時間の順序にとらわれない扱いも可能になる。
【0024】
図1は主走査と副走査の画素サイズが等しい場合で、副走査方向の走査速度が変動するときと、一定速度で45°の斜線を読み取るときに光電変換装置に投影されるが、像を全く劣化のないかたちでビットマップに対応させて示したものである。すなわち、aは副走査方向の読み取りのタイミングを制御するクロックに対応する所定の一定速度で走査したときで、ビットマップにも45°の像ができる。bは速度が変動するときの像で、速度に応じて傾きが異なってくる。
【0025】
つまり、A−Bは副走査方向の走査速度が0のときで、副走査方向の読み取りのタイミングを制御するクロックにより副走査方向のビットマップのアドレスが進んでも原稿を読み取っている位置が変わらないため、副走査方向に平行な線になってしまう。
【0026】
B−Cは副走査方向の走査速度が所定の速度の1/2のときで、ビットマップのアドレスが進んでも、その半分しか進まない位置の画像を読んでいることになり、画像の副走査方向の線との角度はtanθ=0.5から、約26.57°である。
【0027】
C−Dは所定の速度で走査しているときで、傾きは45°である。同様にD−以降は走査速度が1.5倍の場合で、その角度は約56.31°である。つまり、走査速度によって像の傾きが異なること、言い換えれば斜線の主走査方向への移動量が、副走査方向の移動速度に対応することを測定原理として副走査方向の移動速度のムラ、ミラー、レンズ、光電変換装置の振動などに起因するビットマップ画像の画素の位置誤差を計測する。
【0028】
以上、正方形の画素を持ち、45°の線を使用した場合で説明したが、画素が正方形でなく、例えば、主走査の分解能400dpi、副走査の分解能600dpiといった読み取り装置の画像データに適用することもでき、45°以外の斜線を用いても同様に、斜線の画像の主走査方向への移動量が副走査方向の読み取り方向の速度に依存するという関係は成立するので、画素の位置誤差を計測することができる。
【0029】
1.2.システム構成
図2は、本実施形態に係る位置誤差測定装置のシステム構成の一例を示すブロック図で、画像読取装置への付加機能として組み込み、リアルタイムでその位置誤差を測定するものである。このシステムは光電変換部1、A/D変換部2、シェーディング補正部3、斜線判別部4、位置誤差測定部5、制御部6、画像処理部7および操作部8から基本的に構成されている。
【0030】
光電変換装置1は、例えばラインCCDで、画像が電気信号に変換される。電気信号に変換された画像はA/D変換部(器)2でデジタルの多値の画像データに変換される。変換されたデータは、照明の不均一さ、レンズの周辺光量の低下、光電変換装置の画素間の感度の違いなどをシェーディング補正部3によってシェーディング補正される。シェーディング補正された画像データは、斜線判別部4に入力され、画像データの斜線パターン部分を判別し、その判別結果を制御部6に出力する。また、画像データは位置誤差測定部5に入力され、測定結果の誤差信号のデータ10を出力する。同時に画像データをビデオ信号11として画像処理部7に出力する。画像処理部7では、主走査方向変倍、MTF補正、γ補正などが行われる。それぞれの機能ブロックは、制御部6によってタイミングの制御、動作条件の設定などがなされ、相互に関連して動作する。また、操作部8からは制御部6に対してオペレータから変倍率の設定を含む種々の操作入力が行われる。なお、制御部6にはビデオ制御信号12が入出力される。
【0031】
光電変換装置として等倍センサを用いている読取装置ではレンズの特性による周辺光量の低下という問題がないので、シェーディング補正を省く場合があるが、そのような形式の読取装置にも、本願を適用することができる。
【0032】
1.3.位置誤差測定処理
図3は図1と同様のビットマップに斜線の画像データK1 ,K2 ,K3 があるときの位置誤差の測定を行うときの処理を説明するためのものである。W1 は画像データK2 の位置を求めるための演算を行う10×3のウインドウである。ウインドウ内のデータの位置を求めるため、主走査方向における重心を演算する。この演算では、順次ウインドウの位置をW2,W3 ・・・と移動させながら重心を求める。重心の主走査方向の位置は45°の線の場合、画素の位置がなんらかの誤差要因で移動することがなければ、ウインドウを図のように移動させた場合、主走査方向に1画素分ずつ移動するはずである。画素の移動量が1画素分と異なる場合は、何らかの原因で画素の位置が変動したことになり、位置誤差を求めることができる。位置誤差の主要な要因が副走査方向の走査速度のムラによることが分かっている場合には、位置誤差のデータか速度ムラにデータを変換することは容易である。
【0033】
重心を求めるのに周辺の画素のデータを含む多数の画素データを使っているので、CCD固有のノイズを始めとしてさまざまなノイズが画像データに含まれるが、重心を求める過程でノイズの影響が軽減され、S/Nの高い測定が可能になっている。通常、ウインドウの画素の数が多いほどS/Nは高くなる。
【0034】
ウインドウの形状は主走査方向の重心を求めることから、主走査側に大きいことが望ましい。副走査方向は1としても測定可能である。こうすることによって測定に要する時間を短くすることができる。同様にW2 、W3 とウインドウを移動させる。そして、あらかじめ同一ラインの測定回数をn回と設定しておき、i=nとなったとき、すなわち、ウインドウWn に達したとき、その次のウインドウとして画像データK3 のウインドウWn+1 に移動させる。その方法としては、斜線の主走査方向の間隔に相当する画素分より正数画素少ない値mだけ主走査方向にウインドウの座標をシフトした後、カウンタ値iをクリアして斜線判別部4の処理に戻る。ここで、Wn+1 の重心の値mom2とWn の重心の値mom1との差、
mom2−mom1
が重心のズレmomとなる。以下、同様にWn+1 、Wn+2 、Wn+3 ・・・と移動させて位置誤差を測定する。
【0035】
このように複数の斜線を使って位置誤差を測定するようにすれば、読取装置の読取範囲が縦長であっても、副走査の全域にわたっての測定の可能になる。さらに主走査方向の狭い幅の中だけで測定を行うようにすれば、主走査方向における中央部とか、手前とか、奥側とかに分けて位置を誤差を測定することも可能になる。
【0036】
1.4.斜線パターン判別処理
次に、斜線パターン判別処理について説明する。図4は図1と同様にビットマップに斜線が有る場合を示し、図5はその場合の8ビット(0〜255)の読み取り値を示している。なお、0=白、255=黒であり、主走査方向の座標をXn、副走査方向の座標をYmとしている。また、図6は主走査方向3画素×副走査方向3画素の斜線パターン検知用ウインドウを示し、図6(a)〜(e)はそれぞれ主走査方向に1画素ずつシフトしたウインドウを示している。
【0037】
ここで、図6(a)に示すウインドウ(X2〜X4、Y1〜3)内の中心画素を挟む対角方向、すなわち中心画素を含む左上斜め方向の3つの画素値の和Paと右下斜め方向の3つの画素値の和Qaを計算すると、

【0038】
同様に、図6(b)〜(e)について求めると、
【0039】
次に、中心画素と右下斜め方向の3画素(中心画素を含む)の差Rを求めると、
Ra=15−5=10
Rb=222−7=215
Rc=667−9=658
Rd=750−33=717
Re=751−454=297
となる。
【0040】
この差Rの値が大きい場合に3×3画素のウインドウ内に斜線パターンが有ることを示す。したがって、例えばRの値が500以上の場合に斜線パターンが有ると判断すれば図6(c),(d)に示すウインドウ内に斜線パターンが有ると判断することができる。
【0041】
次に、図7を参照して他の斜線パターン判別処理を説明する。図7(a)〜(e)はそれぞれ図6(a)〜(e)に示すウインドウ内の各値を閾値=128で2値化した場合を示し、同様に各ウインドウ内の中心画素の左上斜め方向の3つの画素値の和Pa〜Peと右下斜め方向の3つの画素値の和Qa〜Qeを計算すると、
【0042】
次に、中心画素と右下斜め方向の3画素(中心画素を含む)の差Ra〜Reを求めると、
Ra=0−0=0
Rb=1−0=1
Rc=3−0=3
Rd=3−0=3
Re=3−2=1
となる。
【0043】
したがって、この場合にも同様にこの差Rの値が大きい場合に3×3画素のウインドウ内に斜線パターンが有ることを示し、例えばRa〜Reの値が2以上の場合に斜線パターンが有ると判断すれば図7(c),(d)に示すウインドウ内に斜線パターンが有ると判断することができる。また、このように画素値を2値化することにより、加算演算を簡単にすることができる。
【0044】
図8(a)〜(d)は斜線パターン検出用のマッチングパターンを示し、図中の白領域は「0」、黒領域は「1」を表している。先ず、画像データを図7に示すように2値化し、その2値化データと図8(a)〜(d)に示すマッチングパターンを比較し、合致した場合に斜線パターンがあると判断する。この例では、図7(c)と図8(b)、及び図7(d)と図8(a)が合致しており、このウインドウ内に斜線パターンがあると判断される。
【0045】
なお、上記実施例では、ウインドウの大きさを3×3としたが、もちろんウインドウサイズが異なる場合にも同様な判断方法により斜線パターンを検知することができる。但し、一般にウインドウサイズが大きい程、判別制度は上がるが、その分処理時間が長くなり、また回路規模も大きくなる。
【0046】
1.5.ウインドウのデータと重心の計算
1.5.1 重心の測定処理
次に、重心の測定処理を説明する。図9に示す処理は原稿の走査開始と同時にスタートし、先ず、主走査方向、副走査方向の各座標値X、Yがイニシャライズ(X=0,Y=0)される〔ステップ901〕。この座標値X、Yは斜線判別用の例えば3×3のウインドウ内のある画素位置例えば中心画素の座標となる。次に、1本の斜線に対する測定回数を示す変数iがイニシャライズ(i=0)される〔ステップ902〕。
【0047】
次に斜線判別部4により斜線判別用の3×3のウインドウ内に斜線パターンが存在するか否かが判断され〔ステップ903〕、存在しなければ、その3×3のウインドウを主走査方向に1画素分シフト(X=X+1)する〔ステップ904〕。なお、このシフト量はウインドウの大きさ、斜線の太さに応じて決められ、1画素以上でもよい。ステップ903において斜線パターンが存在する場合には、重心測定用の例えば10×3のウインドウW1 を設定し、そのウインドウW1 内の重心を求める〔ステップ905〕。このとき、ウインドウW1 の大きさ、斜線の太さに応じて、斜線と判別された画素の位置から主走査方向に整数画素分だけシフトし、斜線の部分がウインドウW1 の中心付近になるようにウインドウW1 を設定してもよい。
【0048】
重心の測定を終了すると、重心のズレを計算し〔ステップ906〕、次いで主走査方向に−1画素分、副走査方向に+1画素分シフトしたウインドウW2 を設定し、また、測定回数用のカウント値iを1つインクリメントする〔ステップ907〕。なお、この実施例では、ウインドウWを1画素ずつ移動させているが、画素の位置誤差を起こす原因となる振動などの周波数帯域が低い場合には、2画素以上ずつ移動させてもよく、この方法により測定に要する時間を短縮することができる。
【0049】
次いで、予め設定された同一ラインの測定回数nに対してi=nとならない場合にはステップ908からステップ905に戻り、他方、i=nとなった場合すなわちウインドウWn に達した場合には次の斜線のウインドウWn+1 に移動させる〔ステップ908→909〕。その方法としては、斜線の主走査方向の間隔に相当する画素分より整数画素mだけ、ウインドウ座標を主走査方向にシフトした後、測定カウント値iをクリアし〔ステップ902〕、斜線判別処理〔ステップ903〕に戻る。以下同様に、1本の斜線に対してウインドウWn+1 、Wn+2 、Wn+3 〜のように移動させて位置誤差を測定する。
【0050】
このように複数の斜線を用いて位置誤差を測定することにより、読み取り装置の読み取り範囲が縦長であっても、副走査領域の全域に渡って位置誤差を測定することができる。更に、主走査方向の狭い幅だけ測定するので、主走査方向の中央部、手前、奥側のように分けて測定することもできる。また、高い分解能で位置誤差を測定する場合にも、斜線のパターンを細くする必要は全くなく、システムのMTFの制約を受けずに幅が広いパターンを用いることができる。
【0051】
更に、幅が広いパターンを用いた場合、幅に応じてウインドウも大きくなるので結果として測定精度を向上させることができる。したがって、斜線の幅は処理速度、リアルタイム処理を行う場合にはバッファのサイズ、回路規模の経済性などとのバランスを考慮して設定すればよい。また、幅が広いパターンを用いてその片側のエッジを検出することにより位置誤差を測定することができる。更に、例えば副走査方向の読み取りタイミングに関係なく白黒パターンを副走査方向に配列するとモアレの発生が問題となるが、本実施例では副走査方向の読み取りタイミングと斜線の関係は常に同じであるのでモアレの発生が問題とならず、その結果、高精度で位置誤差を測定することができる。
【0052】
1.5.2 ウインドウのデータと重心の計算
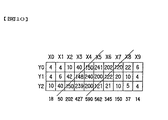
次に、ウインドウのデータと重心の計算について詳細に説明する。図10はウインドウデータと斜線パターンの各画素の読み取り値の関係を示し、読み取り値は8ビットであって10進(0〜255)で示されている。主走査方向の重心を求めるには、副走査方向の各列(3ライン分)の和を求め、図に示すようにこれを左側からX0、X1、・・・X9とするとそれぞれ18、50、202、427、590、562、345、150、37、14を求める。そして、各画素の主走査方向の中心座標を左から順に0〜9とし、主走査方向の重心位置をRmとすると、重心位置Rmの回りのモーメントは0になるので、
Z0(Rm−0)+Z1(Rm−1)・・・Z9(Rm−9)=0
が成り立ち、数値を代入して計算するとRm=4.362が得られる。
【0053】
重心を求める理由は、補間などの前処理を必要とせず、演算を簡素化、高速化することができるからである。また、画像位置を求める場合、各列毎のデータの和の並びから補間により所定の分解能のデータ列を得て、そのデータからピーク値が存在する位置を求める方法を用いることができる。
【0054】
1.5.3 複数本の斜線からなるチャートの重心の計算
次に、複数本の斜線からなるチャートの重心を計算する場合について説明する。図3に示すように複数本から成る斜線の重心を計算する場合、同一線上の線では問題とならないが、違う線にウインドウが移動したときには移動前と移動後では斜線の主走査方向の間隔が丁度、整数画素数でない限り重心の値が異なるので、補正しなければならない。一例として図3に示す斜線K2 のウインドウWn の重心の値Rn が4.65となり、次の斜線K3 に移動した場合のウインドウWn+1 の重心の値Rn+1 が4.38、ウインドウWn+2 の重心の値Rn+2 が4.40、ウインドウWn+3 の重心の値Rn+3 が4.41となった場合、ウインドウが移動したラインにおける重心の差ΔRを計算する。すなわち、
ΔR=Rn −Rn+1 =4.65−4.38=0.27
となる。
【0055】
この値ΔRを斜線K3 の重心の値に加算し、この加算結果を重心の値として位置誤差を求める。この場合、ウインドウWn+2 の重心の値Rn+2 、ウインドウWn+3 の重心の値Rn+3 は、
Rn+2 =Rn+2 +ΔR=4.40+0.27=4.67
Rn+3 =Rn+3 +ΔR=4.41+0.27=4.68
となる。したがって、このように複数本の斜線から成るチャートを使用しても、連続して高精度で位置誤差を測定することができる。但し、斜線K2 のウインドウWn から斜線K3 のウインドウWn+1 に移動する場合、斜線K2 、K3 は主走査方向に同時に存在しなければならない。
【0056】
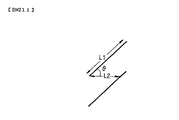
図11は斜線の配置関係を示し、長さL1 の複数の斜線が主走査方向に対して角度θで配置され、主走査方向の斜線の始点と終点の位置が同一の場合、主走査方向の斜線間隔をL2 とすると、
L2 <L1 ×cos θ ・・・(1)
の関係が成り立つように斜線を配置すれば、斜線は主走査方向には重なるので、ウインドウを主走査方向に移動して次の斜線の重心を連続して測定することができる。ここで、斜線の長さL1 と斜線の始点、終点の主走査方向の位置は式(1)の大小関係が大きいほど精度を必要としなくなる。
【0057】
1.6.位置誤差の測定手順
図12は位置誤差を測定するときの処理手順を示すフローチャートである。走査開始と同時に処理はスタートする。まず、ステップ1201でイニシャライズ処理が行われ、主走査方向、副走査方向の座標値x,yの初期座標値がセットされる(X=X START,Y=Y START)。この座標値は、ウインドウのある個所、例えば中心画素の座標となる。次に、斜線1ラインの測定回数のカウント値を格納する変数rと読み取り画像全体の測定回数をカウントする変数iがイニシャライズされる(i,r=0)。さらに、ウインドウ内の重心値から各ラインの重心値を求める際に使用するシフト量を示す変数sがクリアされる(s=0)。
【0058】
ステップ1202では、斜線判別部4によってウインドウ内に斜線パターンがあるかどうかを判別する。もし、ウインドウ内に斜線パターンがなければステップ1211で斜線判別用のウインドウを主走査方向に1画素シフトする。このとき、シフトする量はウインドウの大きさ、斜線の線の太さに応じて決められ、1画素以上でもよい。斜線判別用ウインドウ内に斜線パターンがあれば、ステップ1203で重心測定用のウインドウを設定し、ステップ1204でその設定された重心測定用のウインドウ内の重心値posを求める。このとき、斜線がウインドウの中央にあるかどうかを確認するため、ステップ1205で重心の値と図13〜図15に示すウインドウの幅(X W)の1/2とを比較する。その差が0に近いほど斜線パターンがウインドウの中央付近にあることを示す。その差が+1以上のときは、ステップ1212,1213でウインドウの座標を+1移動し、シフト量カウント変数sに1加算する。その差が−1以下のときはステップ1212,1214でウインドウの座標を主走査方向に−1画素移動し、シフト量カウント変数sから1減算する。
【0059】
以上の手順を繰り返して、上記差が1以下になったとき、次の手順〔ステップ1206〕に進む。なお、この実施形態ではカウント値の差を「1」としているが、これに限定されるものではなく、ウインドウの大きさによって適宜設定される。
【0060】
ステップ1206でiラインの重心Pが計算される。ここで、momは図3のように複数の斜線パターンを使用する場合の斜線間の重心のズレを補正する計数である。iラインの重心Pの値は、重心の値から重心のズレ補正値momを減算し、シフト量sを加算して算出する。したがって、iライン目の重心Pとは、ラインLに対する重心を表している。
【0061】
ステップ1207ではiライン目の位置誤差Miを演算する。このMiはiラインの重心Piと(i−1)ラインの重心Pi−1の差分に変倍率を掛けたものと副走査方向に移動量1を(i−1)ラインの位置誤差に加算して求める。ステップ1208では副走査方向+1画素シフトしたウインドウを設定する。また、測定回数のカウント値i、rをインクリメントし、シフト量sにtを加算する。このtの値は、変倍率に応じて変わり、
t=100/変倍率(%) ・・・(2)
となる。すなわち、等倍(100%)時はt=1、変倍率200%時はt=0.5、変倍率50%時はt=2となる。このtは変倍率の逆数であり、これは、直線Lの傾きを意味し、yが副走査方向に1移動したときにxがどのくらい移動するかを示している。そこで、tの値と倍率の関係が上記のようになる。
【0062】
このステップ1207におけるMは実際に読み取られた位置を示す。図16(a)は、倍率100%で読んだときのビットマップパターンにおいて速度変動がないときには斜線はS3(点線)のようになる状態を示している。この間に速度が倍に変動すると、45度の斜線S3は斜線S4で示されるように読まれる。このとき、点T5に着目すると、この点T5は本来T7の位置で読むべき画像である。したがって、本来の読取位置は点T0からL6の距離で点T5を読み取っていることなる。一方、ステップ1207において、Pi−1−Piは点T5の位置で斜線S3からの主走査方向の距離L4を示す。(Pi−1−Pi)×変倍率は、斜線S3において主走査方向の距離を副走査方向の距離に換算する部分で、倍率100%のときは1対1のため、L4はL5の距離となり、L5+1はL6(=2)となる。さらに、ステップ1207においては、基準点(読取開始位置)からの距離を示しており、この場合には、点T0の基準点からの距離を示している。したがって、Mi−1を加算することによって点T8の基準点からの距離が求められる。
【0063】
図16(b)は、倍率100%で読んだときのビットマップパターンにおいて速度が1/2に変動したときを示しており、斜線S2で示されるように45度の斜線は読まれる。このとき点T1に着目すると、この点T1は本来T2の位置で読むべき画像であり、本来の読取位置は点T0からL3の距離で点T1を読み取っていることになる。そのため、ステップ1207におけるPi−1−Piは、点T1の位置で斜線S1からの主走査方向の距離L1を示す。また、変倍率100%であるため、L1=L2となり、L3は1−L2(=0.5)と求められる。
【0064】
図16(c)は、倍率200%で読んだときのビットマップパターンにおいて速度変動がないときは斜線S5(点線)のようになる状態を示している。この間に速度が倍に変動すると、斜線T6で示されるように45度の斜線として読まれる。このとき点T9に着目すると、この点T9は、本来T11の位置で読むべき画像である。したがって、本来の読取位置は、点T0からL9の距離で点T11を読み取っていることになる。ステップ1207において、Pi−1−Pは点T9の位置で斜線S5からの主走査方向の距離L7を示す。(Pi−1−Pi)×変倍率は、斜線S5において主走査方向の距離を副走査方向の距離に換算する部分で、倍率200%のときは1対2のため、L7は2倍のL8の距離に換算され、L8+1がL9(=2)となる。このようにして、主走査方向の重心Pの移動が読取位置に換算される。
【0065】
なお、この実施形態では、ウインドウを副走査方向に1画素ずつ移動させているが、画素の位置誤差を起こす原因となる振動などの周波数帯域が低い場合には、ウインドウを2画素以上ずつ移動させてもよい。そして、ステップ1209では、次の斜線に移るかどうか判断し、ステップ1210で最終ラインまで測定したかどうか判断する。もし、最終ラインまで測定していなければ、ステップ1204あるいはステップ1202に戻って、以降の処理を繰り返す。
【0066】
1.7.主走査方向の斜線の画像の移動量を副走査方向の画素の位置誤差の関係
この実施形態では、副走査方向の画素の位置誤差を測定するために、斜線を読み取った画像の主走査方向へ画像の位置の移動を見ている。正方形の画素で45度の斜線を使って測定する場合には、これまでの説明で明らかなように主走査方向の移動量のウインドウ間における偏差がそのまま副走査方向の位置誤差になる。画素が正方形でない場合、斜線の角度が45度でない場合には、換算をして副走査方向の位置誤差を得る必要がある。その方向について図13、図14、図15を参照して説明する。
【0067】
図13は等倍(100%)時の、図14は変倍率200%時の、図15は変倍率50%時の斜線のビットマップパターンをそれぞれ示す。なお、これらの図は中央付近で速度変動が発生した場合を示し、図13および図15は速度が遅くなった場合、図14は速度が速くなった場合の例である。
【0068】
まず、図13におけるnラインの制御について説明する。
ウインドウの重心pos=2、重心のズレの補正量mom=0、シフト量s=1とすると、nラインの重心の値は、
3(=2+0+1)
となる〔ステップ1206〕。次に位置誤差の演算において、n−1ラインの重心をPn−1 =3、位置誤差をMn−1 =5とすると、nラインの重心は
Mn =(3−3)×1+5+1=6
となる。
【0069】
次いでステップ1208では、シフト量sにt加算される。ここで、(2)式により、等倍のため
t=1
となる。したがって、
s=2
となる。また、yを1加算する。すなわち、ウインドウのy方向に1ライン移動してステップ1204にもどり、ウインドウの重心posを求める。ステップ1205では、ウインドウ内の中心に斜線画像があるかどうかを判断する。ここで、pos=1であったとすると、
|1−6/2|=2
となり、ステップ1214に進む。次いで、ウインドウをx方向に−1移動し、sを1減算してs=1としてステップ1204に戻り、重心を求めると、
Pn+1 =2−0+1=3
となる。次に、誤差位置は、
Mn+1 =(3−3)×1+6+1=7
となる。そして、ステップ108でs=2となり、ウインドウをy方向に1移動する。ステップ1204では、ウインドウの重心posを求める。ここでpos=1.2であったとすると、
|1.2−6/2|=1.8
となり、ステップ1214に進む。ステップ1214では、ウインドウをx方向に−1移動し、sを1減算し、s=1とする。そして、ステップ1204に戻って重心を求める。
【0070】
このときの重心posが2.2になったとすると、ステップ1206でn+2ラインの重心を求めると、
Pn+2 =2.2−0+1=3.2
となる。一方、位置誤差は、
Mn+2 =(3−3.2)×1+7+1=7.8
となる。ステップ1208でs=2となり、ウインドウをy方向に1移動する。以下、同様に測定していくと、図17の図表のようになる。これらのデータから分かるように重心Pは45度の斜線Lからの距離を表すことになる。
【0071】
なお、この直線Lは、位置誤差Mがない場合にウインドウの左端が移動する軌跡を示している。すなわち、位置誤差がないときに45度の斜線を読み込んだときのビットマップ上の直線がLである。そして、ステップ1206、1208(後述のステップ1213,1214)で使用されているシフト量sは、直線Lからウインドウの左端までの距離を表している。
【0072】
一方、変倍率200%の場合には、図14に示すように、nラインのウインドウの重心pos=2.8、重心のずれの補正値mom=0,シフト量s=0とすると、nラインの重心の値は、
2.8(=2.8+0+0)
となる〔ステップ1206〕。位置補正の演算において、n−1ラインの重心をPn−1 =2.8、位置誤差をMn−1 =5とすると、nラインの重心は、
Mn =(2.8−2.8)×2+5+1=6
となる。
【0073】
ステップ1208では、シフト量に8加算される。ここでは、(2)式から変倍率200%のためt=0.5となる。したがって、s=0.5となる。また、yに1を加算する。すなわち、ウインドウのy方向に1ライン移動してステップ1204に戻ってウインドウの重心posを求める。ステップ1205でウインドウ内の中心に斜線画像があるかどうか判断する。ここでpos=2.3であったとすると、
|2.3−6/2|=0.7
となり、ステップ1206に進んでn+1ラインの重心を求める。すると、重心は、
Pn+1 =2.3−0+0.5=2.8
となり、位置誤差は、
Mn+1 =(2.8−2.8)×2+6+1=7
となる。すると、ステップ1208で
s=0.5+0.5=1
となってウインドウをy方向に1移動する。
【0074】
そして、ステップ1204でウインドウの重心posを求める。ここで、pos=1.5であったとすると、
|1.5−6/2|=1.5
となり、ステップ1214に進む。そして、ステップ1214でウインドウをx方向に−1移動し、sを1減算してs=0とする。その後、ステップ1204に戻って重心を求める。このときの重心posが2.5になったとすると、ステップ1206に進み、n+2ラインの重心を求める。重心は、
Pn+2 =2.5−0+0=2.5
となり、位置誤差は、
Mn+1 =(2.8−2.5)×2+7+1=8.6
となる。ステップ1208でs=0.5となり、ウインドウをy方向に1移動する。以下、同様に測定していくと、図18に示す図表のようになる。
【0075】
変倍率50%の場合には、図15に示すようになる。すなわち、nラインのウインドウの重心pos=2.4、重心のズレの補正量mom=0、シフト量s=0とすると、nラインの重心の値は、
2.4(=2.4+0+0)
となる〔ステップ1206〕。次に、位置誤差の演算において、n−1ラインの重心をPn−1 =2.4,位置誤差をMn−1 =5とすると、nラインの重心は、
Mn =(2.4−2.4)×5+1=6
となる。ステップ1208では、シフト量sにt加算される。ここでは、(2)式によって変倍率50%のため、t=2となる。したがって、シフト量sは、s=2となる。また、yを1加算する。つまり、ウインドウのy方向に1ライン移動してステップ1204に戻り、ウインドウの重心posを求める。
【0076】
ステップ1205では、ウインドウ内の中心に斜線画像があるかどうか判断する。ここで重心pos=0.4であったとすると、
|0.4−6/2|=2.6
となり、ステップ1214に進む。ウインドウをx方向に−1移動し、シフト量sを1減算し、s=1とする。また、ステップ1204に進み、ウインドウの重心posを求める。このときpos=1.4であったとすると、
|1.5−6/2|=1.6
となり、ステップ1214に進む。ウインドウをx方向に−1移動し、シフト量sを1減算し、s=0とする。また、ステップ1204に進み、ウインドウの重心posを求める。
【0077】
このときpos=2.4となり、ステップ1206に進む。このときウインドウの重心とウインドウの中心との差|pos−X W/2|の大きさによってステップ1213、ステップ1214のx,sに対する加減算量を制御すれば、ステップ1204,1205,1212,1213および1214のサイクルを減らすことができ、演算時間を短くすることができる。例えば、
|pos−X W/2|≧2
のとき、ステップ1213,1214のx,sに対する加減算量を2とすれば、これまでの説明のものでは、ステップ1204,1205,1212,1213および1214のサイクルが1回で済むことになる。
【0078】
次いで、n+1ラインの重心を求めると、
Pn+1 =2.4−0+0=2.4
となり、位置誤差は、
Mn+2 =(2.4−3)×0.5+7+1=7.7
となる。これによりステップ1208ではシフト量s=2となり、ウインドウをy方向に1移動する。
【0079】
そして、ステップ1204でウインドウの重心posを求める。ここで、前記と同様なサイクルを経過し、重心(pos)が3になったとすると、ステップ1206に進んで、n+2ラインの重心を求める。すると、重心は、
Pn+2 =3−0+0=3
となり、位置誤差は、
Mn+2 =(2.4−3)×0.5+7+1=7.7
となる。これにより、ステップ1208でシフト量sは、s=2となり、ウインドウをy方向に1移動する。以下、同様に測定していくと、図19に示す図表のようになる。
【0080】
このような制御によって、変倍に対応した位置誤差測定を行うことができる。
【0081】
2.第2の実施形態
引き続き、第2の実施形態について説明する。以下の各実施形態において、前述の第1の実施形態と同等と見なせる各部には同一の参照符号を付し、重複する説明は適宜省略する。
【0082】
2.1. 測定原理
図20は、第2の実施形態の測定原理を説明するためのビットマップを示す図であるが。この実施形態では、第1の実施形態と主走査方向が逆方向に設定されていることを除けば図1と同等であるので、ここでの詳細な説明は省略する。
【0083】
2.2.システム構成
図21は、第2の実施形態に係る位置誤差測定装置のシステム構成の一例を示すブロック図で、画像読取装置へ付加機能として組み込み、リアルタイムでその位置誤差を測定するものである。このシステムは光電変換部1、A/D変換部2、シェーディング補正部3、位置誤差測定部5、制御部6、画像変倍部9および操作部8から基本的に構成されている。なお、図21(a)は位置誤差測定を行った後に原稿の画像データを変倍する例で、図21(b)は斜線の画像データを変倍(等倍)し、その後、位置誤差測定を行う例である。
【0084】
図21(a)において、光電変換装置1は、例えばラインCCDで、画像が電気信号に変換される。電気信号に変換された画像はA/D変換部(器)2でデジタルの多値の画像データに変換される。変換されたデータは、照明の不均一さ、レンズの周辺光量の低下、光電変換装置の画素間の感度の違いなどをシェーディング補正部3によってシェーディング補正する。シェーディング補正部3でシェーディング補正が行われた画像データは、位置誤差測定部5で副走査方向の読取ラインごとにライン間の位置誤差が測定され、測定結果を画像変倍部9に出力する。画像変倍部9では、原稿の画像データ(ビデオ信号)とともに位置誤差信号のデータ10を受け取り、原稿の画像データを操作部8から入力された変倍率にしたがって変倍し、原稿の画像データ(ビデオ信号)11として出力する。それぞれの機能ブロックは、制御部6によってタイミングの制御、動作条件の設定などがなされ、相互に関連して動作する。符号12は制御部6に対して送受信されるビデオ制御信号である。
【0085】
一方、図21(b)においては、シェーディング補正された斜線の画像データは、まず画像変倍部9で変倍処理され、位置誤差測定部5で変倍された斜線の画像データに基づいて誤差測定処理を実行する。
【0086】
光電変換装置として等倍センサを用いている読取装置ではレンズの特性による周辺光量の低下という問題がないので、シェーディング補正を省く場合があるが、そのような形式の読取装置にも、本願を適用することができる。
【0087】
2.3. 位置誤差測定処理
図22は図20と同様のビットマップに斜線の画像データaがあるときの位置誤差の測定を行うときの処理を説明するためのものである。W1 は画像データの位置を求めるための演算を行う11×3のウインドウである。ウインドウ内のデータの位置を求めるため、主走査方向における重心を演算する。この演算では、順次ウインドウの位置をW2,W3 ・・・と移動させながら重心を求める。重心の主走査方向の位置は45°の線の場合、画素の位置がなんらかの誤差要因で移動することがなければ、ウインドウを図のように移動させた場合、主走査方向に1画素分ずつ移動するはずである。画素の移動量が1画素分と異なる場合は、何らかの原因で画素の位置が変動したことになり、位置誤差を求めることができる。位置誤差の主要な要因が副走査方向の走査速度のムラによることが分かっている場合には、位置誤差のデータか速度ムラにデータを変換することは容易である。
【0088】
重心を求めるのに周辺の画素のデータを含む多数の画素データを使っているので、CCD固有のノイズを始めとしてさまざまなノイズが画像データに含まれるが、重心を求める過程でノイズの影響が軽減され、S/Nの高い測定が可能になっている。通常、ウインドウの画素の数が多いほどS/Nは高くなる。
【0089】
ウインドウの形状は主走査方向の重心を求めることから、主走査側に大きいことが望ましい。副走査方向は1としても測定可能である。
【0090】
図23は斜線の数が複数あって複数の斜線a1 ,a2 ,a3 を使用して位置誤差を測定する場合のウインドウの移動とそれに伴う処理を説明するものである。図3の例と同様にウインドウを順次移動させ、あらかじめ設定したおいたWn に達したとき、その次のウインドウとしてWn+1 に移動させる。移動する前後の斜線のパターンa1 とa2 の間隔は測定用チャートを作成する段階で決めておき、その間隔の値を主走査方向の重心の移動を計算するときに補正し、Wn+1 、Wn+2 、Wn+3 ・・・と移動させる。パターン間の間隔を画素サイズの整数倍に設定しておくと、ウインドウをジャンプさせたときの補正が簡単であり、測定に先立って測定装置にこの補正量を入力するときにも便利である。
【0091】
この例ではウインドウを1画素ずつ移動させているが、画素の位置誤差を起こす原因となる振動などの周波数帯域が低い場合は、ウインドウを2画素以上ずつ移動させても良い。こうすることによって測定に要する時間短くすることができる。
【0092】
また、複数の斜線を使って位置誤差を測定するようにすれば、読み取り装置の読み取り範囲が縦長であっても副走査方向の全域にわたっての測定が可能になる。さらに、主走査方向の狭い幅のなかだけで測定するようにすれば、主走査方向における中央部とか、手前とか、奥側とかに分けて位置誤差を測定することも可能になる。
【0093】
これらの図からも明らかなように、高い分解能で位置誤差を測定する場合でも、それに応じて斜線のパターンを細くする必要は全くなく、システムのMTFの制約の影響を受けない幅の広いパターンを使うことができるという特徴がある。幅の広いパターンを使えば、それに応じてウインドウも大きくなり、結果として測定の精度を上げることができる。なお、処理速度、リアルタイム処理を行う場合は、バッファのサイズ、回路規模の経済性などとのバランスでパターンの幅を設定すればよい。
【0094】
なお、他の例として、幅の広い線のパターンを用い、どちらか片側のエッジのデータによっても同様に位置誤差を測定することが可能である。
【0095】
また、副走査の読み取りタイミングと斜線との関係は常に同じであるから、前述の公知例のように副走査方向に並べられた等間隔の白黒のパターンでは避けることのできないモアレの問題を回避することができ、高精度な位置誤差の測定を可能にしている。
【0096】
2.4.ウインドウのデータと重心の計算
図24はウインドウのデータと、斜線のパターンの関係を示すものである。ウインドウの各画素には斜線のパターンを読み取って得られる画像データの値が記入されている。画像データの値は8ビットのデジタルデータで、10進法で表すと0〜255の値を取ることができる。図の値は画像のデータを10進法で表記した値である。
【0097】
主走査方向の重心を計算するには、各列ごとにデータの和を求める。これを右側からh0,h1,・・・h10とすると、それぞれ14、37、150、345、562、590、427、202、50、18、13である。各画素の主走査方向の中心の座標を右から順に0〜10とし、重心の主走査方向の位置をmとすると、mの周りのモーメントは0となるので、
h0 (m−0)+h1 (m−1)+・・・+h10(m−10)=0
が成り立ち、数値を入れて計算すると、
m=4.667
が得られる。
【0098】
重心を求めるのは、補間などの前処理を必要とせず、演算の簡素化、高速化に有用である。画像の位置を求めるのは、各列ごとのデータの和の並びから、補間により所定の分解能のデータ列を得て、そのデータからピーク値の存在する位置を求める方法を使うこともできる。
【0099】
2.5.斜線の幅
重心を計算するに当たり、斜線の幅はデータをきちんと読み取れるものであれば問題ないが、画素が正方形で、斜線の角度が45°であり、画像の走査速度を所定の目標速度からのわずかなズレをより高精度で測定する場合、斜線の主走査方向の幅を画素の整数倍にしておくと、ウインドウを斜め方向に移動しても、斜線と画素の関係は斜線の両側で同じになり、画像データの誤差要因もバランスし、画像の位置を計算する精度を高めることができる。
【0100】
2.6.主走査方向の斜線の画像の移動量と副走査方向の画素の位置誤差の関係
この実施形態では、副走査方向の画素の位置誤差を測定するために、斜線を読み取った画像の主走査方向へ画像の位置の移動を見ている。正方形の画素で45°の斜線を使って測定する場合には、これまでの説明で明らかなように、主走査方向の移動量のウインドウ間における偏差がそのまま、副走査方向の位置誤差になる。画素が正方形でない場合、斜線の角度が45°でない場合には、換算をして副走査方向の位置誤差を得る必要がある。
【0101】
2.7.測定の処理手順
図25は、測定の処理手順を示すフローチャートである。この処理手順では、まず、計算するウインドウの位置を示すW.P.(ウインドウポインタ)をセットし〔ステップ2501〕、次に、W.P.で指示されるウインドウのデータを取り込み〔ステップ2502〕 、取り込んだデータの総和Vを計算する〔ステップ2503〕。そして、データの総和Vがあらかじめ設定したaとbとの間の値を持っているかどうかをチェックする〔ステップ2504〕。このチェックでaとbとの間に入っていれば、重心の計算を行い〔ステップ2505〕、さらに、重心のずれを計算した〔ステップ2506〕後、次のW.P.をセットする〔ステップ2507〕。その後、ステップ2502に戻ってデータフェッチ以降の処理を繰り返す。
【0102】
一方、ステップ2504で、データの総和Vがaとbとの間に入っていなければ、ループから抜け出し、処理を終了する。
【0103】
なお、ステップ2504で処理の総和をチェックするのは、スタートのときにW.P.を誤ってセットしたため、ウインドウ内に斜線のデータがないような場合に、正しい測定がされていないのに測定結果が出力されるのを防止するという理由からである。また、測定に使う斜線の長さを短くしておけば、斜線が途切れた位置で打ち切ることができ、必要以上の測定を無駄を省くことができる。
【0104】
2.8.装置の概略構成
図26は、この実施形態に係る画像読取装置の概略構成を説明するための断面図である。同図において、筐体28の上面に、読み取るための原稿を載せるコンタクトガラス21が設けられ、当該コンタクトガラス21は筐体28に支えられた状態になっている。コンタクトガラス21の上面に画像を下にして置かれた原稿は、照明光源22によって照明され、原稿の反射光は第1ミラー23、第2ミラー24、第3ミラー25および結像レンズ26によって光電変換装置27上の光電変換素子の受光面に投影され、原稿の画像は電気信号に変換される。電気信号に変換されたデータは所定の処理をした後、出力される。
【0105】
照明光源22と第1ミラー23は、図示しない第1キャリッジに取り付けられており、同じく図示しない駆動装置によって原稿を線順次に読み取るため、原稿面との距離を一定に保った状態で移動する。第2ミラー24と第3ミラー25は、図示しない第2キャリッジに取り付けられ、第1キャリッジの1/2の速度で第1キャリッジと同様に移動する。このような構成で原稿を走査することによってコンタクトガラス21上の所定の範囲の画像を線順次で読み取る。
【0106】
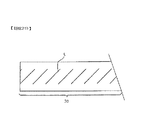
図27は、図26に示した画像読取装置の平面図で、コンタクトガラス21、筐体28、シェーディング補正の基準データを光電変換部に与えるための基準濃度板29、および読み取った画像データの画素の位置誤差を測定するために設けられた測定用パターン30の配置の状態を示していている。ここで、基準濃度板29および測定用パターン30が鎖線で示してあるのは、光電変換装置で読み取れるように読取装置の外面には出ていないことを示すためである。特に測定用パターン30は画像データとともに光電変換装置で読み込むので原稿と同様に光電変換素子の受光面に結像する必要があり、コンタクトガラス21の原稿が置かれる面に設けられている。
【0107】
図28は図27において2点鎖線の円CLで囲んだ部分の詳細を示す図である。基準濃度板29は測定用パターン30を読み取る光電変換素子の画素に対してもシェーディング補正が行えるようにするため、測定用パターン30が配置されている領域まで延ばしてある。
【0108】
図29は測定用のパターン30の一部を拡大した平面図であり、このパターン30は黒の斜線Lと背景の白で構成している。このパターン30については、1.1および2.3で説明したものである。なお、ここでは、測定用のパターン30を画像外の図27に示す位置に設置し、画像と同時に読み取って測定する。
【0109】
2.9.位置誤差に基づく読取データの配置
図30は位置誤差の補正をどのように行っているかを説明するための図である。縦軸は図21におけるシェーディング補正部3におけるシェーディング補正後の画像データの値を示し、データは8ビットのデジタル値であるから、10進法で表記すれば0〜255の値を持つ座標軸である。横軸はライン順次で読み取るラインの位置を示す。正の正数を割り当てた位置は、前述のシステムの制御部5が水晶振動子による発振周波数を分周して作ったライン読み込みのタイミング信号に対応する各ラインの位置である。水晶振動子の発振周波数の安定度は非常に高いので、整数を割り当てた位置はシステムの画像ラインの本来あるべき位置を示していることになる。この間隔はまた、本システムの読み取りの分解能、400dpiのドット間の距離にも対応する。
【0110】
装置に備えなければならないメモリの量を最小で済ますため、この例では画素の位置の補正をリアルタイムで行う。リアルタイムで行うためには処理に伴う演算を簡略化する必要があり、簡略にすれば処理系の回路規模も小さくなり、経済的な効果もあるので、処理の分解能を1/16ドットとしている。そのため、横軸の整数の間は16に分割したメモリが設けられている。
【0111】
横軸の0においては、システムの制御部5が決める位置と実際に読み取った画像の位置は一致しているものとして図示している。画素の位置誤差が生じる原因はいろいろあるが、中でも大きな原因となるのはキャリッジの速度が変動することである。図では、第1キャリッジの速度が所定の値よりも1/16、言い換えれば6%速い状態が続いた場合を示している。横軸の1の位置に本来対応する位置の画像を読み取るはずであるが、キャリッジが速いため、実際には1/16ドット分先の画像を読むことになる。この位置を細線bで示し、そのときのデータを小さな○で示している。このとき位置誤差の測定は、1ライン前の位置を基準とした次のラインの位置ずれを順次ラインごとに行うので、1/16の誤差が測定結果として画像データとともに出力され、補正部はそれを受け取る。位置誤差測定における重心の演算の精度は1/16よりも高いが、その結果を1/16の分解能になるように丸めを行っている。
【0112】
キャリッジの速度はそのまま速い状態を継続しているので、1ライン前に読み取ったデータとの関係で測定して得られる位置誤差は同じく1/16である。しかし、システムのクロックによって決まる本来画素があるべき位置2とは1ライン前のラインの位置がすでに1/16ずれていたので、さらに1/16ずれることになり、結果として2/16ずれた位置cの画像データを読んでいることになる。同様に、次の読み取りでは3/16ずれた位置dの画像データを読み取り、順次e,f,gの位置の画像を読み取って、それぞれの小さな○で示すデータが得られる。すなわちラインごとに測定する位置誤差の累積によって読み取った画像データの位置は決まり、1/16の分解能を持つ横軸に読み取ったデータが割り付けられる。なお、ここでは、原稿を走査する速度が所定の速度よりも速い場合を示してるが、遅ければ逆の方向にずれることになる。
【0113】
2.10.読み取りデータの補正
図30のa〜gに対応している小さな○で示す位置誤差を含んだ読み取りデータから本来画像があるべき位置0〜7に対応する大きな○で示すデータを補間法で求めることによってデータの補正を行う。例えば、横軸の座標2に対応するデータを求めるには、2より前のデータ2個(a,bに対応する読み取りデータ)と後のデータ2個(c,dに対応する読み取りデータ)から3次補間法(Cubic Convolution)を使っている。順次補正を行う整数の座標の前のデータ2個と後のデータ2個を使って補正データを求める。補間法はこれに限らず、このほかのさまざまの補間法を使用することもできる。また、補間に使用するデータの数も必要に応じて増減することもできる。
【0114】
このような補間法を使用することによって画素の位置誤差が効果的に補正され、良好な画像データが得られるが、補間のための演算に要する処理量が大きいと言う問題があった。副走査ラインの位置誤差を補正する処理は各ラインを構成する主走査方向に5000個も並んだそれぞれのデータについて補正演算することになるので、リアルタイム処理を行うためには、比較的規模が大きく、しかも、高速で演算ができる処理回路とバッファメモリを必要としていた。
【0115】
これに対し、この実施形態においては、副走査方向の画素の位置誤差の補正を、読み取った副走査のラインの中から、本来あるべき位置に最も近いラインのデータをそのまま本来あるべき位置のデータとして使用することによって行う。したがって、読み取ったラインから最も近いラインを選択するだけでよいので、ライン単位で処理が完了し、先願のように副走査のラインを構成する主走査の画素毎に演算する必要はなくなり、これによって補間に伴う処理は大幅に減少することになる。この処理を図30を参照して説明する。
【0116】
この処理では、0のラインのデータとしてaのラインを使用し、1のラインのデータとしてbのラインのデータを使用する。つまり、a,b,c,d,e,f・・・の読み取った副走査方向のラインの系列から本来あるべき位置に最も近い位置にあるラインのデータを選択して本来あるべき位置のデータとするものである。
【0117】
通常の読み取り装置の原稿を走査する速度の変動は、定格速度の1%内外であり、速度変動があるといっても読み取る副走査のラインの間隔はほぼ所定の分解能に近いので、一番近くにあるラインのデータをそのまま本来あるべき位置のデータとしても本来あるべき位置が、読み取ったラインのデータの丁度中央にあるという最悪条件でも画像データの位置誤差は分解能の1/2にしかならない。したがって、画素の位置誤差は1/2ドット以下の精度を持っていることを保障できる。画像読取装置の多くの用途では、この程度の位置精度を持っていれば十分である。従来のフラットベット型の画像読取装置では、原稿を走査するキャリッジの速度変動をなくすことは非常に困難であり、比較的大きな画素の位置誤差は避けられなかったが、本願では、斜線の繰り返しのパターンを読み取った画像データから画素の位置誤差を測定して画素の位置の補正を行うことによって非常に簡単な構成で画素の位置誤差の小さい画像読み取り装置を実現することができた。
【0118】
2.11.変倍読取時の動作
変倍を説明するときの準備として、まず、等倍読み取りについて説明する。この実施形態における読取装置は、ラインCCDを読取素子として、等倍のとき、A3サイズの原稿の短手を主走査方向にして400dpiの分解能で読み取る機能を有する。ラインCCDは10μm ピッチで5000個の受光素子が並んでいるものである。400dpiの分解能であるから、原稿面の1ドットに相当する長さは
25.4/400=0・0635mm
すなわち、63.5μmである。これが光学系でCCDに結像するときには、CCD1ドットの大きさ、つまり、10μm縮小されて投影される。すなわち、原稿の画像は6.35分の1に縮小されてCCDの受光面に投影されることによって当倍の画像が形成される。副走査方向はキャリッジん移動によって走査され、その走査速度は副走査のラインクロックが1クロック進む時間に63.5μm移動する速度である。この速度で原稿を走査しながらラインクロックごとにデータを読み取る。このような読み取り方法をラインクロックごとに1列ずつ実行することから線順次読み取りという。
【0119】
そこで、倍率を変えて読み取るときには、すなわち、変倍時には、光学系の倍率は等倍のときと同じまま、原稿を走査する速度を倍率に対応させて変更して読み取る。例えば、2倍で読み取るとき、副走査のラインクロックの速度はそのままにして原稿を走査するキャリッジの速度を等倍のときの1/2にして読み取る。キャリッジの速度の変更はキャリッジを駆動するモータの回転数を変更することによって行う。副走査のラインクロックごとに得られるデータを等倍のときと同じ63.5μm離れたデータとして取り扱うことによって副走査方向に2倍に拡大された画像データが得られる。しかし、このままでは、光学系の倍率は変更されていないので、主走査方向に関しては等倍のままである。主走査方向の2倍の画像を得るために、等倍で得た画像データから変倍したときに得られるはずの位置の画像データを補間法によって求める。補間法としては、前述の3次関数コンボリューションが使用される。ここでは、わかり易くするため、2倍の例で説明したが、他の倍率で読み取るときにも同様である。
【0120】
以上、変倍読み取りの概要を説明したが、以下、画素の位置誤差を得るために原稿を読み取る領域外に設けた斜線の繰り返しにより構成されたパターンの画像データと主走査方向の変倍処理を行う画像データの範囲と原点の位置関係を図31を参照して説明する。
【0121】
正方形の並びで示されている横長の矩形は、ラインセンサで読み込まれる主走査の1ラインの画像データの並びを示すとともに、ラインセンサの受光部の配置を示している。主走査と書かれた矢印は主走査の方向を示し、ラインセンサで光電変換された電気信号がCCDに内蔵されたシフトレジスタに同時に転送された後、主走査のクロックに同期して画像データが出力される順序を示している。矢印の方向は時間が経過する方向を示しており、図の右端のデータから順に出力される。図のA〜Bは読み取り装置の主走査方向の原稿の読み取り領域に対応し、図27において上方の辺がCCDに投影される位置がAであり、下辺が投影される位置がBである。
【0122】
読み取り領域の上辺に沿って配置されている斜線の繰り返しで構成された画素の位置誤差を測定するためのパターンの画像は、画像データの並びの右端からAまでの範囲に形成される。この関係を保ったままキャリッジを副走査方向に移動させることによって線順次にラインごとの読み取りを繰り返すことによって画像データを得ている。装置が原稿の読み取りを開始するときに主走査方向のA位置に画像が形成されるコンタクトガラス21の左手奥の角に原稿を突き当てて載置するように設定してあり、この角の位置を原点としている。すでに説明したように光学系の倍率は変更しないので、変倍読み取りを行うときでも、主走査方向の画像を位置は変わらない。そこで、変倍読み取りを行うときでも、斜線のパターンの画像の主走査方向の位置は変わらないが、副走査方向の移動速度が変わるため、得られる斜線の画像データの傾きは、速度によって変化する。これについては後述する。変倍で読み取りを行うときにも斜線を読み取ったデータの主走査方向における範囲は変らないので、特別の前処理を行うことなく、画素の位置誤差を求めることができる。しかし、原稿を読み取った画像の部分に対しては、主走査方向の倍率変換処理を行う必要がある。原点を原稿先端のAに対応するコンタクトガラス21の右奥としているので、読み取ったAB間のデータをA点を基準とする所定倍率の画像データに変換する。変換には前述の3次関数コンボリューション法を使用する。
【0123】
このように変倍で読み取るときにも、画素の位置誤差を求めるために斜線のデータに対しては変倍に伴う主走査方向の処理を行わず、原稿を読み取ったデータに対してだけ変倍処理を行うようにしている。こうすることによって、変倍時にも斜線を読み取ったデータの大きさや画素の位置が変らないので位置誤差を求める処理に際して重心を計算するウインドウのサイズを変更したり、主走査方向の座標を変える必要がなく、等倍時と同様に画素の位置誤差を求めることができ、これによって処理系を簡素化することができる。
【0124】
2.12.位置誤差の測定手順および主走査方向の斜線の画像の移動量と副走査方向の画素の位置誤差の関係
位置誤差の測定手順、および主走査方向の斜線の画像の移動量と副走査方向の画素の位置誤差の関係は、第1の実施形態において図12のフローチャート、図13ないし図15のビットマップとウインドウとの関係を示す説明図、さらには、図16の説明図、図17ないし図19の図表を参照したものと同様なので、ここでの説明は省略する。
【0125】
このような制御によって、この第2の実施形態では、変倍に対応した位置誤差測定を行うことができる。
【0126】
3.第3の実施形態
引き続き、第3の実施形態について説明する。この実施形態は、変倍読み取りを行うとき、光学系の結像倍率を所定の値に変更するとともに、副走査方向の走査速度も倍率に合わせて変更して読み取る形式の読み取り装置に画素の位置誤差を計測し、そのデータに基づいて画素の位置誤差を補正する機能を搭載するための改良を施したものである。
【0127】
光学系の倍率の変更は第2の実施形態の図31におけるA点を基準に、すなわち、倍率を変更しても原稿台のA点に対応する位置がCCDの受光部に投影される位置が移動しないように行う。この光学系の倍率の変更は図26に示した結像レンズ26の位置を光電変換装置27に対して移動させる駆動装置(図示せず)により行われる。副走査方向に関しては第1および第2の実施形態とまったく同一である。この実施形態では、主走査、副走査とも変倍されて読み取られるので、読み取った画像データに対して追加の処理を必要としない。しかし、読み取りの倍率を変えたときに、画素の位置誤差を求めるための斜線の繰り返しのパターンを読み取った画像も読み取り倍率に対応して光学系の倍率を変更しているので、主走査方向の倍率が変ってしまう。この倍率が変ってしまった斜線を読み取った画像データを等倍のときと同様に処理できるようにするため、等倍のデータに変換する。
【0128】
等倍に変換する際、光学的にはAを基準として倍率が変っているので同じA点を基準に等倍に変換する。この変換は、第1の実施形態で等倍のまま読み取って変倍のデータを得ているのと倍率を変換するという観点に立てば、全く同じである。A点を基準に等倍にするので、等倍に戻した斜線の画像の位置と等倍で斜線を読み取ったときの画像の位置は同じになる。したがって、等倍のときと全く同じようにして画素の位置誤差を測定することができる。このように変倍のとき、斜線のデータを等倍に変換することによって、読み取り倍率に応じてウインドウのサイズや位置を変える必要がなくなり、画素の位置誤差の測定にかかわる回路を簡素化することができる。もちろん原稿を読み取った画像は光学的に変倍されているので、変倍に伴う画像処理の必要がないことはいうまでもない。
【0129】
なお、特に説明しない各部は第2の実施形態と同等に構成され、同様に動作するので、重複する説明は省略する。
【0130】
このように処理することによって、第2の実施形態の変倍方式をとっても、第3の実施形態の変倍方式をとっても、同じ画素の位置誤差を測定する処理系を使用することができる。
【0131】
【発明の効果】
これまでの説明で明らかなように、本発明によれば、有効画像領域外に設置され、主走査方向に対して一定の傾きの複数の線から構成された斜線パターンと、該斜線パターンを有効画像領域内に載置された原稿とともに読み取る主走査方向に延伸した読み取り手段と、原稿の変倍率を設定する設定手段と、副走査方向の原稿走査速度を前記変倍率に応じて変更する副走査手段と、前記読み取り手段によって得られた前記斜線パターンの画像データにウインドウを設定してウインドウ内の画像データの重心を計算する計算手段と、該計算手段によって得られた重心の値によりウインドウの移動を制御する制御手段と、前記重心の値と前記変倍率とに基づき、各ラインの画像の位置誤差のデータを得る演算手段とを備えているので、倍率が変化しても画像の位置誤差を正確に測定することができる。
【図面の簡単な説明】
【図1】本発明の第1の実施形態における測定原理を示す説明図である。
【図2】第1の実施形態におけるシステム構成を示すブロック図である。
【図3】第1の実施形態におけるビットマップで複数の斜線を使って位置誤差を測定する場合のウインドウの移動とそれに伴う処理を示す説明図である。
【図4】斜線パターンを拡大して示す説明図である。
【図5】図4の斜線パターンの読取値を示す説明図である。
【図6】斜線判定用のウインドウを示す説明図である。
【図7】他の斜線判定用のウインドウを示す説明図である。
【図8】斜線判定用のマッチングパターンを示す説明図である。
【図9】図2の位置誤差測定部の重心の測定処理の処理手順を示すフローチャートである。
【図10】重心測定用ウインドウにおける読取値と重心の測定方法を示す説明図である。
【図11】斜線の長さ及び角度を示す説明図である。
【図12】図2の位置誤差測定部の重心の位置誤差の測定処理の処理手順を示すフローチャートである。
【図13】位置ズレを生じた斜線の変倍率100%時のビットマップパターンを示す説明図である。
【図14】位置ズレを生じた斜線の変倍率200%時のビットマップパターンを示す説明図である。
【図15】位置ズレを生じた斜線の変倍率50%時のビットマップパターンを示す説明図である。
【図16】位置誤差の演算における読取位置と位置誤差との関係を示す説明図である。
【図17】等倍時のライン数とステップ1204ないし1208の各処理によって求められる各値との関係を表形式で示す図である。
【図18】変倍率200%時のライン数とステップ1204ないし1208の各処理によって求められる各値との関係を表形式で示す図である。
【図19】変倍率50%時のライン数とステップ1204ないし1208の各処理によって求められる各値との関係を表形式で示す図である。
【図20】本発明の第2の実施形態における測定原理を示す説明図である。
【図21】第2の実施形態におけるシステム構成を示すブロック図である。
【図22】第2の実施形態におけるビットマップに斜線の画像データがあるときの位置誤差測定を行うときの処理を示す説明図である。
【図23】第2の実施形態におけるビットマップで複数の斜線を使って位置誤差を測定する場合のウインドウの移動とそれに伴う処理を示す説明図である。
【図24】第2の実施形態におけるウインドウのデータと斜線のパターンの関係を示す図である。
【図25】第2の実施形態における測定の処理手順を示すフローチャートである。
【図26】第2の実施形態における画像読取装置の概略構成を示す断面図である。
【図27】第2の実施形態における画像読取装置の平面図である。
【図28】図27において2点鎖線の円で囲んだ部分の拡大図である。
【図29】図27における測定用パターンの部分を拡大した拡大図である。
【図30】第2の実施形態において行っている位置誤差の補正の方法を示す説明図である。
【図31】第2の実施形態におけるパターンの画像データと主走査の変倍処理を行う画像データの範囲と原点の位置関係を示す説明図である。
【図32】従来例に係るリニアスケールの概略構成を示す斜視図である。
【図33】従来例に係るリニアスケールの検出原理を示す説明図である。
【図34】従来例に係るリニアスケールの移動方向の判別方法を示す図である。
【符号の説明】
1 光電変換部
2 A/D変換部
3 シェーディング補正部
4 斜線判別部
5 位置誤差測定部
6 制御部
7 画像処理部
8 操作部
9 画像変倍部
10 誤差信号
11 原稿の画像データ(ビデオ信号)
12 ビデオ制御信号
a,b,L,K1 、K2 ,K3 斜線
W1 ,W2 ,W3 ,Wn ,Wn+1 、Wn+2 ,Wn+3 ウインドウ[0001]
TECHNICAL FIELD OF THE INVENTION
The present invention relates to a device for measuring a position error of bitmap image data read by a reading device.In placeRelated.
[0002]
[Prior art]
As this type of image reading apparatus, for example, "Development of a high-definition image input apparatus" (conventional example 1), which is presented in the paper collection (IV) of the 71st ordinary general meeting of the Japan Society of Mechanical Engineers, is known. Here, an interpolation operation is performed on an image obtained by reading a test chart of equi-pitch lines arranged in the sub-scanning direction, that is, image data discretized at line intervals in the sub-scanning direction. By obtaining the center positions of the black line and the white line of the equal pitch line, and reading the difference from the reference pitch of the test chart, the reading position error of the image data due to the vibration of the apparatus or the like is detected.
[0003]
As another conventional example, there is Japanese Patent Application Laid-Open No. 6-297758 entitled "Scanning Line Pitch Measurement Method" (Conventional Example 2). In this known example, a hard copy pattern in which data of an equal pitch pattern is written is read, and pitch unevenness of a scanning line written by a hard copy device is measured.
[0004]
As an optical linear scale, for example, “Basic and Application of Servo Sensors” published by Ohmsha (Kojiro Oshima and Yuji Akiyama) [published February 20, 1988] (Conventional Example 3) is known. The technique described in this publication will be described with reference to FIGS.
[0005]
Here, a position scale is taken as an example of a linear scale. As shown in FIG. 32, the linear scale exemplified in the example includes a
[0006]
As shown in FIG. 33 (a), the output is maximum when the transmission portions of the two glasses coincide, and when the transmission portion and the
[0007]
The grating of the
[0008]
The moving direction of the
[0009]
By the way, in the above-mentioned conventional example 1, there is a phenomenon called moire that data obtained by reading a pattern having the same shape is different due to a difference in a positional relationship between an edge of a pattern of an equal pitch line and a timing of reading sampling. The read data does not necessarily correspond to the position of the edge of the pattern due to the moiré, so that the measurement accuracy of the position error is deteriorated. The effect of moiré becomes very remarkable when the pitch of the uniform pitch line pattern is refined and approaches the resolution of the reader, and it becomes impossible to measure the position error depending on the conditions. Therefore, in this method, a position error close to or lower than the resolution of the reading device cannot be measured with high accuracy.
[0010]
Further, since the pattern of the equal pitch line is used, even if the influence of moiré is ignored, if the pitch of the pattern is refined in order to measure the position error of the high frequency component, the MTF (Modulation Transfer Ratio) of the imaging optical system , The difference between the gray level signals of the obtained image becomes small, and the measurement accuracy must be degraded.
[0011]
Furthermore, in pattern refinement, the frequency band of the measurement is expanded in a higher direction, and the accuracy cannot be increased. Therefore, a process of interpolating the sampled data is performed. In order to perform better interpolation, more peripheral data is used or complicated arithmetic processing is required, and the processing time becomes longer. Further, the interpolation is an interpolation to the last, and it is inevitable that a deviation from the true data occurs, which is a factor of deteriorating the measurement accuracy. In addition, since one specific light receiving element in the photoelectric conversion device uses image data obtained by scanning in the sub-scanning direction, the noise of the light receiving element itself affects the accuracy of the measurement itself. Degrades the accuracy.
[0012]
In the second conventional example, the data obtained by reading the pattern by the photoelectric conversion device is used for measurement. Therefore, in the measurement, the hard copy pitch unevenness is measured by reading under the condition that there is no scanning unevenness when reading the hard copy. Although not particularly described, there is a problem of moire similar to that of the above-described conventional example 1.
[0013]
In Conventional Example 3, in a linear scale as described above, light emitted from a light source (LED) 84 is converted into a parallel light by a
[0014]
Therefore, the present applicant has already proposed inventions for solving these problems in Japanese Patent Application Nos. Hei 7-256481 and Hei 7-311015.
[0015]
[Problems to be solved by the invention]
However, the inventions according to these prior applications are directed to the case where the reading device reads at the same magnification, and do not consider the case of the variable magnification.
[0016]
Here, the phenomenon during zooming will be considered. Normally, the magnification of the reading device is changed by changing the scanning speed of the carriage in the sub-scanning direction to generate a scaled image, whereas the scaling in the main scanning direction is performed by image processing. Therefore, when the position error measuring device is placed after the scaling process in the main scanning direction, the angle of the read image of the oblique line pattern is 45 degrees if the oblique line pattern is 45 degrees. In the image after the magnification in the main scanning direction, the line width of the oblique line in the main scanning direction changes according to the value of the magnification. That is, the line width increases as the magnification increases, and the line width decreases as the magnification decreases. Therefore, it is necessary to change the size of the window according to the magnification. When the size of the window is changed in accordance with the magnification, the measurement time of the center of gravity differs, and an error may occur in the measurement of the position error.
[0017]
The present invention has been made in view of such a point, andEyesIt is an object of the present invention to provide a pixel position error measuring device capable of accurately measuring a position error even when a magnification changes.
[0019]
[Means for Solving the Problems]
The first object is to provide a diagonal pattern, which is provided outside the effective image area and is composed of a plurality of lines having a constant inclination with respect to the main scanning direction, and a document in which the diagonal pattern is placed in the effective image area. Reading means extending in the main scanning direction for reading, setting means for setting the magnification of the original, sub-scanning means for changing the original scanning speed in the sub-scanning direction according to the magnification, and the reading means. Calculating means for setting a window in the image data of the diagonal pattern and calculating the center of gravity of the image data in the window; control means for controlling the movement of the window by the value of the center of gravity obtained by the calculating means; And an arithmetic unit that obtains data of the position error of the image of each line based on the value of the image magnification and the magnification.
[0022]
BEST MODE FOR CARRYING OUT THE INVENTION
Hereinafter, embodiments of the present invention will be described with reference to the drawings. Note that, in the following description, the same reference numerals are given to the portions that can be regarded as equivalent, and duplicate description will be omitted as appropriate.
[0023]
1. First embodiment
1.1. Measurement principle
FIG. 1 is a diagram for explaining the measurement principle of the present application on the assumption of a typical case. An
[0024]
FIG. 1 shows a case where the pixel sizes of the main scanning and the sub-scanning are the same. When the scanning speed in the sub-scanning direction fluctuates and when oblique lines of 45 ° are read at a constant speed, the image is projected onto the photoelectric conversion device. It is shown in correspondence with a bitmap without any deterioration. That is, a is when scanning is performed at a predetermined constant speed corresponding to a clock for controlling the timing of reading in the sub-scanning direction, and a 45 ° image is formed on the bit map. b is an image when the speed fluctuates, and the inclination is different according to the speed.
[0025]
That is, AB indicates that the scanning speed in the sub-scanning direction is 0, and the reading position of the original does not change even if the address of the bit map in the sub-scanning direction advances by the clock that controls the timing of reading in the sub-scanning direction. As a result, the lines are parallel to the sub-scanning direction.
[0026]
BC is when the scanning speed in the sub-scanning direction is 1/2 of the predetermined speed. Even if the address of the bit map advances, an image at a position where only half the address advances is read, and the sub-scanning of the image is performed. The angle of the direction with the line is about 26.57 ° from tan θ = 0.5.
[0027]
CD is when scanning is performed at a predetermined speed, and the inclination is 45 °. Similarly, after D-, the scanning speed is 1.5 times, and the angle is about 56.31 °. In other words, based on the measurement principle that the inclination of the image differs depending on the scanning speed, in other words, the amount of movement of the oblique line in the main scanning direction corresponds to the moving speed in the sub-scanning direction, unevenness in the moving speed in the sub-scanning direction, mirror, The position error of the pixel of the bitmap image due to the vibration of the lens and the photoelectric conversion device is measured.
[0028]
As described above, the case where square pixels are used and a 45 ° line is used has been described. However, the present invention is applied to image data of a reading device such as a main scanning resolution of 400 dpi and a sub-scanning resolution of 600 dpi. Similarly, even if a diagonal line other than 45 ° is used, the relationship that the amount of movement of the diagonal line image in the main scanning direction depends on the speed in the reading direction in the sub-scanning direction is established. Can be measured.
[0029]
1.2. System configuration
FIG. 2 is a block diagram showing an example of the system configuration of the position error measuring device according to the present embodiment, which is incorporated as an additional function to the image reading device and measures the position error in real time. This system basically comprises a
[0030]
The
[0031]
In a reading device using a 1: 1 sensor as a photoelectric conversion device, there is no problem of a decrease in the amount of peripheral light due to the characteristics of the lens, and thus shading correction may be omitted. can do.
[0032]
1.3. Position error measurement processing
FIG. 3 is a diagram for explaining a process for measuring a position error when the hatched image data K1, K2, and K3 are present in the same bit map as in FIG. W1 is a 10 × 3 window for performing an operation for obtaining the position of the image data K2. In order to find the position of the data in the window, the center of gravity in the main scanning direction is calculated. In this calculation, the center of gravity is obtained while sequentially moving the position of the window as W2, W3,. If the position of the center of gravity in the main scanning direction is a 45 ° line, if the position of the pixel does not move due to some error factor, if the window is moved as shown in the figure, it moves by one pixel in the main scanning direction. Should do it. If the movement amount of the pixel is different from that of one pixel, the position of the pixel has changed for some reason, and a position error can be obtained. If it is known that the main factor of the position error is caused by unevenness in the scanning speed in the sub-scanning direction, it is easy to convert the data into position error data or speed unevenness.
[0033]
Since a large amount of pixel data including peripheral pixel data is used to determine the center of gravity, various noises including noise unique to the CCD are included in the image data, but the effect of noise is reduced in the process of determining the center of gravity As a result, high S / N measurement is possible. Normally, the S / N increases as the number of pixels in the window increases.
[0034]
The shape of the window is desirably large on the main scanning side since the center of gravity in the main scanning direction is obtained. The measurement can be performed even if the sub-scanning direction is 1. By doing so, the time required for the measurement can be shortened. Similarly, the windows W2 and W3 are moved. Then, the number of measurements of the same line is set in advance to n, and when i = n, that is, when the window Wn is reached, the window is moved to the window Wn + 1 of the image data K3 as the next window. As a method for this, the coordinates of the window are shifted in the main scanning direction by a value m smaller than the number of pixels corresponding to the interval between the oblique lines in the main scanning direction in the main scanning direction, the counter value i is cleared, and the processing of the oblique
mom2-mom1
Is the displacement of the center of gravity mom. Hereinafter, similarly, the position error is measured by moving to Wn + 1, Wn + 2, Wn + 3,.
[0035]
If the position error is measured using a plurality of oblique lines in this way, measurement can be performed over the entire sub-scanning area even if the reading range of the reading device is vertically long. Further, if the measurement is performed only in the narrow width in the main scanning direction, it is possible to measure the error of the position in the central portion, the near side, and the back side in the main scanning direction.
[0036]
1.4. Oblique line pattern determination processing
Next, the oblique line pattern determination processing will be described. FIG. 4 shows a case where the bit map has diagonal lines as in FIG. 1, and FIG. 5 shows a read value of 8 bits (0 to 255) in that case. Note that 0 = white, 255 = black, the coordinates in the main scanning direction are Xn, and the coordinates in the sub-scanning direction are Ym. FIG. 6 shows a diagonal line pattern detection window of 3 pixels in the main scanning direction × 3 pixels in the sub-scanning direction, and FIGS. 6A to 6E show windows shifted by one pixel in the main scanning direction. .
[0037]
Here, the sum Pa of the three pixel values in the diagonal direction sandwiching the center pixel in the window (X2 to X4, Y1 to 3) shown in FIG. When the sum Qa of the three pixel values in the directions is calculated,
[0038]
Similarly, as for FIGS. 6B to 6E,
[0039]
Next, when a difference R between the center pixel and three pixels (including the center pixel) in the lower right diagonal direction is obtained,
Ra = 15−5 = 10
Rb = 222-7 = 215
Rc = 667-9 = 658
Rd = 750-33 = 717
Re = 751-454 = 297
It becomes.
[0040]
When the value of the difference R is large, it indicates that there is a diagonal line pattern in the window of 3 × 3 pixels. Therefore, if it is determined that there is a diagonal line pattern when the value of R is 500 or more, for example, it can be determined that there is a diagonal line pattern in the windows shown in FIGS. 6C and 6D.
[0041]
Next, another oblique line pattern determination processing will be described with reference to FIG. FIGS. 7A to 7E show the case where each value in the window shown in FIGS. 6A to 6E is binarized with the threshold = 128, and similarly, the upper left corner of the center pixel in each window is shown. When the sums Pa to Pe of the three pixel values in the oblique direction and the sums Qa to Qe of the three pixel values in the lower right oblique direction are calculated,
[0042]
Next, when differences Ra to Re between the center pixel and three pixels (including the center pixel) in the lower right diagonal direction are obtained,
Ra = 0-0 = 0
Rb = 1-0 = 1
Rc = 3-0 = 3
Rd = 3-0 = 3
Re = 3-2 = 1
It becomes.
[0043]
Accordingly, also in this case, similarly, when the value of the difference R is large, it indicates that there is a diagonal pattern in the window of 3 × 3 pixels. For example, when the value of Ra to Re is 2 or more, there is a diagonal pattern. If it is determined, it can be determined that there is an oblique line pattern in the windows shown in FIGS. 7 (c) and 7 (d). Further, by binarizing the pixel values in this way, the addition operation can be simplified.
[0044]
FIGS. 8A to 8D show matching patterns for oblique line pattern detection, in which white areas represent "0" and black areas represent "1". First, the image data is binarized as shown in FIG. 7, and the binarized data is compared with the matching patterns shown in FIGS. 8 (a) to 8 (d). In this example, FIG. 7 (c) and FIG. 8 (b) match, and FIG. 7 (d) and FIG. 8 (a) match, and it is determined that there is an oblique line pattern in this window.
[0045]
In the above embodiment, the size of the window is set to 3 × 3. Obviously, even when the window size is different, a diagonal pattern can be detected by the same determination method. In general, the larger the window size, the higher the discrimination system, but the longer the processing time and the larger the circuit scale.
[0046]
1.5. Calculation of window data and center of gravity
1.5.1 Measurement process of center of gravity
Next, a process of measuring the center of gravity will be described. The process shown in FIG. 9 starts at the same time as the start of scanning of a document. First, the coordinate values X and Y in the main scanning direction and the sub-scanning direction are initialized (X = 0, Y = 0) [step 901]. The coordinate values X and Y are coordinates of a certain pixel position, for example, a center pixel in a 3 × 3 window for oblique line determination. Next, a variable i indicating the number of measurements for one oblique line is initialized (i = 0) [step 902].
[0047]
Next, the oblique
[0048]
When the measurement of the center of gravity is completed, the displacement of the center of gravity is calculated (step 906), and then a window W2 shifted by -1 pixel in the main scanning direction and +1 pixel in the sub-scanning direction is set. The value i is incremented by one (step 907). In this embodiment, the window W is moved one pixel at a time. However, if the frequency band such as vibration causing a position error of the pixel is low, the window W may be moved two or more pixels. The time required for the measurement can be reduced by the method.
[0049]
Next, if i = n does not hold for the preset number of measurements n of the same line, the process returns from
[0050]
By measuring the position error using a plurality of oblique lines in this way, the position error can be measured over the entire sub-scanning area even if the reading range of the reading device is vertically long. Further, since the measurement is performed only in the narrow width in the main scanning direction, the measurement can be performed separately at the center, the front side, and the back side in the main scanning direction. Also, when measuring the position error with high resolution, it is not necessary to make the hatched pattern thin at all, and a wide pattern can be used without being restricted by the MTF of the system.
[0051]
Further, when a pattern having a wide width is used, the window becomes larger in accordance with the width, so that the measurement accuracy can be improved as a result. Therefore, the width of the oblique line may be set in consideration of the processing speed, the size of the buffer when real-time processing is performed, the economics of the circuit scale, and the like. Further, a position error can be measured by detecting an edge on one side using a wide pattern. Further, for example, moiré is a problem when a black-and-white pattern is arranged in the sub-scanning direction regardless of the reading timing in the sub-scanning direction. However, in this embodiment, the relationship between the reading timing in the sub-scanning direction and the diagonal line is always the same. The occurrence of moire is not a problem, and as a result, the position error can be measured with high accuracy.
[0052]
1.5.2 Calculation of window data and center of gravity
Next, calculation of window data and the center of gravity will be described in detail. FIG. 10 shows the relationship between the window data and the read value of each pixel of the oblique line pattern. The read value is 8 bits and is represented by decimal (0 to 255). To find the center of gravity in the main scanning direction, the sum of each column (for three lines) in the sub-scanning direction is found, and when these are X0, X1,... X9 from the left side as shown in the figure, 18, 50, 202, 427, 590, 562, 345, 150, 37 and 14. When the center coordinates of each pixel in the main scanning direction are 0 to 9 in order from the left and the center of gravity in the main scanning direction is Rm, the moment around the center of gravity Rm is 0.
Z0 (Rm-0) + Z1 (Rm-1)... Z9 (Rm-9) = 0
Is satisfied, and a calculation is performed by substituting numerical values to obtain Rm = 4.362.
[0053]
The reason for obtaining the center of gravity is that the calculation can be simplified and speeded up without requiring preprocessing such as interpolation. Further, when obtaining the image position, a method of obtaining a data string of a predetermined resolution by interpolation from the arrangement of the sum of the data of each column and obtaining the position where the peak value exists from the data can be used.
[0054]
1.5.3 Calculation of center of gravity of chart consisting of multiple oblique lines
Next, a case where the center of gravity of a chart composed of a plurality of oblique lines is calculated will be described. When calculating the barycenter of a plurality of oblique lines as shown in FIG. 3, there is no problem with lines on the same line, but when the window moves to a different line, the distance between the oblique lines in the main scanning direction before and after the movement is different. Just as the value of the center of gravity is different unless the number of pixels is an integer, the value must be corrected. As an example, the value of the center of gravity Rn of the window Wn of the hatched line K2 shown in FIG. 3 is 4.65, the value of the center of gravity Rn + 1 of the window Wn + 1 when moving to the next hatched line K3 is 4.38, and the value of the center of gravity Rn + 2 of the window Wn + 2 is 4.38. Is 4.40, and the value of the center of gravity Rn + 3 of the window Wn + 3 is 4.41, and the difference ΔR between the centers of gravity of the lines to which the window has moved is calculated. That is,
ΔR = Rn−Rn + 1 = 4.65−4.38 = 0.27
It becomes.
[0055]
This value ΔR is added to the value of the center of gravity of the oblique line K3, and the result of this addition is used as the value of the center of gravity to obtain a position error. In this case, the value of the center of gravity Rn + 2 of the window Wn + 2 and the value of the center of gravity Rn + 3 of the window Wn + 3 are:
Rn + 2 = Rn + 2 + ΔR = 4.40 + 0.27 = 4.67
Rn + 3 = Rn + 3 + ΔR = 4.41 + 0.27 = 4.68
It becomes. Therefore, even if such a chart including a plurality of oblique lines is used, the position error can be continuously measured with high accuracy. However, when moving from the window Wn of the oblique line K2 to the window Wn + 1 of the oblique line K3, the oblique lines K2 and K3 must exist simultaneously in the main scanning direction.
[0056]
FIG. 11 shows an arrangement relationship of the oblique lines. When a plurality of oblique lines having a length L1 are arranged at an angle θ with respect to the main scanning direction, and the positions of the start point and the end point of the oblique lines in the main scanning direction are the same, in the main scanning direction, Assuming that the diagonal interval is L2
L2 <L1 × cos θ (1)
When the diagonal lines are arranged so that the relationship of (1) is established, the diagonal lines overlap in the main scanning direction, so that the window can be moved in the main scanning direction to continuously measure the center of gravity of the next diagonal line. Here, as the length L1 of the oblique line and the positions of the start point and the end point of the oblique line in the main scanning direction become more precise, the greater the magnitude relation of the equation (1), the less the precision is required.
[0057]
1.6. Position error measurement procedure
FIG. 12 is a flowchart showing a processing procedure when measuring a position error. The process starts simultaneously with the start of scanning. First, in
[0058]
In
[0059]
The above procedure is repeated, and when the difference becomes 1 or less, the procedure proceeds to the next procedure (step 1206). In this embodiment, the difference between the count values is “1”. However, the present invention is not limited to this, and is appropriately set according to the size of the window.
[0060]
In
[0061]
In
t = 100 / magnification (%) (2)
It becomes. That is, when the magnification is 100%, t = 1, when the magnification is 200%, t = 0.5, and when the magnification is 50%, t = 2. This t is the reciprocal of the scaling factor, which means the inclination of the straight line L, and indicates how much x moves when y moves by one in the sub-scanning direction. Thus, the relationship between the value of t and the magnification is as described above.
[0062]
M in this
[0063]
FIG. 16B shows a case where the speed fluctuates to に お い て in the bitmap pattern read at a magnification of 100%, and a 45 ° oblique line is read as indicated by oblique line S2. At this time, paying attention to the point T1, the point T1 is an image that should be read at the position of T2, and the original reading position is that the point T1 is read at a distance of L3 from the point T0. Therefore, Pi-1-Pi in
[0064]
FIG. 16C shows a state where the speed is not changed in the bitmap pattern read at a magnification of 200%, as indicated by the oblique line S5 (dotted line). If the speed fluctuates twice during this time, it is read as a 45-degree oblique line as indicated by oblique line T6. At this time, focusing on the point T9, the point T9 is an image that should be read at the position of T11. Therefore, the original reading position is that the point T11 is read at a distance of L9 from the point T0. In
[0065]
In this embodiment, the window is moved one pixel at a time in the sub-scanning direction. However, when the frequency band such as vibration causing a position error of the pixel is low, the window is moved two or more pixels at a time. You may. Then, in
[0066]
1.7. Relationship between the amount of movement of the hatched image in the main scanning direction and the positional error of the pixel in the sub-scanning direction
In this embodiment, in order to measure the position error of the pixel in the sub-scanning direction, the movement of the position of the image in the main scanning direction of the image obtained by reading the oblique lines is observed. When the measurement is performed using a 45-degree oblique line with a square pixel, the deviation between the windows in the amount of movement in the main scanning direction directly becomes the position error in the sub-scanning direction, as is apparent from the above description. If the pixel is not square, or if the angle of the oblique line is not 45 degrees, it is necessary to perform conversion to obtain a position error in the sub-scanning direction. The direction will be described with reference to FIGS.
[0067]
13 shows a bitmap pattern at the same magnification (100%), FIG. 14 shows a bitmap pattern at a magnification of 200%, and FIG. 15 shows a hatched bitmap pattern at a magnification of 50%. These figures show the case where the speed fluctuation occurs near the center. FIGS. 13 and 15 show examples where the speed decreases, and FIG. 14 shows the case where the speed increases.
[0068]
First, control of the n-th line in FIG. 13 will be described.
Assuming that the center of gravity pos of the window is 2, the correction amount of the shift of the center of gravity mom = 0, and the shift amount s = 1, the value of the center of gravity of the n-th line is
3 (= 2 + 0 + 1)
[Step 1206]. Next, in the calculation of the position error, if the center of gravity of the n-1 line is Pn-1 = 3 and the position error is Mn-1 = 5, the center of gravity of the n line is
Mn = (3-3) × 1 + 5 + 1 = 6
It becomes.
[0069]
Next, at
t = 1
It becomes. Therefore,
s = 2
It becomes. Also, y is incremented by one. That is, the window moves one line in the y direction and returns to step 1204, and the center of gravity pos of the window is obtained. In
| 1-6 / 2 | = 2
, And the process proceeds to step 1214. Next, the window is moved −1 in the x direction, s is subtracted by 1, s = 1 is set, and the process returns to step 1204 to obtain the center of gravity.
Pn + 1 = 2-0 + 1 = 3
It becomes. Next, the error position is
Mn + 1 = (3-3) × 1 + 6 + 1 = 7
It becomes. Then, in step 108, s = 2, and the window is moved by one in the y direction. In
| 1.2-6 / 2 | = 1.8
, And the process proceeds to step 1214. In
[0070]
Assuming that the center of gravity pos at this time is 2.2, the center of gravity of the (n + 2) -th line is obtained in
Pn + 2 = 2.2-0 + 1 = 3.2
It becomes. On the other hand, the position error is
Mn + 2 = (3-3.2) × 1 + 7 + 1 = 7.8
It becomes. In
[0071]
Note that the straight line L indicates a locus where the left end of the window moves when there is no position error M. That is, a straight line on the bitmap when a 45-degree oblique line is read when there is no position error is L. The shift amount s used in
[0072]
On the other hand, when the magnification is 200%, as shown in FIG. 14, if the center of gravity pos of the n-line window is 2.8, the correction value of the shift of the center of gravity is mom = 0, and the shift amount s = 0, the n-line window is obtained. The value of the center of gravity of
2.8 (= 2.8 + 0 + 0)
[Step 1206]. In the position correction calculation, assuming that the center of gravity of the n-1 line is Pn-1 = 2.8 and the position error is Mn-1 = 5, the center of gravity of the n line is
Mn = (2.8-2.8) × 2 + 5 + 1 = 6
It becomes.
[0073]
In
| 2.3-6 / 2 | = 0.7
Then, the process proceeds to step 1206 to determine the center of gravity of the (n + 1) th line. Then, the center of gravity is
Pn + 1 = 2.3-0 + 0.5 = 2.8
And the position error is
Mn + 1 = (2.8-2.8) × 2 + 6 + 1 = 7
It becomes. Then, in
s = 0.5 + 0.5 = 1
Moves the window by one in the y direction.
[0074]
Then, in
| 1.5−6 / 2 | = 1.5
, And the process proceeds to step 1214. Then, in
Pn + 2 = 2.5-0 + 0 = 2.5
And the position error is
Mn + 1 = (2.8-2.5) × 2 + 7 + 1 = 8.6
It becomes. In
[0075]
FIG. 15 shows a case where the magnification is 50%. That is, assuming that the center of gravity pos of the n-line window is 2.4, the correction amount of the shift of the center of gravity mom = 0, and the shift amount s = 0, the value of the center of gravity of the n-line is
2.4 (= 2.4 + 0 + 0)
[Step 1206]. Next, in the calculation of the position error, assuming that the center of gravity of the n-1 line is Pn-1 = 2.4 and the position error is Mn-1 = 5, the center of gravity of the n line is
Mn = (2.4-2.4) × 5 + 1 = 6
It becomes. In
[0076]
In
| 0.4-6 / 2 | = 2.6
, And the process proceeds to step 1214. The window is moved by −1 in the x direction, and the shift amount s is subtracted by 1, and s = 1. Further, the process proceeds to step 1204, and the center of gravity pos of the window is obtained. At this time, if pos = 1.4,
| 1.5-6 / 2 | = 1.6
, And the process proceeds to step 1214. The window is moved −1 in the x direction, the shift amount s is subtracted by 1, and s = 0. Further, the process proceeds to step 1204, and the center of gravity pos of the window is obtained.
[0077]
At this time, pos = 2.4, and the process proceeds to step 1206. At this time, the difference between the center of gravity of the window and the center of the window | pos-X By controlling the amount of addition and subtraction of x and s in
| Pos-X W / 2 | ≧ 2
At this time, if the addition and subtraction amounts for x and s in
[0078]
Next, when the center of gravity of the (n + 1) th line is obtained,
Pn + 1 = 2.4-0 + 0 = 2.4
And the position error is
Mn + 2 = (2.4-3) × 0.5 + 7 + 1 = 7.7
It becomes. As a result, in
[0079]
Then, in
Pn + 2 = 3-0 + 0 = 3
And the position error is
Mn + 2 = (2.4-3) × 0.5 + 7 + 1 = 7.7
It becomes. Thus, in
[0080]
By such control, position error measurement corresponding to zooming can be performed.
[0081]
2. Second embodiment
Next, a second embodiment will be described. In the following embodiments, the same reference numerals are given to the units that can be regarded as equivalent to the above-described first embodiment, and overlapping descriptions will be omitted as appropriate.
[0082]
2.1. Measurement principle
FIG. 20 is a diagram showing a bitmap for explaining the measurement principle of the second embodiment. This embodiment is the same as FIG. 1 except that the main scanning direction is set in the opposite direction to that of the first embodiment, and a detailed description thereof will be omitted.
[0083]
2.2. System configuration
FIG. 21 is a block diagram showing an example of the system configuration of the position error measuring device according to the second embodiment, which is incorporated in an image reading device as an additional function and measures the position error in real time. This system basically includes a
[0084]
In FIG. 21A, the
[0085]
On the other hand, in FIG. 21B, the image data of the diagonal lines subjected to shading correction is first subjected to scaling processing by the
[0086]
In a reading device using a 1: 1 sensor as a photoelectric conversion device, there is no problem of a decrease in the amount of peripheral light due to the characteristics of the lens, and thus shading correction may be omitted. can do.
[0087]
2.3. Position error measurement processing
FIG. 22 is a view for explaining the processing for measuring the position error when the hatched image data a is present in the same bit map as in FIG. W1 is an 11 × 3 window for performing an operation for obtaining the position of the image data. In order to find the position of the data in the window, the center of gravity in the main scanning direction is calculated. In this calculation, the center of gravity is obtained while sequentially moving the position of the window as W2, W3,. If the position of the center of gravity in the main scanning direction is a 45 ° line, if the position of the pixel does not move due to some error factor, if the window is moved as shown in the figure, it moves by one pixel in the main scanning direction. Should do it. If the movement amount of the pixel is different from that of one pixel, the position of the pixel has changed for some reason, and a position error can be obtained. If it is known that the main factor of the position error is caused by unevenness in the scanning speed in the sub-scanning direction, it is easy to convert the data into position error data or speed unevenness.
[0088]
Since a large amount of pixel data including peripheral pixel data is used to determine the center of gravity, various noises including noise unique to the CCD are included in the image data, but the effect of noise is reduced in the process of determining the center of gravity As a result, high S / N measurement is possible. Normally, the S / N increases as the number of pixels in the window increases.
[0089]
The shape of the window is desirably large on the main scanning side since the center of gravity in the main scanning direction is obtained. The measurement can be performed even if the sub-scanning direction is 1.
[0090]
FIG. 23 illustrates the movement of the window and the accompanying processing when the position error is measured using a plurality of oblique lines a1, a2, and a3 with a plurality of oblique lines. The windows are sequentially moved in the same manner as in the example of FIG. 3, and when the window reaches the preset Wn, the window is moved to Wn + 1 as the next window. The distance between the hatched patterns a1 and a2 before and after the movement is determined at the stage of creating the measurement chart, and the value of the distance is corrected when calculating the movement of the center of gravity in the main scanning direction, and Wn + 1, Wn + 2, Wn + 3 ... and move. If the interval between patterns is set to an integral multiple of the pixel size, it is easy to correct when the window is jumped, and it is also convenient to input this correction amount to the measuring device prior to measurement.
[0091]
In this example, the window is moved one pixel at a time. However, when the frequency band such as vibration that causes a pixel position error is low, the window may be moved two pixels or more. By doing so, the time required for the measurement can be shortened.
[0092]
In addition, if the position error is measured using a plurality of oblique lines, the measurement can be performed over the entire area in the sub-scanning direction even if the reading range of the reading device is vertically long. Further, if the measurement is performed only in the narrow width in the main scanning direction, it is possible to measure the position error separately at the center, the front side, and the back side in the main scanning direction.
[0093]
As is clear from these figures, even when measuring the position error with high resolution, there is no need to make the diagonal pattern thinner accordingly, and a wide pattern that is not affected by the MTF restrictions of the system is used. There is a feature that can be used. If a wide pattern is used, the window is correspondingly enlarged, and as a result, the accuracy of the measurement can be increased. When the processing speed and the real-time processing are performed, the width of the pattern may be set in balance with the buffer size, the economy of the circuit scale, and the like.
[0094]
As another example, it is possible to use a wide line pattern and measure the position error in the same manner by using data of one of the edges.
[0095]
Further, since the relationship between the reading timing of the sub-scanning and the oblique line is always the same, the problem of moire which cannot be avoided with the equally spaced black and white pattern arranged in the sub-scanning direction as in the above-described known example is avoided. This enables highly accurate position error measurement.
[0096]
2.4. Calculation of window data and center of gravity
FIG. 24 shows the relationship between the window data and the hatched pattern. In each pixel of the window, a value of image data obtained by reading a hatched pattern is written. The value of the image data is 8-bit digital data, and can take a value of 0 to 255 when represented by a decimal system. The values shown in the figure are values obtained by expressing image data in decimal notation.
[0097]
To calculate the center of gravity in the main scanning direction, a sum of data is obtained for each column. .., H10 from the right side are 14, 37, 150, 345, 562, 590, 427, 202, 50, 18, and 13, respectively. Assuming that the coordinates of the center of each pixel in the main scanning direction are 0 to 10 in order from the right and the position of the center of gravity in the main scanning direction is m, the moment around m is 0,
h0 (m-0) + h1 (m-1) +... + h10 (m-10) = 0
Holds, and when calculating with the numerical values,
m = 4.667
Is obtained.
[0098]
Finding the center of gravity does not require preprocessing such as interpolation, and is useful for simplifying and speeding up the operation. The position of the image can be determined by a method of obtaining a data string having a predetermined resolution by interpolation from the arrangement of the sum of the data in each column and determining the position where the peak value exists from the data.
[0099]
2.5. Diagonal width
In calculating the center of gravity, the width of the diagonal line is not a problem as long as the data can be read properly, but the pixel is square, the angle of the diagonal line is 45 °, and the scanning speed of the image slightly deviates from the predetermined target speed. When measuring with higher accuracy, if the width of the diagonal line in the main scanning direction is set to an integral multiple of the pixel, even if the window is moved diagonally, the relationship between the diagonal line and the pixel will be the same on both sides of the diagonal line, The error factors of the image data can be balanced, and the accuracy of calculating the position of the image can be improved.
[0100]
2.6. Relationship between the amount of movement of the hatched image in the main scanning direction and the pixel position error in the sub-scanning direction
In this embodiment, in order to measure the position error of the pixel in the sub-scanning direction, the movement of the position of the image in the main scanning direction of the image obtained by reading the oblique lines is observed. When the measurement is performed using a 45 ° oblique line with a square pixel, the deviation between the windows in the amount of movement in the main scanning direction directly becomes a position error in the sub-scanning direction, as is clear from the above description. If the pixel is not square, or if the angle of the oblique line is not 45 °, it is necessary to perform conversion to obtain a position error in the sub-scanning direction.
[0101]
2.7. Measurement procedure
FIG. 25 is a flowchart illustrating a measurement processing procedure. In this processing procedure, first, W.W. P. (Window pointer) is set (step 2501). P. The data of the window designated by (1) is fetched [Step 2502], and the sum V of the fetched data is calculated [Step 2503]. Then, it is checked whether or not the sum V of the data has a value between a and b set in advance (step 2504). If the value is between a and b in this check, the center of gravity is calculated [step 2505], and the shift of the center of gravity is calculated [step 2506]. P. Is set (step 2507). Thereafter, the process returns to step 2502 to repeat the processing after the data fetch.
[0102]
On the other hand, if it is determined in
[0103]
Note that the total sum of the processing is checked in
[0104]
2.8. Schematic configuration of the device
FIG. 26 is a cross-sectional view for explaining a schematic configuration of the image reading apparatus according to this embodiment. In the figure, a
[0105]
The
[0106]
FIG. 27 is a plan view of the image reading apparatus shown in FIG. 26. The
[0107]
FIG. 28 is a diagram showing details of a portion surrounded by a two-dot chain line circle CL in FIG. The
[0108]
FIG. 29 is a plan view in which a part of the
[0109]
2.9. Arrangement of read data based on position error
FIG. 30 is a diagram for explaining how the position error is corrected. The vertical axis indicates the value of the image data after the shading correction in the
[0110]
In this example, the pixel position is corrected in real time to minimize the amount of memory that must be provided in the device. In order to perform the processing in real time, it is necessary to simplify the operation involved in the processing. If the processing is simplified, the circuit scale of the processing system is reduced, and there is an economic effect. Therefore, the resolution of the processing is set to 1/16 dot. Therefore, a memory divided into 16 is provided between the integers on the horizontal axis.
[0111]
At 0 on the horizontal axis, the position determined by the
[0112]
Since the speed of the carriage continues to be high, the position error obtained by measuring in relation to the data read one line before is also 1/16. However, since the position of the line one line before has already been shifted by 1/16 from the
[0113]
2.10. Correcting read data
Correction of the data by obtaining by interpolation the data indicated by large circles corresponding to
[0114]
By using such an interpolation method, the position error of the pixel is effectively corrected and good image data is obtained, but there is a problem that a processing amount required for the calculation for the interpolation is large. The process of correcting the position error of the sub-scanning line involves performing a correction operation on 5000 pieces of data constituting each line in the main scanning direction. Therefore, the size of the process is relatively large for real-time processing. In addition, a processing circuit and a buffer memory capable of performing a high-speed operation are required.
[0115]
On the other hand, in this embodiment, the correction of the position error of the pixel in the sub-scanning direction is performed by reading the data of the line closest to the original position from the read sub-scanning line as it is to the data of the original position. Done by using as. Therefore, since it is only necessary to select the closest line from the read lines, the processing is completed for each line, and it is not necessary to calculate for each main scanning pixel constituting the sub-scanning line as in the prior application. As a result, the processing involved in the interpolation is greatly reduced. This processing will be described with reference to FIG.
[0116]
In this process, the data of the line a is used as the data of the
[0117]
The fluctuation of the scanning speed of the original by the ordinary reading device is within 1% of the rated speed, and even if there is a fluctuation in the speed, the interval between the lines of the sub-scanning to be read is almost close to a predetermined resolution. However, even in the worst condition that the original data should be exactly at the center of the read line data, the position error of the image data is only 1 / of the resolution. Therefore, it can be guaranteed that the pixel position error has an accuracy of 1/2 dot or less. In many applications of the image reading apparatus, it is sufficient to have such a positional accuracy. In the conventional flatbed type image reading apparatus, it is very difficult to eliminate the fluctuation in the speed of the carriage that scans the original, and a position error of a relatively large pixel cannot be avoided. By measuring the position error of the pixel from the image data obtained by reading the pattern and correcting the position of the pixel, it is possible to realize an image reading apparatus with a very simple configuration and a small position error of the pixel.
[0118]
2.11. Operation during variable magnification reading
As a preparation for explaining the magnification change, first, the same-magnification reading will be described. The reading apparatus according to this embodiment has a function of reading a short side of an A3-size document in a main scanning direction at a resolution of 400 dpi when a line CCD is used as a reading element and at the same magnification. The line CCD has 5000 light receiving elements arranged at a pitch of 10 μm. Since the resolution is 400 dpi, the length corresponding to one dot on the document surface is
25.4 / 400 = 0.0635 mm
That is, it is 63.5 μm. When this is imaged on the CCD by the optical system, the image is projected with a size of one dot of the CCD, that is, 10 μm. That is, the image of the original is reduced by a factor of 6.35 and projected onto the light receiving surface of the CCD, thereby forming an image of the same size. The scanning in the sub-scanning direction is performed by moving the carriage, and the scanning speed is a speed at which the line clock of the sub-scanning moves by 63.5 μm during one clock advance. The data is read every line clock while scanning the original at this speed. Such a reading method is performed line by line for each line clock, and is therefore referred to as line sequential reading.
[0119]
Therefore, when reading with changing the magnification, that is, at the time of changing the magnification, the scanning speed of the original is changed according to the magnification while the magnification of the optical system is the same as when the magnification is the same. For example, when reading at double magnification, scanning is performed at half the speed of the carriage for scanning the original while maintaining the speed of the line clock for sub-scanning as it is. The change in the speed of the carriage is performed by changing the number of revolutions of the motor that drives the carriage. By treating the data obtained for each sub-scanning line clock as data separated by 63.5 μm, which is the same as that at the same magnification, image data enlarged twice in the sub-scanning direction can be obtained. However, in this state, since the magnification of the optical system is not changed, the magnification remains the same in the main scanning direction. In order to obtain an image twice as large in the main scanning direction, image data at a position that should be obtained when scaling is performed from image data obtained at the same magnification is obtained by an interpolation method. As the interpolation method, the above-mentioned cubic function convolution is used. Here, for the sake of simplicity, the example of the double magnification has been described, but the same applies to reading at another magnification.
[0120]
In the above, the outline of the magnification reading has been described.Hereafter, the image data of the pattern formed by repeating the diagonal lines provided outside the region where the original is read to obtain the pixel position error and the magnification processing in the main scanning direction are described. The positional relationship between the range of image data to be performed and the origin will be described with reference to FIG.
[0121]
The horizontally long rectangles shown in the arrangement of the squares indicate the arrangement of the image data of one line of the main scanning read by the line sensor, and also indicate the arrangement of the light receiving units of the line sensor. The arrow written as main scanning indicates the direction of main scanning. After the electric signals photoelectrically converted by the line sensor are simultaneously transferred to the shift register built in the CCD, the image data is synchronized with the clock of main scanning. The output order is shown. The direction of the arrow indicates the direction in which time elapses, and data is output in order from the rightmost data in the figure. A and B in the figure correspond to the reading area of the original in the main scanning direction of the reading apparatus. In FIG. 27, the position where the upper side is projected on the CCD is A, and the position where the lower side is projected is B.
[0122]
An image of a pattern for measuring a position error of a pixel formed by repeating diagonal lines arranged along the upper side of the reading area is formed in a range from the right end of the image data array to A. The image data is obtained by moving the carriage in the sub-scanning direction while maintaining this relationship, and repeatedly reading the data line by line. When the apparatus starts reading a document, the document is set so as to abut the left-hand corner of the
[0123]
In this way, even when reading at the magnification, the processing in the main scanning direction accompanying the magnification is not performed on the hatched data in order to calculate the pixel position error, and the magnification is changed only on the data read from the original. Processing is performed. By doing so, the size of the data obtained by reading the oblique lines and the positions of the pixels do not change even when the magnification is changed. Therefore, it is necessary to change the size of the window for calculating the center of gravity and to change the coordinates in the main scanning direction in the processing for obtaining the position error. Therefore, the position error of the pixel can be obtained in the same manner as in the case of the equal magnification, and thus the processing system can be simplified.
[0124]
2.12. Position error measurement procedure and relationship between the amount of movement of the hatched image in the main scanning direction and the pixel position error in the sub scanning direction
The procedure for measuring the position error and the relationship between the amount of movement of the hatched image in the main scanning direction and the position error of the pixel in the sub-scanning direction are described in the flowchart of FIG. 12 and the bit maps of FIGS. Since it is the same as that described with reference to the explanatory diagram showing the relationship with the window, the explanatory diagram of FIG. 16, and the tables of FIGS. 17 to 19, the description is omitted here.
[0125]
With such control, in the second embodiment, position error measurement corresponding to zooming can be performed.
[0126]
3. Third embodiment
Next, a third embodiment will be described. In this embodiment, when performing variable-magnification reading, the image forming magnification of the optical system is changed to a predetermined value, and the scanning speed in the sub-scanning direction is also changed according to the magnification. This is an improvement for mounting a function of measuring an error and correcting a position error of a pixel based on the data.
[0127]
The magnification of the optical system is changed with reference to the point A in FIG. 31 of the second embodiment, that is, even if the magnification is changed, the position corresponding to the point A on the document table is projected onto the light receiving portion of the CCD. Do not move. This change in the magnification of the optical system is performed by a driving device (not shown) that moves the position of the
[0128]
At the time of conversion to the same magnification, the magnification is changed optically with reference to A, so that the same point A is converted to the same magnification. This conversion is exactly the same as that in the first embodiment in that the magnification is converted by reading data at the same magnification and obtaining the magnification data. Since the point A is made the same size as the reference, the position of the diagonal line image returned to the same size and the position of the image when the diagonal line is read at the same magnification become the same. Therefore, the position error of the pixel can be measured in exactly the same manner as in the case of the same magnification. In this way, by converting the hatched data to the same size at the time of zooming, there is no need to change the size and position of the window according to the reading magnification, and the circuit for measuring the pixel position error can be simplified. Can be. Of course, since the image read from the original is optically scaled, it goes without saying that there is no need for image processing accompanying the scaling.
[0129]
It should be noted that components that are not described in particular are configured in the same manner as in the second embodiment and operate in the same manner, and thus redundant description will be omitted.
[0130]
By performing the processing in this manner, a processing system that measures the position error of the same pixel can be used regardless of the scaling method of the second embodiment or the scaling method of the third embodiment.
[0131]
【The invention's effect】
As is clear from the above explanation,BookAccording to the present invention, a diagonal line pattern which is provided outside the effective image area and is composed of a plurality of lines having a constant inclination with respect to the main scanning direction, and the diagonal line pattern are read together with a document placed in the effective image area. Reading means extending in the main scanning direction, setting means for setting the magnification of the original, sub-scanning means for changing the original scanning speed in the sub-scanning direction in accordance with the magnification, and the reading means obtained by the reading means Calculating means for setting a window in the image data of the oblique line pattern and calculating the center of gravity of the image data in the window; control means for controlling the movement of the window by the value of the center of gravity obtained by the calculating means; And calculating means for obtaining data of the position error of the image of each line based on the magnification and the magnification, so that the position error of the image can be accurately measured even if the magnification changes. Door can be.
[Brief description of the drawings]
FIG. 1 is an explanatory diagram illustrating a measurement principle according to a first embodiment of the present invention.
FIG. 2 is a block diagram illustrating a system configuration according to the first embodiment.
FIG. 3 is an explanatory diagram showing movement of a window and processing accompanying the measurement when a position error is measured using a plurality of oblique lines in a bit map according to the first embodiment.
FIG. 4 is an explanatory diagram showing a hatched pattern in an enlarged manner.
FIG. 5 is an explanatory diagram showing read values of a hatched pattern in FIG. 4;
FIG. 6 is an explanatory diagram showing a window for oblique line determination.
FIG. 7 is an explanatory diagram showing another diagonal line determination window.
FIG. 8 is an explanatory diagram showing a matching pattern for oblique line determination.
9 is a flowchart showing a processing procedure of a center-of-gravity measuring process of the position error measuring unit in FIG.
FIG. 10 is an explanatory diagram showing a method of measuring a read value and a center of gravity in a center of gravity measurement window.
FIG. 11 is an explanatory diagram showing the length and angle of oblique lines.
12 is a flowchart illustrating a processing procedure of a position error measurement process of the center of gravity of the position error measurement unit in FIG. 2;
FIG. 13 is an explanatory diagram showing a bitmap pattern at a magnification of 100% of an oblique line having a positional shift.
FIG. 14 is an explanatory diagram showing a bitmap pattern at a magnification of 200% of an oblique line having a positional shift.
FIG. 15 is an explanatory diagram showing a bitmap pattern at a magnification of 50% of an oblique line having a positional shift.
FIG. 16 is an explanatory diagram illustrating a relationship between a reading position and a position error in a position error calculation.
FIG. 17 is a diagram showing, in a table format, a relationship between the number of lines at the same magnification and each value obtained by each processing of
FIG. 18 is a table showing the relationship between the number of lines at a magnification of 200% and each value obtained by each processing of
FIG. 19 is a diagram showing, in a table form, a relationship between the number of lines when the magnification is 50% and each value obtained by each processing of
FIG. 20 is an explanatory diagram illustrating a measurement principle according to the second embodiment of the present invention.
FIG. 21 is a block diagram illustrating a system configuration according to a second embodiment.
FIG. 22 is an explanatory diagram showing a process for performing position error measurement when image data with oblique lines are present in a bit map according to the second embodiment.
FIG. 23 is an explanatory diagram showing movement of a window and processing accompanying the measurement when a position error is measured using a plurality of oblique lines in a bit map according to the second embodiment.
FIG. 24 is a diagram illustrating a relationship between window data and hatched patterns according to the second embodiment.
FIG. 25 is a flowchart showing a measurement processing procedure in the second embodiment.
FIG. 26 is a sectional view illustrating a schematic configuration of an image reading apparatus according to a second embodiment.
FIG. 27 is a plan view of the image reading apparatus according to the second embodiment.
FIG. 28 is an enlarged view of a portion surrounded by a two-dot chain line circle in FIG. 27;
FIG. 29 is an enlarged view in which a portion of a measurement pattern in FIG. 27 is enlarged.
FIG. 30 is an explanatory diagram showing a method of correcting a position error performed in the second embodiment.
FIG. 31 is an explanatory diagram showing the positional relationship between the image data of a pattern and the range of image data on which scaling processing of main scanning is performed and the origin in the second embodiment.
FIG. 32 is a perspective view showing a schematic configuration of a linear scale according to a conventional example.
FIG. 33 is an explanatory diagram showing a principle of detecting a linear scale according to a conventional example.
FIG. 34 is a diagram showing a method of determining the moving direction of a linear scale according to a conventional example.
[Explanation of symbols]
1 photoelectric conversion unit
2 A / D converter
3 Shading correction unit
4 Oblique line discriminator
5 Position error measurement unit
6 control unit
7 Image processing unit
8 Operation unit
9 Image scaling section
10 Error signal
11 Original image data (video signal)
12 Video control signal
a, b, L, K1, K2, K3 Oblique lines
W1, W2, W3, Wn, Wn + 1, Wn + 2, Wn + 3 window
Claims (1)
該斜線パターンを有効画像領域内に載置された原稿とともに読み取る主走査方向に延伸した読み取り手段と、
原稿の変倍率を設定する設定手段と、
副走査方向の原稿走査速度を前記変倍率に応じて変更する副走査手段と、
前記読み取り手段によって得られた前記斜線パターンの画像データにウインドウを設定してウインドウ内の画像データの重心を計算する計算手段と、
該計算手段によって得られた重心の値によりウインドウの移動を制御する制御手段と、
前記重心の値と前記変倍率とに基づき、各ラインの画像の位置誤差のデータを得る演算手段と、
を備えていることを特徴とする画像の位置誤差測定装置。A diagonal pattern, which is provided outside the effective image area and is composed of a plurality of lines having a constant inclination with respect to the main scanning direction,
Reading means extending in the main scanning direction for reading the oblique line pattern together with the document placed in the effective image area;
Setting means for setting the magnification of the original;
Sub-scanning means for changing the original scanning speed in the sub-scanning direction in accordance with the magnification,
Calculating means for setting a window in the image data of the oblique line pattern obtained by the reading means and calculating the center of gravity of the image data in the window;
Control means for controlling the movement of the window based on the value of the center of gravity obtained by the calculation means;
A calculating unit that obtains data of a position error of an image of each line based on the value of the center of gravity and the scaling factor;
An image position error measuring device, comprising:
Priority Applications (1)
| Application Number | Priority Date | Filing Date | Title |
|---|---|---|---|
| JP18541497A JP3556076B2 (en) | 1996-07-15 | 1997-07-10 | Image position error measuring device |
Applications Claiming Priority (5)
| Application Number | Priority Date | Filing Date | Title |
|---|---|---|---|
| JP18501296 | 1996-07-15 | ||
| JP19099896 | 1996-07-19 | ||
| JP8-185012 | 1996-07-19 | ||
| JP8-190998 | 1996-07-19 | ||
| JP18541497A JP3556076B2 (en) | 1996-07-15 | 1997-07-10 | Image position error measuring device |
Publications (2)
| Publication Number | Publication Date |
|---|---|
| JPH10107967A JPH10107967A (en) | 1998-04-24 |
| JP3556076B2 true JP3556076B2 (en) | 2004-08-18 |
Family
ID=27325508
Family Applications (1)
| Application Number | Title | Priority Date | Filing Date |
|---|---|---|---|
| JP18541497A Expired - Fee Related JP3556076B2 (en) | 1996-07-15 | 1997-07-10 | Image position error measuring device |
Country Status (1)
| Country | Link |
|---|---|
| JP (1) | JP3556076B2 (en) |
-
1997
- 1997-07-10 JP JP18541497A patent/JP3556076B2/en not_active Expired - Fee Related
Also Published As
| Publication number | Publication date |
|---|---|
| JPH10107967A (en) | 1998-04-24 |
Similar Documents
| Publication | Publication Date | Title |
|---|---|---|
| US6023538A (en) | Image processing apparatus, method and computer program product | |
| US6023537A (en) | Image reading apparatus using an image reading position error measuring device | |
| US5949922A (en) | Image reading apparatus | |
| JP3683375B2 (en) | Rotary encoder | |
| JP5821563B2 (en) | Image reading apparatus, image reading method, and MTF correction parameter determination method | |
| JP3556076B2 (en) | Image position error measuring device | |
| JPH118734A (en) | Image reader | |
| JPH1079836A (en) | Image reader | |
| JP3647982B2 (en) | Pixel position error measuring device and image reading device | |
| JPH1051628A (en) | Image reader | |
| JP3534920B2 (en) | Image reading device | |
| JP3647992B2 (en) | Image reading device | |
| JPH1031734A (en) | Picture reader | |
| JP3647981B2 (en) | Image reading device | |
| JP3464736B2 (en) | Pixel position error measuring device | |
| JPH1075331A (en) | Image reader | |
| JP3517764B2 (en) | Linear scale | |
| JPH1032685A (en) | Image reader | |
| JP3655383B2 (en) | Pixel position measuring method, pixel position measuring apparatus and image reading apparatus | |
| JPH1065875A (en) | Image reader | |
| JP3614271B2 (en) | Image reading device | |
| JP3464737B2 (en) | Image reading device | |
| JPH09121268A (en) | Picture element position error correction device and document scanning speed correction device | |
| JPH11164104A (en) | Image reader | |
| JPH1098584A (en) | Measurement device for picture element position error or scanning speed of original |
Legal Events
| Date | Code | Title | Description |
|---|---|---|---|
| TRDD | Decision of grant or rejection written | ||
| A01 | Written decision to grant a patent or to grant a registration (utility model) |
Free format text: JAPANESE INTERMEDIATE CODE: A01 Effective date: 20040427 |
|
| A61 | First payment of annual fees (during grant procedure) |
Free format text: JAPANESE INTERMEDIATE CODE: A61 Effective date: 20040511 |
|
| FPAY | Renewal fee payment (event date is renewal date of database) |
Free format text: PAYMENT UNTIL: 20080521 Year of fee payment: 4 |
|
| FPAY | Renewal fee payment (event date is renewal date of database) |
Free format text: PAYMENT UNTIL: 20090521 Year of fee payment: 5 |
|
| FPAY | Renewal fee payment (event date is renewal date of database) |
Free format text: PAYMENT UNTIL: 20100521 Year of fee payment: 6 |
|
| FPAY | Renewal fee payment (event date is renewal date of database) |
Free format text: PAYMENT UNTIL: 20110521 Year of fee payment: 7 |
|
| FPAY | Renewal fee payment (event date is renewal date of database) |
Free format text: PAYMENT UNTIL: 20120521 Year of fee payment: 8 |
|
| FPAY | Renewal fee payment (event date is renewal date of database) |
Free format text: PAYMENT UNTIL: 20120521 Year of fee payment: 8 |
|
| FPAY | Renewal fee payment (event date is renewal date of database) |
Free format text: PAYMENT UNTIL: 20130521 Year of fee payment: 9 |
|
| LAPS | Cancellation because of no payment of annual fees |