JP2023106295A - Stabilization of the manufacturing process of the specimen by shape analysis of the structural elements of the specimen - Google Patents
Stabilization of the manufacturing process of the specimen by shape analysis of the structural elements of the specimen Download PDFInfo
- Publication number
- JP2023106295A JP2023106295A JP2022183388A JP2022183388A JP2023106295A JP 2023106295 A JP2023106295 A JP 2023106295A JP 2022183388 A JP2022183388 A JP 2022183388A JP 2022183388 A JP2022183388 A JP 2022183388A JP 2023106295 A JP2023106295 A JP 2023106295A
- Authority
- JP
- Japan
- Prior art keywords
- contour
- data
- signal
- periodicity
- information
- Prior art date
- Legal status (The legal status is an assumption and is not a legal conclusion. Google has not performed a legal analysis and makes no representation as to the accuracy of the status listed.)
- Pending
Links
Images


Classifications
-
- G—PHYSICS
- G01—MEASURING; TESTING
- G01B—MEASURING LENGTH, THICKNESS OR SIMILAR LINEAR DIMENSIONS; MEASURING ANGLES; MEASURING AREAS; MEASURING IRREGULARITIES OF SURFACES OR CONTOURS
- G01B21/00—Measuring arrangements or details thereof, where the measuring technique is not covered by the other groups of this subclass, unspecified or not relevant
- G01B21/20—Measuring arrangements or details thereof, where the measuring technique is not covered by the other groups of this subclass, unspecified or not relevant for measuring contours or curvatures, e.g. determining profile
-
- G—PHYSICS
- G06—COMPUTING OR CALCULATING; COUNTING
- G06T—IMAGE DATA PROCESSING OR GENERATION, IN GENERAL
- G06T7/00—Image analysis
- G06T7/0002—Inspection of images, e.g. flaw detection
- G06T7/0004—Industrial image inspection
- G06T7/0006—Industrial image inspection using a design-rule based approach
-
- G—PHYSICS
- G01—MEASURING; TESTING
- G01B—MEASURING LENGTH, THICKNESS OR SIMILAR LINEAR DIMENSIONS; MEASURING ANGLES; MEASURING AREAS; MEASURING IRREGULARITIES OF SURFACES OR CONTOURS
- G01B11/00—Measuring arrangements characterised by the use of optical techniques
- G01B11/24—Measuring arrangements characterised by the use of optical techniques for measuring contours or curvatures
-
- G—PHYSICS
- G01—MEASURING; TESTING
- G01B—MEASURING LENGTH, THICKNESS OR SIMILAR LINEAR DIMENSIONS; MEASURING ANGLES; MEASURING AREAS; MEASURING IRREGULARITIES OF SURFACES OR CONTOURS
- G01B15/00—Measuring arrangements characterised by the use of electromagnetic waves or particle radiation, e.g. by the use of microwaves, X-rays, gamma rays or electrons
- G01B15/04—Measuring arrangements characterised by the use of electromagnetic waves or particle radiation, e.g. by the use of microwaves, X-rays, gamma rays or electrons for measuring contours or curvatures
-
- G—PHYSICS
- G01—MEASURING; TESTING
- G01N—INVESTIGATING OR ANALYSING MATERIALS BY DETERMINING THEIR CHEMICAL OR PHYSICAL PROPERTIES
- G01N21/00—Investigating or analysing materials by the use of optical means, i.e. using sub-millimetre waves, infrared, visible or ultraviolet light
- G01N21/84—Systems specially adapted for particular applications
- G01N21/88—Investigating the presence of flaws or contamination
- G01N21/95—Investigating the presence of flaws or contamination characterised by the material or shape of the object to be examined
-
- G—PHYSICS
- G01—MEASURING; TESTING
- G01N—INVESTIGATING OR ANALYSING MATERIALS BY DETERMINING THEIR CHEMICAL OR PHYSICAL PROPERTIES
- G01N23/00—Investigating or analysing materials by the use of wave or particle radiation, e.g. X-rays or neutrons, not covered by groups G01N3/00 – G01N17/00, G01N21/00 or G01N22/00
- G01N23/22—Investigating or analysing materials by the use of wave or particle radiation, e.g. X-rays or neutrons, not covered by groups G01N3/00 – G01N17/00, G01N21/00 or G01N22/00 by measuring secondary emission from the material
- G01N23/225—Investigating or analysing materials by the use of wave or particle radiation, e.g. X-rays or neutrons, not covered by groups G01N3/00 – G01N17/00, G01N21/00 or G01N22/00 by measuring secondary emission from the material using electron or ion
- G01N23/2251—Investigating or analysing materials by the use of wave or particle radiation, e.g. X-rays or neutrons, not covered by groups G01N3/00 – G01N17/00, G01N21/00 or G01N22/00 by measuring secondary emission from the material using electron or ion using incident electron beams, e.g. scanning electron microscopy [SEM]
-
- G—PHYSICS
- G01—MEASURING; TESTING
- G01Q—SCANNING-PROBE TECHNIQUES OR APPARATUS; APPLICATIONS OF SCANNING-PROBE TECHNIQUES, e.g. SCANNING PROBE MICROSCOPY [SPM]
- G01Q60/00—Particular types of SPM [Scanning Probe Microscopy] or microscopes; Essential components thereof
- G01Q60/24—AFM [Atomic Force Microscopy] or apparatus therefor, e.g. AFM probes
-
- G—PHYSICS
- G06—COMPUTING OR CALCULATING; COUNTING
- G06T—IMAGE DATA PROCESSING OR GENERATION, IN GENERAL
- G06T7/00—Image analysis
- G06T7/60—Analysis of geometric attributes
- G06T7/64—Analysis of geometric attributes of convexity or concavity
-
- H—ELECTRICITY
- H10—SEMICONDUCTOR DEVICES; ELECTRIC SOLID-STATE DEVICES NOT OTHERWISE PROVIDED FOR
- H10P—GENERIC PROCESSES OR APPARATUS FOR THE MANUFACTURE OR TREATMENT OF DEVICES COVERED BY CLASS H10
- H10P74/00—Testing or measuring during manufacture or treatment of wafers, substrates or devices
- H10P74/20—Testing or measuring during manufacture or treatment of wafers, substrates or devices characterised by the properties tested or measured, e.g. structural or electrical properties
- H10P74/203—Structural properties, e.g. testing or measuring thicknesses, line widths, warpage, bond strengths or physical defects
-
- G—PHYSICS
- G01—MEASURING; TESTING
- G01B—MEASURING LENGTH, THICKNESS OR SIMILAR LINEAR DIMENSIONS; MEASURING ANGLES; MEASURING AREAS; MEASURING IRREGULARITIES OF SURFACES OR CONTOURS
- G01B2210/00—Aspects not specifically covered by any group under G01B, e.g. of wheel alignment, caliper-like sensors
- G01B2210/56—Measuring geometric parameters of semiconductor structures, e.g. profile, critical dimensions or trench depth
-
- G—PHYSICS
- G06—COMPUTING OR CALCULATING; COUNTING
- G06T—IMAGE DATA PROCESSING OR GENERATION, IN GENERAL
- G06T2207/00—Indexing scheme for image analysis or image enhancement
- G06T2207/10—Image acquisition modality
- G06T2207/10056—Microscopic image
- G06T2207/10061—Microscopic image from scanning electron microscope
-
- G—PHYSICS
- G06—COMPUTING OR CALCULATING; COUNTING
- G06T—IMAGE DATA PROCESSING OR GENERATION, IN GENERAL
- G06T2207/00—Indexing scheme for image analysis or image enhancement
- G06T2207/30—Subject of image; Context of image processing
- G06T2207/30108—Industrial image inspection
- G06T2207/30148—Semiconductor; IC; Wafer
Landscapes
- Physics & Mathematics (AREA)
- General Physics & Mathematics (AREA)
- Engineering & Computer Science (AREA)
- General Health & Medical Sciences (AREA)
- Health & Medical Sciences (AREA)
- Chemical & Material Sciences (AREA)
- Biochemistry (AREA)
- Analytical Chemistry (AREA)
- Immunology (AREA)
- Pathology (AREA)
- Life Sciences & Earth Sciences (AREA)
- Theoretical Computer Science (AREA)
- Computer Vision & Pattern Recognition (AREA)
- Geometry (AREA)
- Electromagnetism (AREA)
- Nuclear Medicine, Radiotherapy & Molecular Imaging (AREA)
- Radiology & Medical Imaging (AREA)
- Quality & Reliability (AREA)
- Image Analysis (AREA)
- Testing Or Measuring Of Semiconductors Or The Like (AREA)
Abstract
【課題】試験体の検査を自動化すること。【解決手段】検査ツールによって取得された半導体試験体の要素の輪郭に関する情報を与えるデータDcontourを取得するステップと、データDcontourを使用して、要素の輪郭の曲率に関する情報を与える信号を生成するステップと、信号の周期性に関する情報を与えるデータDperiodicity、および信号の不連続部の数に関する情報を与えるデータDdiscontinuitiesであり、それぞれの不連続部が、輪郭の凸部と輪郭の凹部の間の遷移に関する情報を与える、データDdiscontinuitiesのうちの少なくとも一方を決定するステップと、データDperiodicityおよびデータDdiscontinuitiesのうちの少なくとも一方を使用して、要素の正しい製造に関する情報を与えるデータを決定するステップとを含むシステムおよび方法が提供される。【選択図】図2AAn object of the present invention is to automate the inspection of a specimen. The method includes obtaining data Dcontour that provides information about the contour of an element of a semiconductor specimen acquired by an inspection tool, and using the data Dcontour to generate a signal that gives information about the curvature of the contour of the element. , data Dperiodicity giving information about the periodicity of the signal, and data Ddiscontinuities giving information about the number of discontinuities in the signal, each discontinuity relating to the transition between a convex part of the contour and a concave part of the contour. determining at least one of data Ddiscontinuities that provide information; and using at least one of data Dperiodicity and data Ddiscontinuities to determine data that provides information regarding correct manufacturing of the element; and A method is provided. [Selection drawing] Fig. 2A
Description
本明細書に開示された主題は、一般に試験体(specimen)の検査(examination)の分野に関し、より詳細には、試験体の検査を自動化することに関する。 TECHNICAL FIELD The subject matter disclosed herein relates generally to the field of specimen examination, and more particularly to automating specimen examination.
製造されたデバイスの超大規模集積に関連した高い密度および高い性能に対する現在の要求には、1μm未満の特徴、トランジスタおよび回路速度の増大、ならびに信頼性の向上が必要である。このような要求には、高い精度および高い均一性を有するデバイス特徴の形成が必要であり、そのようなデバイス特徴の形成には、デバイスがまだ半導体ウエハの形態にある間のデバイスの自動化された検査を含む、製造プロセスの注意深いモニタリングが必要である。 Current demands for high density and high performance associated with ultra-large scale integration of manufactured devices require sub-micron features, increasing transistor and circuit speeds, and improved reliability. Such demands require the formation of device features with high precision and high uniformity, which requires automated processing of the devices while they are still in semiconductor wafer form. Careful monitoring of the manufacturing process, including inspection, is required.
検査プロセスは、試験体の欠陥を検出および分類するために半導体製造中のさまざまなステップで使用されている。例えば自動欠陥分類(Automatic Defect Classification)(ADC)、自動欠陥レビュー(Automatic Defect Review)(ADR)などとしてプロセスを自動化することにより、検査の有効性を増大させることができる。 Inspection processes are used at various steps during semiconductor manufacturing to detect and classify defects in specimens. Inspection effectiveness can be increased by automating processes such as, for example, Automatic Defect Classification (ADC), Automatic Defect Review (ADR), and the like.
本明細書に開示された主題のある態様によれば、半導体試験体の検査システムが提供され、このシステムはプロセッサおよびメモリ回路(processor and memory circuitry)(PMC)を備え、このPMCは、検査ツールによって取得された半導体試験体の要素の輪郭(contour)に関する情報を与えるデータDcontourを取得し、データDcontourを使用して、要素の輪郭の曲率に関する情報を与える信号を生成し、この信号の周期性(periodicity)に関する情報を与えるデータDperiodicity、およびこの信号の不連続部(discontinuity)の数に関する情報を与えるデータDdiscontinuitiesであり、それぞれの不連続部が、輪郭の凸部と輪郭の凹部の間の遷移に関する情報を与える、データDdiscontinuitiesのうちの少なくとも一方を決定し、データDperiodicityおよびデータDdiscontinuitiesのうちの少なくとも一方を使用して、要素の正しい製造(correct manufacturing)に関する情報を与えるデータを決定するように構成されている。 According to certain aspects of the subject matter disclosed herein, an inspection system for semiconductor specimens is provided, the system comprising a processor and memory circuit (PMC), the PMC comprising an inspection tool obtaining data D contour giving information about the contour of the element of the semiconductor test piece obtained by and using the data D contour to generate a signal giving information about the curvature of the element contour; data D periodicity giving information about the periodicity, and data D discontinuities giving information about the number of discontinuities in this signal, each discontinuity being a convex part of the contour and a concave part of the contour. determining at least one of data D discontinuities that provide information about transitions between and using at least one of data D periodicity and data D discontinuities to provide information about correct manufacturing of the element configured to determine data;
いくつかの実施形態によれば、要素の輪郭が、期待される形状を有し、このシステムが、Dperiodicityを使用して、輪郭と期待される形状とは異なる形状との類似性(similarity)に関する情報を与えるデータを決定するように構成されている。 According to some embodiments, the contour of the element has an expected shape, and the system uses D periodicity to determine the similarity between the contour and a shape different from the expected shape. is configured to determine data that provides information about the
いくつかの実施形態によれば、この形状が多角形である。 According to some embodiments, this shape is a polygon.
いくつかの実施形態によれば、この形状が、頂点の数Nを有する多角形であり、この信号の周期性と数Nとの間の一致性(correpondence)が高いほど類似性も高い。 According to some embodiments, the shape is a polygon with number N of vertices, and the higher the correspondence between the periodicity of the signal and the number N, the higher the similarity.
いくつかの実施形態によれば、このシステムが、データDdiscontinuitiesを使用して、要素の輪郭の曲がりくねり(curliness)に関する情報を与えるデータを生成するように構成されている。 According to some embodiments, the system is configured to use the data D discontinuities to generate data giving information about the curvature of the contour of the element.
いくつかの実施形態によれば、要素の輪郭の曲率に関する情報を与える信号が、要素の輪郭の曲率の変動に関する情報を与える。 According to some embodiments, the signal giving information about the curvature of the contour of the element gives information about the variation of the curvature of the contour of the element.
いくつかの実施形態によれば、要素の輪郭の曲率に関する情報を与える信号が、輪郭の法線の方向の、輪郭に沿った進展(evolution)に関する情報を与える。 According to some embodiments, the signal giving information about the curvature of the contour of the element gives information about the evolution along the contour in the direction of the normal of the contour.
いくつかの実施形態によれば、このシステムが、しきい値よりも大きな振幅を有する信号の不連続部を検出して、Ddiscontinuitiesを生成するように構成されている。 According to some embodiments, the system is configured to detect discontinuities in the signal having an amplitude greater than a threshold to generate D discontinuities .
いくつかの実施形態によれば、このシステムが、データDperiodicityを使用して、輪郭と第1の形状との類似性に関する情報を与える第1のスコアと、輪郭と第2の形状との類似性に関する情報を与える第2のスコアであり、第2の形状が第1の形状とは異なる、第2のスコアと、第1のスコアおよび第2のスコアに基づく集約スコア(aggregated score)とを生成するように構成されている。 According to some embodiments, the system uses the data D periodicity to obtain a first score that provides information about the similarity between the contour and the first shape, and the similarity between the contour and the second shape. a second score that is gender-informative, where the second shape is different from the first shape; and an aggregated score based on the first score and the second score. configured to generate
いくつかの実施形態によれば、データDperiodicityが、周期性が第1の数N1に等しい見通し(prospect)P1と、周期性が第2の数N2に等しい見通しP2であり、N2がN1とは異なる、見通しP2とを含む。 According to some embodiments, the data D periodicity are prospect P 1 with periodicity equal to the first number N 1 and prospect P 2 with periodicity equal to the second number N 2 , Perspective P2 , where N2 is different from N1 .
いくつかの実施形態によれば、このシステムが、第1の見通しP1を使用して、輪郭と第1の形状との類似性に関する情報を与える第1のスコアを生成し、第2の見通しP2を使用して、輪郭と第2の形状との類似性に関する情報を与える第2のスコアであり、第2の形状が第1の形状とは異なる、第2のスコアを生成するように構成されている。 According to some embodiments, the system uses the first perspective P 1 to generate a first score that provides information about the similarity of the contour to the first shape, and the second perspective P 1 . P2 is used to generate a second score that gives information about the similarity between the contour and the second shape, where the second shape is different from the first shape. It is configured.
いくつかの実施形態によれば、第1の形状が、頂点の数N1を有する多角形であり、第2の形状が、頂点の数N2を有する多角形である。 According to some embodiments, the first shape is a polygon with a number of vertices N 1 and the second shape is a polygon with a number of vertices N 2 .
いくつかの実施形態によれば、このシステムが、要素の輪郭に沿った複数の位置のうちの所与のそれぞれの位置について、その所与の位置における輪郭の法線、およびその所与の位置から要素の重心へ向かう方向を決定し、所与のそれぞれの位置について、法線と方向との間の角度差に関する情報を与えるデータを生成し、このデータを使用して、要素の輪郭の曲率に関する情報を与える信号を取得するように構成されている。 According to some embodiments, the system determines, for each given one of a plurality of positions along the contour of the element, the normal of the contour at that given position and the toward the centroid of the element, and for each given position generate data that gives information about the angular difference between the normal and the direction, and use this data to calculate the curvature of the contour of the element is configured to obtain a signal that provides information about the
いくつかの実施形態によれば、このシステムが、要素の輪郭の曲率に関する情報を与える信号を周波数ドメインの信号に変換し、この周波数ドメインの信号を使用してDperiodicityを決定するように構成されている。 According to some embodiments, the system is configured to transform a signal giving information about the curvature of the contour of the element into a frequency domain signal and use the frequency domain signal to determine D periodicity . ing.
本明細書に開示された主題のある態様によれば、半導体試験体の検査方法が提供され、この方法は、プロセッサおよびメモリ回路(PMC)によって、検査ツールによって取得された半導体試験体の要素の輪郭に関する情報を与えるデータDcontourを取得するステップと、データDcontourを使用して、要素の輪郭の曲率に関する情報を与える信号を生成するステップと、この信号の周期性に関する情報を与えるデータDperiodicity、およびこの信号の不連続部の数に関する情報を与えるデータDdiscontinuitiesであり、それぞれの不連続部が、輪郭の凸部と輪郭の凹部の間の遷移に関する情報を与える、データDdiscontinuitiesのうちの少なくとも一方を決定するステップと、データDperiodicityおよびデータDdiscontinuitiesのうちの少なくとも一方を使用して、要素の正しい製造に関する情報を与えるデータを決定するステップとを含む。 According to certain aspects of the presently disclosed subject matter, there is provided a method of inspecting a semiconductor specimen, the method comprising, by a processor and memory circuit (PMC), inspecting an element of the semiconductor specimen obtained by an inspection tool; obtaining data D contour giving information about the contour; using the data D contour to generate a signal giving information about the curvature of the contour of the element; data D periodicity giving information about the periodicity of this signal. , and data D discontinuities giving information about the number of discontinuities in this signal, each discontinuity giving information about the transition between a convex contour and a concave contour. determining at least one; and using at least one of data D periodicity and data D discontinuities to determine data that provides information regarding correct manufacturing of the component.
いくつかの実施形態によれば、要素の輪郭が、期待される形状を有し、この方法が、Dperiodicityを使用して、輪郭と期待される形状とは異なる形状との類似性に関する情報を与えるデータを決定するステップを含む。 According to some embodiments, the contour of the element has an expected shape, and the method uses D periodicity to provide information about the similarity of the contour to shapes other than the expected shape. determining the data to be provided;
いくつかの実施形態によれば、この形状が、頂点の数Nを有する多角形であり、この信号の周期性と数Nとの間の一致性が高いほど類似性も高い。 According to some embodiments, the shape is a polygon with number N of vertices, and the higher the correspondence between the periodicity of this signal and the number N, the higher the similarity.
いくつかの実施形態によれば、この方法が、データDdiscontinuitiesを使用して、要素の輪郭の曲がりくねりに関する情報を与えるデータを生成するステップを含む。 According to some embodiments, the method includes using data D discontinuities to generate data that provides information about contour undulations of the element.
いくつかの実施形態によれば、この方法が、要素の輪郭に沿った複数の位置のうちの所与のそれぞれの位置について、その所与の位置における輪郭の法線、およびその所与の位置から要素の重心へ向かう方向を決定するステップと、所与のそれぞれの位置について、法線と方向との間の角度差に関する情報を与えるデータを生成するステップと、このデータを使用して、要素の輪郭の曲率に関する情報を与える信号を取得するステップとを含む。 According to some embodiments, the method includes, for each given one of a plurality of positions along the contour of the element, the normal of the contour at that given position and the toward the centroid of the element; generating data, for each given position, that gives information about the angular difference between the normal and the direction; obtaining a signal that provides information about the curvature of the contour of the .
いくつかの実施形態によれば、この方法が、上記のシステムに関して説明した特徴のうちの1つまたは複数を実施することができる。 According to some embodiments, the method may implement one or more of the features described with respect to the system above.
本明細書に開示された主題のある態様によれば、命令を含む非一過性コンピュータ可読媒体が提供され、この命令は、プロセッサおよびメモリ回路(PMC)によって実行されたときに、上記の方法をPMCに実行させる。 According to certain aspects of the presently disclosed subject matter, there is provided a non-transitory computer-readable medium containing instructions that, when executed by a processor and memory circuit (PMC), perform the above method. is executed by the PMC.
いくつかの実施形態によれば、提案した解決策は、試験体の要素の製造プロセスの異常を効率的かつロバストに決定することを可能にする。具体的には、提案した解決策を使用して要素の製造プロセスを安定させることができる。 According to some embodiments, the proposed solution allows efficient and robust determination of manufacturing process anomalies of the elements of the specimen. Specifically, the proposed solution can be used to stabilize the manufacturing process of the element.
いくつかの実施形態によれば、提案した解決策は、構造要素が、どの程度、期待される形状とは異なる形状に従って製造されているのかを正確かつ効率的に決定することを可能にする。具体的には、いくつかの実施形態によれば、要素とこの形状との類似性に関する情報を与えるデータが提供される。したがって、要素と1つまたは複数の形状との類似性を定量化することができる。このことは、製造プロセスに対しておよび/または試験体に対してどの是正処置をとるべきかをユーザが判断することを可能にする。 According to some embodiments, the proposed solution makes it possible to accurately and efficiently determine to what extent a structural element is manufactured according to a shape that deviates from the expected shape. Specifically, according to some embodiments, data is provided that gives information about the similarity of an element to this shape. Therefore, the similarity between an element and one or more shapes can be quantified. This allows the user to determine what corrective action to take on the manufacturing process and/or on the specimen.
いくつかの実施形態によれば、提案した解決策は、参照画像を使用することを必要とせず、単一の画像に基づいて機能することができる。いくつかの実施形態によれば、提案した解決策は、フレキシブルであり、要素のさまざまなタイプの製造プロセスに適合させることができる。いくつかの実施形態によれば、提案した解決策は、構造要素と1つまたは複数の所定の形状との間の類似性を測定する1つまたは複数の所定の形状をユーザが選択することを可能にする。 According to some embodiments, the proposed solution does not require using a reference image and can work based on a single image. According to some embodiments, the proposed solution is flexible and can be adapted to manufacturing processes for different types of elements. According to some embodiments, the proposed solution allows the user to select one or more predefined shapes that measure the similarity between the structural element and the one or more predefined shapes. enable.
いくつかの実施形態によれば、提案した解決策は、要素の輪郭の曲がりくねりおよび/またはプロセス変動を検出することを可能にする。 According to some embodiments, the proposed solution makes it possible to detect contour tortuosity and/or process variations of elements.
いくつかの実施形態によれば、提案した解決策は、NAND層の正しい製造を効率的かつ正確に判定することを可能にする。 According to some embodiments, the proposed solution allows efficient and accurate determination of correct fabrication of NAND layers.
いくつかの実施形態によれば、提案した解決策は数値的に効率的である。具体的には、提案した解決策は、生産環境で高速に実行することができる。 According to some embodiments, the proposed solution is numerically efficient. Specifically, the proposed solution can be run fast in a production environment.
いくつかの実施形態によれば、提案した解決策はロバストである。 According to some embodiments, the proposed solution is robust.
次に、本開示を理解するため、および本開示を実際にどのように実施することができるのかを知るために、添付図面を参照して実施形態を、単なる非限定的な例として説明する。 In order to understand the present disclosure and to see how it can be implemented in practice, embodiments will now be described, by way of non-limiting example only, with reference to the accompanying drawings.
以下の詳細な説明では、本開示の完全な理解を提供するために多数の特定の詳細が示される。しかしながら、それらの特定の詳細なしでも本明細書に開示された主題を実施することができることを当業者は理解するであろう。他の例として、本明細書に開示された主題を不明瞭にすることがないように、よく知られた方法、手順、構成要素および回路は詳細には説明されていない。 In the following detailed description numerous specific details are set forth in order to provide a thorough understanding of the present disclosure. However, it will be understood by those skilled in the art that the subject matter disclosed herein may be practiced without these specific details. In other instances, well-known methods, procedures, components and circuits have not been described in detail so as not to obscure the subject matter disclosed herein.
以下の議論から明らかなとおり、そうではないと特に明示されていない限り、本明細書の全体を通じて、「使用する」、「取得する」、「決定する」、「生成する」、「検出する」、「変換する」などの用語を利用した議論は、データを操作しかつ/またはデータを他のデータに変換するコンピュータの動作および/または処理に関することが理解される。前記データは電子量などの物理量として表され、かつ/または前記データは物理的物体を表す。用語「コンピュータ」は、本出願に開示されたシステム103およびシステム103の対応するそれぞれの部分を非限定的な例として含む、(プロセッサおよびメモリ回路などの)データ処理機能を有するハードウェアベースの任意の種類の電子装置を包含すると拡張的に解釈すべきである。
As will be clear from the discussion below, throughout this specification, unless otherwise specified, the terms "use", "obtain", "determine", "generate", "detect" , “transform,” etc., are understood to relate to computer operations and/or processes that manipulate data and/or transform data into other data. Said data are represented as physical quantities, such as electronic quantities, and/or said data represent physical objects. The term "computer" refers to any hardware-based device having data processing capabilities (such as a processor and memory circuits), including as
本明細書で使用されている用語「非一過性メモリ」は、本明細書に開示された主題に適した任意の揮発性または不揮発性コンピュータメモリを包含すると拡張的に解釈すべきである。 As used herein, the term "non-transitory memory" should be interpreted expansively to encompass any volatile or non-volatile computer memory suitable for the subject matter disclosed herein.
本明細書で使用されている用語「試験体」は、半導体集積回路、磁気ヘッド、フラットパネルディスプレイおよび他の半導体で製造された物品を製造するために使用される任意の種類のウエハ、マスクおよび他の構造体、これらの組合せならびに/またはこれらの部分を包含すると拡張的に解釈すべきである。 As used herein, the term "specimen" refers to any type of wafer, mask, and wafer used to manufacture semiconductor integrated circuits, magnetic heads, flat panel displays, and other semiconductor-manufactured articles. It should be interpreted expansively to include other structures, combinations thereof and/or portions thereof.
本明細書で使用されている用語「検査」は、計測に関係した任意の種類の操作、ならびに試験体の製造中に試験体の欠陥を検出および/または分類することに関係した操作を包含すると拡張的に解釈すべきである。検査は、検査対象の試験体の製造中または製造後に非破壊検査ツールを使用することによって提供される。非限定的な例として、検査プロセスは、同じまたは異なる検査ツールを使用して試験体もしくは試験体の部分に関して提供される、実行時走査(1回もしくは多数回の走査)、サンプリング、レビュー、測定、分類および/または他の操作を含むことができる。同様に、検査は、検査対象の試験体を製造する前に提供することもでき、例えば、検査レシピおよび/または他の準備操作を生成することを含むことができる。そうではないと特に明示されていない限り、本明細書で使用されている用語「検査」またはその派生語は、検査エリアの分解能またはサイズに関して限定されないことに留意されたい。さまざまな非破壊検査ツールは、非限定的な例として、走査電子顕微鏡、原子間力顕微鏡、光学検査ツールなどを含む。 As used herein, the term "inspection" is intended to encompass any type of operation related to metrology, as well as operations related to detecting and/or classifying defects in a specimen during manufacture of the specimen. should be interpreted expansively. Inspection is provided by using non-destructive inspection tools during or after the manufacture of the specimen to be inspected. As a non-limiting example, an inspection process may include run-time scanning (single or multiple scans), sampling, reviewing, measuring, etc. provided on a specimen or portion of a specimen using the same or different inspection tools. , sorting and/or other operations. Similarly, inspection may be provided prior to manufacturing the specimen to be inspected, and may include, for example, generating inspection recipes and/or other preparatory operations. Note that unless specifically stated otherwise, the term "inspection" or its derivatives as used herein is not limited with respect to the resolution or size of the inspection area. Various non-destructive inspection tools include, by way of non-limiting example, scanning electron microscopes, atomic force microscopes, optical inspection tools, and the like.
そうではないと特に明示されていない限り、別々の実施形態の文脈で説明された、本明細書に開示された主題のある特徴を、単一の実施形態において組み合わせて提供することもできることが理解される。反対に、単一の実施形態の文脈で説明された、本明細書に開示された主題のさまざまな特徴を、別個に提供することまたは適当な任意の下位組合せ(sub-combination)で提供することもできる。以下の詳細な説明では、これらの方法および装置の徹底的な理解を提供するために、多数の特定の詳細が示される。 It is understood that certain features of the subject matter disclosed in this specification that are described in the context of separate embodiments may also be provided in combination in a single embodiment, unless expressly stated to the contrary. be done. To the contrary, various features of the presently disclosed subject matter that are described in the context of a single embodiment may be provided separately or in any suitable sub-combination. can also In the following detailed description, numerous specific details are set forth in order to provide a thorough understanding of these methods and apparatus.
このことに留意して図1に注目する。図1は、本明細書に開示された主題のある実施形態による検査システムの機能ブロック図を示している。試験体製造プロセスの部分として、図1に示された検査システム100を使用して、試験体(例えばウエハおよび/またはウエハの部分)を検査することができる。図示の検査システム100は、試験体製造中に取得された画像を使用して計測に関係した情報を自動的に決定することができるコンピュータベースのシステム103を備える。システム103は、1つもしくは複数の低分解能検査ツール101、および/または1つもしくは複数の高分解能検査ツール102、および/または他の検査ツールに動作可能に接続されたものとすることができる。これらの検査ツールは、画像を捕捉し、かつ/または捕捉された画像をレビューし、かつ/または捕捉した画像に関係した測定を可能にしもしくは提供するように構成されている。
With this in mind, attention is directed to FIG. FIG. 1 illustrates a functional block diagram of an inspection system according to certain embodiments of the subject matter disclosed herein. As part of the specimen manufacturing process, the
システム103は、プロセッサおよびメモリ回路(PMC)104を含む。後にさらに詳説するように、PMC104は、システム103を動作させるのに必要な全ての処理を提供するように構成されており(システム103によって少なくとも部分的に実行することができる、図2A、3A、5および7で説明する方法を参照されたい)、プロセッサ(別個には示されていない)およびメモリ(別個には示されていない)を含む。
システム103は、入力データを受け取るように構成されている。入力データは、検査ツールによって生成されたデータ(および/またはそれらのデータの派生物および/またはそれらのデータに関連したメタデータ)を含むことができる。入力データは、画像(例えば捕捉された画像、捕捉された画像から導き出された画像、シミュレートされた画像、合成画像など)、および関連する数値データ(例えばメタデータ、手動で入力された属性など)を含むことができることに留意されたい。さらに、画像データは、関心の層および/または試験体の他の1つもしくは複数の層に関係したデータを含むことができることに留意されたい。
非限定的な例として、1つまたは複数の低分解能検査機101(例えば光学検査システム、低分解能SEMなど)によって試験体を検査することができる。試験体の低分解能画像に関する情報を与える結果として生じるデータ(以後、低分解能画像データ121と呼ぶ)は、直接にまたは1つもしくは複数の中間システムを介してシステム103に送信することができる。その代わりにまたはそれに加えて、高分解能機102(例えば走査電子顕微鏡(SEM)または原子間力顕微鏡法(AFM))によって試験体を検査することもできる。試験体の高分解能画像に関する情報を与える結果として生じるデータ(以後、高分解能画像データ122と呼ぶ)は、直接にまたは1つもしくは複数の中間システムを介してシステム103に送信することができる。いくつかの実施形態によれば、この検査機が、半導体ウエハ上に形成された微細パターンの寸法を測定するための測長走査電子顕微鏡(Critical Dimension Scanning Electron Microscope)(CD-SEM)である。
As a non-limiting example, the specimen can be inspected by one or more low resolution inspection machines 101 (eg, optical inspection system, low resolution SEM, etc.). The resulting data that provides information about the low-resolution image of the specimen (hereinafter referred to as low-resolution image data 121) can be sent to
画像データは、その画像データに関連したメタデータ(例えばピクセルサイズ、欠陥タイプのテキスト記述、画像捕捉プロセスのパラメータなど)と一緒に受け取り、処理することができることに留意されたい。 Note that image data can be received and processed along with metadata associated with the image data (eg, pixel size, textual description of defect type, parameters of the image capture process, etc.).
入力データ(例えば低分解能画像データおよび/または高分解能画像データ、ならびに任意選択で例えば設計データ、合成データなどの他のデータ)を処理した後、システム103は、結果をいずれかの検査ツールに送信すること、結果をストレージシステム107に記憶すること、結果をGUI108によってレンダリングすること、および/または結果を外部システム(例えばFABのイールドマネジメントシステム(Yield Management System))に送信することができる。
After processing the input data (e.g., low resolution image data and/or high resolution image data, and optionally other data such as design data, synthetic data, etc.),
本明細書に開示された主題の教示は図1に示されたシステムによって拘束されないこと、ならびに等価の機能および/または修正された機能を、別のやり方で統合または分割することができ、ソフトウェアとファームウェアおよび/またはソフトウェアとハードウェアの適切な任意の組合せで実施することができることを当業者は容易に理解するであろう。 The teachings of the subject matter disclosed herein are not bound by the system shown in FIG. 1, and equivalent and/or modified functionality may be otherwise integrated or divided into software and Those skilled in the art will readily appreciate that the implementation may be in any suitable combination of hardware and/or firmware and/or software.
本開示の範囲をいかなる形であれ限定することなく、これらの検査ツールを、光学撮像機、電子ビーム検査機などのさまざまなタイプの検査機として実施することができることにも留意されたい。いくつかのケースでは、同じ検査ツールが、低分解能画像データおよび高分解能画像データを提供することができる。いくつかのケースでは、少なくとも1つの検査ツールが計測能力を有することができる。 It should also be noted that these inspection tools can be implemented as various types of inspection machines, such as optical imagers, electron beam inspection machines, etc., without in any way limiting the scope of this disclosure. In some cases, the same inspection tool can provide low resolution image data and high resolution image data. In some cases, at least one inspection tool can have metrology capabilities.
図1に示された検査システムは、分散コンピューティング環境で実施することができ、分散コンピューティング環境では、図1に示された上述の機能モジュールを、いくつかのローカルおよび/またはリモートデバイス上に分散することができ、通信ネットワークを介してリンクすることができることに留意されたい。システム103は、検査ツールとともに使用される独立型コンピュータとして実施することができる。あるいは、システムの対応するそれぞれの機能を、少なくとも部分的に、1つまたは複数の検査ツールと統合することもできる。
The inspection system shown in FIG. 1 may be implemented in a distributed computing environment, where the functional modules described above shown in FIG. 1 are distributed on several local and/or remote devices. Note that they can be distributed and linked via a communication network.
次に図2Aに注目する。この方法は、半導体試験体の画像を取得すること(操作200)を含む。この画像は、検査ツール101および/または102などの検査ツールによって取得することができる。いくつかの実施形態ではこの検査ツールが計測ツールである。
Attention is now directed to FIG. 2A. The method includes acquiring an image of a semiconductor specimen (operation 200). This image may be acquired by an inspection tool such as
この試験体は1つまたは複数の要素(例えば構造要素)を含む。要素の例は例えばコンタクト、トランジスタ、ゲートなどを含む。これらの例に限定されるわけではない。 The specimen includes one or more elements (eg, structural elements). Examples of elements include, for example, contacts, transistors, gates, and the like. It is not limited to these examples.
この方法は、この画像中に存在する試験体の少なくとも1つの要素について、要素の輪郭に関する情報を与えるデータDcontourを取得すること(操作210)を含む。後に説明するが、Dcontourは、この画像を使用して生成することができる。いくつかの実施形態では、この方法が、Dcontourを直接に取得することを含み、このDcontourは、試験体の画像を使用して生成されたものである。 The method includes, for at least one element of the specimen present in the image, obtaining data D contour (operation 210) that provides information about the contour of the element. As will be explained later, a D contour can be generated using this image. In some embodiments, the method includes directly obtaining a D contour , which was generated using an image of the specimen.
この輪郭は例えば、その要素を画像の残りの部分から分離する要素の外境界に対応する。輪郭の内部に位置する画像のエリアは要素の内部エリアに対応する。 This contour corresponds, for example, to the outer boundary of the element separating that element from the rest of the image. Areas of the image that lie inside the contour correspond to the interior areas of the element.
図2Bは、試験体の画像259中のコンタクトの非限定的な例を示している。コンタクト260は、輪郭261および輪郭261の内部に位置する内部エリア262を含む。
FIG. 2B shows a non-limiting example of contacts in
Dcontourは例えば画像の点のリストを含むことができ(これらの点は、画像のピクセル、および/または画像のピクセル間の補間を使用して取得された点に対応しうる)、それぞれの点は、画像の第1の方向に沿った第1の座標(「X」座標)および画像の第2の方向に沿った第2の座標(「Y」座標)に関連づけられている。この点のリストの中の点と点の間を接合したものがその要素の輪郭に対応する。要素260に関して取得されたDcontourの非限定的な例(263を参照されたい)が図2Cに示されている。他の実施形態では、Dcontourが、2次元平面における要素の輪郭の断面/位置を画定する連続線を含みうる。 D contour may for example contain a list of points of the image (these points may correspond to pixels of the image and/or points obtained using interpolation between the pixels of the image), each point is associated with a first coordinate along a first direction of the image (the "X" coordinate) and a second coordinate along the second direction of the image (the "Y" coordinate). The join between points in this list of points corresponds to the contour of the element. A non-limiting example of the D contour obtained for element 260 (see 263) is shown in FIG. 2C. In other embodiments, D contour may contain continuous lines that define the cross-section/position of the element's contour in a two-dimensional plane.
Dcontourはさまざまな方法を使用して取得することができる。いくつかの実施形態によれば、検査ツールによって取得された画像上でセグメント化プロセスを実行することができる。このプロセスは、画像中に存在する試験体の異なる要素を検出することを可能にする。その結果として、それぞれの要素の輪郭を決定することが可能である。 D contour can be obtained using various methods. According to some embodiments, a segmentation process can be performed on the images acquired by the inspection tool. This process allows detecting different elements of the specimen present in the image. As a result, it is possible to determine the contour of each element.
いくつかの実施形態では、画像処理アルゴリズムを使用してそれぞれの要素の輪郭(Dcontour)を決定することができる。「OpenCV」などのライブラリを使用して、画像中の要素の輪郭を決定することができる。しかしながら、これに限定されるわけではない。 In some embodiments, image processing algorithms can be used to determine the contour of each element (D contour ). Libraries such as "OpenCV" can be used to determine the contours of elements in an image. However, it is not limited to this.
図2Aの方法はさらに、データDcontourを使用して、要素の輪郭の曲率に関する情報を与える信号を生成すること(操作215)を含む。 The method of FIG. 2A further includes using the data D contour to generate a signal giving information about the curvature of the contour of the element (operation 215).
いくつかの実施形態によれば、この曲率が、曲線が直線から逸脱する量と定義される。曲線上の1点における曲率半径は、その点においてその曲線に最もよく適合する円の半径である。曲率は曲率半径の逆数である。 According to some embodiments, this curvature is defined as the amount the curve deviates from a straight line. The radius of curvature at a point on the curve is the radius of the circle that best fits the curve at that point. Curvature is the reciprocal of the radius of curvature.
後に説明するが、要素の輪郭の曲率に関する情報を与える信号は、その曲率自体に対応することができ、または輪郭に沿った曲率の変動に関する情報を与える信号に対応することができる。 As will be explained later, the signal giving information about the curvature of the contour of the element can correspond to the curvature itself, or it can correspond to a signal giving information about the variation of curvature along the contour.
(要素の輪郭などの)2次元形状の曲率は、知られている数式に依存して決定することができる。例えば、所与のそれぞれの点における曲率は、プラットの方法(V. Pratt, "Direct least-squares fitting of algebraic surfaces", Computer Graphics, Vol. 21, pages 145-152 (1987))を使用し、所与のそれぞれの点の近傍を使用することによって決定することができる。この方法に限定されるわけではなく、他の方法を使用することもできる。 The curvature of a two-dimensional shape (such as the contour of an element) can be determined by relying on known mathematical formulas. For example, the curvature at each given point can be calculated using Pratt's method (V. Pratt, "Direct least-squares fitting of algebraic surfaces", Computer Graphics, Vol. 21, pages 145-152 (1987)), It can be determined by using the neighborhood of each given point. It is not limited to this method and other methods can also be used.
図3Aは、要素の輪郭の曲率に関する情報を与える信号をDcontourを使用して決定する別の方法を示している。 FIG. 3A shows another method of using D contour to determine a signal that gives information about the curvature of the element's contour.
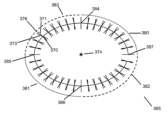
図3Aの方法は、要素の輪郭に沿った複数の位置のうちの所与のそれぞれの位置について、その所与の位置における輪郭の法線(すなわち、その所与の位置において輪郭に対して直角な方向/ベクトル)を決定すること(操作300)を含む。非限定的な例が図3Bに示されている。要素365の輪郭上に位置する所与の位置370について、法線371を取得する。図3Bに示されているように、要素365の輪郭に沿った他のさまざまな位置についても同じプロセスを実行する。
The method of FIG. 3A determines, for each given one of a plurality of positions along the contour of the element, the normal of the contour at that given position (i.e., perpendicular to the contour at that given position). direction/vector) (operation 300). A non-limiting example is shown in FIG. 3B. For a given
この方法はさらに、要素の輪郭に沿った複数の位置のうちの所与のそれぞれの位置について、その所与の位置から要素の重心(質量中心とも呼ばれる)へ向かう方向を決定すること(操作310)を含む。図3Bの非限定的な例では、要素365の輪郭上に位置する所与の位置370ついて、要素365の重心374の方を向いた方向/ベクトル373を取得する。図3Bに示されているように、要素365の輪郭に沿った他のさまざまな位置についても同じプロセスを実行する。
The method further includes, for each given one of the plurality of positions along the contour of the element, determining a direction from the given position toward the center of gravity (also called the center of mass) of the element (operation 310 )including. In the non-limiting example of FIG. 3B, for a given
この方法はさらに、輪郭に沿った所与のそれぞれの位置について、法線と重心へ向かう方向との間の角度差(角度オフセット)に関する情報を与えるデータを生成すること(オプション315)を含む。例えば、所与の位置370において、法線371と方向373との間の角度差に対応する角度376を計算する。要素365の輪郭に沿った他のさまざまな位置についても同じプロセスを実行する。
The method further includes generating, for each given position along the contour, data giving information about the angular difference (angular offset) between the normal and the direction towards the centroid (option 315). For example, at a given
その結果として、所与のそれぞれの位置について、法線と重心へ向かう方向との間の角度差が取得される。これは、1次元信号(輪郭に沿った位置に関する角度差)を生成することを可能にする。いくつかの実施形態では、より連続した/より滑らかな信号を取得するために、(位相πを加えるまたは減じることによって)この1次元信号を再スケーリングすることができる。実際、角度差の値が0からπ(または0から-π)に移動するときには、信号に値-π(または+π)を加えることが可能である。実際、輪郭の曲率の周期性を決定するのに、輪郭の法線が、重心へ向かう方向と同じ方向を有するのか(角度オフセット0)、または重心へ向かう方向とは反対の方向を有するのか(角度オフセット+πもしくは-π)を判定することは重要ではない。 As a result, for each given position, the angular difference between the normal and the direction towards the centroid is obtained. This makes it possible to generate a one-dimensional signal (angular difference with respect to position along the contour). In some embodiments, this one-dimensional signal can be rescaled (by adding or subtracting the phase π) to obtain a more continuous/smoother signal. In fact, it is possible to add the value −π (or +π) to the signal when the angular difference value moves from 0 to π (or 0 to −π). In fact, to determine the periodicity of the curvature of the contour, does the normal of the contour have the same direction towards the centroid (angle offset 0) or the opposite direction towards the centroid ( It is not important to determine the angular offset +π or -π).
図3Aの方法を使用して計算された信号は要素の輪郭の曲率に関する情報を与える。より具体的には、この信号は、要素の輪郭の曲率の変動に関する情報を与える。実際、完全な円については法線と重心へ向かう方向とが同じであるため、差はゼロである。その結果、この信号はゼロであり、このことは、円の輪郭に沿って円の曲率が変化しないことに対応する(曲率自体は円の輪郭に沿って一定である)。この信号は曲率の変動を表しているため、この信号を使用して輪郭の頂点を検出することができ、輪郭の頂点では、曲率の大きな変動を取得することが予想される。これについては後により詳細に説明する。 A signal computed using the method of FIG. 3A gives information about the curvature of the contour of the element. More specifically, this signal gives information about the curvature variation of the contour of the element. In fact, for a perfect circle the normal and the direction towards the centroid are the same, so the difference is zero. As a result, this signal is zero, which corresponds to no change in the curvature of the circle along its contour (the curvature itself is constant along its contour). Since this signal represents curvature variations, it can be used to detect contour vertices, where one would expect to obtain large curvature variations. This will be explained in more detail later.
そのため、図3Aの方法によって取得された信号を、操作215において、要素の輪郭の曲率に関する情報を与える信号として使用することができる(操作320を参照されたい)。
As such, the signal obtained by the method of FIG. 3A can be used in
図3Aの例において、エリア380および381に位置する輪郭に沿った位置についてはこの角度差が正の大きな値であると予想され、エリア380および381に位置する輪郭に沿った位置についてはこの角度差が負の大きな値であると予想され、位置384、385、386および387については角度差がゼロであると予想される。
In the example of FIG. 3A, this angular difference is expected to be a large positive value for locations along the contour located in
いくつかの実施形態では、操作215で使用される信号が、輪郭に沿った法線の方向の進展である(この画像に関してはこれが法線の角度方向の進展に対応する)。図3Aの方法では、法線と重心へ向かう方向との間の角度差が計算され、このケースでは、法線の角度方向が計算されることに留意されたい。
In some embodiments, the signal used in
図4は、輪郭263(図2C参照)に関連する要素260の曲率に関する情報を与える信号415を示している。図4のグラフは、横軸400に輪郭に沿った位置に対する縦軸410に曲率を示している。信号415は、曲率自体を計算する方法を使用して取得したものであり、図3Aの方法を使用して取得したものではない。信号415は3つの主要なピークを含んでいる。このことにより、図3Aの方法を使用した場合にも、信号は3つの主要なピークを有するであろうことに留意されたい。これは、図3Aの方法が、曲率の変動に関する情報を与える信号を提供するためである。
FIG. 4 shows a
図2Aの方法はさらに、要素の輪郭の曲率に関する情報を与える信号(操作215で取得されたもの)の周期性に関する情報を与えるデータDperiodicityを決定すること(操作220)を含む。信号の周期性は、間隔を置いて繰り返す信号の傾向である。この周期性は、操作215で取得した信号で評価することができ、輪郭の全体にわたって計算することができる。
The method of FIG. 2A further includes determining (operation 220) a data D periodicity that provides information about the periodicity of the signal (obtained in operation 215) that provides information about the curvature of the contour of the element. Signal periodicity is the tendency of a signal to repeat at intervals. This periodicity can be evaluated in the signal obtained in
後に説明するが、いくつかの実施形態では、データDperiodicityが、1からNの範囲の整数のうちのそれぞれの整数Niについて、Niに等しい周期性をこの信号が有する確率を含む。周期性Niは、(輪郭の全体にわたって計算された)信号がそれ自体をNi回繰り返す傾向を有することに対応しうる。 As will be explained later, in some embodiments the data D periodicity includes, for each integer N i of integers ranging from 1 to N, the probability that this signal has a periodicity equal to N i . The periodicity N i may correspond to the tendency of the signal (computed over the contour) to repeat itself N i times.
いくつかのケースでは、この周期性が、要素の輪郭の曲率に関する情報を与える信号(操作215で取得されたもの)のピークの数に対応する。それらのピークは例えばこの信号の振幅の極大値に対応する。いくつかの実施形態では、この信号のさまざまなピークが同様の振幅を有し、またはこの信号の他の部分に関する振幅の差に比べて振幅の差が小さいかもしくは無視できる。 In some cases, this periodicity corresponds to the number of peaks in the signal (obtained in operation 215) that gives information about the curvature of the contour of the element. These peaks correspond, for example, to the maxima of the amplitude of this signal. In some embodiments, various peaks of the signal have similar amplitudes, or the amplitude differences are small or negligible compared to the amplitude differences for other portions of the signal.
図4の例では、信号415に3つの主要なピーク420、421および422が存在する。したがって、Dperiodicityは、信号415が周期性3を有する確率が高いことを示すであろう。しかしながら、信号415は、3つのピークだけを有する完全なシヌソイドではないため、Dperiodicityは、その信号に異なる値の周期性が存在する確率も含むであろう(しかしながら、その確率は、3に等しい周期性に関連した確率よりも低いであろう)。
In the example of FIG. 4, there are three
データDperiodicityを決定するためにさまざまな方法を使用することができる。図5は、フーリエ変換を使用してデータDperiodicityを決定する方法を示している。しかしながら、この方法に限定されるわけではなく、他のさまざまな方法を使用することができる。例えば、Matlabの関数「findpeaks」を使用することができる。 Various methods can be used to determine the data D periodicity . FIG. 5 illustrates a method of determining data D periodicity using the Fourier transform. However, it is not limited to this method and various other methods can be used. For example, the Matlab function "findpeaks" can be used.
図5の方法は、要素の輪郭の曲率に関する情報を与える信号を周波数ドメインの信号に変換すること(操作500)を含む。いくつかの実施形態によれば、この信号を周波数ドメインに変換するために、この信号にフーリエ変換(例えば高速フーリエ変換(Fast Fourier Transform))を適用することができる。 The method of FIG. 5 includes transforming a signal that provides information about the curvature of the contour of the element into a signal in the frequency domain (operation 500). According to some embodiments, a Fourier transform (eg, Fast Fourier Transform) can be applied to the signal to transform it into the frequency domain.
この方法はさらに、この周波数ドメインの信号を、信号の周期性に関する情報を与えるデータDperiodicityとして使用すること(操作510)(またはこの周波数ドメインの信号を使用してDperiodicityを決定すること)を含む。実際、後のさまざまな例で示すが、この信号を周波数ドメインで表現することによって、要素の輪郭の曲率に関する情報を与える信号の周期性に関する情報を与える周波数成分(高調波)を決定することが可能になる。 The method further includes using the frequency domain signal as data D periodicity that provides information about the periodicity of the signal (operation 510) (or using the frequency domain signal to determine D periodicity ). include. Indeed, as will be shown in various examples later, by representing this signal in the frequency domain, it is possible to determine the frequency components (harmonics) that give information about the periodicity of the signal, which gives information about the curvature of the contours of the elements. be possible.
試験体の要素600(例えばコンタクト)が、図6Aに示された画像中で、1つの形状を有すると仮定する。要素600は、要素600を製造するために使用される製造プロセスに関する理想的な/期待される形状601(円の形状)とは異なる形状を有する。実際、要素600は、要求されている円の形状よりも三角形の形状に近い形状を有する。
Assume that the specimen element 600 (eg, contact) has a shape in the image shown in FIG. 6A.
図2Aの操作215に関して既に説明したとおり、要素の輪郭の曲率に関する情報を与える信号620(図6B参照)が生成される。この非限定的な例では、図3Aの方法を使用して信号620を決定した。
As already described with respect to
この非限定的な例では、FFT変換を使用して信号620を周波数ドメインに変換する。周波数表現630が取得される(図6C参照)。周波数表現630は、信号620の高調波の振幅631を周波数632の関数として出力する。具体的には、このFFT表現は、第1高調波(f1)およびそれぞれの高調波周波数(fn)の振幅を示している(fn=n.f1、なおnは高調波次数である)。図6Cの特定の例では、FFT表現630が、第3高調波(n=3)に対して大きなピークを示している。他の高調波も存在するが、それらははるかに小さな振幅を有する。したがって、FFT表現630は信号620の周期性に関する情報を与える。第3高調波(n=3)の大きな振幅が検出されたため、このことは、3に等しい周期性を信号620が有する確率が高いことを意味する。信号620は完全なシヌソイド信号ではないため、(nが3とは異なる)他の高調波も存在するが、それらははるかに小さな振幅を有する。
In this non-limiting example, an FFT transform is used to transform signal 620 into the frequency domain. A frequency representation 630 is obtained (see FIG. 6C). Frequency representation 630 outputs amplitudes 631 of harmonics of
図2Aの方法に戻ると、この方法はさらに、データDperiodicityを使用して、要素の正しい製造に関する情報を与えるデータを決定すること(操作230)を含む。 Returning to the method of FIG. 2A, the method further includes using the data D periodicity to determine data that provides information regarding correct manufacturing of the component (operation 230).
所与の要素(例えばコンタクト、トランジスタなど)が製造されるときには製造プロセスが使用される。この所与の要素は、期待される形状に従って製造される。例えば、コンタクトについては、期待される形状が円形の形状であることがありうる。実際には、所与の要素は、期待される形状とは異なる実際の形状を有しうる。これによって、電気性能の低下など性能の低下が生じうる。 A manufacturing process is used when a given element (eg, contact, transistor, etc.) is manufactured. This given element is manufactured according to the expected shape. For example, for contacts, the expected shape may be a circular shape. In practice, a given element may have an actual shape that differs from the expected shape. This can result in performance degradation, such as reduced electrical performance.
いくつかの実施形態によれば、操作230は、データDperiodicityを使用して、輪郭と1つの形状との類似性に関する情報を与える少なくとも1つのスコアを決定することを含む(後に説明するが、この1つの形状は所定の形状とすることができる)。具体的には、いくつかの実施形態によれば、この1つの形状が、要素の期待される形状とは異なる。言い換えると、要素が、どの程度、その期待される形状とは異なる形状に類似した形状を有するのかを測定および定量化することができる。したがって、このスコアを使用して、要素の製造プロセスの異常または問題を検出することができる。具体的には、このスコアを使用して、要素の製造プロセスの不安定性/系統的欠陥を検出することができる。
According to some embodiments,
実際、このスコアが、要素と期待される形状とは異なる所定の形状との間の高い類似性を示す場合、このことは、製造プロセスに異常がある確率が高いことを示す。その結果、少なくとも1つの是正処置をとることができる。 In fact, if this score indicates a high degree of similarity between the element and a given shape that differs from the expected shape, this indicates a high probability that there is an anomaly in the manufacturing process. As a result, at least one corrective action can be taken.
本出願に記載されたさまざまな方法において、要素の正しい製造に関する情報を与えるデータを使用して、異なるさまざまな是正処置を実行することができる。これは、要素および/または試験体を再び製造すること、製造プロセスの1つまたは複数のパラメータ(例えば製造頻度、温度、製造ツールの1つまたは複数のパラメータ)を修正すること、試験体を廃棄すること、試験体が受ける必要があるプロセスを選択すること、試験体をさらに検査すること、データベースに情報を書き込むことなどのうちの少なくとも1つを含むことができる。 In the various methods described in this application, data that informs correct manufacturing of the component can be used to implement a variety of different corrective actions. This may involve remanufacturing the element and/or specimen, modifying one or more parameters of the manufacturing process (e.g. production frequency, temperature, one or more parameters of the manufacturing tool), scrapping the specimen. selecting a process that the specimen should undergo, further examining the specimen, writing information to a database, and/or the like.
具体的には、要素の正しい製造に関する情報を与えるデータを使用して製造プロセスを安定させることができる。 In particular, data that provides information regarding the correct manufacture of the component can be used to stabilize the manufacturing process.
後に説明するが、操作230で、要素の輪郭と多角形との類似性に関する情報を与えるスコアを決定することを試みることができる。多角形の例は例えば、三角形、正方形、長方形、五角形および六角形を含む。操作230で使用することができる1つの原理は、多角形がある数の頂点を有することである(例えば、三角形は3つの頂点を有し、正方形または長方形は4つの頂点を有するなど)。多角形の輪郭の曲率は多角形の頂点で急激に変化する。したがって、多角形がN個の頂点を有する場合、多角形の曲率に関する情報を与える信号は、(この信号が曲率自体に対応するときと信号が曲率の変動に対応するときの両方で)Nに等しい周期性を含むことが予想される。上述のとおり、いくつかの例ではこれがN個のピークに対応しうる。図2Aの方法は、要素の輪郭の曲率に関する情報を与える信号の周期性に関する情報を与えるデータDperiodicityを決定することを可能にするため、Dperiodicityから、輪郭とN個の頂点を有する多角形との類似性に関する情報を与える見通しを推論することができる。より一般的には、いくつかの実施形態によれば、Dperiodicityを使用して、範囲[Nmin;Nmax]のそれぞれの整数Niについて、要素の輪郭とNi個の頂点を有する所定の形状との間の類似性を示す対応するスコアSiを決定することができる。したがって、第1のスコアは、輪郭と三角形との間の類似性を示しうる。第2のスコアは、輪郭と正方形または長方形との間の類似性を示しうる。第3のスコアは、輪郭と五角形との間の類似性を示しうる。いくつかの実施形態では、スコアSiのうちの1つまたは複数に基づいて集約スコアを生成することができる。
As will be explained later, at
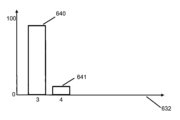
図6Dを参照して操作230の一例を説明する。要素600の輪郭と三角形との類似性に関する情報を与える少なくとも1つのスコアを決定することを試みると仮定する。
An example of
信号620のFFT表現630は、高調波f3(f3=3.f1、f1は第1高調波である)に対する大きな振幅を含むため、要素600と三角形との間の高い類似性を示す対応するスコアが計算される。いくつかの実施形態では、このスコアを、0~100の間のスケールにスケーリングすることができる。FFT表現において取得された振幅から0~100の間のスコアへのこの変換は、変換係数を使用して実行することができる。この変換係数は例えば経験的に決定することができる。反対に、信号620のFFT表現630は、高調波f4(f4=4.f1、f1は第1高調波である)に対する低い振幅を含み、したがって正方形との類似性を示すスコアは低い。
The FFT representation 630 of
図6Dの例では、要素600の輪郭と三角形との類似性を示すスコア640(以後、「三角形スコア」と呼ぶ)が92であり、要素600の輪郭と正方形との類似性を示すスコア641(以後、「正方形スコア」と呼ぶ)が8である。いくつかの実施形態では、集約スコアを計算し、ユーザに提供することができる。例えば、下記の非限定的な式を使用することができる。
集約スコア=Max(三角形スコア、0.5×正方形スコア)
In the example of FIG. 6D, the
Aggregate score = Max (triangle score, 0.5 x square score)
FFT表現において取得された第5高調波(f5=5.f1)の振幅から、要素の輪郭と五角形との類似性を推論することができることに留意されたい。上で説明したとおり、この振幅を、変換係数を使用して、予め定められたスケール内に位置するスコアに変換することができる。同様に、FFT表現において取得された第6高調波(f6=6.f1)の振幅から、要素の輪郭と六角形との類似性を推論することができる。それぞれの多角形に対して取得されたスコアのうちの1つまたは複数を使用して集約スコアを計算することができる。 Note that from the amplitude of the fifth harmonic (f 5 =5.f 1 ) obtained in the FFT representation, we can infer the similarity between the contour of the element and the pentagon. As explained above, this amplitude can be transformed into a score located within a predetermined scale using transformation coefficients. Similarly, from the amplitude of the 6th harmonic (f 6 =6.f 1 ) obtained in the FFT representation, the similarity between the contour of the element and the hexagon can be inferred. One or more of the scores obtained for each polygon can be used to calculate an aggregate score.
いくつかの実施形態によれば、製造プロセスのオペレータは、製造プロセスの異常が、期待される形状(例えば円)とは異なる予め定められた多角形(例えば三角形)に近い輪郭を有する要素を生成する傾向があることに気づいた。したがって、このオペレータは、要素と三角形との類似性を示すスコアを取得することを目指すだろう。しかしながら、これに限定されるわけではない。 According to some embodiments, a manufacturing process operator determines that an anomaly in the manufacturing process produces an element with an outline that approximates a predetermined polygon (e.g., a triangle) that differs from the expected shape (e.g., a circle). I noticed a tendency to Therefore, this operator will aim to obtain a score that indicates the similarity between the element and the triangle. However, it is not limited to this.
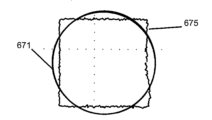
図6Eに注目する。試験体の要素(例えばコンタクト)が、図6Eに示された画像中で、形状675を有すると仮定する。要素は、要素を製造するために使用される製造プロセスに関する理想的な/期待される形状671(円の形状)とは異なる形状を有する。実際、要素は、要求されている円の形状671ではなくむしろ、方形の形状675に近い形状を有する。
Attention is directed to FIG. 6E. Suppose an element (eg, contact) of a specimen has
図2Aの操作215に関して既に説明したとおり、要素の輪郭の曲率に関する情報を与える信号680(図6F参照)が生成される。この非限定的な例では、図3Aの方法を使用して信号680を決定した。
As already described with respect to
この非限定的な例では、FFT変換を使用して信号680を周波数ドメインに変換する。周波数表現685が取得される(図6G参照)。FFT表現685は、第4高調波(n=4)に対して大きなピークを示している。他の高調波も存在するが、それらははるかに小さな振幅を有する。第4高調波(n=4)の大きな振幅が検出されたため、このことは、信号680が周期性4を有する確率が高いことを意味する。(nが4とは異なる)他の高調波も存在するが、それらははるかに小さな振幅を有する。 In this non-limiting example, an FFT transform is used to transform signal 680 into the frequency domain. A frequency representation 685 is obtained (see FIG. 6G). The FFT representation 685 shows a large peak for the 4th harmonic (n=4). Other harmonics are also present, but they have much smaller amplitudes. This means that the signal 680 has a high probability of having a periodicity of 4, since a large amplitude of the fourth harmonic (n=4) was detected. Other harmonics (different from n=4) are also present, but they have much smaller amplitudes.
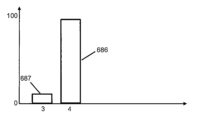
図6Hの例では、要素671の輪郭と正方形との類似性を示すスコア686(「正方形スコア」)が約100であり、要素671の輪郭と三角形との類似性を示すスコア687(以後、「三角形スコア」と呼ぶ)が低い。上で説明したとおり、いくつかの実施形態では、集約スコアを計算し、ユーザに提供することができる。
In the example of FIG. 6H, the
次に図7に注目する。 Attention is now directed to FIG.
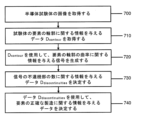
図7の方法は、半導体試験体の画像を取得すること(操作200と同様の操作700)、および試験体の要素の輪郭に関する情報を与えるデータDcontourを取得すること(操作210と同様の操作710)を含む。この方法はさらに、Dcontourを使用して、要素の輪郭の曲率に関する情報を与える信号を生成すること(操作720)を含む。いくつかの実施形態によれば、この信号は、要素の輪郭の曲率の変動に関する情報を与えることができる。具体的には、図3Aに記載された方法を使用することができる。
The method of FIG. 7 includes acquiring an image of a semiconductor specimen (
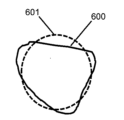
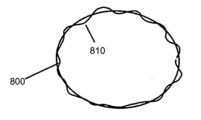
図8Aを参照すると、要素(例えばコンタクト)の期待される輪郭800および製造された要素の輪郭810の実際の形状を示す例が提供されている。示されているように、輪郭の実際の形状は、「曲がりくねっている(curly)」という点で、期待される輪郭とは異なっている。後に説明するが、図7の方法は、要素の正しい製造を特徴づけることを可能にし、具体的には、要素の輪郭の曲がりくねり(これは例えば条線(striation)を含む)に関する情報を与えるデータを提供する。
Referring to FIG. 8A, an example is provided showing the actual shape of an expected
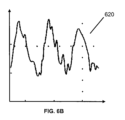
図8Bは、図3Aの方法を使用して取得した、要素の曲がりくねった輪郭810の曲率の変動に関する情報を与える信号820を示している。この信号は再スケーリングされておらず、この信号には、後に説明するように不連続部が存在する。
FIG. 8B shows a signal 820 giving information about the curvature variation of the element's
図8Cは、要素の輪郭の曲率に関する情報を与える信号820の最大振幅と最小振幅の間のこの交替と曲がりくねった輪郭810との間の関連を説明する図である。図8Cには、輪郭810の部分830が(この画像のように「X」方向に対応する横軸および「Y」方向に対応する縦軸を有する2次元表現で)示されている。この部分は、凸である第1の部分840および凹である第2の部分850を含む。第1の部分840と第2の部分850の間には変曲点860が存在する。輪郭810の曲がりくねりのため、輪郭810の全体にわたって凹部と凸部の間のこの交替が繰り返されている。
FIG. 8C illustrates the relationship between this alternation between the maximum and minimum amplitudes of signal 820, which gives information about the curvature of the contour of the element, and
図8Cの曲線870は、(2次元表現X/Yでの)輪郭810の一部分に沿った輪郭の法線の包絡線の進展に対応する。この曲線870は「縮閉線(evolute)」とも呼ばれる。図8Cに見られるとおり、輪郭810がその凸部840からその凹部850に切り替わるときに(すなわち平らな部分に対応する変曲点860に)、曲線870の負の最小値(例えば法線は-180度/-πの方向を有し、曲率半径の大きな値に対応する大きな長さを有する)と曲線870の正の最大値(例えば法線は+180度/+πの方向を有し、曲率半径の大きな値に対応する大きな長さを有する)との間の跳躍部(不連続部)が存在する。実際、上で既に述べたとおり、所与の点における曲率は、輪郭のこの所与の点における適合する円の半径の曲率である。曲率がゼロに近いとき、適合する円の半径は無限大に近づく。このことは、曲線がほぼ直線であることを意味する。変曲点860で輪郭の法線の方向は反転し、したがって、曲線870は、負の最小値から正の最大値に切り替わる。
Curve 870 in FIG. 8C corresponds to the evolution of the contour normal envelope along a portion of contour 810 (in the two-dimensional representation X/Y). This curve 870 is also called an "evolute". As seen in FIG. 8C, when
凸部と凹部の間のこの遷移は、要素の曲がりくねった輪郭810の曲率の変動に関する情報を与える信号820の中で検出することができる。実際、輪郭の凸部と輪郭の凹部が切り替わるときには信号820に不連続部が存在する。例えば、図8Bにおいて、点の第1のクラスタ8221と点の第2のクラスタ8222の間には不連続部(矢印822によって表されている)が存在する。同様に、点の第3のクラスタ8211と点の第4のクラスタ8212の間にも不連続部(矢印821によって表されている)が存在する。信号820は離散信号であること、および(例えば点のクラスタ8221と点のクラスタ8222の間の)縦線は信号820の本当の点に対応しないことに留意されたい(信号820の本当の点に対応するのは星印だけである)。
This transition between convex and concave can be detected in a signal 820 that gives information about the variation of the curvature of the
この信号の不連続部は、この不連続部がしきい値よりも大きな振幅を有するときに、輪郭の凸部と輪郭の凹部の間の遷移(凸から凹または凹から凸への遷移)に対応すると識別することができる。図8Bに見られるとおり、このしきい値はπに近いと規定することができる。このことは、法線の方向が0から+πまたは-πに(またはその逆に)切り替わる図8Cから理解することができる。法線の角度方向には不連続部が存在するため、信号820にも(法線と重心に向かう方向との間の角度オフセットに対応する)同様の不連続部が存在する。図8Bの実信号820の不連続部は、雑音が存在するためおよび信号820が離散信号であるためにπよりも小さいことがありうる。 A discontinuity in this signal occurs at a transition between contour convexity and contour concave (convex-to-concave or concave-to-convex transition) when this discontinuity has an amplitude greater than the threshold. can be identified as corresponding. As seen in FIG. 8B, this threshold can be defined to be close to π. This can be seen from FIG. 8C, where the normal direction switches from 0 to +π or −π (or vice versa). Since there is a discontinuity in the angular direction of the normal, there is a similar discontinuity in signal 820 (corresponding to the angular offset between the normal and the direction towards the centroid). The discontinuities in the real signal 820 of FIG. 8B can be smaller than π due to the presence of noise and because the signal 820 is a discrete signal.
信号820は、交互に、(しきい値よりも大きな不連続部のない)点のクラスタ、(しきい値よりも大きな)不連続部、次いで(しきい値よりも大きな不連続部のない)点の別のクラスタを含む。 The signal 820 alternates between clusters of points (no discontinuities greater than threshold), discontinuities (greater than threshold), then (no discontinuities greater than threshold). Contains another cluster of points.
この不連続部はさまざまな方法を使用して決定することができる。いくつかの実施形態では、信号の連続する点間の差(または点のクラスタ間の差)を計算する。この差がしきい値よりも大きいときに不連続部が検出される。 This discontinuity can be determined using various methods. In some embodiments, differences between consecutive points (or differences between clusters of points) of the signal are calculated. A discontinuity is detected when this difference is greater than a threshold.
いくつかの実施形態では、信号820の離散微分係数を決定する。この微分係数がしきい値よりも大きいときに不連続部が検出される。このしきい値はオペレータが手動で設定することができる。 In some embodiments, the discrete derivative of signal 820 is determined. A discontinuity is detected when this derivative is greater than a threshold. This threshold can be manually set by the operator.
上で概説した原理を使用して、図7の方法はさらに、信号の不連続部の数に関する情報を与えるデータDdiscontinuitiesを決定すること(操作730)を含み、それぞれの不連続部は、輪郭の凸部と輪郭の凹部の間の遷移(凸から凹または凹から凸への遷移)に関する情報を与える。 Using the principles outlined above, the method of FIG. 7 further includes determining (operation 730) data D discontinuities that provide information about the number of discontinuities in the signal, each discontinuity being a contour It gives information about the transitions between the convexity of and contour concaves (convex-to-concave or concave-to-convex transitions).
いくつかの実施形態では、曲がりくねった部分ごとに、第1の凸部から第1の凹部への第1の遷移が存在し、次いで第1の凹部から第2の凸部への第2の遷移が存在するため、不連続部の数を2で割って、曲がりくねった部分の数を決定することが可能である。 In some embodiments, for each tortuous portion there is a first transition from the first protrusion to the first recess, and then a second transition from the first recess to the second protrusion. Since there is , it is possible to divide the number of discontinuities by two to determine the number of tortuous sections.
他の実施形態では、点の第1のクラスタと点の第2のクラスタの間で信号820の振幅が増大する不連続部だけを計数することが可能である。 In other embodiments, it is possible to count only discontinuities where the amplitude of signal 820 increases between a first cluster of points and a second cluster of points.
他の実施形態では、点の第1のクラスタと点の第2のクラスタの間で信号820の振幅が低減する不連続部だけを計数することが可能である。 In other embodiments, it is possible to count only discontinuities where the amplitude of signal 820 decreases between a first cluster of points and a second cluster of points.
上記の例から理解することができるとおり、データDdiscontinuitiesは、要素の正しい製造に関する情報を与え(操作740参照)、具体的には、要素の輪郭の曲がりくねりおよび/またはプロセス変動の指示を提供する。不連続部の数がしきい値よりも大きい場合、このことは、是正処置を必要とする曲がりくねった輪郭を示しうる(これに限定されるわけではない)。例えば、9~12個の不連続部が識別された場合、このことは、是正処置を必要とする曲がりくねった輪郭を示しうる(これに限定されるわけではない)。その結果として、要素の製造プロセスの異常を検出することが可能であり、したがって、是正処置、例えば製造プロセスを安定させるための是正処置を実行することが可能である(上述の是正処置のさまざまな例を参照されたい)。 As can be seen from the above example, the data D discontinuities provide information regarding correct manufacturing of the element (see operation 740), and in particular provide an indication of contour tortuosity and/or process variations of the element. . If the number of discontinuities is greater than a threshold, this may indicate (but is not limited to) a tortuous contour that requires corrective action. For example, if 9-12 discontinuities are identified, this may indicate (but is not limited to) a tortuous contour that requires corrective action. As a result, it is possible to detect anomalies in the manufacturing process of the component and therefore take corrective action, e.g. see examples).
いくつかの実施形態によれば、図7の方法で使用される要素の輪郭の曲率に関する情報を与える信号は、輪郭の法線の角度方向の進展に対応する。この角度方向は、この画像(X/Y)に関して表現することができる。この信号の中で(πに近いなどのしきい値よりも大きな振幅を有する)不連続部を検出して、輪郭の凸部と凹部の間の遷移(またはその逆の遷移)を検出することができる。図7に関して説明した特徴を、輪郭の法線の角度方向を使用するときと同様に使用することができる。 According to some embodiments, the signal giving information about the curvature of the contour of the element used in the method of FIG. 7 corresponds to the angular evolution of the normal of the contour. This angular orientation can be expressed in terms of this image (X/Y). Detecting discontinuities in this signal (having amplitudes greater than a threshold, such as near π) to detect transitions between contour peaks and valleys (or vice versa). can be done. The features described with respect to FIG. 7 can be used in the same way as when using the angular orientation of the contour normal.
本発明は、その用途において、本明細書に含まれる説明の中で示された詳細または図面に示された詳細に限定されないことを理解すべきである。 It is to be understood that this invention is not limited in its application to the details shown in the description contained herein or shown in the drawings.
本発明によるシステムは、少なくとも部分的に、適切にプログラムされたコンピュータ上で実施することができることも理解される。同様に、本発明は、本発明の方法を実行するためにコンピュータが読み取ることができるコンピュータプログラムを企図する。本発明はさらに、本発明の方法を実行するためにコンピュータが実行することができる命令のプログラムを実体的に実装した非一過性コンピュータ可読メモリを企図する。 It will also be appreciated that the system according to the invention can be implemented, at least in part, on a suitably programmed computer. Similarly, the invention contemplates a computer program readable by a computer to carry out the method of the invention. The present invention further contemplates a non-transitory computer readable memory tangibly embodying a program of instructions executable by a computer to perform the method of the invention.
本発明は、他の実施形態を有することができ、さまざまなやり方で実施および実行することができる。したがって、本明細書で使用されている言い回しおよび用語は説明が目的であり、それらを、限定を目的としたものとみなすべきでないことを理解すべきである。そのため、本開示の基礎となる着想を、本明細書に開示された主題のいくつかの目的を達成するための他の構造体、方法およびシステムを設計するためのベースとして容易に利用することができることを当業者は理解するであろう。 The invention is capable of other embodiments and of being practiced and carried out in various ways. It is, therefore, to be understood that the phraseology and terminology used herein is for the purpose of description and should not be regarded as limiting. As such, the underlying ideas of the present disclosure may be readily utilized as a basis for designing other structures, methods and systems for accomplishing some of the objectives of the subject matter disclosed herein. Those skilled in the art will understand that this is possible.
添付の請求項によって添付の請求項の中に定義された本発明の範囲から逸脱することなく、上で説明した本発明の実施形態にさまざまな修正および変更を加えることができることを当業者は容易に理解するであろう。 Those skilled in the art will readily appreciate that various modifications and changes can be made to the above-described embodiments of the invention without departing from the scope of the invention as defined therein by the appended claims. will understand.
100 検査システム
101 低分解能検査ツール
102 高分解能検査ツール
103 コンピュータベースのシステム
104 プロセッサおよびメモリ回路(PMC)
107 ストレージシステム
108 GUI
259 画像
260 コンタクト
261 輪郭
262 内部エリア
263 輪郭
365 要素
370 位置
371 法線
373 方向/ベクトル
374 重心
376 角度
380 エリア
381 エリア
382 エリア
383 エリア
384 位置
385 位置
386 位置
387 位置
400 横軸
410 縦軸
415 信号
420 ピーク
421 ピーク
422 ピーク
600 要素
601 理想的な/期待される形状
620 信号
630 周波数表現
631 振幅
632 周波数
640 三角形スコア
641 正方形スコア
671 理想的な/期待される形状
675 要素の形状
680 信号
685 周波数表現
686 三角形スコア
687 正方形スコア
800 要素の期待される輪郭
810 製造された要素の輪郭
820 信号
821 矢印
8211 点の第1のクラスタ
8212 点の第2のクラスタ
822 矢印
8221 点の第3のクラスタ
8222 点の第4のクラスタ
840 輪郭の凸部
850 輪郭の凹部
860 変曲点
870 曲線
100
107
259
Claims (20)
-検査ツールによって取得された前記半導体試験体の要素の輪郭に関する情報を与えるデータDcontourを取得し、
-前記データDcontourを使用して、前記要素の前記輪郭の曲率に関する情報を与える信号を生成し、
-○前記信号の周期性に関する情報を与えるデータDperiodicity、および
○前記信号の不連続部の数に関する情報を与えるデータDdiscontinuitiesであり、それぞれの不連続部が、前記輪郭の凸部と前記輪郭の凹部の間の遷移に関する情報を与える、前記データDdiscontinuities
のうちの少なくとも一方を決定し、
-前記データDperiodicityおよび前記データDdiscontinuitiesのうちの少なくとも一方を使用して、前記要素の正しい製造に関する情報を与えるデータを決定する
ように構成された、システム。 A system for inspecting semiconductor specimens, said system comprising a processor and memory circuit (PMC), said PMC comprising:
- obtaining data D contour giving information about the contours of the elements of said semiconductor specimen obtained by an inspection tool;
- using said data D contour to generate a signal giving information about the curvature of said contour of said element;
- ◯ data D periodicity giving information about the periodicity of the signal, and ◯ data D discontinuities giving information about the number of discontinuities in the signal, wherein each discontinuity corresponds to a convex portion of the contour and the contour. said data D discontinuities providing information about transitions between troughs of
determine at least one of
- a system configured to use at least one of said data D periodicity and said data D discontinuities to determine data giving information on correct manufacturing of said element.
前記輪郭と第1の形状との類似性に関する情報を与える第1のスコアと、
前記輪郭と第2の形状との類似性に関する情報を与える第2のスコアであり、前記第2の形状が前記第1の形状とは異なる、前記第2のスコアと、
前記第1のスコアおよび前記第2のスコアに基づく集約スコアと
を生成するように構成された、請求項1に記載のシステム。 Using data D periodicity ,
a first score that provides information about the similarity between the contour and a first shape;
a second score that provides information about the similarity between the contour and a second shape, wherein the second shape is different from the first shape;
2. The system of claim 1, configured to generate an aggregate score based on the first score and the second score.
前記周期性が第1の数N1に等しい見通しP1と、
前記周期性が第2の数N2に等しい見通しP2であり、N2がN1とは異なる、前記見通しP2と
を含む、請求項1に記載のシステム。 The data D periodicity is
a line of sight P 1 whose periodicity is equal to a first number N 1 ;
2. The system of claim 1 , wherein the periodicity is a perspective P2 equal to a second number N2 , and wherein N2 is different from N1 .
前記第2の見通しP2を使用して、前記輪郭と第2の形状との類似性に関する情報を与える第2のスコアであり、前記第2の形状が前記第1の形状とは異なる、前記第2のスコアを生成する
ように構成された、請求項10に記載のシステム。 using the first perspective P1 to generate a first score that provides information about the similarity between the contour and a first shape;
a second score that provides information about the similarity between the contour and a second shape using the second perspective P2 , wherein the second shape is different from the first shape; 11. The system of claim 10, configured to generate a second score.
前記第2の形状が、頂点の数N2を有する多角形である、
請求項11に記載のシステム。 wherein said first shape is a polygon having a number of vertices N1 ;
wherein said second shape is a polygon having a number of vertices N2 ;
12. The system of claim 11.
その所与の位置における前記輪郭の法線、および
その所与の位置から前記要素の重心へ向かう方向
を決定し、
所与のそれぞれの位置について、前記法線と前記方向との間の角度差に関する情報を与えるデータを生成し、
前記データを使用して、前記要素の前記輪郭の曲率に関する情報を与える前記信号を取得する
ように構成された、請求項1に記載のシステム。 for each given one of a plurality of positions along the contour of the element,
determining the normal of the contour at its given position and the direction from that given position towards the centroid of the element;
generating, for each given position, data giving information about the angular difference between the normal and the direction;
2. The system of claim 1, configured to use the data to obtain the signal that provides information about the curvature of the contour of the element.
前記周波数ドメインの前記信号を使用してDperiodicityを決定する
ように構成された、請求項1に記載のシステム。 transforming the signal that provides information about the curvature of the contour of the element into a frequency domain signal;
2. The system of claim 1, configured to determine D periodicity using the signal in the frequency domain.
-検査ツールによって取得された前記半導体試験体の要素の輪郭に関する情報を与えるデータDcontourを取得するステップと、
-前記データDcontourを使用して、前記要素の前記輪郭の曲率に関する情報を与える信号を生成するステップと、
-○前記信号の周期性に関する情報を与えるデータDperiodicity、および
○前記信号の不連続部の数に関する情報を与えるデータDdiscontinuitiesであり、それぞれの不連続部が、前記輪郭の凸部と前記輪郭の凹部の間の遷移に関する情報を与える、前記データDdiscontinuities
のうちの少なくとも一方を決定するステップと、
-前記データDperiodicityおよび前記データDdiscontinuitiesのうちの少なくとも一方を使用して、前記要素の正しい製造に関する情報を与えるデータを決定するステップと
を含む方法。 A method for inspecting a semiconductor specimen, the method comprising: a processor and memory circuit (PMC);
- obtaining data D contour giving information about the contours of the elements of said semiconductor specimen obtained by an inspection tool;
- using said data D contour to generate a signal giving information about the curvature of said contour of said element;
- ◯ data D periodicity giving information about the periodicity of the signal, and ◯ data D discontinuities giving information about the number of discontinuities in the signal, wherein each discontinuity corresponds to a convex portion of the contour and the contour. said data D discontinuities providing information about transitions between troughs of
determining at least one of
- using at least one of said data D periodicity and said data D discontinuities to determine data giving information on correct manufacturing of said element.
その所与の位置における前記輪郭の法線、および
その所与の位置から前記要素の重心へ向かう方向
を決定するステップと、
所与のそれぞれの位置について、前記法線と前記方向との間の角度差に関する情報を与えるデータを生成するステップと、
前記データを使用して、前記要素の前記輪郭の曲率に関する情報を与える前記信号を取得するステップと
を含む、請求項15に記載の方法。 for each given one of a plurality of positions along the contour of the element,
determining the normal of the contour at its given location and the direction from that given location to the centroid of the element;
generating, for each given position, data giving information about the angular difference between said normal and said direction;
16. The method of claim 15, comprising using the data to obtain the signal that provides information about the curvature of the contour of the element.
-検査ツールによって取得された前記半導体試験体の要素の輪郭に関する情報を与えるデータDcontourを取得する操作と、
-前記データDcontourを使用して、前記要素の前記輪郭の曲率に関する情報を与える信号を生成する操作と、
-○前記信号の周期性に関する情報を与えるデータDperiodicity、および
○前記信号の不連続部の数に関する情報を与えるデータDdiscontinuitiesであり、それぞれの不連続部が、前記輪郭の凸部と前記輪郭の凹部の間の遷移に関する情報を与える、前記データDdiscontinuities
のうちの少なくとも一方を決定する操作と、
-前記データDperiodicityおよび前記データDdiscontinuitiesのうちの少なくとも一方を使用して、前記要素の正しい製造に関する情報を与えるデータを決定する操作と
を含む操作を前記PMCに実行させる、非一過性コンピュータ可読媒体。 A non-transitory computer-readable medium containing instructions, the instructions, when executed by a processor and memory circuit (PMC),
- an operation of obtaining data D contour giving information about the contours of the elements of said semiconductor specimen obtained by an inspection tool;
- using said data D contour to generate a signal giving information about the curvature of said contour of said element;
- ◯ data D periodicity giving information about the periodicity of the signal, and ◯ data D discontinuities giving information about the number of discontinuities in the signal, wherein each discontinuity corresponds to a convex portion of the contour and the contour. said data D discontinuities providing information about transitions between troughs of
an operation of determining at least one of
- using at least one of said data D periodicity and said data D discontinuities to determine data giving information regarding the correct manufacture of said element, causing said PMC to perform operations comprising: readable medium.
Applications Claiming Priority (2)
| Application Number | Priority Date | Filing Date | Title |
|---|---|---|---|
| US17/580,541 US12299868B2 (en) | 2022-01-20 | 2022-01-20 | Control of a manufacturing process using contour curvature analysis of specimens |
| US17/580,541 | 2022-01-20 |
Publications (1)
| Publication Number | Publication Date |
|---|---|
| JP2023106295A true JP2023106295A (en) | 2023-08-01 |
Family
ID=87162221
Family Applications (1)
| Application Number | Title | Priority Date | Filing Date |
|---|---|---|---|
| JP2022183388A Pending JP2023106295A (en) | 2022-01-20 | 2022-11-16 | Stabilization of the manufacturing process of the specimen by shape analysis of the structural elements of the specimen |
Country Status (5)
| Country | Link |
|---|---|
| US (2) | US12299868B2 (en) |
| JP (1) | JP2023106295A (en) |
| KR (1) | KR20230112528A (en) |
| CN (1) | CN116465903A (en) |
| TW (1) | TW202331277A (en) |
Family Cites Families (4)
| Publication number | Priority date | Publication date | Assignee | Title |
|---|---|---|---|---|
| US10242290B2 (en) * | 2012-11-09 | 2019-03-26 | Kla-Tencor Corporation | Method, system, and user interface for metrology target characterization |
| US10514321B2 (en) * | 2013-03-29 | 2019-12-24 | Compagnie Generale Des Etablissements Michelin | Tire uniformity through identification of process effects using regression analysis without azimuth data |
| US10185303B2 (en) * | 2015-02-21 | 2019-01-22 | Kla-Tencor Corporation | Optimizing computational efficiency by multiple truncation of spatial harmonics |
| FR3090460B1 (en) * | 2018-12-19 | 2020-12-11 | Commissariat Energie Atomique | PREDICTION OF THE FORM OF A THREE-DIMENSIONAL OBJECT SUBJECT TO A DISSEMINATION PROCESS |
-
2022
- 2022-01-20 US US17/580,541 patent/US12299868B2/en active Active
- 2022-11-16 JP JP2022183388A patent/JP2023106295A/en active Pending
- 2022-11-23 CN CN202211475052.5A patent/CN116465903A/en active Pending
- 2022-11-23 TW TW111144764A patent/TW202331277A/en unknown
- 2022-11-28 KR KR1020220161207A patent/KR20230112528A/en active Pending
-
2025
- 2025-03-28 US US19/094,641 patent/US20250225642A1/en active Pending
Also Published As
| Publication number | Publication date |
|---|---|
| TW202331277A (en) | 2023-08-01 |
| KR20230112528A (en) | 2023-07-27 |
| US20230230223A1 (en) | 2023-07-20 |
| US12299868B2 (en) | 2025-05-13 |
| CN116465903A (en) | 2023-07-21 |
| US20250225642A1 (en) | 2025-07-10 |
Similar Documents
| Publication | Publication Date | Title |
|---|---|---|
| JP3870044B2 (en) | Pattern inspection method and pattern inspection apparatus | |
| JP2011017705A (en) | Pattern inspection device, pattern inspection method, and recording medium | |
| JP4472305B2 (en) | Pattern inspection apparatus and method | |
| JP2005277395A (en) | Pattern inspection apparatus and method | |
| JP7530330B2 (en) | Segmentation of images of semiconductor samples | |
| KR20190029670A (en) | Pattern measuring device, and computer program | |
| KR20220143644A (en) | Determination of defect locations for inspection of specimens | |
| KR102916901B1 (en) | Local shape deviation in a semiconductor specimen | |
| JP2010268009A (en) | Device and method for inspecting pattern | |
| TWI858308B (en) | Determination of defects and/or edge roughness in a specimen based on a reference image | |
| JP4597509B2 (en) | Pattern inspection apparatus and pattern inspection method | |
| JP2023106295A (en) | Stabilization of the manufacturing process of the specimen by shape analysis of the structural elements of the specimen | |
| US11443420B2 (en) | Generating a metrology recipe usable for examination of a semiconductor specimen | |
| TWI759523B (en) | Method and system for reducing nuisance in defect analysis, and computer program product | |
| JP5037590B2 (en) | Pattern inspection apparatus and method | |
| US20250265697A1 (en) | Registration between an inspection image and a design image | |
| US20250329010A1 (en) | Roughness estimation for examination of semiconductor specimens | |
| KR20250107123A (en) | Systems and methods for registration between images informative of one or more semiconductor specimens |
Legal Events
| Date | Code | Title | Description |
|---|---|---|---|
| A621 | Written request for application examination |
Free format text: JAPANESE INTERMEDIATE CODE: A621 Effective date: 20251113 |