JP2023065352A - Image analysis method, image analysis device, program, method for manufacturing learned deep learning algorithm, and learned deep learning algorithm - Google Patents
Image analysis method, image analysis device, program, method for manufacturing learned deep learning algorithm, and learned deep learning algorithm Download PDFInfo
- Publication number
- JP2023065352A JP2023065352A JP2023008540A JP2023008540A JP2023065352A JP 2023065352 A JP2023065352 A JP 2023065352A JP 2023008540 A JP2023008540 A JP 2023008540A JP 2023008540 A JP2023008540 A JP 2023008540A JP 2023065352 A JP2023065352 A JP 2023065352A
- Authority
- JP
- Japan
- Prior art keywords
- image
- tissue
- region
- data
- analysis
- Prior art date
- Legal status (The legal status is an assumption and is not a legal conclusion. Google has not performed a legal analysis and makes no representation as to the accuracy of the status listed.)
- Granted
Links
- 238000013135 deep learning Methods 0.000 title claims abstract description 142
- 238000010191 image analysis Methods 0.000 title claims abstract description 117
- 238000004422 calculation algorithm Methods 0.000 title claims abstract description 108
- 238000000034 method Methods 0.000 title claims abstract description 69
- 238000003703 image analysis method Methods 0.000 title claims abstract description 44
- 238000004519 manufacturing process Methods 0.000 title abstract description 5
- 206010028980 Neoplasm Diseases 0.000 claims abstract description 253
- 238000004458 analytical method Methods 0.000 claims abstract description 230
- 238000012549 training Methods 0.000 claims description 441
- 238000012545 processing Methods 0.000 claims description 229
- 238000013528 artificial neural network Methods 0.000 claims description 101
- 230000006870 function Effects 0.000 claims description 42
- 239000003086 colorant Substances 0.000 claims description 36
- 230000008569 process Effects 0.000 claims description 29
- 238000010186 staining Methods 0.000 claims description 21
- 238000003745 diagnosis Methods 0.000 claims description 17
- WZUVPPKBWHMQCE-UHFFFAOYSA-N Haematoxylin Chemical compound C12=CC(O)=C(O)C=C2CC2(O)C1C1=CC=C(O)C(O)=C1OC2 WZUVPPKBWHMQCE-UHFFFAOYSA-N 0.000 claims description 12
- 238000007490 hematoxylin and eosin (H&E) staining Methods 0.000 claims description 9
- 230000004913 activation Effects 0.000 claims description 8
- 210000004881 tumor cell Anatomy 0.000 claims description 7
- 238000004590 computer program Methods 0.000 claims description 6
- 238000005520 cutting process Methods 0.000 claims description 5
- 238000012758 nuclear staining Methods 0.000 claims description 3
- 230000007935 neutral effect Effects 0.000 abstract 1
- 210000001519 tissue Anatomy 0.000 description 244
- 238000010586 diagram Methods 0.000 description 55
- 238000003384 imaging method Methods 0.000 description 44
- 238000003860 storage Methods 0.000 description 32
- 201000011510 cancer Diseases 0.000 description 16
- 210000004027 cell Anatomy 0.000 description 13
- 238000001514 detection method Methods 0.000 description 12
- 208000005718 Stomach Neoplasms Diseases 0.000 description 11
- 206010017758 gastric cancer Diseases 0.000 description 11
- 201000011549 stomach cancer Diseases 0.000 description 11
- 238000004364 calculation method Methods 0.000 description 10
- 210000003855 cell nucleus Anatomy 0.000 description 7
- 238000011478 gradient descent method Methods 0.000 description 6
- 210000004882 non-tumor cell Anatomy 0.000 description 6
- 230000008520 organization Effects 0.000 description 5
- 230000001575 pathological effect Effects 0.000 description 5
- 238000012333 histopathological diagnosis Methods 0.000 description 4
- 238000012886 linear function Methods 0.000 description 4
- 238000012216 screening Methods 0.000 description 4
- 230000035945 sensitivity Effects 0.000 description 4
- 239000011521 glass Substances 0.000 description 3
- 239000004973 liquid crystal related substance Substances 0.000 description 3
- 238000010801 machine learning Methods 0.000 description 3
- 230000003287 optical effect Effects 0.000 description 3
- 238000010827 pathological analysis Methods 0.000 description 3
- 238000001356 surgical procedure Methods 0.000 description 3
- WSFSSNUMVMOOMR-UHFFFAOYSA-N Formaldehyde Chemical compound O=C WSFSSNUMVMOOMR-UHFFFAOYSA-N 0.000 description 2
- 241000699666 Mus <mouse, genus> Species 0.000 description 2
- 206010061902 Pancreatic neoplasm Diseases 0.000 description 2
- 238000013527 convolutional neural network Methods 0.000 description 2
- 230000003111 delayed effect Effects 0.000 description 2
- 230000002496 gastric effect Effects 0.000 description 2
- 201000007270 liver cancer Diseases 0.000 description 2
- 208000014018 liver neoplasm Diseases 0.000 description 2
- 208000015486 malignant pancreatic neoplasm Diseases 0.000 description 2
- 239000011159 matrix material Substances 0.000 description 2
- 201000002528 pancreatic cancer Diseases 0.000 description 2
- 208000008443 pancreatic carcinoma Diseases 0.000 description 2
- 238000007781 pre-processing Methods 0.000 description 2
- 238000012360 testing method Methods 0.000 description 2
- 238000012795 verification Methods 0.000 description 2
- 206010005003 Bladder cancer Diseases 0.000 description 1
- 206010006187 Breast cancer Diseases 0.000 description 1
- 208000026310 Breast neoplasm Diseases 0.000 description 1
- 201000009030 Carcinoma Diseases 0.000 description 1
- 102000008186 Collagen Human genes 0.000 description 1
- 108010035532 Collagen Proteins 0.000 description 1
- 206010009944 Colon cancer Diseases 0.000 description 1
- 206010061825 Duodenal neoplasm Diseases 0.000 description 1
- 102000004856 Lectins Human genes 0.000 description 1
- 108090001090 Lectins Proteins 0.000 description 1
- 206010058467 Lung neoplasm malignant Diseases 0.000 description 1
- 208000007433 Lymphatic Metastasis Diseases 0.000 description 1
- 241000124008 Mammalia Species 0.000 description 1
- 241000699670 Mus sp. Species 0.000 description 1
- 206010033128 Ovarian cancer Diseases 0.000 description 1
- 206010061535 Ovarian neoplasm Diseases 0.000 description 1
- 208000006994 Precancerous Conditions Diseases 0.000 description 1
- 206010060862 Prostate cancer Diseases 0.000 description 1
- 208000000236 Prostatic Neoplasms Diseases 0.000 description 1
- 208000015634 Rectal Neoplasms Diseases 0.000 description 1
- 208000009125 Sigmoid Neoplasms Diseases 0.000 description 1
- 208000000453 Skin Neoplasms Diseases 0.000 description 1
- 206010054184 Small intestine carcinoma Diseases 0.000 description 1
- 208000024770 Thyroid neoplasm Diseases 0.000 description 1
- 208000007097 Urinary Bladder Neoplasms Diseases 0.000 description 1
- 208000009956 adenocarcinoma Diseases 0.000 description 1
- 210000000436 anus Anatomy 0.000 description 1
- 210000001815 ascending colon Anatomy 0.000 description 1
- 238000001574 biopsy Methods 0.000 description 1
- 210000000621 bronchi Anatomy 0.000 description 1
- 210000004534 cecum Anatomy 0.000 description 1
- 230000008859 change Effects 0.000 description 1
- 229920001436 collagen Polymers 0.000 description 1
- 208000029742 colonic neoplasm Diseases 0.000 description 1
- 230000007423 decrease Effects 0.000 description 1
- 201000000312 duodenum cancer Diseases 0.000 description 1
- YQGOJNYOYNNSMM-UHFFFAOYSA-N eosin Chemical compound [Na+].OC(=O)C1=CC=CC=C1C1=C2C=C(Br)C(=O)C(Br)=C2OC2=C(Br)C(O)=C(Br)C=C21 YQGOJNYOYNNSMM-UHFFFAOYSA-N 0.000 description 1
- 239000000284 extract Substances 0.000 description 1
- 210000004996 female reproductive system Anatomy 0.000 description 1
- 239000000834 fixative Substances 0.000 description 1
- 238000002073 fluorescence micrograph Methods 0.000 description 1
- 238000012252 genetic analysis Methods 0.000 description 1
- 230000002068 genetic effect Effects 0.000 description 1
- 238000012744 immunostaining Methods 0.000 description 1
- 210000003734 kidney Anatomy 0.000 description 1
- 208000003849 large cell carcinoma Diseases 0.000 description 1
- 239000002523 lectin Substances 0.000 description 1
- 210000004072 lung Anatomy 0.000 description 1
- 201000005202 lung cancer Diseases 0.000 description 1
- 208000020816 lung neoplasm Diseases 0.000 description 1
- 230000003211 malignant effect Effects 0.000 description 1
- 210000004940 nucleus Anatomy 0.000 description 1
- 210000003101 oviduct Anatomy 0.000 description 1
- 239000012188 paraffin wax Substances 0.000 description 1
- 238000002360 preparation method Methods 0.000 description 1
- 206010038038 rectal cancer Diseases 0.000 description 1
- 210000000664 rectum Anatomy 0.000 description 1
- 201000001275 rectum cancer Diseases 0.000 description 1
- 238000002271 resection Methods 0.000 description 1
- 230000000241 respiratory effect Effects 0.000 description 1
- 210000002345 respiratory system Anatomy 0.000 description 1
- 230000004044 response Effects 0.000 description 1
- 238000007789 sealing Methods 0.000 description 1
- 210000001599 sigmoid colon Anatomy 0.000 description 1
- 201000003825 sigmoid colon cancer Diseases 0.000 description 1
- 201000000849 skin cancer Diseases 0.000 description 1
- 208000000649 small cell carcinoma Diseases 0.000 description 1
- 206010041823 squamous cell carcinoma Diseases 0.000 description 1
- 238000012706 support-vector machine Methods 0.000 description 1
- 201000002510 thyroid cancer Diseases 0.000 description 1
- 210000003437 trachea Anatomy 0.000 description 1
- 210000003384 transverse colon Anatomy 0.000 description 1
- 210000000626 ureter Anatomy 0.000 description 1
- 210000003932 urinary bladder Anatomy 0.000 description 1
- 201000005112 urinary bladder cancer Diseases 0.000 description 1
- 230000002485 urinary effect Effects 0.000 description 1
- 210000004291 uterus Anatomy 0.000 description 1
Images


Abstract
Description
本明細書には、画像解析方法、画像解析装置、プログラム、学習済み深層学習アルゴリ
ズムの製造方法および学習済み深層学習アルゴリズムが開示される。より詳細には、解析
対象の組織の画像について、解析用データに含まれる領域が腫瘍領域であるか否かを示す
データを生成することを含む画像解析方法、画像解析装置、プログラム、学習済み深層学
習アルゴリズムの製造方法および学習済み深層学習アルゴリズム等が開示される。
Disclosed herein are an image analysis method, an image analysis apparatus, a program, a method for producing a trained deep learning algorithm, and a trained deep learning algorithm. More specifically, an image analysis method, an image analysis apparatus, a program, a learned deep layer, including generating data indicating whether or not a region included in analysis data is a tumor region in an image of a tissue to be analyzed A method of manufacturing a learning algorithm, a trained deep learning algorithm, and the like are disclosed.
特許文献1には、病理組織画像において組織像を、正常、良性腫瘍、前癌状態および癌
状態の4つのグループに分類し、判定する画像診断支援装置が開示されている。画像分類
手段は、画像データから注視領域を抽出し、注視領域の特徴を示す特徴量を算出し、算出
した特徴量に基づいてグループの分類を行う。特徴量は、細胞核における単位面積あたり
の塊の密度、塊面積の密度、塊の面積、塊の太さ、および塊の長さなどである。画像判定
手段は、このような特徴量と判定結果との関係を学習し、学習済みの学習パラメータに基
づいて判定を行う。学習は、サポートベクターマシンなどの学習アルゴリズムを用いて、
機械学習を実行する。
perform machine learning;
悪性腫瘍であるか否かを確定診断する際に、病理組織標本を用いた病理組織診断が行わ
れる。また病理組織診断は、手術中に悪性腫瘍を含む組織の切除部位を決定するための術
中迅速診断として行われることも少なくない。術中迅速診断は、手術中に患者の患部を切
開した状態で待機させ、腫瘍が悪性であるか、切除した組織の断端に腫瘍が残っていない
か、リンパ節転移があるか等の判断を病理組織診断により行うものである。術中迅速診断
の結果により、待機している患者のその後の手術の方向性が決められる。
A histopathological diagnosis using a histopathological specimen is performed when making a definitive diagnosis as to whether or not it is a malignant tumor. Histopathological diagnosis is often performed as an intraoperative rapid diagnosis for determining the resection site of a tissue containing a malignant tumor during surgery. Intraoperative rapid diagnosis allows the patient to wait while the affected area is incised during surgery, and determines whether the tumor is malignant, whether there is tumor remaining in the resected tissue stump, whether there is lymph node metastasis, etc. It is performed by histopathological diagnosis. The results of intraoperative rapid diagnostics guide subsequent surgery for waiting patients.
病理組織診断は、医師、特に病理医が顕微鏡等により組織標本を観察して診断するが、
組織標本の観察により正確な確定診断を行えるようになるためには、長い期間、熟練した
病理専門医の元で、様々な症例の組織標本の観察を繰り返す必要があり、病理医の育成に
も膨大な時間を要している。
Histopathological diagnosis is made by a doctor, especially a pathologist, by observing a tissue sample with a microscope or the like.
In order to be able to make an accurate definitive diagnosis by observing tissue specimens, it is necessary to repeatedly observe tissue specimens from various cases over a long period of time under the supervision of a skilled pathologist, and the training of pathologists is enormous. It takes time.
病理医の不足は深刻であり、病理医が不足している結果、患者の悪性腫瘍の確定診断が
遅れ、治療開始が遅れる、あるいは確定診断を待たずに治療を開始するという状態も危惧
されている。また、通常の組織診断と術中迅速診断との両方が、少ない病理医に集中する
ために、一人の病理医の業務量が膨大となり、病理医自身の労務状態も問題となっている
。しかし、現在のところこの問題の解消策は見つかっていない。
The shortage of pathologists is serious, and as a result of the shortage of pathologists, there is concern that the definitive diagnosis of malignant tumors in patients will be delayed and the start of treatment will be delayed, or that treatment will be started without waiting for a definitive diagnosis. there is Moreover, since both the normal tissue diagnosis and the rapid intraoperative diagnosis are concentrated on a small number of pathologists, the workload of one pathologist becomes enormous, and the working condition of the pathologist himself becomes a problem. However, no solution to this problem has been found so far.
したがって、病理組織診断を装置がサポートできるようになることは、特にその診断が
人の目による判断に近いほど、病理医不足の解消、および病理医の労務状態の改善に大き
く貢献すると考えられる。
Therefore, it is believed that the device's ability to support pathological tissue diagnosis will greatly contribute to resolving the shortage of pathologists and improving the working conditions of pathologists, especially when the diagnosis is closer to the judgment by human eyes.
装置が病理組織診断をサポートするという点において、上述の特許文献1に記載の発明
では、機械学習による画像解析に基づいて標本組織の病理判定を行っている。この方法で
は、特徴量を人の手で作成する必要がある。特徴量を人の手で作成する方法には、その人
の力量が画像解析の性能に大きく影響を与えるという問題がある。さらに、特許文献1に
記載の発明は、顕微鏡で強拡大された組織標本の画像内の細胞核1つ1つに対して癌細胞
の核であるか否かの判定を行う。したがって、標本1枚の全体について解析しようとする
と長い解析時間を要するという問題がある。
In terms of the fact that the device supports pathological tissue diagnosis, the invention described in the above-mentioned
したがって、個々の細胞について癌細胞の核であるか否かを病理医や機械学習アルゴリ
ズムによって判定する前に、1枚の標本に含まれる組織全体を観察し、その標本のどの部
位に腫瘍組織が含まれるかをスクリーニングすることは、1枚の標本に対する病理診断に
かかる時間を短縮する一助となる。
Therefore, before determining whether individual cells are the nuclei of cancer cells by pathologists or machine learning algorithms, the entire tissue contained in a single specimen is observed, and it is possible to determine which part of the specimen contains tumor tissue. Screening for inclusion helps reduce the time it takes to make a pathological diagnosis for a single specimen.
本発明は、解析対象の組織が解析用データに含まれる領域が腫瘍領域であるか否かを示
すデータを生成する画像解析方法、画像解析装置、プログラム、学習済み深層学習アルゴ
リズムの製造方法および学習済み深層学習アルゴリズムを提供することを課題とする。
The present invention provides an image analysis method, an image analysis apparatus, a program, a method for producing a learned deep learning algorithm, and a learning method for generating data indicating whether a region in which a tissue to be analyzed is included in analysis data is a tumor region. An object of the present invention is to provide an advanced deep learning algorithm.
ある実施形態は、ニューラルネットワーク構造の深層学習アルゴリズム(60)を用い
て、組織の画像を解析する画像解析方法に関する。前記画像解析方法では、解析対象の組
織を含む解析対象画像(78)から解析用データ(80)を生成し、解析用データ(80
)を、深層学習アルゴリズム(60)に入力し、深層学習アルゴリズム(60)によって
、解析用データに含まれる領域が腫瘍領域であるか否かを示すデータを生成する。本発明
によれば、解析対象の組織における解析用データに含まれる領域が腫瘍領域であるか否か
を示すデータを生成することができる。
An embodiment relates to an image analysis method for analyzing tissue images using a neural network structured deep learning algorithm (60). In the image analysis method, the analysis data (80) is generated from the analysis target image (78) including the analysis target tissue, and the analysis data (80
) is input to a deep learning algorithm (60), and the deep learning algorithm (60) generates data indicating whether or not the region included in the analysis data is a tumor region. According to the present invention, it is possible to generate data indicating whether or not a region included in analysis data in a tissue to be analyzed is a tumor region.
前記実施形態において、好ましくは、解析用データに含まれる領域が腫瘍領域であるか
否かを示すデータは、腫瘍領域の領域を示すデータである。この実施形態により、ユーザ
が一目で解析対象の組織における腫瘍領域を把握することができる。
In the above embodiment, the data indicating whether or not the area included in the analysis data is a tumor area is preferably data indicating a tumor area. This embodiment allows the user to grasp the tumor region in the tissue to be analyzed at a glance.
前記実施形態において、好ましくは、前記解析対象画像は、組織診断用標本の画像であ
り、2以上の原色を組み合わせた色相を含む。この実施形態により、病理診断を一助する
ことができる。
In the above embodiment, the image to be analyzed is preferably an image of a specimen for tissue diagnosis, and includes a hue obtained by combining two or more primary colors. This embodiment can aid pathological diagnosis.
前記実施形態において、好ましくは、前記解析対象画像は、前記解析対象の組織を3倍
から20倍に拡大して撮像された画像である。前記実施形態において、解析対象画像に含
まれる領域の大きさが、200μm×200μm以上400μm×400μm以下である
。これらの実施形態により、より精度の高い判別を行うことができる。
In the above-described embodiment, preferably, the analysis target image is an image captured by enlarging the analysis target tissue by a factor of 3 to 20. In the above embodiment, the size of the region included in the image to be analyzed is 200 μm×200 μm or more and 400 μm×400 μm or less. These embodiments enable determination with higher accuracy.
前記実施形態において、好ましくは、解析用データに含まれる領域が腫瘍領域であるか
否かを示すデータに基づいて、腫瘍細胞の領域とそれ以外の領域とを区別して提示するた
めのデータを生成する。この実施形態により、ユーザが一目で解析対象の組織における腫
瘍領域を把握することができる。
In the above embodiment, preferably, based on data indicating whether or not a region included in the analysis data is a tumor region, data for distinguishing between a tumor cell region and other regions is generated. do. This embodiment allows the user to grasp the tumor region in the tissue to be analyzed at a glance.
前記実施形態において、好ましくは、解析用データに含まれる領域が腫瘍領域であるか
否かを示すデータに基づいて、腫瘍細胞の領域とそれ以外の領域との境界を示すデータを
生成する。この実施形態により、ユーザが一目で解析対象の組織における腫瘍領域と非腫
瘍領域の境界を把握することができる。
In the above embodiment, data indicating the boundary between the tumor cell area and other areas is preferably generated based on the data indicating whether or not the area included in the analysis data is the tumor area. According to this embodiment, the user can grasp the boundary between the tumor area and the non-tumor area in the tissue to be analyzed at a glance.
前記実施形態において、好ましくは、解析用データに含まれる領域が腫瘍領域であるか
否かを示すデータに基づいて、前記解析対象の組織における腫瘍領域の含有率を示すデー
タを生成する。この実施形態により、ユーザが解析対象の組織における腫瘍領域の含有率
を把握することができる。
In the above embodiment, preferably, data indicating the tumor area content rate in the tissue to be analyzed is generated based on data indicating whether or not the area included in the analysis data is a tumor area. This embodiment allows the user to grasp the content rate of the tumor region in the tissue to be analyzed.
前記実施形態において、好ましくは、解析用データに含まれる領域が腫瘍領域であるか
否かを示すデータに基づいて、前記解析対象の組織における腫瘍領域と非腫瘍領域の比率
を示すデータを生成する。この実施形態により、ユーザが解析対象の組織における腫瘍領
域の含有率を把握することができる。また、遺伝子検査等に使用されるサンプルが適切に
採取されているか知ることができる。
In the above embodiment, data indicating the ratio of the tumor area to the non-tumor area in the tissue to be analyzed is preferably generated based on the data indicating whether or not the area included in the analysis data is the tumor area. . This embodiment allows the user to grasp the content rate of the tumor region in the tissue to be analyzed. In addition, it is possible to know whether samples used for genetic testing or the like are properly collected.
前記実施態様により、好ましくは、1つの解析対象画像について、腫瘍領域と、非腫瘍
領域と、組織を含まない領域とを区別して提示するためのデータを生成する。この実施形
態により、ユーザが一目で解析対象の組織における腫瘍領域の有無を把握することができ
る。
According to the above-described embodiment, preferably, for one image to be analyzed, data is generated for distinguishing and presenting a tumor region, a non-tumor region, and a region that does not contain tissue. According to this embodiment, the user can grasp the presence or absence of a tumor region in the tissue to be analyzed at a glance.
前記実施形態において、好ましくは、1つの解析対象画像について所定画素数の領域毎
に応じた複数の解析用データを生成する。この実施形態により、解析対象の組織の広い範
囲について、精度よく解析を行うことができる。
In the above-described embodiment, preferably, a plurality of pieces of analysis data are generated for each area of a predetermined number of pixels for one image to be analyzed. According to this embodiment, a wide range of tissue to be analyzed can be analyzed with high accuracy.
前記実施形態において、好ましくは、深層学習アルゴリズム(60)は、入力された前
記解析用データに対し前記所定画素数の領域が腫瘍領域および非腫瘍領域から選択される
少なくとも一方を含むことを示すラベルを生成する。
In the above-described embodiment, preferably, the deep learning algorithm (60) includes a label indicating that the region of the predetermined number of pixels includes at least one selected from a tumor region and a non-tumor region for the input analysis data. to generate
前記実施形態において、好ましくは、ニューラルネットワーク(50)の入力層(50
a)のノード数が、解析用データ(80)の前記所定画素数と前記組み合わせた原色の数
との積に対応している。この実施形態により、精度の高い解析を行うことができる。
In said embodiment, preferably the input layer (50) of the neural network (50)
The number of nodes in a) corresponds to the product of the predetermined number of pixels of the analysis data (80) and the number of combined primary colors. According to this embodiment, highly accurate analysis can be performed.
前記実施形態において、好ましくは、前記標本が染色された標本であり、前記解析対象
画像は、前記染色された標本を顕微鏡の明視野下で撮像した画像である。この実施形態に
より、病理診断を一助することができる。
In the above embodiment, preferably, the specimen is a stained specimen, and the image to be analyzed is an image of the stained specimen taken under a bright field of a microscope. This embodiment can aid pathological diagnosis.
前記実施形態において、好ましくは、前記深層学習アルゴリズムの学習に用いられる訓
練データが、個体から採取された腫瘍領域を含む組織の標本に対して明視野観察用染色を
施して作製された標本の染色像を顕微鏡の明視野下で撮像した明視野画像に基づいて生成
されている。この実施形態により、組織診断を一助することができる。
In the above embodiment, preferably, the training data used for learning the deep learning algorithm is staining of a specimen prepared by subjecting a tissue specimen containing a tumor region collected from an individual to bright-field observation staining. The image is generated based on a bright field image taken under the bright field of a microscope. This embodiment can aid tissue diagnosis.
前記実施形態において、好ましくは、前記明視野観察用染色は、核染色にヘマトキシリ
ンを用いる。より好ましくは、前記明視野観察用染色が、ヘマトキシリン・エオジン染色
(HE染色)である。この実施形態により、組織診断として汎用性の高い検査を網羅する
ことができる。
In the above embodiment, the staining for bright field observation preferably uses hematoxylin for nuclear staining. More preferably, the staining for bright field observation is hematoxylin and eosin staining (HE staining). According to this embodiment, it is possible to cover highly versatile examinations as tissue diagnosis.
前記実施形態において、好ましくは、前記訓練データが、前記明視野画像から判定され
た、腫瘍領域であることを示すラベル値を含む。より好ましくは、前記訓練データが、前
記ラベル値を前記明視野画像の所定画素数の領域毎に含む。この実施形態により、腫瘍領
域の訓練データを生成することができる。
In the above embodiment, preferably the training data includes label values indicating tumor regions determined from the bright field images. More preferably, the training data includes the label value for each region of a predetermined number of pixels of the bright-field image. This embodiment allows the generation of training data for tumor regions.
前記実施形態において、好ましくは、前記訓練データが、前記明視野画像における所定
画素数の領域毎に生成されている。この態様により、深層学習アルゴリズム(50)の学
習効率を上げることができる。
In the above embodiment, the training data is preferably generated for each area of a predetermined number of pixels in the bright-field image. This aspect can increase the learning efficiency of the deep learning algorithm (50).
前記実施形態において、好ましくは、前記深層学習アルゴリズムが、前記解析用データ
を、前記解析対象画像に含まれる組織が腫瘍領域であることを示すクラスに分類する。
In the above embodiment, preferably, the deep learning algorithm classifies the analysis data into classes indicating that the tissue included in the image to be analyzed is a tumor region.
前記実施形態において、好ましくは、前記ニューラルネットワーク(50)の出力層(
50b)がソフトマックス関数を活性化関数とするノードである。この実施形態により、
学習効率および解析精度を上げることができる。
In said embodiment, preferably, the output layer of said neural network (50) (
50b) is a node that uses the softmax function as an activation function. This embodiment provides
Learning efficiency and analysis accuracy can be improved.
前記実施形態において、好ましくは、前記深層学習アルゴリズムは、解析用データ(7
8)が入力される度に、前記解析対象画像に含まれる組織が腫瘍領域であることを示すデ
ータを所定画素数の領域毎に生成する。この実施形態により、解析効率を上げることがで
きる。
In the above embodiment, preferably, the deep learning algorithm uses data for analysis (7
Each time 8) is input, data indicating that the tissue included in the image to be analyzed is a tumor region is generated for each region of a predetermined number of pixels. This embodiment can increase analysis efficiency.
前記実施形態において、好ましくは、深層学習アルゴリズム(60)が、前記組織の種
類に応じて生成されている。さらに、好ましくは、前記組織の種類に応じて複数の前記深
層学習アルゴリズムの中から選択された、前記解析対象の組織の種類に対応する前記深層
学習アルゴリズムを用いて、前記解析用データを処理する。この実施形態により、解析精
度を上げることができる。
In said embodiment, preferably a deep learning algorithm (60) is generated according to said tissue type. Furthermore, preferably, the analysis data is processed using the deep learning algorithm corresponding to the type of the tissue to be analyzed, which is selected from among the plurality of deep learning algorithms according to the type of the tissue. . This embodiment can improve analysis accuracy.
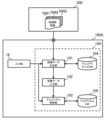
ある実施形態は、ニューラルネットワーク構造の深層学習アルゴリズム(60)を用い
て、組織の画像を解析する画像解析装置(100)に関する。前記解析装置は、解析対象
の組織を含む解析対象画像(78)から解析用データ(80)を生成し、解析用データ(
80)を、深層学習アルゴリズム(50)に入力し、深層学習アルゴリズム(50)によ
って、前記解析用データに含まれる領域が腫瘍領域であるか否かを示すデータを生成する
処理部(10)を備える。
An embodiment relates to an image analysis device (100) for analyzing tissue images using a neural network structured deep learning algorithm (60). The analysis device generates analysis data (80) from an analysis target image (78) including the analysis target tissue, and analyzes data (
80) is input to a deep learning algorithm (50), and the deep learning algorithm (50) generates data indicating whether or not the region included in the analysis data is a tumor region (10) Prepare.
ある実施形態は、ニューラルネットワーク構造の深層学習アルゴリズム(60)を用い
て、組織の画像を解析するコンピュータプログラムに関する。前記コンピュータに、解析
対象の組織を含む解析対象画像(78)から解析用データ(80)を生成する処理と、解
析用データ(80)を、深層学習アルゴリズム(60)に入力する処理と、深層学習アル
ゴリズム(60)によって、前記解析用データに含まれる領域が腫瘍領域であるか否かを
示すデータを生成する処理と、を実行させる。
One embodiment relates to a computer program for analyzing images of tissue using a neural network structure deep learning algorithm (60). In the computer, processing for generating analysis data (80) from an analysis target image (78) including the analysis target tissue, processing for inputting the analysis data (80) to a deep learning algorithm (60), and a process of generating data indicating whether or not the area included in the analysis data is a tumor area by a learning algorithm (60).
ある実施態様は、深層学習アルゴリズム(50)の学習に用いられる訓練データを訓練
用の組織標本から取得した訓練用画像に基づいて生成するステップと、前記訓練データを
ニューラルネットワーク(50)に学習させる学習させるステップと、を含み、前記生成
ステップは、腫瘍領域を撮像した第1の訓練用画像(70R1)に対応する第1の訓練デ
ータ(74R1)を取得する第1の取得ステップと、非腫瘍領域を撮像した第2の訓練用
画像(70R2)に対応する第2の訓練データ(74R2)を取得する第2の取得ステッ
プと、組織を含まない領域を撮像した第3の訓練用画像(70R3)に対応する第3の訓
練データ(74R3)を取得する第3の取得ステップと、を含み、前記学習ステップは、
前記第1の訓練データ(74R1)が、腫瘍領域であることをニューラルネットワーク(
50)に学習させる第1の学習ステップと、前記第2の訓練データ(74R2)が、非腫
瘍領域であることをニューラルネットワーク(50)に学習させる第2の学習ステップと
、前記第3の訓練データ(74R3)が、組織を含まない領域であることをニューラルネ
ットワーク(50)に学習させる第3の学習ステップと、を含む、学習済み深層学習アル
ゴリズムの生成方法に関する。好ましくは、前記第1の訓練データ(74R1)と、第2
の訓練データ(74R2)と、第3の訓練データ(74R3)とをニューラルネットワー
ク(50)の入力層(50a)とし、腫瘍領域であることと、非腫瘍領域であることと、
組織を含まない領域であることとをそれぞれ前記第1の訓練データ(74R1)と、第2
の訓練データ(74R2)と、第3の訓練データ(74R3)とに対応するニューラルネ
ットワーク(50)の出力層(50b)とする。さらに好ましくは、前記第1の取得ステ
ップの前に、前記第1の訓練用画像(70R1)から、前記第1の訓練データ(74R1
)を生成するステップと、前記第2の取得ステップの前に、前記第2の訓練用画像(70
R2)から、前記第2の訓練データ(74R2)を生成するステップと、前記第3の取得
ステップの前に、前記第3の訓練用画像(70R3)から、前記第3の訓練データ(74
R3)を生成するステップと、をさらに含む。本実施形態によれば、解析対象の組織が、
腫瘍領域および非腫瘍領域から選択される少なくとも一方を含むことを判別する、学習済
み深層学習アルゴリズムの生成することができる。
An embodiment comprises the steps of: generating training data for use in training a deep learning algorithm (50) based on training images obtained from a training tissue specimen; and training a neural network (50) on said training data. and the generating step includes a first acquisition step of acquiring first training data (74R1) corresponding to a first training image (70R1) imaging a tumor region; A second acquisition step of acquiring second training data (74R2) corresponding to a second training image (70R2) imaging a region; and a third training image (70R3) imaging a tissue-free region. ), wherein the learning step comprises:
The neural network (
50), a first learning step of learning that the second training data (74R2) is a non-tumor area, a second learning step of learning the neural network (50), and the third training a third training step of training the neural network (50) that the data (74R3) is a tissue-free region. Preferably, the first training data (74R1) and the second
The training data (74R2) and the third training data (74R3) are used as the input layer (50a) of the neural network (50), and the tumor region, the non-tumor region,
The first training data (74R1) and the second
training data (74R2) and the output layer (50b) of the neural network (50) corresponding to the third training data (74R3). More preferably, prior to said first acquisition step, from said first training images (70R1) said first training data (74R1
) and prior to said second acquisition step said second training image (70
R2) to generate said second training data (74R2); and prior to said third acquisition step, from said third training images (70R3) to said third training data (74
R3). According to this embodiment, the tissue to be analyzed is
A trained deep learning algorithm can be generated that discriminates including at least one selected from tumor regions and non-tumor regions.
前記生成方法において、好ましくは、前記訓練用画像が、個体から採取された組織に対
して明視野観察用染色を施して作製された標本の染色像を顕微鏡の明視野下で撮像した明
視野画像である。
In the generating method, preferably, the training image is a bright-field image obtained by imaging a stained image of a specimen prepared by staining a tissue taken from an individual for bright-field observation under a bright field of a microscope. is.
ある実施形態は、第1の訓練データ(74R1)と、第2の訓練データ(74R2)と
、第3の訓練データ(74R3)とをニューラルネットワーク(50)の入力層(50a
)とし、腫瘍領域であることと、非腫瘍領域であることと、組織を含まない領域であるこ
ととをそれぞれ前記第1の訓練データ(74R1)と、第2の訓練データ(74R2)と
、第3の訓練データ(74R3)とに対応するニューラルネットワーク(50)の出力層
(50b)として学習させた深層学習アルゴリズムであって、前記第1の訓練データ(7
4R1)は、訓練用の組織の腫瘍領域を撮像した第1の訓練用画像(70R1)から生成
され、前記第2の訓練データ(74R2)は、訓練用の組織の非腫瘍領域を撮像した第2
の訓練用画像(70R2)から生成され、前記第3の訓練データ(74R3)は、組織を
含まない領域を撮像した第3の訓練用画像(70R3)から生成される、学習済み深層学
習アルゴリズム(60)である。
Some embodiments pass the first training data (74R1), the second training data (74R2) and the third training data (74R3) to the input layer (50a) of the neural network (50).
), and the first training data (74R1), the second training data (74R2), and the tumor region, non-tumor region, and tissue-free region, respectively, A deep learning algorithm trained as an output layer (50b) of a neural network (50) corresponding to third training data (74R3) and said first training data (74R3)
4R1) is generated from a first training image (70R1) imaging a tumor region of training tissue, and said second training data (74R2) is generated from a first training image imaging a non-tumor region of training tissue. 2
A trained deep learning algorithm ( 60).
標本に含まれる組織全体を観察し、その標本のどの部位に腫瘍組織が含まれるかスクリ
ーニングするためのデータを生成することができる。
It is possible to observe the entire tissue contained in the specimen and generate data for screening which part of the specimen contains the tumor tissue.
以下、本発明の概要および実施の形態を、添付の図面を参照して詳細に説明する。なお
、以下の説明および図面において、同じ符号は同じまたは類似の構成要素を示すこととし
、よって、同じまたは類似の構成要素に関する説明を省略する。
The outline and embodiments of the present invention will be described in detail below with reference to the accompanying drawings. In the following description and drawings, the same reference numerals denote the same or similar components, and thus the description of the same or similar components is omitted.
画像解析方法は、組織の画像を解析する。前記画像解析方法は、ニューラルネットワー
ク構造の、好ましくは、畳み込みニューラルネットワーク構造の深層学習アルゴリズムを
用いる。前記画像解析方法は、解析用データに含まれる領域が腫瘍領域であるか否かを示
すデータを生成することを含む。
The image analysis method analyzes an image of tissue. Said image analysis method uses a deep learning algorithm of neural network structure, preferably of convolutional neural network structure. The image analysis method includes generating data indicating whether a region included in the analysis data is a tumor region.
本発明において、組織または細胞の画像は、組織試料の標本または細胞を含む試料の標
本から取得される画像である。組織試料の標本または細胞を含む試料の標本は、個体から
採取される。個体は、特に制限されないが、好ましくは哺乳類であり、より好ましくはヒ
トである。前記個体から試料が採取される際に、個体が生きているか死亡しているかは問
わない。前記組織は、個体内に存在するものである限り、制限されない。前記個体から採
取された組織としては、外科的な切除組織、生検組織等を挙げることができる。前記腫瘍
は上皮性および非上皮性のいずれであってもよい。前記腫瘍として好ましくは悪性上皮性
腫瘍である。悪性腫瘍は、特に制限されないが、悪性腫瘍としては、例えば、気管、気管
支又は肺等から発生する呼吸器系悪性腫瘍;上咽頭、食道、胃、十二指腸、空腸、回腸、
盲腸、虫垂、上行結腸、横行結腸、S状結腸、直腸又は肛門部等から発生する消化管系悪
性腫瘍;肝臓癌;膵臓癌;膀胱、尿管又は腎臓から発生する泌尿器系悪性腫瘍;卵巣、卵
管および子宮等から発生する女性生殖器系悪性腫瘍;乳癌;前立腺癌;皮膚癌;視床下部
、下垂体、甲状腺、副甲状腺、副腎等の内分泌系悪性腫瘍;中枢神経系悪性腫瘍;骨軟部
組織から発生する悪性腫瘍等の固形腫瘍が挙げられる。より好ましくは、肺癌(扁平上皮
癌、小細胞癌、大細胞癌、腺癌)等の呼吸器系上皮性悪性腫瘍;胃癌、十二指腸癌、大腸
癌(S状結腸癌、直腸癌等)等の消化管系上皮性悪性腫瘍;肝臓癌;膵臓癌;膀胱癌;甲
状腺癌;卵巣癌;乳癌;前立腺癌を挙げることができる。最も好ましくは、胃癌である。
In the present invention, a tissue or cell image is an image obtained from a specimen of a tissue sample or a specimen of a sample containing cells. A specimen of a tissue sample or a specimen of a sample containing cells is taken from an individual. The individual is not particularly limited, but is preferably a mammal, more preferably a human. It does not matter whether the individual is alive or dead at the time the sample is taken from said individual. The tissue is not limited as long as it exists within the individual. Examples of the tissue collected from the individual include surgically resected tissue, biopsy tissue, and the like. Said tumors may be either epithelial or non-epithelial. The tumor is preferably a malignant epithelial tumor. Malignant tumors are not particularly limited, but examples of malignant tumors include respiratory system malignant tumors arising from the trachea, bronchi, lungs, etc.;
gastrointestinal malignant tumors arising from the cecum, appendix, ascending colon, transverse colon, sigmoid colon, rectum or anus; liver cancer; pancreatic cancer; urinary malignant tumors arising from the bladder, ureter or kidney; Female reproductive system malignant tumors arising from fallopian tubes and uterus; breast cancer; prostate cancer; skin cancer; solid tumors such as malignant tumors arising from More preferably, respiratory epithelial malignant tumors such as lung cancer (squamous cell carcinoma, small cell carcinoma, large cell carcinoma, adenocarcinoma); gastric cancer, duodenal cancer, colon cancer (sigmoid colon cancer, rectal cancer, etc.) Gastrointestinal epithelial malignant tumors; liver cancer; pancreatic cancer; bladder cancer; thyroid cancer; ovarian cancer; Most preferred is gastric cancer.
前記標本は、前記組織を顕微鏡等で観察ができるように加工した状態のもの、例えばプ
レパラートを意図する。前記標本は、公知の方法に従って作製することができる。例えば
、組織標本の場合には、前記個体から組織を採取した後に、所定の固定液(ホルマリン固
定等)で組織を固定し、その固定組織をパラフィン包埋し、パラフィン包埋組織を薄切す
る。薄切切片をスライドグラスにのせる。切片がのったスライドグラスに対して光学顕微
鏡での観察のため、すなわち明視野観察のための染色を施し、所定の封入処理をして標本
が完成する。組織標本の典型例は、組織診断用標本(病理標本)であり、染色は、へマト
キシリン・エオジン(HE)染色である。
The specimen is intended to be a preparation, for example, a state in which the tissue has been processed so that it can be observed with a microscope or the like. The specimen can be prepared according to a known method. For example, in the case of a tissue sample, after collecting tissue from the individual, the tissue is fixed with a predetermined fixative (such as formalin fixation), the fixed tissue is embedded in paraffin, and the paraffin-embedded tissue is sliced. . Place the thin section on a glass slide. The slide glass on which the section is placed is dyed for observation with an optical microscope, that is, for bright-field observation, and subjected to a predetermined sealing treatment to complete a specimen. A typical example of the tissue specimen is a histodiagnostic specimen (pathological specimen), which is stained with hematoxylin and eosin (HE).
HE染色の核染色はヘマトキシリンである。ヘマトキシリンは、組織細胞染色において
核染色剤として幅広く使用されている(例えば、免疫染色、レクチン染色、糖染色、脂肪
染色、膠原線維染色等)。このため、本発明は、このようなヘマトキシリンを核染色に使
う標本全般において、適用が可能である。
The nuclear stain for HE stain is hematoxylin. Hematoxylin is widely used as a nuclear stain in tissue cell staining (eg, immunostaining, lectin staining, sugar staining, fat staining, collagen staining, etc.). Therefore, the present invention can be applied to all specimens that use such hematoxylin for nuclear staining.
前記画像解析には、訓練用画像を用いて訓練された深層学習アルゴリズムを用いる。前
記画像解析は、前記標本から取得した、解析対象の組織を含む解析対象画像から解析デー
タを生成する。前記解析データを、前記深層学習アルゴリズムに入力し、前記解析対象画
像内に存在する組織が解析用データに含まれる領域が腫瘍領域であるか否かを示すデータ
を生成する。解析用データに含まれる領域が腫瘍領域であるか否かを示すデータとは、判
別対象にある組織に含まれる複数の注目画素を含む領域が、腫瘍組織を含む可能性および
/または非腫瘍領域である可能性を示すデータである。解析用データに含まれる領域が腫
瘍領域であるか否かを示すデータは、腫瘍領域を含むことと非腫瘍領域であることを区別
できるラベル値、表示等であり得る。
The image analysis uses a deep learning algorithm trained using training images. The image analysis generates analysis data from an analysis target image including the analysis target tissue acquired from the specimen. The analysis data is input to the deep learning algorithm to generate data indicating whether or not a region in which the tissue present in the analysis target image is included in the analysis data is a tumor region. Data indicating whether or not a region included in the analysis data is a tumor region refers to the possibility that a region including a plurality of pixels of interest included in a tissue to be determined includes tumor tissue and/or a non-tumor region. This data indicates the possibility that Data indicating whether or not a region included in the analysis data is a tumor region may be a label value, indication, or the like that can distinguish whether the region includes a tumor region or a non-tumor region.
前記訓練用画像は、学習対象となる標本の複数の領域から取得される。好ましくは、前
記訓練用画像は、学習対象となる組織に含まれる複数の層構造から層構造ごとに腫瘍領域
を含む領域、非腫瘍領域を含む領域、および組織を含まない領域より取得される。
The training images are obtained from multiple regions of the specimen to be learned. Preferably, the training image is obtained from a region including a tumor region, a region including a non-tumor region, and a region not including a tissue for each layer structure from a plurality of layer structures included in the tissue to be learned.
例えば、第1の訓練用画像70R1は、個体から採取された組織に含まれる、腫瘍領域
を含む領域から取得された画像である。この画像は、顕微鏡観察により、組織構造が認識
できるように染色された標本から取得される。前記染色は、組織構造が認識できる限り制
限されないが、好ましくは明視野観察用の染色である。前記明視野観察用染色は、少なく
とも細胞核と細胞核以外の部位が、色相で区別可能に染色できる限り制限されない。前記
標本が哺乳類の組織標本である場合には、例えば、HE染色を挙げることができる。
For example, the first training image 70R1 is an image acquired from a region including a tumor region contained in tissue taken from an individual. This image is acquired from a specimen that has been stained so that tissue structures can be recognized by microscopic observation. The staining is not limited as long as the tissue structure can be recognized, but staining for bright field observation is preferable. The staining for bright-field observation is not limited as long as at least the cell nucleus and sites other than the cell nucleus can be stained in a distinguishable hue. When the specimen is a mammalian tissue specimen, for example, HE staining can be used.
第1の訓練用画像70R1からは、第1の訓練データ74R1と、第1の予備訓練デー
タ70R1Lが生成される。第1の訓練データ74R1は、第1の訓練用画像70R1に
含まれる色相を原色毎に分離した単一色画像に関する情報である。第1の予備訓練データ
70R1Lは、第1の訓練用画像70R1に含まれている組織の領域が、腫瘍領域を含む
ことを示す二値化データ(ラベル値)として生成される。第1の訓練用画像70R1に含
まれる組織の領域が腫瘍領域を含むか否かは、例えば病理医等による標本観察により判定
される。ここで、前記訓練用画像に含まれる組織の領域において、腫瘍細胞と、非腫瘍細
胞と、細胞以外の組織の領域とが混在する場合がある。この場合、前記訓練用画像に含ま
れる組織の領域が、例えば前記訓練用画像に含まれる組織の領域全体の面積を100%と
した際に、腫瘍細胞がその全体の面積の約10%以上、約20%以上、約30%以上、約
40%以上、約50%以上、約60%以上、約70%以上、約80%以上、または約90
%以上を占める場合に、腫瘍領域を含むと判定することができる。好ましくは、約40%
以上、約50%以上、約60%以上、約70%以上、約80%以上、または約90%以上
を占める場合に、腫瘍領域を含むと判定することができる。前記訓練用画像に含まれる組
織の領域全体の面積(100%)から非腫瘍細胞および細胞以外の組織(非腫瘍領域)が
占める割合を減じた値を前記腫瘍細胞が組織全体の面積を占める割合として決定してもよ
い。
First training data 74R1 and first pre-training data 70R1L are generated from the first training image 70R1. The first training data 74R1 is information about a single-color image obtained by separating the hues included in the first training image 70R1 for each primary color. The first preliminary training data 70R1L is generated as binarized data (label values) indicating that the tissue regions included in the first training image 70R1 include tumor regions. Whether or not the tissue region included in the first training image 70R1 includes a tumor region is determined, for example, by specimen observation by a pathologist or the like. Here, in the tissue region included in the training image, tumor cells, non-tumor cells, and tissue regions other than cells may coexist. In this case, when the area of the tissue included in the training image is taken as 100%, for example, tumor cells occupy about 10% or more of the entire area, about 20% or more, about 30% or more, about 40% or more, about 50% or more, about 60% or more, about 70% or more, about 80% or more, or about 90%
% or more, it can be determined to contain a tumor region. preferably about 40%
A tumor region can be determined to be included when it occupies about 50% or more, about 60% or more, about 70% or more, about 80% or more, or about 90% or more. A value obtained by subtracting the ratio of non-tumor cells and tissues other than cells (non-tumor region) from the area of the entire tissue region included in the training image (100%) is the ratio of the tumor cells to the entire tissue area. may be determined as
前記訓練用画像に含まれる第2の訓練用画像70R2は、非腫瘍領域を含む組織の領域
(好ましくは、非腫瘍細胞と細胞以外の組織の領域とを含む領域)から取得された画像で
ある。この画像は、顕微鏡観察により、組織構造が認識できるように染色された標本から
取得される。前記染色は、組織構造が認識できる限り制限されないが、好ましくは明視野
観察用の染色である。前記明視野観察用染色は、少なくとも細胞核と細胞核以外の部位が
、色相で区別可能に染色できる限り制限されない。前記標本が哺乳類の組織標本である場
合には、例えば、HE染色を挙げることができる。前記染色は、第1の訓練用画像70R
1を取得した標本と同じものであることが好ましい。
The second training image 70R2 included in the training images is an image acquired from a tissue region including a non-tumor region (preferably, a region including non-tumor cells and tissue regions other than cells). . This image is acquired from a specimen that has been stained so that tissue structures can be recognized by microscopic observation. The staining is not limited as long as the tissue structure can be recognized, but staining for bright field observation is preferable. The staining for bright-field observation is not limited as long as at least the cell nucleus and sites other than the cell nucleus can be stained in a distinguishable hue. When the specimen is a mammalian tissue specimen, for example, HE staining can be used. The staining is performed on the first training image 70R.
It is preferably the same sample from which 1 was obtained.
第2の訓練用画像70R2からは、第2の訓練データ74R2と、第2の予備訓練デー
タ70R2Lが生成される。第2の訓練データ74R2は、第2の訓練用画像70R2に
含まれる色相を原色毎に分離した単一色画像に関する情報である。第2の予備訓練データ
70R2Lは、第2の訓練用画像70R2に含まれている組織の領域が、非腫瘍領域を含
むことを示す二値化データ(ラベル値)である。第2の訓練用画像70R2に含まれる組
織の領域が非腫瘍領域を含むか否かは、例えば病理医等による標本観察により判定される
。ここで、前記訓練用画像に含まれる組織の領域において、腫瘍細胞と、非腫瘍細胞と、
細胞以外の組織の領域が混在する場合がある。この場合、前記訓練用画像に含まれる組織
の領域が、例えば前記訓練用画像に含まれる組織の領域全体の面積を100%とした際に
、非腫瘍細胞と細胞以外の組織の領域(非腫瘍領域)とが組織全体の面積の約10%以上
、約20%以上、約30%以上、約40%以上、約50%以上、約60%以上、約70%
以上、約80%以上、約90%以上、または100%を占める場合に、非腫瘍領域を含む
と判定することができる。好ましくは、約40%以上、約50%以上、約60%以上、約
70%以上、約80%以上、約90%以上、または100%を占める場合に、非腫瘍領域
を含むと判定することができる。前記第2の訓練用画像70R2に含まれる組織の領域全
体の面積(100%)から腫瘍領域が占める割合を減じた値を前記非腫瘍細胞と細胞以外
の組織の領域とが組織全体の面積を占める割合として決定してもよい。
Second training data 74R2 and second pre-training data 70R2L are generated from the second training image 70R2. The second training data 74R2 is information on single-color images obtained by separating hues included in the second training image 70R2 for each primary color. The second preliminary training data 70R2L is binarized data (label value) indicating that the tissue regions included in the second training image 70R2 include non-tumor regions. Whether or not the tissue region included in the second training image 70R2 includes a non-tumor region is determined, for example, by specimen observation by a pathologist or the like. Here, in a tissue region included in the training image, tumor cells, non-tumor cells,
Areas of tissue other than cells may be mixed. In this case, the area of the tissue included in the training image, for example, when the area of the entire area of the tissue included in the training image is 100%, the area of non-tumor cells and tissue other than cells (non-tumor area) is about 10% or more, about 20% or more, about 30% or more, about 40% or more, about 50% or more, about 60% or more, about 70% of the total area of the tissue
It can be determined that a non-tumor region is included when it occupies about 80% or more, about 90% or more, or 100%. Preferably, when it occupies about 40% or more, about 50% or more, about 60% or more, about 70% or more, about 80% or more, about 90% or more, or 100%, it is determined to contain a non-tumor region. can be done. A value obtained by subtracting the ratio of the tumor region from the area (100%) of the entire tissue region included in the second training image 70R2 is the area of the entire tissue including the tissue regions other than the non-tumor cells and cells. You may determine it as a ratio to occupy.
前記訓練用画像に含まれる第3の訓練用画像70R3は、第1の訓練用画像70R1、
および/または第2の訓練用画像70R2を取得した標本における組織を含まない領域(
非組織領域ともいう)から取得された画像である。
The third training image 70R3 included in the training images is the first training image 70R1,
and/or tissue-free regions (
1 is an image acquired from a non-tissue region).
第3訓練用画像からは、第3の訓練データ74R3と、第3の予備訓練データ70R3
Lが生成される。第3の訓練データ74R3は、第3の訓練用画像70R3に含まれる色
相を原色毎に分離した単一色画像に関する情報である。第3の予備訓練データ70R2L
は、第3の訓練用画像70R3に含まれている領域が、組織を含まない領域であることで
あることを示す二値化データ(ラベル値)である。第3の訓練用画像70R3に含まれる
領域は、例えば病理医等による標本観察により判定される。ここで、前記訓練用画像には
、組織の領域と背景(例えば、プレパラートのガラス部分)の領域とが混在する場合があ
る。この場合、前記訓練用画像に含まれる背景の領域が、例えば前記1枚の訓練用画像に
含まれる領域全体の面積を100%とした際に、背景の領域が約90%以上、約91%以
上、約92%以上、約93%以上、約94%以上、約95%以上、約96%以上、約97
%以上、約98%以上、または約99%以上を占める場合、あるいは背景の領域が100
%を占める場合に、組織を含まない領域であると判定することができる。好ましくは、背
景の領域が約95%以上、約96%以上、約97%以上、約98%以上、または約99%
以上を占める場合、あるいは背景の領域が100%を占める場合に、組織を含まない領域
であると判定することができる。
From the third training image, third training data 74R3 and third pre-training data 70R3
L is generated. The third training data 74R3 is information about a single-color image obtained by separating the hues included in the third training image 70R3 for each primary color. Third pre-training data 70R2L
is binarized data (label value) indicating that the region included in the third training image 70R3 is a region that does not contain tissue. A region included in the third training image 70R3 is determined, for example, by specimen observation by a pathologist or the like. Here, the training image may include a tissue region and a background region (for example, the glass portion of a slide). In this case, the background area included in the training image is about 90% or more, about 91%, for example, when the area of the entire area included in the single training image is 100%. or more, about 92% or more, about 93% or more, about 94% or more, about 95% or more, about 96% or more, about 97
% or more, about 98% or more, or about 99% or more, or if the background area is 100%
%, it can be determined that the region does not contain tissue. Preferably, the background area is about 95% or more, about 96% or more, about 97% or more, about 98% or more, or about 99%
If it occupies 100% or more, or if the background area occupies 100%, it can be determined that the area does not contain tissue.
各訓練用画像は、訓練用の組織標本を、例えば5倍から20倍に拡大した画像として取
得されることが好ましい。判別精度の点から、30倍以上、特に40倍以上に拡大した画
像は、訓練用画像としては不向きである。
Each training image is preferably obtained as an image of the training tissue sample magnified, for example, by a factor of 5 to 20. In terms of discrimination accuracy, an image magnified 30 times or more, especially 40 times or more, is unsuitable as a training image.
第1の訓練データ74R1および第1の予備訓練データ70R1Lからは腫瘍領域訓練
データが生成され、第2の訓練データ74R2および第2の予備訓練データ70R2Lか
らは非腫瘍領域訓練データが生成され、第3の訓練データ74R3および第3の予備訓練
データ70R2Lからは非組織領域訓練データが生成される。腫瘍領域訓練データ、非腫
瘍領域訓練データおよび非組織領域訓練データを併せて訓練データと呼ぶことがある。
Tumor region training data is generated from the first training data 74R1 and the first pre-training data 70R1L, non-tumor region training data is generated from the second training data 74R2 and the second pre-training data 70R2L, Non-tissue area training data is generated from the three training data 74R3 and the third pre-training data 70R2L. Tumor region training data, non-tumor region training data and non-tissue region training data may be collectively referred to as training data.
本発明の概要および実施の形態では、HE染色された組織標本を撮像した画像内に含ま
れる組織が腫瘍領域、非腫瘍領域および非組織領域を含むことを、深層学習アルゴリズム
によって判別する場合を一例として説明する。
In the outline and embodiments of the present invention, an example of a case in which a deep learning algorithm is used to determine that tissues included in an image of an HE-stained tissue specimen include a tumor region, a non-tumor region, and a non-tissue region. described as.
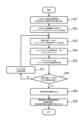
[深層学習方法および画像解析方法の概要]
はじめに、深層学習方法について説明する。
[Overview of deep learning method and image analysis method]
First, the deep learning method will be described.
・深層学習方法の概要
図1を用いて、第1の訓練データ74R1、第1の予備訓練データ70R1Lおよび腫
瘍領域訓練データ75R1の概要を説明する。図1には、スライドイメージスキャナによ
り取得した組織標本のホールスライドイメージ70W1を使ったニューラルネットワーク
への訓練データの入力例を示す。ホールスライドイメージ70W1は明視野観察用染色と
してHE染色を施して作製された標本を明視野で撮像した組織標本のスライドイメージを
示す。ホールスライドイメージ70W2は、病理医によりホールスライドイメージ70W
1において腫瘍領域を含む部分を病理医が実線で囲って指定した画像である。ホールスラ
イドイメージ70W3は、ホールスライドイメージ70W2を訓練用画像として分割(例
えば、512分割)した像を示す。ホールスライドイメージ70W3内の記号R1で示さ
れた四角枠で囲まれた領域は、図1に示す第1の訓練用画像70R1として使用する領域
を示す。記号R2で示された四角枠で囲まれた領域は、図2に示す第2の訓練用画像70
R2として使用する領域を示す。記号R3で示された四角枠で囲まれた領域は、図3に示
す第3の訓練用画像70R3として使用する領域を示す。第1の訓練用画像70R1が腫
瘍領域を含むこと、第2の訓練用画像70R2が非腫瘍領域を含むこと、および第3の訓
練用画像70R3が組織を含まない領域であることは、それぞれの訓練画像を取得する前
に判定していてもよく、それぞれの訓練画像を取得してから判定してもよい。
Outline of Deep Learning Method An outline of the first training data 74R1, the first preliminary training data 70R1L, and the tumor area training data 75R1 will be described with reference to FIG. FIG. 1 shows an example of inputting training data to a neural network using a whole slide image 70W1 of a tissue specimen acquired by a slide image scanner. A whole slide image 70W1 shows a slide image of a tissue specimen obtained by imaging a specimen prepared by HE staining as staining for bright field observation in a bright field. Whole slide image 70W2 is obtained by a pathologist from Whole slide image 70W.
1 is an image designated by a pathologist by enclosing a portion including a tumor region in 1 with a solid line. A whole slide image 70W3 shows an image obtained by dividing the whole slide image 70W2 as a training image (for example, into 512 divisions). A region surrounded by a rectangular frame indicated by symbol R1 in hole slide image 70W3 indicates a region used as first training image 70R1 shown in FIG. The area surrounded by a rectangular frame indicated by symbol R2 is the second training image 70 shown in FIG.
Regions used as R2 are shown. A region surrounded by a rectangular frame indicated by symbol R3 indicates a region used as the third training image 70R3 shown in FIG. That the first training image 70R1 contains a tumor region, that the second training image 70R2 contains a non-tumor region, and that the third training image 70R3 contains no tissue is determined by each The determination may be made before acquiring the training images, or may be made after acquiring each training image.
図1において、第1の訓練用画像70R1は、HE染色した標本を明視野観察下で例え
ばカラー画像として撮像しているため、第1の訓練用画像70R1には複数の色相が含ま
れる。
In FIG. 1, the first training image 70R1 is obtained by capturing an HE-stained specimen under bright-field observation as, for example, a color image, so the first training image 70R1 includes a plurality of hues.
第1の訓練用画像70R1は、例えば公知の光学顕微鏡、蛍光顕微鏡またはバーチャル
スライドスキャナ等の画像取得装置を用いて、予め取得することができる。例示的には、
本実施形態において画像取得装置から取得されるカラー撮像は、カラースペースがRGB
の24ビットカラーであることが好ましい。RGBの24ビットカラーでは、赤色、緑色
および青色のそれぞれの濃さ(色濃度)を、8ビット(256段階)の階調で表すことが
好ましい。第1の訓練用画像70R1は、1以上の原色を含む画像であればよい。第1の
訓練用画像70R1に対応して、第1の訓練データ74R1が生成される。
The first training image 70R1 can be acquired in advance using, for example, an image acquisition device such as a known optical microscope, fluorescence microscope, or virtual slide scanner. Illustratively,
In this embodiment, the color image captured by the image acquisition device has an RGB color space.
24-bit color. In RGB 24-bit colors, it is preferable to express the respective densities (color densities) of red, green, and blue with 8-bit (256 levels) gradation. The first training image 70R1 may be an image containing one or more primary colors. First training data 74R1 is generated corresponding to the first training image 70R1.
本発明において、色相は、例示的には、光の3原色の組み合わせ、または色の3原色の
組み合わせで規定される。第1の訓練データ74R1は、第1の訓練用画像70R1から
生成される、第1の訓練用画像70R1に現れる色相を個々の原色に分離して原色毎に生
成し、その濃度に応じた符号で表されたデータである。図1では光の3原色である赤(R
)、緑(G)、青(B)の原色毎に分離した単一色の濃淡で示された画像(以下、「単一
色画像」ともいう)72R1R,72R1G,72R1Bを得る。
In the present invention, the hue is exemplified by a combination of three primary colors of light or a combination of three primary colors of color. The first training data 74R1 is generated from the first training image 70R1 by separating the hue appearing in the first training image 70R1 into individual primary colors, generating each primary color, and generating a code corresponding to the density. is the data represented by In Fig. 1, red (R
), green (G), and blue (B) separated for each primary color (hereinafter also referred to as “single-color images”) 72R1R, 72R1G, and 72R1B.
単一色画像72R1R,72R1G,72R1B上の各画素について各色の色濃度を符
号化し、画像全体をR、G、B毎の各画像について、画素毎の色濃度に対応した符号化図
(以下、「色濃度符号化図」ともいう)72R1r,72R1g,72R1bを生成する
。色濃度は、各色256段階を示す数値で符号化しても良い。また、色濃度は、各色25
6段階を示す数値に対して、さらに前処理を行って、各画素における色濃度を例えば、値
0から値7の8段階で示す数字で符号化してもよい。図1に例示的に示すR、G、B各色
の単一色画像から生成された色濃度符号化図72R1r,72R1g,72R1bは、説
明の便宜上、各画素における色濃度を値0から値7の8段階の符号で表している。図1に
示す色濃度符号化図72R1r,72R1g,72R1bから画素毎にR、G、Bの色濃
度値が組み合わされた第1の訓練データ74R1が生成される。色濃度を示す符号は、本
明細書において色濃度値ともいう。また、第1の訓練データ74R1として、色濃度符号
化図に替えて、各画素に対応した色濃度値の行列を生成してもよい。
The color density of each color is encoded for each pixel on the single-color images 72R1R, 72R1G, and 72R1B, and the entire image is an encoding diagram corresponding to the color density of each pixel for each image of R, G, and B (hereinafter referred to as " 72R1r, 72R1g, and 72R1b are generated. Color densities may be encoded with numerical values indicating 256 levels of each color. Also, the color density is 25 for each color.
Further preprocessing may be performed on the numerical values representing the 6 levels, and the color density at each pixel may be encoded with numbers representing 8 levels from
図1において、第1の予備訓練データ70R1Lは、第1の訓練用画像70R1に含ま
れている組織が、腫瘍領域を含むことを示すデータである。例えば、第1の訓練用画像7
0R1は、全領域が病理医の判定により腫瘍領域であると判定されているため第1の訓練
用画像70R1には、後述する所定の画素数の領域毎に腫瘍領域を含むことを示すラベル
値として同じ数値、例えば「1」が付され、第1の予備訓練データ70R1Lとなる。
In FIG. 1, the first preliminary training data 70R1L is data indicating that the tissue included in the first training image 70R1 includes a tumor region. For example, the
0R1 is a label value indicating that the first training image 70R1 includes a tumor region for each region of a predetermined number of pixels, which will be described later, because the pathologist has determined that the entire region is a tumor region. is assigned the same numerical value, for example, "1", and becomes the first preliminary training data 70R1L.
深層学習方法では、図1に示す第1の訓練データ74R1および第1の予備訓練データ
70R1Lから腫瘍領域訓練データ75R1を生成する。そして、腫瘍領域訓練データ7
5R1の各画素の色濃度値データ76(第1の訓練データ74R1から得られる)を入力
層50aとし、ラベル値77R1(第1の予備訓練データ70R1Lから得られる)を出
力層50bとするニューラルネットワーク50に学習させる。
The deep learning method generates tumor region training data 75R1 from first training data 74R1 and first pre-training data 70R1L shown in FIG. And tumor
A neural network having color density value data 76 (obtained from first training data 74R1) of each pixel of 5R1 as an
次に、図2を用いて、第2の訓練データ74R2、第2の予備訓練データ70R2Lお
よび非腫瘍領域訓練データ75R2の概要を説明する。図2において、ホールスライドイ
メージ70W1、ホールスライドイメージ70W2、およびホールスライドイメージ70
W3は図1と同様であるため、第2の訓練用画像70R2には、第1の訓練用画像70R
1と同様に複数の色相が含まれる。
Next, an overview of the second training data 74R2, the second preliminary training data 70R2L and the non-tumor area training data 75R2 will be described with reference to FIG. In FIG. 2, a hole slide image 70W1, a hole slide image 70W2, and a hole slide image 70
Since W3 is the same as in FIG. 1, the second training image 70R2 includes the first training image 70R
As with 1, multiple hues are included.
第2の訓練用画像70R2は、腫瘍領域を含む組織に替えて非腫瘍領域含む組織を用い
る以外は、第1の訓練用画像70R1と同様の方法で取得される。第2の訓練用画像70
R2に対応して、第2の訓練データ74R2が生成される。
The second training image 70R2 is acquired in the same manner as the first training image 70R1, except that tissue containing non-tumor regions is used instead of tissue containing tumor regions. Second training image 70
Second training data 74R2 is generated corresponding to R2.
第2の訓練データ74R2は、腫瘍領域を含む組織に替えて非腫瘍領域含む組織を用い
る以外は、第1の訓練データ74R1と同様の方法で生成される。図2に示す色濃度符号
化図72R2r,72R2g,72R2bから画素毎にR、G、Bの色濃度値が組み合わ
された第2の訓練データ74R2が生成される。
The second training data 74R2 is generated in the same manner as the first training data 74R1, except that tissue containing non-tumor regions is used instead of tissue containing tumor regions. Second training data 74R2 in which the R, G, and B color density values are combined for each pixel is generated from the color density encoding diagrams 72R2r, 72R2g, and 72R2b shown in FIG.
図2において、第2の予備訓練データ70R2Lは、第2の訓練用画像70R2が、非
腫瘍領域を含むことを示すデータである。第2の訓練用画像70R2は全領域が病理医の
判定により非腫瘍領域であると判定されているため、第2の訓練用画像70R2には、後
述する所定の画素数の領域毎に非腫瘍領域を含むことを示すラベル値として同じ数値、例
えば「2」が付され、第2の予備訓練データ70R2Lとなる。非腫瘍領域を含む領域で
あることを示すラベル値は、腫瘍領域を含む領域および組織を含まない領域を示すラベル
値と区別できる限り制限されない。
In FIG. 2, the second preliminary training data 70R2L is data indicating that the second training image 70R2 includes non-tumor regions. Since the entire area of the second training image 70R2 has been determined by the pathologist to be a non-tumor area, the second training image 70R2 includes a non-tumor area for each area of a predetermined number of pixels, which will be described later. The same numerical value, for example, "2" is attached as a label value indicating that the region is included, and becomes the second pre-training data 70R2L. The label value indicating the region containing the non-tumor region is not limited as long as it can be distinguished from the label value indicating the region containing the tumor region and the region not containing the tissue.
深層学習方法では、図2に示す第2の訓練データ74R2および第2の予備訓練データ
70R2Lから非腫瘍領域訓練データ75R2を生成する。そして、非腫瘍領域訓練デー
タ75R2の各画素の色濃度値データ76(第2の訓練データ74R2から得られる)を
入力層50aとし、ラベル値77R2(第2の予備訓練データ70R2Lから得られる)
を出力層50bとするニューラルネットワーク50に学習させる。
The deep learning method generates non-tumor area training data 75R2 from the second training data 74R2 and the second pre-training data 70R2L shown in FIG. Then, the color density value data 76 (obtained from the second training data 74R2) of each pixel of the non-tumor area training data 75R2 is used as the
is learned by the
次に、図3を用いて、第3の訓練データ74R3、第3の予備訓練データ70R3Lお
よび非組織領域訓練データ75R3の概要を説明する。図3において、ホールスライドイ
メージ70W1、ホールスライドイメージ70W2、およびホールスライドイメージ70
W3は図1と同様であるため、第3の訓練用画像70R3には、第1の訓練用画像70R
1と同様に複数の色相が含まれる。
Next, an outline of the third training data 74R3, the third preliminary training data 70R3L and the non-tissue area training data 75R3 will be described with reference to FIG. In FIG. 3, a hole slide image 70W1, a hole slide image 70W2, and a hole slide image 70
W3 is the same as in FIG. 1, so the third training image 70R3 contains the first training image 70R
As with 1, multiple hues are included.
第3の訓練用画像70R3は、腫瘍領域を含む領域に替えて組織を含まない領域を用い
る以外は、第1の訓練用画像70R1と同様の方法で取得される。第3の訓練用画像70
R3に対応して、第3の訓練データ74R3が生成される。
A third training image 70R3 is acquired in the same manner as the first training image 70R1, except that regions containing no tissue are used instead of regions containing tumor regions. Third training image 70
Third training data 74R3 is generated corresponding to R3.
第3の訓練データ74R3は、腫瘍領域を含む領域に替えて組織を含まない領域を用い
る以外は、第1の訓練データ74R1と同様の方法で生成される。図3に示す色濃度符号
化図72R3r,72R3g,72R3bから画素毎にR、G、Bの色濃度値が組み合わ
された第3の訓練データ74R3が生成される。
The third training data 74R3 is generated in a similar manner as the first training data 74R1, except that regions containing no tissue are used instead of regions containing tumor regions. Third training data 74R3 in which the R, G, and B color density values are combined for each pixel is generated from the color density encoding diagrams 72R3r, 72R3g, and 72R3b shown in FIG.
図3において、第3の予備訓練データ70R3Lは、第3の訓練用画像70R3に含ま
れている領域が、組織を含まない領域であることを示すデータである。第3の訓練用画像
70R3は全領域が病理医の判定により非組織領域であると判定されているため、第3の
訓練用画像70R3には、後述する所定の画素数の領域毎に組織を含まない領域であるこ
とを示すラベル値として同じ数値、例えば「0」が付され、第3の予備訓練データ70R
3Lとなる。組織を含まない領域であることを示すラベル値は、腫瘍領域を含む領域およ
び非腫瘍領域を含む領域を示す数値とは区別される。
In FIG. 3, the third preliminary training data 70R3L is data indicating that the region included in the third training image 70R3 is a region that does not contain tissue. Since the entire region of the third training image 70R3 has been determined by the pathologist to be a non-tissue region, the third training image 70R3 includes tissue in each region of a predetermined number of pixels, which will be described later. The same numerical value, for example, "0" is attached as the label value indicating that the region does not include the third preliminary training data 70R.
3L. A label value indicating a region containing no tissue is distinguished from a numerical value indicating a region containing a tumor region and a region containing a non-tumor region.
深層学習方法では、図3に示す第3の訓練データ74R3および第3の予備訓練データ
70R3Lから非組織領域訓練データ75R3を生成するそして、非組織領域訓練データ
75R3の各画素の色濃度値データ76(第3の訓練データ74R3から得られる)を入
力層50aとし、ラベル値77R3(第3の予備訓練データ70R3Lから得られる)を
出力層50bとするニューラルネットワーク50に学習させる。
The deep learning method generates non-textured region training data 75R3 from the third training data 74R3 and the third pre-training data 70R3L shown in FIG. Train a
図4(a)、(b)を参照して、腫瘍領域訓練データ75R1の生成方法を説明する。
図4(a)に示す第1の訓練データ74R1は、所定の画素数の腫瘍領域の色濃度符号化
図72R1r,72R1g,72R1bのそれぞれの色濃度値を組み合わせたデータであ
る。本明細書において、第1の訓練データ74R1の各画素の位置は、便宜上列を左から
l1、l2・・・li、行を上からm1、m2・・・mjで表す。第1の訓練データ74
R1は、図4(a)では、その画像サイズ(訓練データ1つあたりの大きさ)が説明の便
宜のために簡素化されており、第1の訓練データ74R1が、縦方向9画素および横方向
9画素の合計81画素を有する。すなわち、各画素の位置は、列を左からl1、l2・・
・l9、行を上からm1、m2・・・m9で表す。図4(a)に示す3つの値が、各画素
におけるR、G、B各色の色濃度値である。例示的には、3つの値は、左から、赤(R)
、緑(G)および青(B)の順序で格納されている。第1の訓練データ74R1の各画素
の色濃度値は便宜的に値0から値7の8段階で示されている。これは、画像の前処理の一
例として、撮像された際に256段階で表されている各色の画像72R1R,72R1G
,72R1Bの明るさを、8段階の色濃度値にそれぞれ変換する処理である。色濃度値は
、例えば最も低い明るさ(RGBカラー256段階で表した時の輝度値が低い階調群)を
色濃度値0とし、明るさの程度が高くなるに従い徐々に高い値を割り当ててゆき、最も高
い明るさ(RGBカラー256段階で表した時の輝度値が高い階調群)を色濃度値7とす
る。
A method of generating the tumor region training data 75R1 will be described with reference to FIGS.
The first training data 74R1 shown in FIG. 4A is data obtained by combining the color density values of the tumor region color density encoding diagrams 72R1r, 72R1g, and 72R1b of a predetermined number of pixels. In this specification, the position of each pixel in the first training data 74R1 is represented by l 1 , l 2 . . first training data 74
In FIG. 4A, the image size (size per training data) of R1 is simplified for convenience of explanation. It has a total of 81 pixels with 9 pixels in the direction. That is, the position of each pixel is l 1 , l 2 .
· l 9 , rows are denoted by m 1 , m 2 . . . m 9 from the top. The three values shown in FIG. 4A are the color density values of R, G, and B in each pixel. Illustratively, the three values are, from left, red (R)
, green (G) and blue (B). The color density value of each pixel of the first training data 74R1 is shown in eight steps from
, 72R1B into eight levels of color density values. For the color density value, for example, the lowest brightness (a gradation group with a low brightness value when represented by 256 levels of RGB colors) is assigned a color density value of 0, and gradually higher values are assigned as the degree of brightness increases. Let the color density value be 7 for the highest brightness (gradation group with the highest luminance value when represented by 256 levels of RGB colors).
図1および図4(b)に示す腫瘍領域訓練データ75R1は、図4(a)に示す第1の
訓練データ74R1を所定数の画素からなる領域(以下、「ウィンドウサイズ」と記載す
る)で切り出したデータに第1の予備訓練データ70R1Lのラベル値に対応するラベル
値77R1を付したものである。ウィンドウサイズの腫瘍領域訓練データ75R1も、説
明の便宜のために3×3画素(l1:l3,m1:m3)に簡素化して示すが、各画素の
位置は、便宜上列を左からl1、l2・・・li、行を上からm1、m2・・・mjで表
す。実際の好ましいウィンドウサイズは、例示的には125×125画素(i=125、
j=125)、150×150画素(i=150、j=150)、166×166画素(
i=166、j=166)、180×180画素(i=180、j=180)、200×
200画素(i=200、j=200)、220×220画素(i=220、j=220
)、250×250画素(i=250、j=250)程度が、学習効率の点から好ましい
。より好ましくは、ウィンドウサイズは200×200画素程度である。ウィンドウサイ
ズは、たとえば60μm×60μm以上500μm×500μm以下の範囲である。好ま
しくは、60μm×60μm、100μm×100μm、150μm×150μm、20
0μm×200μm、250μm×250μm、300μm×300μm、350μm×
350μm、400μm×400μm、450μm×450μm、500μm×500μ
mである。より好ましくは、200μm×200μm~400μm×400μmである。
例えば、図4(b)に示すように、第1の訓練データ74R1の左端から3×3画素のウ
ィンドウW1(l1:l3,m1:m3)を設定し、第1の訓練データ74R1に対して
左から右にウィンドウW1を移動させる。ウィンドウW1は(l1:l3,m1:m3)
の腫瘍領域訓練データ75R1を切り出した後、第1の予備訓練データ70R1Lのラベ
ル値に対応するラベル値77R1を腫瘍領域訓練データ75R1に付す。ウィンドウW1
は点線で示す腫瘍領域訓練データ74R1の次のウィンドウ(l4:l6,m4:m6)
に移動し、(l4:l6,m4:m6)をウィンドウサイズの腫瘍領域訓練データ75R
1として切り出す。新たに切り出された腫瘍領域訓練データ75R1に第1の予備訓練デ
ータ70R1Lのラベル値に対応するラベル値77R1を付す。この操作を、繰り返し、
複数のウィンドウサイズの腫瘍領域訓練データ75R1を第1の訓練データ74R1から
切り出す。切り出したウィンドウサイズの腫瘍領域訓練データ75R1は第1の予備訓練
データ70R1Lのラベル値に対応するラベル値77R1が付され図1に示すニューラル
ネットワーク50の学習に用いられる。
The tumor area training data 75R1 shown in FIGS. 1 and 4(b) is obtained by dividing the first training data 74R1 shown in FIG. A label value 77R1 corresponding to the label value of the first preliminary training data 70R1L is attached to the extracted data. The window size tumor region training data 75R1 is also shown simplified to 3×3 pixels (l 1 :l 3 , m 1 :m 3 ) for convenience of explanation. l 1 , l 2 . A practical preferred window size is illustratively 125×125 pixels (i=125,
j=125), 150×150 pixels (i=150, j=150), 166×166 pixels (
i=166, j=166), 180×180 pixels (i=180, j=180), 200×
200 pixels (i=200, j=200), 220×220 pixels (i=220, j=220
) and about 250×250 pixels (i=250, j=250) are preferable from the viewpoint of learning efficiency. More preferably, the window size is approximately 200×200 pixels. The window size ranges, for example, from 60 μm×60 μm to 500 μm×500 μm. Preferably, 60 μm×60 μm, 100 μm×100 μm, 150 μm×150 μm, 20
0 μm×200 μm, 250 μm×250 μm, 300 μm×300 μm, 350 μm×
350 μm, 400 μm×400 μm, 450 μm×450 μm, 500 μm×500 μm
is m. More preferably, it is 200 μm×200 μm to 400 μm×400 μm.
For example, as shown in FIG. 4B, a window W1 (l 1 :l 3 , m 1 :m 3 ) of 3×3 pixels is set from the left end of the first training data 74R1, and the first training data Move window W1 from left to right with respect to 74R1. Window W1 is (l 1 :l 3 ,m 1 :m 3 )
After cutting out the tumor region training data 75R1, a label value 77R1 corresponding to the label value of the first preliminary training data 70R1L is attached to the tumor region training data 75R1. window W1
is the next window (l 4 :l 6 , m 4 :m 6 ) of the tumor region training data 74R1 indicated by the dotted line
and replace (l 4 :l 6 ,m 4 :m 6 ) with window size tumor region training data 75R
Cut out as 1. A label value 77R1 corresponding to the label value of the first preliminary training data 70R1L is attached to the newly extracted tumor region training data 75R1. Repeat this operation,
Multiple window sizes of tumor region training data 75R1 are cut from the first training data 74R1. Tumor area training data 75R1 of the extracted window size is assigned a label value 77R1 corresponding to the label value of first preliminary training data 70R1L, and is used for learning of
図1に示すように、ニューラルネットワーク50の入力層50aのノード数は、入力さ
れるウィンドウサイズの腫瘍領域訓練データ75R1の画素数と画像に含まれる原色の数
(例えば光の三原色であれば、R、G、Bの3つ)との積に対応している。ウィンドウサ
イズの腫瘍領域訓練データ75R1の各画素の色濃度値データ76をニューラルネットワ
ークの入力層50aとし、第1の予備訓練データ70R1Lに対応するラベル値77R1
をニューラルネットワークの出力層50bとして、ニューラルネットワーク50に学習さ
せる。各画素の色濃度値データ76は、腫瘍領域訓練データ75R1の各画素のR、G、
B各色の色濃度値の集合データである。例示として、ウィンドウサイズの腫瘍領域訓練デ
ータ75R1が3×3画素である場合には、各画素についてR、G、B毎に1つずつの色
濃度値が与えられるので、色濃度値データ76の色濃度値数は「27」(3×3×3=2
7)となり、ニューラルネットワーク50の入力層50aのノード数も「27」となる。
As shown in FIG. 1, the number of nodes in the
is used as the
B is set data of color density values of each color. By way of illustration, if the window size tumor region training data 75R1 is 3×3 pixels, one color density value is given for each of R, G, and B for each pixel, so that the color
7), and the number of nodes in the
このように、ニューラルネットワーク50に入力するウィンドウサイズの腫瘍領域訓練
データ75R1は、ユーザが作成することなく、コンピュータが自動的に作成することが
できる。これにより、ニューラルネットワーク50の効率的な深層学習が促進される。
In this way, the window size tumor region training data 75R1 to be input to the
図4(b)に示すように、初期状態において、ウィンドウW1は、第1の訓練データ7
4R1の左上角に位置している。以後、ウィンドウW1によってウィンドウサイズの腫瘍
領域訓練データ75R1を切り出し、ニューラルネットワーク50の学習を行う度に、ウ
ィンドウW1の位置を移動させる。具体的には、ウィンドウW1が第1の訓練データ74
R1の例えば全ての画素を走査するように、ウィンドウW1を移動させる。これにより、
第1の訓練データ74R1の全ての画素から切り出されたウィンドウサイズの腫瘍領域訓
練データ75R1が、ニューラルネットワーク50の学習に用いられる。よってニューラ
ルネットワーク50の学習の程度を向上でき、深層学習の結果、図6に示すニューラルネ
ットワーク60構造を有する深層学習アルゴリズムが得られる。
As shown in FIG. 4B, in the initial state, the window W1 is the
Located in the upper left corner of 4R1. After that, the tumor area training data 75R1 of the window size is cut out using the window W1, and the position of the window W1 is moved each time the
Move window W1 to scan, for example, all pixels of R1. This will
Tumor region training data 75R1 of a window size cut out from all pixels of the first training data 74R1 is used for learning of the
図5(a)には、第2の訓練データ74R2を示す。第2の訓練データ74R2から非
腫瘍領域訓練データ75R2を生成する方法は、第1の訓練データ74R1および第1の
予備訓練データ70R1Lに替えて、第2の訓練データ74R2および第2の予備訓練デ
ータ70R2Lを使用する点を除き、腫瘍領域訓練データ75R1と同様である。非腫瘍
領域訓練データ75R2に付される第2の予備訓練データ70R2Lのラベル値に対応す
るラベル値77R2が、図2に示す出力層50bに入力される。
FIG. 5(a) shows the second training data 74R2. A method for generating non-tumor area training data 75R2 from second training data 74R2 is to replace first training data 74R1 and first pre-training data 70R1L with second training data 74R2 and second pre-training data. Similar to tumor area training data 75R1 except that 70R2L is used. A label value 77R2 corresponding to the label value of the second preliminary training data 70R2L attached to the non-tumor area training data 75R2 is input to the
図5(b)には、第3の訓練データ74R3を示す。第3の訓練データ74R3から非
組織領域訓練データ75R3を生成する方法は、第1の訓練データ74R1および第1の
予備訓練データ70R1Lに替えて、第3の訓練データ74R3および第3の予備訓練デ
ータ70R3Lを使用する点を除き、腫瘍領域訓練データ75R1と同様である。非組織
領域訓練データ75R3に付される第3の予備訓練データ70R3Lのラベル値に対応す
るラベル値77R3が、図3に示す出力層50bに入力される。
FIG. 5(b) shows the third training data 74R3. A method of generating non-textured region training data 75R3 from third training data 74R3 is to replace first training data 74R1 and first pre-training data 70R1L with third training data 74R3 and third pre-training data 70R1L. Similar to tumor area training data 75R1 except that 70R3L is used. A label value 77R3 corresponding to the label value of the third preliminary training data 70R3L attached to the non-tissue area training data 75R3 is input to the
各領域訓練データは、10枚以上、20枚以上、50枚以上、100枚以上の各領域の
訓練用画像を使って生成することが好ましい。
Each region training data is preferably generated using 10 or more, 20 or more, 50 or more, or 100 or more training images of each region.
・画像解析方法の概要 図6に示すように、画像解析方法では、解析対象の組織を含む標
本を撮像した解析対象画像(明視野画像)78から、解析用データ80を生成する。前記
標本は、第1の訓練用画像と同じ染色が施されていることが好ましい。解析対象画像78
も、例えば公知の顕微鏡またはバーチャルスライドスキャナ等を用いて、例えばカラー画
像として取得することができる。解析対象画像78は、訓練用画像と同程度または同じ拡
大倍率で取得されることが好ましい。解析対象画像(明視野画像)78は、1以上の原色
を含む画像であればよい。カラーの解析対象画像78を、各画素についてR、G、B各色
の色濃度値で符号化すると、画像全体をR、G、B毎に各画素における色濃度値の符号化
図として表すことができる(解析用色濃度符号化図79r,79g,79b)。解析用色
濃度符号化図79r,79g,79bから画素毎にR、G、Bの色濃度値が組み合わされ
た解析対象データ(図示せず)が生成される。図6に例示的に示すR、G、B各色の単一
色画像における色濃度の符号を示す色濃度符号化図79r,79g,79bは、3原色の
各画像79R,79G,79Bに代えて、値0から値7の8段階の符号で表された色濃度
値を表示している。本明細書において、解析対象データの各画素の位置は、便宜上列を左
からl1、l2・・・li、行を上からm1、m2・・・mjで表す。
Outline of Image Analysis Method As shown in FIG. 6, in the image analysis method,
can also be acquired, for example, as a color image using, for example, a known microscope, virtual slide scanner, or the like. It is preferable that the
解析用データ80は、解析対象データを所定の画素数の領域(すなわち、上記各領域訓
練データと同じウィンドウサイズ)で切り出したデータであり、解析対象画像78に含ま
れている組織の色濃度値を含むデータである。図6では、ウィンドウサイズの解析用デー
タ80も、腫瘍領域訓練データ75R1、非腫瘍領域訓練データ75R2および非組織領
域訓練データ75R3と同様に、説明の便宜のために3×3画素に簡素化して示すが、実
際の好ましいウィンドウサイズは、腫瘍領域訓練データ75R1、非腫瘍領域訓練データ
75R2および非組織領域訓練データ75R3と同様である。例えば、3×3画素のウィ
ンドウW2を設定し、解析対象データに対してウィンドウW2を移動させる。ウィンドウ
W2は、解析対象データ中の所定数の画素を含んでおり、解析対象データを、各領域訓練
データと同様の方法で例えば3×3画素の黒枠で示すウィンドウW2によって切り出すと
、ウィンドウサイズの解析用データ80が得られる。各領域訓練データと同様の方法で、
複数の解析用データ80が、解析対象データから、ウィンドウサイズに対応する所定の画
素数の領域毎に生成される。解析対象データ、ウィンドウサイズの解析用データ80にお
いても、腫瘍領域訓練データ75R1、非腫瘍領域訓練データ75R2および非組織領域
訓練データ75R3と同様に、各画素について、色濃度値が赤(R)、緑(G)および青
(B)の順序で格納されている。
The
A plurality of
画像解析方法では、図1から図3に示すウィンドウサイズの腫瘍領域訓練データ75R
1、非腫瘍領域訓練データ75R2および非組織領域訓練データ75R3を用いて学習さ
せたニューラルネットワークを有する深層学習アルゴリズム60を用いて、解析用データ
80を処理する。解析用データ80を処理することによって、解析対象の組織における解
析用データに含まれる領域が腫瘍領域であるか否かを示すデータ83を生成する。
In the image analysis method, the tumor area training data 75R of the window sizes shown in FIGS.
1.
再び図6を参照し、R、G、B各色の色濃度符号化図79r,79g,79bに基づき
生成された解析対象データから切り出された解析用データ80が深層学習アルゴリズムを
構成するニューラルネットワーク60に入力される。ニューラルネットワーク60の入力
層60aのノード数は、入力される画素数と画像に含まれる原色の数との積に対応してい
る。解析用データ80の各画素の色濃度値データ81を、ニューラルネットワーク60に
入力すると、出力層60bからは、解析用データ80の推定値82(3値)が出力される
。例えば推定値が1の場合は解析用データ80を構成する所定画素数の領域(画素領域)
が腫瘍領域を含むことを示し、推定値が2の場合は前記画素領域が非腫瘍領域を含むこと
を示し、推定値が0の場合は前記画素領域が非組織領域であることを示す。すなわち、ニ
ューラルネットワーク60の出力層60bから出力される推定値82は、解析対象画像の
前記画素領域毎に生成されるラベル値であり、解析対象画像における解析用データに含ま
れる領域が腫瘍領域であるか否かを示すデータである。推定値82は、ニューラルネット
ワークに関する後述する説明ではクラスとも呼ばれる。ニューラルネットワーク60は、
入力された解析用データ80に対し、解析用データ80に含まれる所定数の画素の色濃度
値データ81に基づいて、腫瘍領域を含むことを示すラベル値、非腫瘍領域を含むことを
示すラベル値、または非組織領域を示すラベル値を生成する。言い替えると、ニューラル
ネットワーク60は、解析用データ80を、解析対象画像に含まれる注目画素領域の状態
(腫瘍化しているか、腫瘍化していないか、組織ではないか)を示すクラスに分類する。
ここで、各画素の色濃度値データ81は、解析用データ80の各画素のR、G、B各色の
色濃度値の集合データである。
Referring to FIG. 6 again, the
indicates that the pixel region includes a tumor region, an estimated value of 2 indicates that the pixel region includes a non-tumor region, and an estimated value of 0 indicates that the pixel region is a non-tissue region. That is, the estimated
For the
Here, the color
以後、ウィンドウW2が解析対象データの全ての画素を走査するように、ウィンドウW
2を所定画素数の領域単位で移動させながら、解析用データ80をウィンドウサイズで切
り出す。切り出された解析用データ80を、ニューラルネットワーク60に入力する。こ
れにより、解析対象画像における組織の解析用データに含まれる領域が腫瘍領域であるか
否かを示すデータに基づいて、ラベル値83を得る。図6に示す例では、ラベル値83に
ついてさらに領域検出処理を行うことにより、領域を示す領域強調画像84を得る。領域
検出処理は、具体的には、例えば推定値82に応じて各領域を検出する処理となり、実際
に推定値82が「1」の画素領域を腫瘍領域と、推定値82が「2」の画素領域を非腫瘍
領域と、推定値82が0の画素領域を非組織領域と判別する処理となる。領域強調画像8
4は、画像解析処理により検出された領域を、ラベル値83を色(腫瘍領域を白、非腫瘍
領域をグレー、非組織領域を黒)で表した図である)。また、各領域を判別した後に、腫
瘍領域と、それ以外の領域(すなわち、非腫瘍領域および/又は非組織領域)とを識別可
能に表示装置に表示させる処理を行ってもよい。例えば、腫瘍領域を色で塗りつぶす、腫
瘍領域とそれ以外の領域との間に線を描画する等の処理を行い、これらを表示装置に識別
可能に表示する。また、非腫瘍領域および/又は非組織領域についても識別可能に表示装
置に表示させる処理を行ってもよい。
Thereafter, the window W is set so that the window W2 scans all the pixels of the data to be analyzed.
2 is moved in units of regions of a predetermined number of pixels, the
4 is a diagram in which the regions detected by the image analysis processing are represented by the color of the label value 83 (white for tumor regions, gray for non-tumor regions, and black for non-tissue regions). Further, after each region is discriminated, a process of displaying the tumor region and other regions (that is, the non-tumor region and/or the non-tissue region) so as to be identifiable on the display device may be performed. For example, processing such as filling in the tumor region with a color, drawing a line between the tumor region and other regions, etc. is performed, and these are displayed on the display device in an identifiable manner. Also, a process of displaying the non-tumor region and/or the non-tissue region on the display device in a identifiable manner may be performed.
<第1の実施形態>
第1の実施形態では、上述の概要で説明した深層学習方法および画像解析方法を実施す
るシステムの構成について、具体的に説明する。
[構成の概要]
<First embodiment>
In the first embodiment, the configuration of a system that implements the deep learning method and image analysis method described in the overview above will be specifically described.
[Configuration overview]
図7を参照すると、第1の実施形態に係る画像解析システムは、深層学習装置100A
と、画像解析装置200Aとを備える。ベンダ側装置100は深層学習装置100Aとし
て動作し、ユーザ側装置200は画像解析装置200Aとして動作する。深層学習装置1
00Aは、ニューラルネットワーク50に訓練データを使って学習させ、訓練データによ
って訓練された深層学習アルゴリズム60をユーザに提供する。学習済みのニューラルネ
ットワーク60から構成される深層学習アルゴリズムは、記憶媒体98またはネットワー
ク99を通じて、深層学習装置100Aから画像解析装置200Aに提供される。画像解
析装置200Aは、学習済みのニューラルネットワーク60から構成される深層学習アル
ゴリズムを用いて解析対象の画像の解析を行う。
Referring to FIG. 7, the image analysis system according to the first embodiment includes a
and an
00A trains a
深層学習装置100Aは、例えば汎用コンピュータで構成されており、後述するフロー
チャートに基づいて、深層学習処理を行う。画像解析装置200Aは、例えば汎用コンピ
ュータで構成されており、後述するフローチャートに基づいて、画像解析処理を行う。記
憶媒体98は、例えばDVD-ROMやUSBメモリ等の、コンピュータ読み取り可能で
あって非一時的な有形の記憶媒体である。
The
深層学習装置100Aは撮像装置300に接続されている。撮像装置300は、撮像素
子301と、蛍光顕微鏡302とを備え、ステージ309上にセットされた学習用の標本
308の、明視野画像および蛍光画像を撮像する。学習用の標本308は、上述の染色が
施されている。深層学習装置100Aは、撮像装置300によって撮像された訓練用画像
を取得する。
The
画像解析装置200Aは撮像装置400に接続されている。撮像装置400は、撮像素
子401と、蛍光顕微鏡402とを備え、ステージ409上にセットされた解析対象の標
本408の、明視野画像を撮像する。解析対象の標本408は、上述の通り予め染色され
ている。画像解析装置200Aは、撮像装置400によって撮像された解析対象画像78
を取得する。
The
to get
撮像装置300,400には、標本を撮像する機能を有する、公知の蛍光顕微鏡または
バーチャルスライドスキャナ等を用いることができる。撮像装置400は、標本を撮像す
る機能を有する限り、光学顕微鏡であっても良い。
For the
[ハードウェア構成]
図8を参照すると、ベンダ側装置100(100A,100B)は、処理部10(10
A,10B)と、入力部16と、出力部17とを備える。
[Hardware configuration]
Referring to FIG. 8, the vendor-side device 100 (100A, 100B) includes a processing unit 10 (10
A, 10B), an
処理部10は、後述するデータ処理を行うCPU(Central Processing Unit)11と
、データ処理の作業領域に使用するメモリ12と、後述するプログラムおよび処理データ
を記憶する記憶部13と、各部の間でデータを伝送するバス14と、外部機器とのデータ
の入出力を行うインタフェース部15と、GPU(Graphics Processing Unit)19とを
備えている。入力部16および出力部17は、処理部10に接続されている。例示的には
、入力部16はキーボードまたはマウス等の入力装置であり、出力部17は液晶ディスプ
レイ等の表示装置である。GPU19は、CPU11が行う演算処理(例えば、並列演算
処理)を補助するアクセラレータとして機能する。すなわち以下の説明においてCPU1
1が行う処理とは、CPU11がGPU19をアクセラレータとして用いて行う処理も含
むことを意味する。
The
1 means that the processing performed by the
また、処理部10は、以下の図10で説明する各ステップの処理を行うために、本発明
に係るプログラムおよび学習前のニューラルネットワーク50を、例えば実行形式で記憶
部13に予め記憶している。実行形式は、例えばプログラミング言語からコンパイラによ
り変換されて生成される形式である。処理部10は、記憶部13に記憶したプログラムお
よび学習前のニューラルネットワーク50を使用して処理を行う。
In addition, the
以下の説明においては、特に断らない限り、処理部10が行う処理は、記憶部13また
はメモリ12に格納されたプログラムおよびニューラルネットワーク50に基づいて、C
PU11が行う処理を意味する。CPU11はメモリ12を作業領域として必要なデータ
(処理途中の中間データ等)を一時記憶し、記憶部13に演算結果等の長期保存するデー
タを適宜記憶する。
In the following description, unless otherwise specified, the processing performed by the
It means the processing which PU11 performs. The
図9を参照すると、ユーザ側装置200(200A,200B,200C)は、処理部
20(20A,20B,20C)と、入力部26と、出力部27とを備える。
Referring to FIG. 9, the user-side device 200 (200A, 200B, 200C) includes a processing section 20 (20A, 20B, 20C), an
処理部20は、後述するデータ処理を行うCPU(Central Processing Unit)21と
、データ処理の作業領域に使用するメモリ22と、後述するプログラムおよび処理データ
を記憶する記憶部23と、各部の間でデータを伝送するバス24と、外部機器とのデータ
の入出力を行うインタフェース部25と、GPU(Graphics Processing Unit)29とを
備えている。入力部26および出力部27は、処理部20に接続されている。例示的には
、入力部26はキーボードまたはマウス等の入力装置であり、出力部27は液晶ディスプ
レイ等の表示装置である。GPU29は、CPU21が行う演算処理(例えば、並列演算
処理)を補助するアクセラレータとして機能する。すなわち以下の説明においてCPU2
1が行う処理とは、CPU21がGPU29をアクセラレータとして用いて行う処理も含
むことを意味する。
The
1 means that the processing performed by the
また、処理部20は、以下の図14で説明する各ステップの処理を行うために、本発明
に係るプログラムおよび学習済みのニューラルネットワーク構造の深層学習アルゴリズム
60を、例えば実行形式で記憶部23に予め記憶している。実行形式は、例えばプログラ
ミング言語からコンパイラにより変換されて生成される形式である。処理部20は、記憶
部23に記憶したプログラムおよび深層学習アルゴリズム60を使用して処理を行う。
In addition, the
以下の説明においては、特に断らない限り、処理部20が行う処理は、記憶部23また
はメモリ22に格納されたプログラムおよび深層学習アルゴリズム60に基づいて、実際
には処理部20のCPU21が行う処理を意味する。CPU21はメモリ22を作業領域
として必要なデータ(処理途中の中間データ等)を一時記憶し、記憶部23に演算結果等
の長期保存するデータを適宜記憶する。
In the following description, unless otherwise specified, the processing performed by the
[機能ブロックおよび処理手順]
・深層学習処理
図10を参照すると、第1の実施形態に係る深層学習装置100Aの処理部10Aは、
訓練データ生成部101と、訓練データ入力部102と、アルゴリズム更新部103とを
備える。これらの機能ブロックは、コンピュータに深層学習処理を実行させるプログラム
を、処理部10Aの記憶部13またはメモリ12にインストールし、このプログラムをC
PU11が実行することにより実現される。ウィンドウサイズデータベース104と、ア
ルゴリズムデータベース105とは、処理部10Aの記憶部13またはメモリ12に記憶
される。
[Functional block and processing procedure]
Deep learning processing Referring to FIG. 10, the
A training
It is realized by the execution of PU11. The
学習用の標本の第1の訓練用画像70R1、第2の訓練用画像70R2、第3の訓練用
画像70R3は、撮像装置300によって予め撮像され、処理部10Aの記憶部13また
はメモリ12に予め記憶されていることとする。ニューラルネットワーク50は、例えば
解析対象の標本が由来する組織の種別(例えば組織名)と対応付けられて、アルゴリズム
データベース105に予め格納されている。
The first training image 70R1, the second training image 70R2, and the third training image 70R3 of the learning specimen are captured in advance by the
深層学習装置100Aの処理部10Aは、図11に示す処理を行う。図10に示す各機
能ブロックを用いて説明すると、ステップS10からS12、S17およびS18の処理
は、訓練データ生成部101が行う。ステップS14の処理は、訓練データ入力部102
が行う。ステップS15およびS16の処理は、アルゴリズム更新部103が行う。
The
does. The processing of steps S15 and S16 is performed by the
以下に説明するステップS10からS18では、第1の訓練用画像70R1と、第2の
訓練用画像70R2と、第3の訓練用画像70R3とを用いた深層学習処理を説明する。
In steps S10 to S18 described below, deep learning processing using a first training image 70R1, a second training image 70R2, and a third training image 70R3 will be described.
処理部10Aは、深層学習方法の概要に記載の方法に準じて、腫瘍領域訓練データ75
R1、非腫瘍領域訓練データ75R2および非組織領域訓練データ75R3を生成するた
めの深層学習処理を行う。処理部10Aは、例えば、病理医等による入力部16からの操
作により、第1の訓練用画像70R1の領域を含む広い領域の画像(ホールスライドイメ
ージ70W1)を、出力部17に表示する。判定を行う病理医等は、出力部17に表示さ
れたホールスライドイメージ70W1の画像を目視で確認する。病理医等は、腫瘍領域を
含むと判定したホールスライドイメージ70W1中の領域を、例えば入力部16を介して
指定し、ホールスライドイメージ70W1に例えば赤色等の実線で囲む。病理医等は、非
腫瘍領域および非組織領域についても、同様に、ホールスライドイメージ70W1中の領
域について、例えば赤色とは異なる青色、緑色等の実線で囲む。処理部10Aは、ホール
スライドイメージ70W1を出力部17に表示して病理医により判断してもらうことに代
えて、判定済みのホールスライドイメージ70W2を、I/F部15を介して例えばネッ
トワーク99を介して取得してもよい。病理医等は、訓練用画像として好ましい画素にホ
ールスライドイメージ70W2を分割してもよい。
The
Deep learning processing is performed to generate R1, non-tumor region training data 75R2 and non-tissue region training data 75R3. The
処理部10Aは、病理医等の入力部16からの指定により、ホールスライドイメージ7
0W2中に赤色の実線で囲まれている領域から取得された第1の訓練用画像70R1を所
定の画素数を含むように切り出す。同様に、非腫瘍領域および非組織領域と判定された部
分からも、第2の訓練用画像70R2、第3の訓練用画像70R3のそれぞれを、所定の
画素の領域を含むように切り出す。
The
The first training image 70R1 acquired from the area surrounded by the red solid line in 0W2 is cut out so as to include a predetermined number of pixels. Similarly, the second training image 70R2 and the third training image 70R3 are also cut out from portions determined to be non-tumor regions and non-tissue regions so as to include predetermined pixel regions.
ステップS10において、処理部10Aは、切り出された第1の訓練用画像70R1か
らR、G、B各色の色濃度符号化図72R1r,72R1g,72R1bを生成する。色
濃度符号化図72R1r,72R1g,72R1bは、第1の訓練用画像70R1の各画
素のR、G、B各色の色濃度値を段階的に表す符号を各画素に付すことにより生成する。
本実施形態では、色濃度値を値0から値255の256階調で表すとして各R、G、B階
調画像について色濃度符号化図72R1r,72R1g,72R1bを生成する。色濃度
値の割り当ては、例えば最も低い明るさを色濃度値0とし、明るさの程度が高くなるに従
い徐々に高い値を割り当ててゆき、最も高い明るさを色濃度値255とする。処理部10
Aは、色濃度符号化図72R1r,72R1g,72R1bから画素毎にR、G,Bの色
濃度値を付した第1の訓練データ74R1を生成する。処理部10Aは、第1の訓練用画
像70R1の各画素に腫瘍領域であることを示すラベル値である「1」を対応させた第1
の予備訓練データ70R1Lを生成する。
In step S10, the
In this embodiment, the color density values are represented by 256 gradations from
A generates first training data 74R1 with R, G, and B color density values for each pixel from the color density encoding charts 72R1r, 72R1g, and 72R1b. The
of pre-training data 70R1L.
ステップS11において、処理部10Aは、第2の訓練用画像70R2からステップS
10と同様の方法により第2の訓練データ74R2を生成する。処理部10Aは、第2の
訓練用画像70R2の各画素に非腫瘍領域であることを示すラベル値である「2」を対応
させた第2の予備訓練データ70R2Lを生成する。
In step S11, the
10 to generate second training data 74R2. The
ステップS12において、処理部10Aは、第3の訓練用画像70R3からステップS
10と同様の方法により第3の訓練データ74R3を生成する。処理部10Aは、第3の
訓練用画像70R3の各画素に非組織領域であることを示すラベル値である「0」を対応
させた第3の予備訓練データ70R3Lを生成する。
In step S12, the
10 to generate third training data 74R3. The
ステップS10からステップS12は同時に行ってもよく、順不同であってもよい。 Steps S10 to S12 may be performed at the same time or in any order.
ステップS13において、処理部10Aは、入力部16を通じて、深層学習装置100
A側のユーザからの、学習用の組織の種別の入力を受け付ける。処理部10Aは、入力さ
れた組織の種別に基づき、ウィンドウサイズデータベース104(ウィンドウサイズDB
104)を参照して、ウィンドウサイズを設定し、アルゴリズムデータベース105(ア
ルゴリズムDB105)を参照して、学習に用いるニューラルネットワーク50を設定す
る。ウィンドウサイズは例えば200×200画素とする。ウィンドウサイズは、1回の
入力時にニューラルネットワーク50に入力する訓練データの単位であり、ウィンドウサ
イズの各領域に対応する訓練データの画素数と画像に含まれる色の原色の数との積が、入
力層50aのノード数に対応している。ウィンドウサイズは組織の種別と対応付けられて
、ウィンドウサイズデータベース104内に予め記憶されている。
In step S13, the
Accepts an input of a learning organization type from the user on the A side. The
104) to set the window size, and the algorithm database 105 (algorithm DB 105) to set the
ステップS14において、処理部10Aは、各領域に対応する訓練データから、ウィン
ドウサイズの腫瘍領域訓練データ75R1、非腫瘍領域訓練データ75R2および非組織
領域訓練データ75R3を生成する。具体的には、上述の「深層学習方法の概要」におい
て、図4(a)、(b)を参照して説明したように、第1の訓練データ74R1および第
1の予備訓練データ70R1Lから、ウィンドウW1によってウィンドウサイズの腫瘍領
域訓練データ75R1を作成する。処理部10Aは、第2の訓練データ74R2および第
2の予備訓練データ70R2Lから、ウィンドウサイズの非腫瘍領域訓練データ75R2
を生成する。具体的には、上述の「深層学習方法の概要」において、図4(a)、(b)
および図5(a)を参照して説明したように、第2の訓練データ74R2および第2の予
備訓練データ70R2Lから、ウィンドウW1によってウィンドウサイズの非腫瘍領域訓
練データ75R2を作成する。処理部10Aは、第3の訓練データ74R3および第3の
予備訓練データ70R3Lから、ウィンドウサイズの非組織領域訓練データ75R3を生
成する。具体的には、上述の「深層学習方法の概要」において、図4(a)、(b)およ
び図5(b)を参照して説明したように、第3の訓練データ74R3および第3の予備訓
練データ70R3Lから、ウィンドウW1によってウィンドウサイズの非組織領域訓練デ
ータ75R3を作成する。
In step S14, the
to generate Specifically, in the above-mentioned "outline of deep learning method", Fig. 4 (a), (b)
And as described with reference to FIG. 5(a), from the second training data 74R2 and the second pre-training data 70R2L, the window size non-tumor area training data 75R2 is created by the window W1. The
図11に示すステップS15において、処理部10Aは、ウィンドウサイズの腫瘍領域
訓練データ75R1、非腫瘍領域訓練データ75R2および非組織領域訓練データ75R
3を用いて、ニューラルネットワーク50を学習させる。ニューラルネットワーク50の
学習結果は、ウィンドウサイズの腫瘍領域訓練データ75R1、非腫瘍領域訓練データ7
5R2および非組織領域訓練データ75R3を用いてニューラルネットワーク50を学習
させる度に蓄積される。
In step S15 shown in FIG. 11, the
3 is used to train the
It is accumulated each time
実施形態に係る画像解析方法では、畳み込みニューラルネットワークを使用しており、
確率的勾配降下法を用いるため、ステップS16において、処理部10Aは、予め定めら
れた所定の試行回数分の学習結果が蓄積されているか否かを判断する。学習結果が所定の
試行回数分蓄積されている場合、処理部10AはステップS17の処理を行い、学習結果
が所定の試行回数分蓄積されていない場合、処理部10AはステップS18の処理を行う
。
The image analysis method according to the embodiment uses a convolutional neural network,
Since the stochastic gradient descent method is used, in step S16, the
学習結果が所定の試行回数分蓄積されている場合、ステップS17において、処理部1
0Aは、ステップS15において蓄積しておいた学習結果を用いて、ニューラルネットワ
ーク50の結合重みwを更新する。実施形態に係る画像解析方法では、確率的勾配降下法
を用いるため、所定の試行回数分の学習結果が蓄積した段階で、ニューラルネットワーク
50の結合重みwを更新する。結合重みwを更新する処理は、具体的には、後述の(式1
1)および(式12)に示される、勾配降下法による計算を実施する処理である。
When the learning result is accumulated for the predetermined number of trials, in step S17, the
0A updates the connection weight w of the
1) and (Equation 12), which is a process of performing the calculation by the gradient descent method.
ステップS17において、処理部10Aは、第1の訓練データ74R1、第2の訓練デ
ータ74R2および第3の訓練データ74R3のそれぞれについて各領域訓練データ内の
規定数の画素を処理したか否かを判断する。各領域訓練データの規定数の画素について、
ステップS15からステップS17の一連の処理がなされている場合は、深層学習処理を
終了する。ニューラルネットワークの学習は、必ずしも各訓練データ内の全ての画素に対
して行う必要は無く、処理部10Aは、各訓練データ内の一部の画素、すなわち規定数の
画素に対して処理をし学習を行うことができる。規定数の画素は、各領域訓練データ内の
全ての画素であってもよい。
In step S17, the
If a series of processes from step S15 to step S17 have been performed, the deep learning process is terminated. Neural network learning does not necessarily have to be performed on all pixels in each training data, and the
各領域訓練データ内の規定数の画素が処理されていない場合は、処理部10Aは、ステ
ップS19において、図4(b)に示すように、第1の訓練データ74R1内、第2の訓
練データ74R2内または第3の訓練データ74R3内において、ウィンドウの位置を移
動させる。その後、処理部10Aは、移動後の新たなウィンドウ位置において、ステップ
S14からステップS16の一連の処理を行う。すなわち、処理部10Aは、ステップS
14において、移動後の新たなウィンドウ位置において第1の訓練データ74R1、第2
の訓練データ74R2および第3の訓練データ74R3のそれぞれについてウィンドウサ
イズの各領域訓練データ75R1,75R2,75R3を切り出し、各領域を示すラベル
値を付す。引き続き、処理部10Aは、ステップS15において、新たに切り出したウィ
ンドウサイズの各領域訓練データ75R1,75R2,75R3を用いて、ニューラルネ
ットワーク50を学習させる。ステップS16において、所定の試行回数分の学習結果が
蓄積されている場合は、処理部10Aは、ステップS17において、ニューラルネットワ
ーク50の結合重みwを更新する。このようなウィンドウサイズ毎のニューラルネットワ
ーク50の学習を、第1の訓練データ74R1、第2の訓練データ74R2および第3の
訓練データ74R3のそれぞれについて規定数の画素に対して行う。
If the specified number of pixels in each area training data have not been processed, the
14, the first training data 74R1, the second
Training data 75R1, 75R2, 75R3 of each window size are extracted from training data 74R2 and third training data 74R3, and a label value indicating each region is attached. Subsequently, in step S15, the
以上説明した、ステップS10からS19の深層学習処理を、さらに別途取得された第
1の訓練用画像70R1と、第2の訓練用画像70R2と、第3の訓練用画像70R3に
対して繰り返し行うことにより、ニューラルネットワーク50の学習の程度を向上させる
。これにより、図5に示すニューラルネットワーク構造の深層学習アルゴリズム60を得
る。
Repeating the deep learning processing of steps S10 to S19 described above for the first training image 70R1, the second training image 70R2, and the third training image 70R3 that are separately acquired. improves the degree of learning of the
・ニューラルネットワークの構造
図12(a)に示すように、第1の実施形態では、深層学習タイプのニューラルネット
ワークを用いる。深層学習タイプのニューラルネットワークは、図12に示すニューラル
ネットワーク50のように、入力層50aと、出力層50bと、入力層50aおよび出力
層50bの間の中間層50cとを備え、中間層50cが複数の層で構成されている。中間
層50cを構成する層の数は、例えば5層以上とすることができる。
Structure of Neural Network As shown in FIG. 12(a), in the first embodiment, a deep learning type neural network is used. A deep learning type neural network, like the
ニューラルネットワーク50では、層状に配置された複数のノード89が、層間におい
て結合されている。これにより、情報が入力側の層50aから出力側の層50bに、図中
矢印Dに示す一方向のみに伝播する。本実施形態では、入力層50aのノード数は、入力
される画像の画素数すなわち図3(c)に示すウィンドウW1の画素数と各画素に含まれ
る色の原色の数との積に対応している。入力層50aに画像の画素データ(色濃度値)を
入力することができるので、ユーザは入力画像から特徴量を別途算出することなく、入力
画像を入力層50aに入力することができる。
In the
・各ノードにおける演算
図12(b)は、各ノードにおける演算を示す模式図である。各ノード89では、複数
の入力を受け取り、1つの出力(z)を計算する。図12(b)に示す例の場合、ノード
89は4つの入力を受け取る。ノード89が受け取る総入力(u)は、以下の(式1)で
表される。
Calculations at Each Node FIG. 12B is a schematic diagram showing calculations at each node. Each
![]()
![]()
各入力には、それぞれ異なる重みが掛けられる。(式1)中、bはバイアスと呼ばれる
値である。ノードの出力(z)は、(式1)で表される総入力(u)に対する所定の関数
fの出力となり、以下の(式2)で表される。関数fは活性化関数と呼ばれる。
Each input is multiplied by a different weight. In (Formula 1), b is a value called bias. The output (z) of the node becomes the output of a predetermined function f with respect to the total input (u) represented by (Equation 1), and is represented by (Equation 2) below. The function f is called the activation function.
![]()
![]()
図12(c)は、ノード間の演算を示す模式図である。ニューラルネットワーク50で
は、(式1)で表される総入力(u)に対して、(式2)で表される結果(z)を出力す
るノードが層状に並べられている。前の層のノードの出力が、次の層のノードの入力とな
る。図12(c)に示す例では、図中左側の層のノード89aの出力が、図中右側の層の
ノード89bの入力となる。右側の層の各ノード89bは、それぞれ、左側の層のノード
89aからの出力を受け取る。左側の層の各ノード89aと右側の層の各ノード89bと
の間の各結合には、異なる重みが掛けられる。左側の層の複数のノード89aのそれぞれ
の出力をx1~x4とすると、右側の層の3つのノード89bのそれぞれに対する入力は
、以下の(式3-1)~(式3-3)で表される。
FIG. 12(c) is a schematic diagram showing operations between nodes. In the

これら(式3-1)~(式3-3)を一般化すると、(式3-4)となる。ここで、i
=1,・・・I、j=1,・・・Jである。
Generalizing these (Formula 3-1) to (Formula 3-3) results in (Formula 3-4). where i
=1,...I, j=1,...J.
![]()
れる。
![]()
![]()
![]()
・活性化関数
実施形態に係る画像解析方法では、活性化関数として、正規化線形関数(rectified li
near unit function)を用いる。正規化線形関数は以下の(式5)で表される。
Activation function In the image analysis method according to the embodiment, a normalized linear function (rectified linear function) is used as the activation function.
near unit function). A normalized linear function is represented by the following (Equation 5).
![]()
![]()
(式5)は、z=uの線形関数のうち、u<0の部分をu=0とする関数である。図1
2(c)に示す例では、j=1のノードの出力は、(式5)により、以下の式で表される
。
(Formula 5) is a function where u=0 in the portion of u<0 in the linear function of z=u. Figure 1
In the example shown in 2(c), the output of the node of j=1 is represented by the following equation from (equation 5).
![]()
![]()
・ニューラルネットワークの学習
ニューラルネットワークを用いて表現される関数をy(x:w)とおくと、関数y(x
:w)は、ニューラルネットワークのパラメータwを変化させると変化する。入力xに対
してニューラルネットワークがより好適なパラメータwを選択するように、関数y(x:
w)を調整することを、ニューラルネットワークの学習と呼ぶ。ニューラルネットワーク
を用いて表現される関数の入力と出力との組が複数与えられているとする。ある入力xに
対する望ましい出力をdとすると、入出力の組は、{(x1,d1),(x2,d2),
・・・,(xn,dn)}と与えられる。(x,d)で表される各組の集合を、訓練デー
タと呼ぶ。具体的には、図3(b)に示す、R、G、B各色の単一色画像における画素毎
の色濃度値と真値像のラベルとの組、の集合が、図3(a)に示す訓練データである。
・Neural network learning When a function expressed using a neural network is y(x:w), the function y(x
:w) changes when the parameter w of the neural network is changed. The function y(x:
Adjusting w) is called training of the neural network. Assume that a plurality of pairs of inputs and outputs of a function expressed using a neural network are given. If the desired output for some input x is d, then the input/output pair is {(x 1 ,d 1 ),(x 2 ,d 2 ),
, (x n , d n )}. Each set of pairs represented by (x, d) is called training data. Specifically, a set of pairs of color density values and true value image labels for each pixel in single-color images of R, G, and B shown in FIG. 3(b) is shown in FIG. training data shown.
ニューラルネットワークの学習とは、どのような入出力の組(xn,dn)に対しても
、入力xnを与えたときのニューラルネットワークの出力y(xn:w)が、出力dnに
なるべく近づくように重みwを調整することを意味する。誤差関数(error function)と
は、ニューラルネットワークを用いて表現される関数と訓練データとの近さ
Neural network learning means that for any input/output pair ( xn , dn ), the output y( xn :w) of the neural network when the input xn is given is the output dn This means that the weight w is adjusted to be as close as possible to The error function is the closeness between the function represented using the neural network and the training data.
![]()
![]()
を測る尺度である。誤差関数は損失関数(loss function)とも呼ばれる。実施形態に係
る画像解析方法において用いる誤差関数E(w)は、以下の(式6)で表される。(式6
)は交差エントロピー(cross entropy)と呼ばれる。
is a measure of The error function is also called the loss function. The error function E(w) used in the image analysis method according to the embodiment is represented by the following (Equation 6). (
) is called the cross entropy.
![]()
![]()
(式6)の交差エントロピーの算出方法を説明する。実施形態に係る画像解析方法にお
いて用いるニューラルネットワーク50の出力層50bでは、すなわちニューラルネット
ワークの最終層では、入力xを内容に応じて有限個のクラスに分類するための活性化関数
を用いる。活性化関数はソフトマックス関数(softmax function)と呼ばれ、以下の(式
7)で表される。なお、出力層50bには、クラス数kと同数のノードが並べられている
とする。出力層Lの各ノードk(k=1,・・・K)の総入力uは、前層L-1の出力か
ら、uk
(L)で与えられるとする。これにより、出力層のk番目のノードの出力は以下
の(式7)で表される。
A method for calculating the cross entropy of (Equation 6) will be described. In the

(式7)がソフトマックス関数である。(式7)で決まる出力y1,・・・,yKの総
和は常に1となる。
(Equation 7) is the softmax function. The sum of the outputs y 1 , .
各クラスをC1,・・・,CKと表すと、出力層Lのノードkの出力yk(すなわちu
k
(L))は、与えられた入力xがクラスCkに属する確率を表す。以下の(式8)を参
照されたい。入力xは、(式8)で表される確率が最大になるクラスに分類される。
Denoting each class as C 1 , .
k (L) ) represents the probability that a given input x belongs to class C k . See
![]()
![]()
ニューラルネットワークの学習では、ニューラルネットワークで表される関数を、各ク
ラスの事後確率(posterior probability)のモデルとみなし、そのような確率モデルの
下で、訓練データに対する重みwの尤度(likelihood)を評価し、尤度を最大化するよう
な重みwを選択する。
In neural network learning, the function represented by the neural network is regarded as a model of the posterior probability of each class, and under such a probability model, the likelihood of the weight w on the training data is calculated as Evaluate and choose the weight w that maximizes the likelihood.
(式7)のソフトマックス関数による目標出力dnを、出力が正解のクラスである場合
のみ1とし、出力がそれ以外の場合は0になるとする。目標出力をdn=[dn1,・・
・,dnK]というベクトル形式で表すと、例えば入力xnの正解クラスがC3である場
合、目標出力dn3のみが1となり、それ以外の目標出力は0となる。このように符号化
すると、事後分布(posterior)は以下の(式9)で表される。
Assume that the target output dn by the softmax function of (Equation 7) is 1 only when the output is in the correct class, and is 0 otherwise. Let the target output be d n =[d n1 , .
·, d nK ], for example, if the correct class of the input xn is C3 , only the target output dn3 is 1, and the other target outputs are 0. When encoded in this way, the posterior is represented by the following (equation 9).
![]()
![]()
訓練データ{(xn,dn)}(n=1,・・・,N)に対する重みwの尤度L(w)
は、以下の(式10)で表される。尤度L(w)の対数をとり符号を反転すると、(式6
)の誤差関数が導出される。
Likelihood L(w) of weight w for training data {(x n , d n )} (n=1, . . . , N)
is represented by the following (Equation 10). Taking the logarithm of the likelihood L(w) and inverting the sign yields (
) is derived.

学習は、訓練データを基に計算される誤差関数E(w)を、ニューラルネットワークの
パラメータwについて最小化することを意味する。実施形態に係る画像解析方法では、誤
差関数E(w)は(式6)で表される。
Learning means minimizing the error function E(w) calculated based on the training data with respect to the parameter w of the neural network. In the image analysis method according to the embodiment, the error function E(w) is represented by (Equation 6).
誤差関数E(w)をパラメータwについて最小化することは、関数E(w)の局所的な
極小点を求めることと同じ意味である。パラメータwはノード間の結合の重みである。重
みwの極小点は、任意の初期値を出発点として、パラメータwを繰り返し更新する反復計
算によって求められる。このような計算の一例には、勾配降下法(gradient descent met
hod)がある。
勾配降下法では、次の(式11)で表されるベクトルを用いる。
Minimizing the error function E(w) with respect to the parameter w has the same meaning as obtaining a local minimum point of the function E(w). The parameter w is the weight of the connection between nodes. The minimum point of the weight w is obtained by iterative calculations that repeatedly update the parameter w, starting from an arbitrary initial value. An example of such a calculation is the gradient descent method.
hod).
The gradient descent method uses a vector represented by the following (Equation 11).
![]()
![]()
勾配降下法では、現在のパラメータwの値を負の勾配方向(すなわち-∇E)に移動さ
せる処理を何度も繰り返す。現在の重みをw(t)とし、移動後の重みをw(t+1)と
すると、勾配降下法による演算は、以下の(式12)で表される。値tは、パラメータw
を移動させた回数を意味する。
In gradient descent, the process of moving the current value of parameter w in the negative gradient direction (ie -∇E) is repeated many times. Assuming that the current weight is w (t) and the weight after movement is w (t+1) , the calculation by the gradient descent method is represented by the following (Equation 12). The value t is the parameter w
means the number of times the
![]()
![]()
記号
![]()
)で表される演算を繰り返すことにより、値tの増加に伴って誤差関数E(w(t))が
減少し、パラメータwは極小点に到達する。
symbol
![]()
), the error function E(w (t) ) decreases as the value t increases, and the parameter w reaches a minimum point.
なお、(式12)による演算は、全ての訓練データ(n=1,・・・,N)に対して実
施してもよく、一部の訓練データのみに対して実施してもよい。一部の訓練データのみに
対して行う勾配降下法は、確率的勾配降下法(stochastic gradient descent)と呼ばれ
る。実施形態に係る画像解析方法では、確率的勾配降下法を用いる。
Note that the calculation according to (Equation 12) may be performed on all the training data (n=1, . . . , N), or may be performed on only some of the training data. Gradient descent on only some training data is called stochastic gradient descent. The image analysis method according to the embodiment uses stochastic gradient descent.
・画像解析処理
図13を参照すると、第1の実施形態に係る画像解析装置200Aの処理部20Aは、
解析用データ生成部201と、解析用データ入力部202と、解析部203と、領域検出
部204とを備える。これらの機能ブロックは、本発明に係るコンピュータに画像解析処
理を実行させるプログラムを、処理部20Aの記憶部23またはメモリ22にインストー
ルし、このプログラムをCPU21が実行することにより実現される。ウィンドウサイズ
データベース104と、アルゴリズムデータベース105とは、記憶媒体98またはネッ
トワーク99を通じて深層学習装置100Aから提供され、処理部20Aの記憶部23ま
たはメモリ22に記憶される。
- Image analysis processing Referring to FIG. 13, the
It includes an analysis
解析対象の組織の解析対象画像78は、撮像装置400によって予め撮像され、処理部
20Aの記憶部23またはメモリ22に予め記憶されていることとする。学習済みの結合
重みwを含む深層学習アルゴリズム60は、解析対象の組織の標本が由来する組織の種類
と対応付けられてアルゴリズムデータベース105に格納されており、コンピュータに画
像解析処理を実行させるプログラムの一部であるプログラムモジュールとして機能する。
すなわち、深層学習アルゴリズム60は、CPUおよびメモリを備えるコンピュータにて
用いられ、解析対象の組織において各領域を示すデータを出力するという、使用目的に応
じた特有の情報の演算または加工を実行するよう、コンピュータを機能させる。具体的に
は、処理部20AのCPU21は、記憶部23またはメモリ22に記憶された深層学習ア
ルゴリズム60に規定されているアルゴリズムに従って、学習済みの結合重みwに基づく
ニューラルネットワーク60の演算を行う。処理部20AのCPU21は、入力層60a
に入力された、解析対象の組織を撮像した解析対象画像78に対して演算を行い、出力層
60bから、解析対象の組織において各領域を示すデータである3値画像83を出力する
。
It is assumed that the
That is, the
Calculation is performed on the
図14を参照すると、画像解析装置200Aの処理部20Aは、図13に示す処理を行
う。図13に示す各機能ブロックを用いて説明すると、ステップS21およびS22の処
理は、解析用データ生成部201が行う。ステップS23,S24,S26およびS27
の処理は、解析用データ入力部202が行う。ステップS25およびS28の処理は、解
析部203が行う。ステップS29の処理は、領域検出部204が行う。
Referring to FIG. 14, the
is performed by the analysis
ステップS21において、処理部20Aは、例えば、ユーザ等が入力部26から入力し
た処理開始の指令により、入力された解析対象画像78からR、G、B各色の色濃度符号
化図79r,79g,79bを生成する。色濃度符号化図79r,79g,79bから画
素毎にR、G、B各色の色濃度値を組み合わせた解析対象データが生成される。色濃度符
号化図79r,79g,79bの生成方法は、図11に示す深層学習処理時におけるステ
ップS10での生成方法と同様である。
In step S21, the
図14に示すステップS22において、処理部20Aは、入力部26を通じて、解析条
件として、画像解析装置200A側のユーザからの、組織の種別の入力を受け付ける。処
理部20Aは、入力された組織の種別に基づき、ウィンドウサイズデータベース104お
よびアルゴリズムデータベース105を参照して、解析に用いるウィンドウサイズを設定
し、解析に用いる深層学習アルゴリズム60を取得する。ウィンドウサイズは、1回の入
力時にニューラルネットワーク60に入力する解析用データの単位であり、ウィンドウサ
イズの解析用データ80の画素数と画像に含まれる色の原色の数との積が、入力層60a
のノード数に対応している。ウィンドウサイズは組織の種別と対応付けられて、ウィンド
ウサイズデータベース104内に予め記憶されている。ウィンドウサイズは、図6に示す
ウィンドウW2のように、例えば3×3画素である。深層学習アルゴリズム60も、組織
の種別と対応付けられて、図13に示すアルゴリズムデータベース105内に予め記憶さ
れている。
In step S22 shown in FIG. 14, the
corresponds to the number of nodes in The window size is associated with the type of organization and stored in the
図14に示すステップS23において、処理部20Aは、色濃度符号化図79r,79
g,79bから画素毎にR、G、B各色の色濃度値を組み合わせた解析対象データを生成
し、さらにウィンドウサイズの解析用データ80を生成する。
In step S23 shown in FIG. 14, the
Data to be analyzed is generated by combining the color density values of R, G, and B for each pixel from g and 79b, and window
ステップS24において、処理部20Aは、図5に示す解析用データ80を、深層学習
アルゴリズム60に入力する。ウィンドウの初期位置は、深層学習処理時におけるステッ
プS14と同様に、例えばウィンドウ内の3×3画素に位置する画素が、解析対象データ
の左上角に対応する位置である。処理部20Aは、ウィンドウサイズの解析用データ80
に含まれる、3×3画素×3原色の合計27個の色濃度値のデータ81を入力層60aに
入力すると、深層学習アルゴリズム60は、出力層60bに判別結果82を出力する。
At step S24, the
is input to the
図14に示すステップS25において、処理部20Aは、図5に示す出力層60bに出
力される判別結果82を記憶する。判別結果82は、解析対象データの各画素領域につい
ての推定値(0、1、2の3値のいずれか)である。
In step S25 shown in FIG. 14, the
図14に示すステップS26において、処理部20Aは、入力画像内の全ての画素を処
理したか否かを判断する。入力画像は、図6に示す色濃度符号化図79r,79g,79
bであり、解析対象データ内の全ての画素について、図14に示すステップS23からス
テップS25の一連の処理がなされている場合は、ステップS28の処理を行う。
In step S26 shown in FIG. 14, the
b, and the series of processes from step S23 to step S25 shown in FIG. 14 have been performed for all the pixels in the analysis target data, the process of step S28 is performed.
解析対象データ内の全ての画素が処理されていない場合は、処理部20Aは、ステップ
S27において、深層学習処理時におけるステップS20と同様に、図5に示す色濃度符
号化図79r,79g,79b内において、ウィンドウW2を所定の画素数の単位で移動
させる。その後、処理部20Aは、移動後の新たなウィンドウW2の位置において、ステ
ップS23からステップS25の一連の処理を行う。処理部20Aは、ステップS25に
おいて、移動後の新たなウィンドウ位置に対応する、判別結果82を記憶する。このよう
なウィンドウサイズ毎の判別結果82の記憶を、解析対象画像内の全ての画素に対して行
うことにより、解析結果の3値画像83が得られる。解析結果の3値画像83の画像サイ
ズは、解析対象画像の画像サイズと同じである。ここで、3値画像83には、推定値の値
2、値1および値0が各画素に付された数値データであってもよく、推定値の値2、値1
および値0に代えて、例えば値2、値1および値0のそれぞれに対応付けた表示色で示し
た画像であっても良い。
If all the pixels in the analysis target data have not been processed, the
and the
図14に示すステップS28では、処理部20Aは、解析結果の3値画像83を出力部
27に出力する。
At step S28 shown in FIG. 14, the
ステップS29では、ステップS28に引き続き、処理部20Aは、解析結果の3値画
像83についてさらに、領域検出処理を行う。3値画像83において、腫瘍領域と、非腫
瘍領域と、非組織領域とは、3値で区別して表されている。
In step S29, following step S28, the
任意ではあるが、処理部20Aは、得られた各領域を、解析対象の解析対象画像78に
重ねることにより、領域強調画像84を作成する。処理部20Aは、作成した領域強調画
像84を出力部27に出力し、画像解析処理を終了する。
Optionally, the
任意ではあるが、処理部20Aは、解析対象画像78に含まれる組織において、腫瘍領
域がどの程度含まれているか算出してもよい。例えば、解析対象画像78に含まれる組織
に該当する画素数、すなわち腫瘍領域および非腫瘍領域と判定された画素数の合計(組織
領域総画素数)を100%とした場合に、腫瘍領域と判定された画素数が何%を占めるか
を算出することにより、腫瘍領域の含有率を算出することができる。また、総画素数から
腫瘍領域と判定された画素数を減じることにより、または組織領域総画素数)を100%
とした場合に、非腫瘍領域と判定された画素数が何%を占めるかを算出することにより、
非腫瘍領域の含有率を算出することができる。そして、腫瘍領域の含有率と非腫瘍領域の
含有率との比率を算出してもよい。前記算出された値は、出力部27に出力されてもよい
。また、算出された値は、領域強調画像84と共に出力部27に出力されてもよい。
Optionally, the
By calculating the percentage of pixels determined to be non-tumor areas,
The content of non-tumor regions can be calculated. Then, the ratio between the content rate of the tumor region and the content rate of the non-tumor region may be calculated. The calculated value may be output to the
このように腫瘍領域の含有率を算出することは、がん組織の遺伝子解析等に用いられる
組織が検査に適した腫瘍組織を含んでいるかスクリーニングする上で有用である。
Calculating the tumor region content rate in this way is useful in screening whether or not a tissue used for genetic analysis of cancer tissue contains tumor tissue suitable for testing.
以上、画像解析装置200Aのユーザは、解析対象の組織の解析対象画像78を画像解
析装置200Aに入力することにより、解析結果として、3値画像83を取得することが
できる。3値画像83は、解析対象の標本における、腫瘍領域と、非腫瘍領域と、非組織
領域とを表しており、ユーザは、解析対象の標本において、各領域を判別することが可能
となる。
As described above, the user of the
さらに、画像解析装置200Aのユーザは、解析結果として、領域強調画像84を取得
することができる。領域強調画像84は、例えば、解析対象の解析対象画像78に、各領
域を色で塗りつぶすことにより生成される。また、別の態様では、各領域の境界線を重ね
ることにより生成されている。これにより、ユーザは、解析対象の組織において、各領域
を一目で把握することが可能となる。
Furthermore, the user of the
解析対象の標本において腫瘍領域、および/または非腫瘍領域を示すことは、組織診断
に先立って解析対象組織における腫瘍領域をスクリーニングし、標本観察効率を上げる一
助となる。
Showing the tumor area and/or the non-tumor area in the specimen to be analyzed helps to screen the tumor area in the tissue to be analyzed prior to tissue diagnosis, thereby increasing specimen observation efficiency.
<第2の実施形態>
以下、第1の実施形態に係る画像解析システムと相違する点について、第2の実施形態
に係る画像解析システムを説明する。
<Second embodiment>
The image analysis system according to the second embodiment will be described below with respect to differences from the image analysis system according to the first embodiment.
[構成の概要]
図15を参照すると、第2の実施形態に係る画像解析システムは、ユーザ側装置200
を備え、ユーザ側装置200が、統合型の画像解析装置200Bとして動作する。画像解
析装置200Bは、例えば汎用コンピュータで構成されており、第1の実施形態において
説明した深層学習処理および画像解析処理の両方の処理を行う。つまり、第2の実施形態
に係る画像解析システムは、ユーザ側で深層学習および画像解析を行う、スタンドアロン
型のシステムである。第2の実施形態に係る画像解析システムは、ユーザ側に設置された
統合型の画像解析装置200Bが、第1の実施形態に係る深層学習装置100Aおよび画
像解析装置200Aの両方の機能を担う点において、第1の実施形態に係る画像解析シス
テムと異なる。
[Configuration overview]
Referring to FIG. 15, the image analysis system according to the second embodiment includes a user-
and the user-
画像解析装置200Bは撮像装置400に接続されている。撮像装置400は、深層学
習処理時には、学習用の組織の訓練用画像を取得し、画像解析処理時には、解析対象の組
織の解析対象画像78を取得する。
The
[ハードウェア構成]
画像解析装置200Bのハードウェア構成は、図9に示すユーザ側装置200のハード
ウェア構成と同様である。
[Hardware configuration]
The hardware configuration of the
[機能ブロックおよび処理手順]
図16を参照すると、第2の実施形態に係る画像解析装置200Bの処理部20Bは、
訓練データ生成部101と、訓練データ入力部102と、アルゴリズム更新部103と、
解析用データ生成部201と、解析用データ入力部202と、解析部203と、領域検出
部204とを備える。これらの機能ブロックは、コンピュータに深層学習処理および画像
解析処理を実行させるプログラムを、処理部20Bの記憶部23またはメモリ22にイン
ストールし、このプログラムをCPU21が実行することにより実現される。ウィンドウ
サイズデータベース104と、アルゴリズムデータベース105とは、処理部20Bの記
憶部23またはメモリ22に記憶され、どちらも深層学習時および画像解析処理時に共通
して使用される。学習済みのニューラルネットワーク60は、組織の種別または細胞を含
む試料の種別と対応付けられて、アルゴリズムデータベース105に予め格納されており
、深層学習処理により結合重みwが更新されて、深層学習アルゴリズム60として、アル
ゴリズムデータベース105に格納される。なお、訓練用画像である第1の訓練用画像7
0R1、第2の訓練用画像70R2、第3の訓練用画像70R3は、撮像装置400によ
って予め撮像され、処理部20Bの記憶部23またはメモリ22に予め記憶されているこ
ととする。解析対象の標本の解析対象画像78も、撮像装置400によって予め撮像され
、処理部20Bの記憶部23またはメモリ22に予め記憶されていることとする。
[Functional block and processing procedure]
Referring to FIG. 16, the
A training
It includes an analysis
0R1, the second training image 70R2, and the third training image 70R3 are preliminarily captured by the
画像解析装置200Bの処理部20Bは、深層学習処理時には、図11に示す処理を行
い、画像解析処理時には、図14に示す処理を行う。図16に示す各機能ブロックを用い
て説明すると、深層学習処理時には、ステップS10からS12、S14、S18および
S19の処理は、訓練データ生成部101が行う。ステップS13の処理は、訓練データ
入力部102が行う。ステップS16およびS17の処理は、アルゴリズム更新部103
が行う。画像解析処理時には、ステップS21およびS22の処理は、解析用データ生成
部201が行う。ステップS23,S24,S26およびS27の処理は、解析用データ
入力部202が行う。ステップS25およびS28の処理は、解析部203が行う。ステ
ップS29の処理は、領域検出部204が行う。
The
does. During image analysis processing, the processing of steps S21 and S22 is performed by the analysis
第2の実施形態に係る画像解析装置200Bが行う深層学習処理の手順および画像解析
処理の手順は、第1の実施形態に係る深層学習装置100Aおよび画像解析装置200A
がそれぞれ行う手順と同様である。なお、第2の実施形態に係る画像解析装置200Bは
、次の点において第1の実施形態に係る深層学習装置100Aおよび画像解析装置200
Aと異なる。
The deep learning processing procedure and the image analysis processing procedure performed by the
is similar to the procedure performed by each. Note that the
Different from A.
深層学習処理時のステップS13において、処理部20Bは、入力部26を通じて、画
像解析装置200Bのユーザからの、学習用の組織の種別の入力を受け付ける。処理部2
0Bは、入力された組織の種別に基づき、ウィンドウサイズデータベース104を参照し
て、ウィンドウサイズを設定し、アルゴリズムデータベース105を参照して、学習に用
いるニューラルネットワーク50を設定する。
In step S<b>13 during deep learning processing, the
0B refers to the
以上、画像解析装置200Bのユーザは、解析対象画像78を画像解析装置200Bに
入力することにより、解析結果として、3値画像83を取得することができる。さらに、
画像解析装置200Bのユーザは、解析結果として、領域強調画像84を取得することが
できる。
As described above, the user of the
The user of the
第2の実施形態に係る画像解析装置200Bによると、ユーザは、自身が選択した種類
の組織を、学習用の組織として用いることができる。これは、ニューラルネットワーク5
0の学習がベンダ側任せではなく、ユーザ自身がニューラルネットワーク50の学習の程
度を向上できることを意味する。
According to the
This means that learning of 0 is not left to the vendor side, but that the user can improve the degree of learning of the
<第3の実施形態>
以下、第2の実施形態に係る画像解析システムと相違する点について、第3の実施形態
に係る画像解析システムを説明する。
<Third Embodiment>
The image analysis system according to the third embodiment will be described below with respect to the differences from the image analysis system according to the second embodiment.
[構成の概要]
図17を参照すると、第3の実施形態に係る画像解析システムは、ベンダ側装置100
と、ユーザ側装置200とを備える。ベンダ側装置100は統合型の画像解析装置100
Bとして動作し、ユーザ側装置200は端末装置200Cとして動作する。画像解析装置
100Bは、例えば汎用コンピュータで構成されており、第1の実施形態において説明し
た深層学習処理および画像解析処理の両方の処理を行う、クラウドサーバ側の装置である
。端末装置200Cは、例えば汎用コンピュータで構成されており、ネットワーク99を
通じて、解析対象の画像を画像解析装置100Bに送信し、ネットワーク99を通じて、
解析結果の画像を画像解析装置100Bから受信する、ユーザ側の端末装置である。
[Configuration overview]
Referring to FIG. 17, the image analysis system according to the third embodiment includes a vendor-
and a user-
B, and the user-
It is a terminal device on the user side that receives the image of the analysis result from the
第3の実施形態に係る画像解析システムは、ベンダ側に設置された統合型の画像解析装
置100Bが、第1の実施形態に係る深層学習装置100Aおよび画像解析装置200A
の両方の機能を担う点において、第2の実施形態に係る画像解析システムと同様である。
一方、第3の実施形態に係る画像解析システムは、端末装置200Cを備え、解析対象の
画像の入力インタフェースと、解析結果の画像の出力インタフェースとをユーザ側の端末
装置200Cに提供する点において、第2の実施形態に係る画像解析システムと異なる。
つまり、第3の実施形態に係る画像解析システムは、深層学習処理および画像解析処理を
行うベンダ側が、解析対象の画像および解析結果の画像の入出力インタフェースをユーザ
側に提供する、クラウドサービス型のシステムである。
In the image analysis system according to the third embodiment, an integrated
It is the same as the image analysis system according to the second embodiment in that it performs both functions.
On the other hand, the image analysis system according to the third embodiment includes a
In other words, the image analysis system according to the third embodiment is a cloud service type in which a vendor that performs deep learning processing and image analysis processing provides an input/output interface for an image to be analyzed and an analysis result image to the user. System.
画像解析装置100Bは撮像装置300に接続されており、撮像装置300によって撮
像される、学習用の組織の訓練用画像を取得する。
The
端末装置200Cは撮像装置400に接続されており、撮像装置400によって撮像さ
れる、解析対象の組織の解析対象画像78を取得する。
The
[ハードウェア構成]
画像解析装置100Bのハードウェア構成は、図7に示すベンダ側装置100のハード
ウェア構成と同様である。端末装置200Cのハードウェア構成は、図9に示すユーザ側
装置200のハードウェア構成と同様である。
[Hardware configuration]
The hardware configuration of the
[機能ブロックおよび処理手順]
図18を参照すると、第3の実施形態に係る画像解析装置100Bの処理部10Bは、
訓練データ生成部101と、訓練データ入力部102と、アルゴリズム更新部103と、
解析用データ生成部201と、解析用データ入力部202と、解析部203と、領域検出
部204とを備える。これらの機能ブロックは、コンピュータに深層学習処理および画像
解析処理を実行させるプログラムを、処理部10Bの記憶部13またはメモリ12にイン
ストールし、このプログラムをCPU11が実行することにより実現される。ウィンドウ
サイズデータベース104と、アルゴリズムデータベース105とは、処理部10Bの記
憶部13またはメモリ12に記憶され、どちらも深層学習時および画像解析処理時に共通
して使用される。ニューラルネットワーク50は、組織の種別と対応付けられて、アルゴ
リズムデータベース105に予め格納されており、深層学習処理により結合重みwが更新
されて、深層学習アルゴリズム60として、アルゴリズムデータベース105に格納され
る。
[Functional block and processing procedure]
Referring to FIG. 18, the
A training
It includes an analysis
なお、訓練用画像である第1の訓練用画像70R1、第2の訓練用画像70R2、第3
の訓練用画像70R3は、撮像装置300によって予め撮像され、処理部10Bの記憶部
13またはメモリ12に予め記憶されていることとする。解析対象の組織の解析対象画像
78も、撮像装置400によって予め撮像され、端末装置200Cの処理部20Cの記憶
部23またはメモリ22に予め記憶されていることとする。
It should be noted that a first training image 70R1, a second training image 70R2, a third
The training image 70R3 is captured in advance by the
画像解析装置100Bの処理部10Bは、深層学習処理時には、図11に示す処理を行
い、画像解析処理時には、図14に示す処理を行う。図18に示す各機能ブロックを用い
て説明すると、深層学習処理時には、ステップS10からS12、S14、S18および
S19の処理は、訓練データ生成部101が行う。ステップS13の処理は、訓練データ
入力部102が行う。ステップS16およびS17の処理は、アルゴリズム更新部103
が行う。画像解析処理時には、ステップS21およびS22の処理は、解析用データ生成
部201が行う。ステップS23,S24,S26およびS27の処理は、解析用データ
入力部202が行う。ステップS25およびS28の処理は、解析部203が行う。ステ
ップS29の処理は、領域検出部204が行う。
The
does. During image analysis processing, the processing of steps S21 and S22 is performed by the analysis
第3の実施形態に係る画像解析装置100Bが行う深層学習処理の手順および画像解析
処理の手順は、第1の実施形態に係る深層学習装置100Aおよび画像解析装置200A
がそれぞれ行う手順と同様である。なお、第3の実施形態に係る画像解析装置100Bは
、次の4つの点において第1の実施形態に係る深層学習装置100Aおよび画像解析装置
200Aと異なる。
The deep learning processing procedure and the image analysis processing procedure performed by the
is similar to the procedure performed by each. The
図14に示す画像解析処理時のステップS21において、処理部10Bは、解析対象の
組織の解析対象画像78を、ユーザ側の端末装置200Cから受信し、受信した解析対象
画像78からR、G、B各色の色濃度符号化図79r,79g,79bを生成する。色濃
度符号化図79r,79g,79bおよび解析対象データの生成方法は、図11に示す深
層学習処理時におけるステップS10での生成方法と同様である。
In step S21 during the image analysis process shown in FIG. 14, the
図14に示す画像解析処理時のステップS22において、処理部10Bは、端末装置2
00Cの入力部26を通じて、解析条件として、端末装置200Cのユーザからの、組織
の種別の入力を受け付ける。処理部10Bは、入力された組織の種別に基づき、ウィンド
ウサイズデータベース104およびアルゴリズムデータベース105を参照して、解析に
用いるウィンドウサイズを設定し、解析に用いる深層学習アルゴリズム60を取得する。
At step S22 during the image analysis processing shown in FIG.
00C receives an input of the type of tissue from the user of the
画像解析処理時のステップS28において、処理部10Bは、解析結果の3値画像83
を、ユーザ側の端末装置200Cに送信する。ユーザ側の端末装置200Cでは、処理部
20Cが、受信した解析結果の3画像83を出力部27に出力する。
In step S28 during image analysis processing, the
is transmitted to the
画像解析処理時のステップS29において、処理部10Bは、ステップS28に引き続
き、解析結果の3値画像83についてさらに、核領域の検出処理を行う。任意のステップ
として、処理部10Bは、得られた各領域を、解析対象の解析対象画像78に重ねること
により、領域強調画像84を作成する。処理部10Bは、作成した領域強調画像84を、
ユーザ側の端末装置200Cに送信する。ユーザ側の端末装置200Cでは、処理部20
Cが、受信した領域強調画像84を出力部27に出力し、画像解析処理を終了する。
In step S29 of the image analysis process, the
It is transmitted to the
C outputs the received region-enhanced
以上、端末装置200Cのユーザは、解析対象の組織の解析対象画像78を画像解析装
置100Bに送信することにより、解析結果として、3値画像83を取得することができ
る。さらに、端末装置200Cのユーザは、解析結果として、領域強調画像84を取得す
ることができる。
As described above, the user of the
第3の実施形態に係る画像解析装置100Bによると、ユーザは、ウィンドウサイズデ
ータベース104およびアルゴリズムデータベース105を深層学習装置100Aから取
得することなく、画像解析処理の結果を享受することができる。これにより、解析対象の
組織を解析するサービスとして、腫瘍領域および/または非腫瘍領域を判別し各組織にお
ける腫瘍領域をスクリーニングするサービスを、クラウドサービスとして提供することが
できる。
According to the
[コンピュータプログラム]
本発明の実施形態には、前記ステップS10からS20を処理部10A,20B,10
Bに実行させ、学習済み深層学習アルゴリズムの生成するコンピュータプログラムおよび
その製品が含まれる。また、本発明の実施形態には、前記ステップS21からS29を処
理部10A,20B,10Bに実行させ、コンピュータを個体から採取された組織の画像
を解析するために機能させるコンピュータプログラムおよびその製品が含まれる。
[Computer program]
In the embodiment of the present invention, steps S10 to S20 are performed by the
A computer program executed by B to generate a trained deep learning algorithm and products thereof. Further, in the embodiment of the present invention, there is provided a computer program and a product thereof that cause the
[その他の形態]
以上、本発明を概要および特定の実施形態によって説明したが、本発明は上記した概要
および各実施形態に限定されるものではない。
[Other forms]
Although the present invention has been described by the summary and specific embodiments, the present invention is not limited to the above summary and each embodiment.
上記第1から第3の実施形態では、ステップS13において、処理部10A,20B,
10Bは、ウィンドウサイズデータベース104を参照して、ウィンドウサイズの画素数
を設定しているが、オペレータまたはユーザがウィンドウサイズを直接設定してもよい。
この場合、ウィンドウサイズデータベース104は不要となる。
In the first to third embodiments, in step S13, the
10B refers to the
In this case, the
上記第1から第3の実施形態では、ステップS13において、処理部10A,20B,
10Bは、入力された組織の種別に基づいて、ウィンドウサイズの画素数を設定している
が、組織の種別の入力に代えて、組織のサイズを入力してもよい。処理部10A,20B
,10Bは、入力された組織のサイズに基づいて、ウィンドウサイズデータベース104
を参照して、ウィンドウサイズの画素数を設定すればよい。ステップS22においてもス
テップS13と同様に、組織の種別の入力に代えて、組織のサイズを入力してもよい。処
理部20A,20B,10Bは、入力された組織のサイズに基づいて、ウィンドウサイズ
データベース104およびアルゴリズムデータベース105を参照して、ウィンドウサイ
ズの画素数を設定し、ニューラルネットワーク60を取得すればよい。
In the first to third embodiments, in step S13, the
10B sets the number of pixels of the window size based on the input tissue type, but instead of inputting the tissue type, the tissue size may be input.
, 10B are stored in the
to set the number of pixels for the window size. In step S22, similarly to step S13, instead of inputting the type of tissue, the size of the tissue may be input. The
組織のサイズを入力する態様については、サイズを数値として直接入力してもよいし、
例えば入力のユーザインタフェースをプルダウンメニューとして、ユーザが入力しようと
するサイズに対応する、所定の数値範囲をユーザに選択させて入力してもよい。
Regarding the aspect of inputting the size of the tissue, the size may be directly input as a numerical value,
For example, the input user interface may be a pull-down menu, allowing the user to select and input a predetermined numerical range corresponding to the size the user intends to input.
また、ステップS13およびステップS22において、組織の種別または組織のサイズ
に加えて、訓練用画像、および解析対象画像78を撮像した際の撮像倍率を入力してもよ
い。撮像倍率を入力する態様については、倍率を数値として直接入力してもよいし、例え
ば入力のユーザインタフェースをプルダウンメニューとして、ユーザが入力しようとする
倍率に対応する、所定の数値範囲をユーザに選択させて入力してもよい。
Further, in steps S13 and S22, in addition to the type of tissue or the size of the tissue, the imaging magnification when the training image and the
上記第1から第3の実施形態では、深層学習処理時および画像解析処理時において、説
明の便宜のためにウィンドウサイズを3×3画素と設定しているが、ウィンドウサイズの
画素数はこれに限定されない。ウィンドウサイズは、例えば組織の種別に応じて設定して
もよい。この場合、ウィンドウサイズの画素数と画像に含まれる色の原色の数との積が、
ニューラルネットワーク50,60の入力層50a,60aのノード数に対応していれば
よい。
In the first to third embodiments, the window size is set to 3×3 pixels for convenience of explanation during deep learning processing and image analysis processing. Not limited. The window size may be set according to the type of organization, for example. In this case, the product of the number of pixels in the window size and the number of color primaries in the image is
The number of nodes in the input layers 50a and 60a of the
上記第1から第3の実施形態では、ステップS17において、処理部10A,20B,
10Bは、深層学習アルゴリズム60を、組織の種別と一対一に対応付けて、アルゴリズ
ムデータベース105に記憶している。これに代えて、ステップS17において、処理部
10A,20B,10Bは、1つの深層学習アルゴリズム60に、複数の組織の種別を対
応付けて、アルゴリズムデータベース105に記憶してもよい。
In the first to third embodiments, in step S17, the
10B stores the
上記第1から第3の実施形態では、色相は、光の3原色の組み合わせ、または色の3原
色の組み合わせで規定されているが、色相の数は3つに限定されない。色相の数は、赤(
R),緑(G),青(B)に黄(Y)を加えた4原色としても良いし、赤(R),緑(G
),青(B)の3原色からいずれか1つの色相を減らした2原色としてもよい。あるいは
、赤(R),緑(G),青(B)の3原色のいずれか1つ(例えば緑(G))のみの1原
色としてもよい。例えば公知の顕微鏡またはバーチャルスライドスキャナ等を用いて取得
される訓練用画像70R1,70R2,70R3および解析対象画像78も、赤(R),
緑(G),青(B)の3原色のカラー画像に限定されず、2原色のカラー画像であっても
よく、1以上の原色を含む画像であればよい。
In the first to third embodiments, the hues are defined by the combination of the three primary colors of light or the combination of the three primary colors of color, but the number of hues is not limited to three. The number of hues is red (
R), green (G), blue (B) and yellow (Y) may be used as four primary colors, or red (R), green (G
) and blue (B), any one of the three primary colors may be reduced to two primary colors. Alternatively, only one of the three primary colors of red (R), green (G), and blue (B) (for example, green (G)) may be used as one primary color. For example, training images 70R1, 70R2, 70R3 and an
The color image is not limited to the three primary colors of green (G) and blue (B), and may be a color image of two primary colors, as long as it contains one or more primary colors.
上記第1から第3の実施形態では、ステップS10において、処理部10A,20B,
10Bは、訓練用画像の各色濃度符号化図(色濃度符号化図70R1r,70R1g,7
0R1b、色濃度符号化図70R2r,70R2g,70R2b、色濃度符号化図70R
3r,70R3g,70R3b)を各原色の8ビット(256段階)の単一色画像として
生成しているが、各色濃度符号化図を作成する際の原色の階調は、8ビットに制限されな
い。各色濃度符号化図の階調は、スライドイメージスキャナの撮像条件に依存してもよい
。例えば、1ビット以上であり2ビット、4ビット、16ビット、24ビットの画像であ
ってもよい。同様に、ステップS21において、処理部20A,20B,10Bは、色濃
度符号化図79r,79g,79b各原色の単一色画像として生成しているが、色濃度符
号化図を作成する際の原色の階調は3階調に制限されない。色濃度符号化図を作成する際
の原色は、8ビットに制限されない。色濃度符号化図79r,79g,79bの階調は、
スライドイメージスキャナの撮像条件に依存してもよい。例えば、1ビット以上であり2
ビット、4ビット、16ビット、24ビットの画像であってもよい。訓練用画像の各色濃
度符号化図および色濃度符号化図79r,79g,79bの階調は、全てが同じ階調であ
ることが好ましい。
In the first to third embodiments, in step S10, the
10B is each color density coding diagram of the training image (color density coding diagrams 70R1r, 70R1g, 7
0R1b, color density encoding chart 70R2r, 70R2g, 70R2b, color density encoding chart 70R
3r, 70R3g, 70R3b) are generated as single-color images of 8 bits (256 steps) for each primary color, but the gradation of the primary colors when creating each color density coding diagram is not limited to 8 bits. The gradation of each color density coding diagram may depend on the imaging conditions of the slide image scanner. For example, it may be a 2-bit, 4-bit, 16-bit, or 24-bit image that is 1 bit or more. Similarly, in step S21, the
It may depend on the imaging conditions of the slide image scanner. For example, 1 bit or more and 2
It may be a bit, 4 bit, 16 bit, or 24 bit image. It is preferable that the gradation of each color density coding diagram of the training image and the color density coding diagrams 79r, 79g, and 79b are all the same gradation.
上記第1から第3の実施形態では、ステップS10において、処理部10A,20B,
10Bは、訓練用画像から、各色濃度符号化図を生成しているが、予め各画素が階調に応
じて符号化された行列表を訓練用画像として用いてもよい。処理部10A,20B,10
Bは、訓練用画像を各色濃度符号化図として、例えばバーチャルスライドスキャナ等から
直接取得してもよい。同様に、ステップS21において、処理部20A,20B,10B
は、解析対象画像78からR、G、B各色の色濃度符号化図79r,79g,79bを生
成しているが、予め各画素が階調に応じて符号化された行列表を解析用画像として用いて
もよい。すなわち、処理部20A,20B,10Bは、色濃度符号化図79r,79g,
79bを、例えばバーチャルスライドスキャナ等から直接取得してもよい。
In the first to third embodiments, in step S10, the
10B generates each color density coding diagram from the training image, but a matrix in which each pixel is previously coded according to the gradation may be used as the training image.
B may directly acquire the training image as each color density coding map from, for example, a virtual slide scanner. Similarly, in step S21, the
79r, 79g, and 79b are generated from the
79b may be obtained directly from, for example, a virtual slide scanner.
上記第1から第3の実施形態では、訓練用画像から各色濃度符号化図を生成する際のカ
ラースペースにはRGBを用いているが、カラースペースはRGBに制限されない。RG
B以外にも、YUV、CMY、およびCIE L*a*b*等の種々のカラースペースを
用いることができる。
In the first to third embodiments described above, RGB is used as the color space when generating each color density coding diagram from the training image, but the color space is not limited to RGB. RG
Various color spaces other than B can be used, such as YUV, CMY, and CIE L * a * b * .
上記第1から第3の実施形態では、各領域訓練データおよび解析用データ80において
、各画素について濃度値が赤(R),緑(G),青(B)の順番で格納されているが、濃
度値を格納および取り扱う順番はこれに限定されない。例えば濃度値は、青(B),緑(
G),赤(R)の順番で格納されていてもよく、各領域訓練データにおける濃度値の並び
順と、解析用データ80における濃度値の並び順とが同じであればよい。
In the first to third embodiments, the density values for each pixel are stored in the order of red (R), green (G), and blue (B) in the region training data and
G) and red (R) may be stored in this order, as long as the order of density values in each area training data is the same as the order of density values in
上記第1から第3の実施形態では、処理部10A,10Bは一体の装置として実現され
ているが、処理部10A,10Bは一体の装置である必要はなく、CPU11、メモリ1
2、記憶部13等が別所に配置され、これらがネットワークで接続されていてもよい。処
理部10A,10Bと、入力部16と、出力部17とについても、一ヶ所に配置される必
要は必ずしもなく、それぞれ別所に配置されて互いにネットワークで通信可能に接続され
ていてもよい。処理部20A,20B,20Cについても処理部10A,10Bと同様で
ある。
In the first to third embodiments, the
2. The
上記第1から第3の実施形態では、訓練データ生成部101、訓練データ入力部102
、アルゴリズム更新部103、解析用データ生成部201、解析用データ入力部202、
解析部203および領域検出部204の各機能ブロックは、単一のCPU11または単一
のCPU21において実行されているが、これら各機能ブロックは単一のCPUにおいて
実行される必要は必ずしもなく、複数のCPUで分散して実行されてもよい。また、これ
ら各機能ブロックは、複数のGPUで分散して実行されてもよいし、複数のCPUと複数
のGPUとで分散して実行されてもよい。
In the first to third embodiments, the training
,
Each functional block of the
上記第2および第3の実施形態では、図11および図14で説明する各ステップの処理
を行うためのプログラムを記憶部13,23に予め記憶している。これに代えて、プログ
ラムは、例えばDVD-ROMやUSBメモリ等の、コンピュータ読み取り可能であって
非一時的な有形の記憶媒体98から処理部10B,20Bにインストールしてもよい。ま
たは、処理部10B,20Bをネットワーク99と接続し、ネットワーク99を介して例
えば外部のサーバ(図示せず)からプログラムをダウンロードしてインストールしてもよ
い。
In the above-described second and third embodiments, the
上記第1から第3の実施形態では、入力部16,26はキーボードまたはマウス等の入
力装置であり、出力部17,27は液晶ディスプレイ等の表示装置として実現されている
。これに代えて、入力部16、26と出力部17、27とを一体化してタッチパネル式の
表示装置として実現してもよい。または、出力部17,27をプリンター等で構成し、解
析結果の3値画像83または領域強調画像84を印刷して出力してもよい。
In the first to third embodiments, the
上記第1から第3の実施形態では、撮像装置300は、深層学習装置100Aまたは画
像解析装置100Bと直接接続されているが、撮像装置300は、ネットワーク99を介
して深層学習装置100Aまたは画像解析装置100Bと接続されていてもよい。撮像装
置400についても同様に、撮像装置400は、画像解析装置200Aまたは画像解析装
置200Bと直接接続されているが、撮像装置400は、ネットワーク99を介して画像
解析装置200Aまたは画像解析装置200Bと接続されていてもよい。
In the first to third embodiments, the
<学習済み深層学習アルゴリズムの検証>
上記第2の実施形態に示すスタンドアロン型のシステムにて、深層学習処理および画像
解析処理を行った。学習の対象とする組織として、腫瘍領域と正常領域を含むヒト胃がん
組織を用いた。学習済みの深層学習アルゴリズムを作成するにあたり、組織標本の拡大倍
率を1倍、3倍、5倍、10倍、20倍、および40倍と変化させて訓練用画像を撮像し
、異なる拡大倍率の訓練用画像を用いた訓練データをニューラルネットワークに学習させ
、解析結果の正確性を確認した。
学習データおよび解析データの詳細は、次の通りであった。
学習データ:106枚のホールスライドイメージ
検証用解析データ:45枚のホールスライドイメージ
<Verification of learned deep learning algorithm>
Deep learning processing and image analysis processing were performed in the stand-alone system shown in the second embodiment. A human gastric cancer tissue containing a tumor region and a normal region was used as a target tissue for learning. In creating a trained deep learning algorithm, training images were taken by changing the magnification of the tissue sample to 1x, 3x, 5x, 10x, 20x, and 40x, and the different magnifications. We made the neural network learn the training data using the training images, and confirmed the accuracy of the analysis results.
The details of the learning data and analysis data were as follows.
Learning data: 106 hole slide images Analysis data for verification: 45 hole slide images
[訓練データの作成および学習]
HE染色した胃がん組織の明視野画像のホールスライドイメージを、バーチャルスライ
ドスキャナ(NanoZoomer-XR、(Hamamatsu Photonics;スキャン分解能:20倍モードスキ
ャン時0.46 μm/pixel、40倍モードスキャン時0.23 μm/pixel))を用いてカラー撮像し
た。撮像倍率は1倍、3倍、5倍、10倍、20倍、および40倍とした。学習対象の組
織を含むホールスライドイメージ上で、病理医が腫瘍領域、非腫瘍領域、および非組織領
域を指定した。各領域が指定されたホールスライドイメージを上記の条件で分割し、訓練
用画像とした。個々の訓練用画像について腫瘍領域であるか、非腫瘍領域であるか、非組
織領域であるかを決定した。その際、腫瘍領域と非腫瘍領域が混在する組織の領域につい
ては、訓練用画像内の組織領域に該当する画素数のうち、腫瘍領域と指定された画素数が
50%以上を占める場合には腫瘍領域とした。また、訓練用画像内の組織領域に該当する
画素数のうち、非腫瘍領域と指定された画素数が占める割合が100%の場合には非腫瘍
領域とした。非組織領域と組織領域が混在する訓練用画像については、組織領域が訓練用
画像の画素数の0%である場合に非組織領域とし、それ以外は組織領域とした。腫瘍領域
、非腫瘍領域、非組織領域と判定されたそれぞれの訓練用画像の各画素について、各領域
を区別するラベル値(腫瘍領域は「1」、非腫瘍領域は「2」、非組織領域は「0」)を
付与し、第1の予備訓練データ70R1L、第2の予備訓練データ70R2Lおよび第3
の予備訓練データ70R2Lを生成した。腫瘍領域と判定された訓練用画像を第1の訓練
用画像とし、非腫瘍領域と判定された訓練用画像を第2の訓練用画像70R2とし、非組
織領域と判定された訓練用画像を第3の訓練用画像70R3とした。各訓練用画像につい
てR、G、B各色の色濃度値を8ビットで階調化して、R、G、B各色の色濃度符号化図
を生成し、作成したR、G、B各色の色濃度符号化図を組み合わせて第1の訓練データ7
4R1、第2の訓練データ74R2、第3の訓練データ74R3のそれぞれを生成した。
[Creation and learning of training data]
A whole slide image of a bright-field image of HE-stained gastric cancer tissue was scanned with a virtual slide scanner (NanoZoomer-XR, (Hamamatsu Photonics; scanning resolution: 0.46 μm/pixel during 20x mode scanning, 0.23 μm/pixel during 40x mode scanning). ) was used for color imaging. Imaging magnifications were 1, 3, 5, 10, 20, and 40 times. A pathologist designated a tumor region, a non-tumor region, and a non-tissue region on the whole slide image containing the tissue to be learned. A whole slide image with each region specified was divided under the above conditions and used as a training image. Tumor, non-tumor, or non-tissue regions were determined for each training image. At that time, for a tissue region in which a tumor region and a non-tumor region are mixed, if the number of pixels designated as a tumor region occupies 50% or more of the number of pixels corresponding to the tissue region in the training image, It was taken as the tumor area. Also, when the number of pixels designated as non-tumor regions accounts for 100% of the number of pixels corresponding to the tissue region in the training image, it is regarded as a non-tumor region. For training images in which non-tissue regions and tissue regions are mixed, if the tissue region is 0% of the number of pixels in the training image, it is regarded as a non-tissue region, and otherwise is regarded as a tissue region. For each pixel of each training image determined as a tumor region, a non-tumor region, and a non-tissue region, a label value ("1" for a tumor region, "2" for a non-tumor region, "2" for a non-tissue region, and is "0"), and the first pre-training data 70R1L, the second pre-training data 70R2L and the third
generated pre-training data 70R2L. The training image determined to be the tumor region is the first training image, the training image determined to be the non-tumor region is the second training image 70R2, and the training image determined to be the non-tissue region is the second training image. 3 training image 70R3. For each training image, the color density values of each color of R, G, and B are gradated with 8 bits to generate a color density coding diagram of each color of R, G, and B, and the colors of each of R, G, and B colors created The
4R1, second training data 74R2, and third training data 74R3 were each generated.
その後、第1の訓練データ74R1と第1の予備訓練データ70R1Lとを組み合わせ
て腫瘍領域訓練データを作成した。第2の訓練データ74R2と第2の予備訓練データ7
0R2Lとを組み合わせて非腫瘍領域訓練データを作成した。第3の訓練データ74R3
と第3の予備訓練データ70R2Lとを組み合わせて非組織領域訓練データを作成した。
作成した各領域訓練データを200×200画素のウィンドウサイズに分割し、分割した
ウィンドウサイズの訓練データを入力層として、ニューラルネットワークを学習させた。
After that, the first training data 74R1 and the first preliminary training data 70R1L were combined to create tumor region training data. Second training data 74R2 and second
0R2L was combined to create non-tumor area training data. Third training data 74R3
and the third pre-training data 70R2L to create the non-tissue region training data.
The created training data for each area was divided into window sizes of 200×200 pixels, and the neural network was trained using the training data of the divided window sizes as an input layer.
各領域訓練データは組織標本の拡大倍率毎に生成し、拡大倍率毎にニューラルネットワ
ークを学習させた。
Training data for each region was generated for each magnification of the tissue sample, and the neural network was trained for each magnification.
[解析対象画像の作成]
訓練データと同様に、HE染色したヒト胃がん組織の明視野画像のホールスライドイメ
ージを、バーチャルスライドスキャナを用いてカラー撮像し解析用画像を得た。撮像倍率
は1倍、3倍、5倍、10倍、20倍、および40倍とした。その後、撮像した解析用画
像をもとにR、G、B各色の色濃度符号化図を作成し、作成したR、G、B各色の色濃度
符号化図を組み合わせて解析対象データを生成した。解析対象データは、拡大倍率毎に生
成した。
[Create analysis target image]
As with the training data, whole slide images of bright-field images of HE-stained human gastric cancer tissue were color-captured using a virtual slide scanner to obtain images for analysis. Imaging magnifications were 1, 3, 5, 10, 20, and 40 times. After that, based on the captured image for analysis, a color density coding diagram for each color of R, G, and B was created, and data to be analyzed was generated by combining the created color density coding diagrams for each color of R, G, and B. . Data to be analyzed was generated for each magnification.
[解析結果]
解析対象データから200×200画素のウィンドウサイズの解析用データを作成し、
解析用データを、拡大倍率に対応した学習済みのニューラルネットワークに入力した。ニ
ューラルネットワークから出力される解析結果をもとに、腫瘍領域と、非腫瘍領域と、非
組織領域(背景)とに分類し、解析処理により得られた腫瘍領域を白で表示し、非腫瘍領
域をグレーで表示し、非組織領域を黒で表示するように処理した。解析結果を図19に示
す。
[Analysis result]
Create analysis data with a window size of 200 × 200 pixels from the analysis target data,
The data for analysis was input to a trained neural network corresponding to the enlargement magnification. Based on the analysis results output from the neural network, the tumor area, non-tumor area, and non-tissue area (background) are classified. were processed to display in gray and non-tissue areas in black. The analysis results are shown in FIG.
図19中、(a)は、胃がん組織をHE染色して撮像した明視野画像のホールスライド
イメージであり、解析対象の画像である。(b)は、ホールスライドイメージの腫瘍領域
を病理医が指定し実線で囲った像である。(c)は、拡大倍率1倍の訓練用画像と解析用
画像を用いた解析結果を示す。病理医が指定した各領域を正確に示すことはできなかった
。(d)は、拡大倍率5倍の訓練用画像と解析用画像を用いた解析結果を示す。病理医が
指定した腫瘍領域を腫瘍領域として概ね判別することができた。また、病理医が指定した
非腫瘍領域を非腫瘍領域として概ね判別することができた。病理医が指定した非組織領域
を非組織領域として概ね判別することができた。(e)は、拡大倍率40倍の訓練用画像
と解析用画像を用いた解析結果を示す。病理医が指定した腫瘍領域を腫瘍領域としてある
程度判別することができた。しかし、病理医が非腫瘍領域と指定した領域において、腫瘍
領域と判定される領域が増えており、非腫瘍領域を腫瘍領域と誤判定する割合が高くなっ
ていた。
In FIG. 19, (a) is a whole slide image of a bright-field image obtained by HE-staining gastric cancer tissue, which is an image to be analyzed. (b) is an image in which the pathologist designates the tumor region of the whole slide image and encloses it with a solid line. (c) shows the analysis result using the training image and the analysis image with a magnification of 1×. Each region specified by the pathologist could not be pinpointed. (d) shows the analysis results using the training image and the analysis image with a magnification of 5 times. The tumor area specified by the pathologist could be roughly discriminated as the tumor area. In addition, the non-tumor area designated by the pathologist could be generally discriminated as the non-tumor area. The non-tissue area designated by the pathologist could be generally discriminated as the non-tissue area. (e) shows the analysis results using the training image and the analysis image with a magnification of 40 times. The tumor area designated by the pathologist could be discriminated to some extent as the tumor area. However, in the regions designated as non-tumor regions by pathologists, the regions that were determined to be tumor regions increased, and the rate of erroneous determination of non-tumor regions as tumor regions increased.
以上の結果から、訓練用画像および解析用画像を取得する際の拡大倍率は低すぎても高
すぎても誤判定の原因となることが示された。
From the above results, it was shown that too low or too high enlargement magnification when acquiring training images and analysis images causes misjudgment.
図20中、(a)は、図19とは異なる胃がん組織をHE染色して撮像した明視野画像
のホールスライドイメージであり、解析対象の画像である。(b)は、ホールスライドイ
メージの腫瘍領域を病理医が指定し実線で囲った像である。(c)は、拡大倍率5倍の訓
練用画像と解析用画像を用いた解析結果を示す。病理医が指定した腫瘍領域を腫瘍領域と
して概ね判別することができた。また、病理医が指定した非腫瘍領域を非腫瘍領域として
概ね判別することができた。病理医が指定した非組織領域を非組織領域として概ね判別す
ることができた。(d)は、拡大倍率20倍の訓練用画像と解析用画像を用いた解析結果
を示す。拡大倍率5倍の場合と同様に、病理医が指定した各領域を概ね判別することがで
きた。
In FIG. 20, (a) is a whole slide image of a bright-field image of a gastric cancer tissue different from that in FIG. (b) is an image in which the pathologist designates the tumor region of the whole slide image and encloses it with a solid line. (c) shows the analysis results using the training image and the analysis image with a magnification of 5 times. The tumor area specified by the pathologist could be roughly discriminated as the tumor area. In addition, the non-tumor area designated by the pathologist could be generally discriminated as the non-tumor area. The non-tissue area designated by the pathologist could be generally discriminated as the non-tissue area. (d) shows the analysis results using the training image and the analysis image with a magnification of 20 times. As in the case of 5x magnification, each region specified by the pathologist could be roughly identified.
拡大倍率5倍の解析用画像について、下式にしたがって、ホールスライドイメージ1枚
に存在する組織領域における腫瘍領域の含有率を算出した。
Regarding the image for analysis with a magnification of 5 times, the content rate of the tumor area in the tissue area present in one whole slide image was calculated according to the following formula.
腫瘍領域の含有率(%)={[腫瘍領域と判定された画素数]/[(腫瘍領域と判定さ
れた画素数)+(非腫瘍領域と判定された画素数)]}×100
Content rate of tumor region (%) = {[number of pixels determined to be tumor region]/[(number of pixels determined to be tumor region) + (number of pixels determined to be non-tumor region)]} x 100
腫瘍領域の含有率は54.5%であった。 The tumor area content was 54.5%.
また、図21に各拡大倍率の感度(a)および陽性的中率(b)を示す。この結果から
、訓練用画像および解析用画像を取得する際の組織標本の拡大倍率は、5から20倍が適
切であると考えられた。また、図21にウィンドウサイズの画素数の違いによる感度(c
)および陽性的中率(d)の変化を示す。解析用画像は拡大倍率5倍で撮像した。ウィン
ドウサイズの画素数は、125×125画素から200×200画素が好ましいと考えら
れた。
In addition, FIG. 21 shows the sensitivity (a) and positive predictive value (b) for each magnification. From this result, it was considered that the appropriate magnification of the tissue sample when acquiring the training image and the analysis image is 5 to 20 times. Also, FIG. 21 shows the sensitivity (c
) and changes in positive predictive value (d). Images for analysis were taken at a magnification of 5 times. The number of pixels of the window size was considered to be preferably 125×125 pixels to 200×200 pixels.
今回1枚のホールスライドイメージの解析時間は、数分~30分程度であった。 This time, the analysis time for one whole slide image was about several minutes to 30 minutes.
10(10A,10B) 処理部
20(20A,20B,20C) 処理部
11,21 CPU
12,22 メモリ
13,23 記録部
14,24 バス
15,25 インタフェース部
16,26 入力部
17,27 出力部
19,29 GPU
50 ニューラルネットワーク(深層学習アルゴリズム)
50a 入力層
50b 出力層
50c 中間層
60 学習済みのニューラルネットワーク(学習済みの深層学習アルゴリズム)
60a 入力層
60b 出力層
60c 中間層
70W1 ホールスライドイメージ
70W2 ホールスライドイメージ
70W3 ホールスライドイメージ
70R1L 第1の予備訓練データ
70R2L 第2の予備訓練データ
70R3L 第3の予備訓練データ
72R1r,72R1g,72R1b 色濃度符号化図
72R2r,72R2g,72R2b 色濃度符号化図
72R3r,72R3g,72R3b 色濃度符号化図
74R1,74R2,74R3 訓練データ
75R1,75R2, 75R3 ウィンドウサイズの訓練データ
76 色濃度値
77R1,77R2,77R3 真値像のラベル値
78 解析対象の明視野画像
79r,79g,79b 解析対象の色濃度符号化図
80 解析用データ
81 色濃度値
82 判別結果(画素の推定値)
83 解析結果の3値画像
84 領域強調画像
89(89a,89b) ノード
98 記録媒体
99 ネットワーク
100 ベンダ側装置
100A 深層学習装置
100B 統合型の画像解析装置
101 訓練データ生成部
102 訓練データ入力部
103 アルゴリズム更新部
104 ウィンドウサイズデータベース
105 アルゴリズムデータベース
200 ユーザ側装置
200A 画像解析装置
200B 統合型の画像解析装置
200C 端末装置
201 解析用データ生成部
202 解析用データ入力部
203 解析部
204 領域検出部
300,400 撮像装置
301,401 撮像素子
308,408 試料組織
309,409 ステージ
W1 ウィンドウ
W2 ウィンドウ
10 (10A, 10B) Processing unit 20 (20A, 20B, 20C)
12, 22
50 Neural Networks (Deep Learning Algorithms)
83 ternary image of
Claims (21)
解析対象の組織を含む解析対象画像から解析対象データを生成し、解析対象データから複数の画素からなる複数の画素領域を切り出し、切り出した画素領域のそれぞれについて解析用データを生成し、
前記解析用データのそれぞれを、前記深層学習アルゴリズムに入力し、
前記深層学習アルゴリズムによって、前記画素領域が腫瘍領域であるか否かを示すデータを生成する、
ことを含み、
前記画素領域の前記画素の数は、前記解析対象の組織の種別に応じて設定されている
、
画像解析方法。 An image analysis method for analyzing an image of tissue using a deep learning algorithm with a neural network structure,
generating analysis target data from an analysis target image including the analysis target tissue, cutting out a plurality of pixel regions each composed of a plurality of pixels from the analysis target data, generating analysis data for each of the cut out pixel regions,
inputting each of the analysis data into the deep learning algorithm;
generating data indicating whether the pixel region is a tumor region by the deep learning algorithm;
including
The number of pixels in the pixel region is set according to the type of tissue to be analyzed,
Image analysis method.
請求項1または2の画像解析方法。 The image to be analyzed is an image of a specimen for tissue diagnosis, and the image to be analyzed contains a hue obtained by combining two or more primary colors.
3. The image analysis method according to claim 1 or 2.
請求項1乃至3のいずれか1項の画像解析方法。 The image to be analyzed is an image captured by enlarging the tissue to be analyzed from 3 to 20 times.
The image analysis method according to any one of claims 1 to 3.
請求項1乃至4のいずれか1項の画像解析方法。 The pixel area is square, and the size of the pixel area is 200 μm×200 μm or more and 400 μm×400 μm or less.
The image analysis method according to any one of claims 1 to 4.
請求項1乃至5のいずれか1項の画像解析方法。 generating data indicating a boundary between a tumor cell area and other areas based on data indicating whether the pixel area is a tumor area;
The image analysis method according to any one of claims 1 to 5.
請求項1乃至6のいずれか1項の画像解析方法。 generating data indicating a content rate of the tumor region in the tissue to be analyzed based on data indicating whether the pixel region is a tumor region;
The image analysis method according to any one of claims 1 to 6.
請求項1乃至6のいずれか1項の画像解析方法。 generating data indicating a ratio of a tumor area to a non-tumor area in the tissue to be analyzed based on data indicating whether the pixel area is a tumor area;
The image analysis method according to any one of claims 1 to 6.
請求項1乃至8のいずれか1項の画像解析方法。 The number of nodes in the input layer of the neural network corresponds to the product of the number of pixels in the pixel region and the number of primary colors of each pixel.
The image analysis method according to any one of claims 1 to 8.
請求項3乃至9のいずれか1項の画像解析方法。 The specimen is a stained specimen, and the image to be analyzed is an image of the stained specimen captured under a bright field of a microscope.
The image analysis method according to any one of claims 3 to 9.
請求項1乃至10のいずれか1項の画像解析方法。 The training data used for learning the deep learning algorithm is a stained image of a specimen prepared by staining a tissue specimen containing a tumor region collected from an individual for bright field observation under a bright field of a microscope. generated based on the captured bright field image,
The image analysis method according to any one of claims 1 to 10.
請求項11の画像解析方法。 The staining for bright field observation uses hematoxylin for nuclear staining,
The image analysis method according to claim 11.
請求項11の画像解析方法。 The staining for bright field observation is hematoxylin and eosin staining,
The image analysis method according to claim 11.
請求項11乃至13のいずれか1項の画像解析方法。 The training data includes a label value indicating a tumor region determined from the bright field image.
The image analysis method according to any one of claims 11 to 13.
請求項14の画像解析方法。 wherein the training data includes the label value for each region of a predetermined number of pixels of the bright-field image;
15. The image analysis method according to claim 14.
請求項1乃至16のいずれか1項の画像解析方法。 The output layer of the neural network is a node with a softmax function as an activation function,
17. The image analysis method according to any one of claims 1 to 16.
請求項1乃至17のいずれか1項の画像解析方法。 The deep learning algorithm generates data indicating whether the pixel region is a tumor region each time the analysis data is input.
18. The image analysis method according to any one of claims 1 to 17.
請求項1乃至18のいずれか1項の画像解析方法。 Furthermore, the analysis data is processed using the deep learning algorithm corresponding to the type of the tissue to be analyzed, which is selected from among the plurality of deep learning algorithms according to the type of the tissue.
19. The image analysis method according to any one of claims 1 to 18.
解析対象の組織を含む解析対象画像から解析対象データを生成し、解析対象データから切り出した複数の画素からなる複数の画素領域を切り出し、切り出した画素領域のそれぞれについて解析用データを生成し、
前記解析用データのそれぞれを、前記深層学習アルゴリズムに入力し、
前記深層学習アルゴリズムによって、前記画素領域が腫瘍領域であるか否かを示すデータを生成する処理部、
を備え、
前記画素領域の前記画素の数は、前記解析対象の組織の種別に応じて設定されている、
画像解析装置。 An image analysis device that analyzes an image of a tissue using a deep learning algorithm with a neural network structure,
generating analysis target data from an analysis target image including the analysis target tissue, cutting out a plurality of pixel regions composed of a plurality of pixels cut out from the analysis target data, generating analysis data for each of the cut out pixel regions,
inputting each of the analysis data into the deep learning algorithm;
a processing unit that generates data indicating whether the pixel region is a tumor region by the deep learning algorithm;
with
The number of pixels in the pixel region is set according to the type of tissue to be analyzed,
Image analysis device.
コンピュータに、
解析対象の組織を含む解析対象画像から解析対象データを生成し、解析対象データから複数の画素からなる複数の画素領域を切り出し、切り出した画素領域のそれぞれについて解析用データを生成する処理と、
前記解析用データのそれぞれを、前記深層学習アルゴリズムに入力する処理と、
前記深層学習アルゴリズムによって、前記画素領域が腫瘍領域であるか否かを示すデータを生成する処理と、を実行させ、
前記画素領域の前記画素の数は、前記解析対象の組織の種別に応じて設定されている、
コンピュータプログラム。 A computer program for analyzing images of tissue using a deep learning algorithm of neural network architecture, comprising:
to the computer,
A process of generating analysis target data from an analysis target image including an analysis target tissue, cutting out a plurality of pixel regions each composed of a plurality of pixels from the analysis target data, and generating analysis data for each of the cut out pixel regions;
A process of inputting each of the analysis data into the deep learning algorithm;
a process of generating data indicating whether the pixel region is a tumor region by the deep learning algorithm;
The number of pixels in the pixel region is set according to the type of tissue to be analyzed,
computer program.
Priority Applications (2)
| Application Number | Priority Date | Filing Date | Title |
|---|---|---|---|
| JP2023008540A JP7458519B2 (en) | 2018-02-27 | 2023-01-24 | Image analysis method, image analysis device, program, method for producing trained deep learning algorithm, and trained deep learning algorithm |
| JP2024004675A JP2024038396A (en) | 2018-02-27 | 2024-01-16 | Image analysis method, image analysis device, and program |
Applications Claiming Priority (2)
| Application Number | Priority Date | Filing Date | Title |
|---|---|---|---|
| JP2018032761A JP7217589B2 (en) | 2018-02-27 | 2018-02-27 | Image analysis method, image analysis device, program, method for manufacturing trained deep learning algorithm, and trained deep learning algorithm |
| JP2023008540A JP7458519B2 (en) | 2018-02-27 | 2023-01-24 | Image analysis method, image analysis device, program, method for producing trained deep learning algorithm, and trained deep learning algorithm |
Related Parent Applications (1)
| Application Number | Title | Priority Date | Filing Date |
|---|---|---|---|
| JP2018032761A Division JP7217589B2 (en) | 2018-02-27 | 2018-02-27 | Image analysis method, image analysis device, program, method for manufacturing trained deep learning algorithm, and trained deep learning algorithm |
Related Child Applications (1)
| Application Number | Title | Priority Date | Filing Date |
|---|---|---|---|
| JP2024004675A Division JP2024038396A (en) | 2018-02-27 | 2024-01-16 | Image analysis method, image analysis device, and program |
Publications (2)
| Publication Number | Publication Date |
|---|---|
| JP2023065352A true JP2023065352A (en) | 2023-05-12 |
| JP7458519B2 JP7458519B2 (en) | 2024-03-29 |
Family
ID=67850414
Family Applications (3)
| Application Number | Title | Priority Date | Filing Date |
|---|---|---|---|
| JP2018032761A Active JP7217589B2 (en) | 2018-02-27 | 2018-02-27 | Image analysis method, image analysis device, program, method for manufacturing trained deep learning algorithm, and trained deep learning algorithm |
| JP2023008540A Active JP7458519B2 (en) | 2018-02-27 | 2023-01-24 | Image analysis method, image analysis device, program, method for producing trained deep learning algorithm, and trained deep learning algorithm |
| JP2024004675A Pending JP2024038396A (en) | 2018-02-27 | 2024-01-16 | Image analysis method, image analysis device, and program |
Family Applications Before (1)
| Application Number | Title | Priority Date | Filing Date |
|---|---|---|---|
| JP2018032761A Active JP7217589B2 (en) | 2018-02-27 | 2018-02-27 | Image analysis method, image analysis device, program, method for manufacturing trained deep learning algorithm, and trained deep learning algorithm |
Family Applications After (1)
| Application Number | Title | Priority Date | Filing Date |
|---|---|---|---|
| JP2024004675A Pending JP2024038396A (en) | 2018-02-27 | 2024-01-16 | Image analysis method, image analysis device, and program |
Country Status (1)
| Country | Link |
|---|---|
| JP (3) | JP7217589B2 (en) |
Families Citing this family (13)
| Publication number | Priority date | Publication date | Assignee | Title |
|---|---|---|---|---|
| JP7350595B2 (en) | 2019-10-01 | 2023-09-26 | キヤノンメディカルシステムズ株式会社 | Image processing device, medical image diagnostic device, and image processing program |
| KR102408405B1 (en) * | 2020-03-19 | 2022-06-15 | 주식회사 아이도트 | System for diagnosing the carotid artery |
| WO2021187699A1 (en) * | 2020-03-19 | 2021-09-23 | 주식회사 아이도트 | Carotid ultrasound diagnosis system |
| JPWO2022049663A1 (en) * | 2020-09-02 | 2022-03-10 | ||
| CN112019827B (en) * | 2020-09-02 | 2022-01-25 | 上海网达软件股份有限公司 | Method, device, equipment and storage medium for enhancing video image color |
| KR102250219B1 (en) * | 2020-09-15 | 2021-05-11 | 주식회사 아이도트 | Ultrasound diagnostic system |
| KR20220042558A (en) * | 2020-09-28 | 2022-04-05 | 주식회사 딥바이오 | Method for displaying diagnosis result of pathological image and computing system performing the same |
| KR102499143B1 (en) * | 2020-11-27 | 2023-02-14 | (의)삼성의료재단 | Measurement method of intima-media thickness of artery and device therefore |
| KR20220093017A (en) * | 2020-12-24 | 2022-07-05 | (주)제이엘케이 | Prostate cancer pathological images report system based on artificial intelligence |
| KR102316525B1 (en) * | 2021-03-08 | 2021-10-22 | 주식회사 딥바이오 | Method for training artificial neural network for detecting prostate cancer from TURP pathological image, and computing system performing the same |
| KR102354476B1 (en) * | 2021-03-15 | 2022-01-21 | 주식회사 딥바이오 | Providing method and system for diagnosing lesions of bladder |
| KR102485414B1 (en) * | 2021-12-13 | 2023-01-06 | 주식회사 딥바이오 | Method for training artificial neural network providing result of diagnosis for pathological specimen, and computing system performing the same |
| JP2023176256A (en) * | 2022-05-31 | 2023-12-13 | 楽天グループ株式会社 | Method, computer system, and computer-readable medium for predicting data from image |
Citations (5)
| Publication number | Priority date | Publication date | Assignee | Title |
|---|---|---|---|---|
| JP2005509978A (en) * | 2001-11-16 | 2005-04-14 | チェン,ユアン,ヤン | Ambiguous neural network with supervised and unsupervised cluster analysis |
| JP2012073179A (en) * | 2010-09-29 | 2012-04-12 | Dainippon Screen Mfg Co Ltd | Pathological diagnosis support device, pathological diagnosis support method, control program for pathological diagnosis support and recording medium with control program recorded thereon |
| JP2017510792A (en) * | 2014-01-28 | 2017-04-13 | ベンタナ メディカル システムズ, インコーポレイテッド | Adaptive classification for total slide tissue segmentation |
| JP2017516992A (en) * | 2014-05-23 | 2017-06-22 | ベンタナ メディカル システムズ, インコーポレイテッド | System and method for detection of biological structures and / or patterns in images |
| WO2017150194A1 (en) * | 2016-03-04 | 2017-09-08 | コニカミノルタ株式会社 | Image processing device, image processing method, and program |
Family Cites Families (6)
| Publication number | Priority date | Publication date | Assignee | Title |
|---|---|---|---|---|
| WO2010003044A2 (en) * | 2008-07-03 | 2010-01-07 | Nec Laboratories America, Inc. | Epithelial layer detector and related methods |
| JP5321145B2 (en) * | 2009-03-04 | 2013-10-23 | 日本電気株式会社 | Image diagnosis support apparatus, image diagnosis support method, image diagnosis support program, and storage medium thereof |
| JP2017045430A (en) * | 2015-08-28 | 2017-03-02 | パナソニックIpマネジメント株式会社 | Image processing device, image processing system, image processing method and program |
| WO2017201540A1 (en) * | 2016-05-20 | 2017-11-23 | Techcyte, Inc. | Machine learning classification of particles or substances in digital microscopy images |
| CA3021481A1 (en) * | 2016-07-29 | 2018-02-01 | Novadaq Technologies ULC | Methods and systems for characterizing tissue of a subject utilizing machine learning |
| JP7076698B2 (en) * | 2017-11-17 | 2022-05-30 | 国立研究開発法人国立がん研究センター | Image analysis method, image analysis device, program, learned deep learning algorithm manufacturing method and learned deep learning algorithm |
-
2018
- 2018-02-27 JP JP2018032761A patent/JP7217589B2/en active Active
-
2023
- 2023-01-24 JP JP2023008540A patent/JP7458519B2/en active Active
-
2024
- 2024-01-16 JP JP2024004675A patent/JP2024038396A/en active Pending
Patent Citations (5)
| Publication number | Priority date | Publication date | Assignee | Title |
|---|---|---|---|---|
| JP2005509978A (en) * | 2001-11-16 | 2005-04-14 | チェン,ユアン,ヤン | Ambiguous neural network with supervised and unsupervised cluster analysis |
| JP2012073179A (en) * | 2010-09-29 | 2012-04-12 | Dainippon Screen Mfg Co Ltd | Pathological diagnosis support device, pathological diagnosis support method, control program for pathological diagnosis support and recording medium with control program recorded thereon |
| JP2017510792A (en) * | 2014-01-28 | 2017-04-13 | ベンタナ メディカル システムズ, インコーポレイテッド | Adaptive classification for total slide tissue segmentation |
| JP2017516992A (en) * | 2014-05-23 | 2017-06-22 | ベンタナ メディカル システムズ, インコーポレイテッド | System and method for detection of biological structures and / or patterns in images |
| WO2017150194A1 (en) * | 2016-03-04 | 2017-09-08 | コニカミノルタ株式会社 | Image processing device, image processing method, and program |
Non-Patent Citations (1)
| Title |
|---|
| "深層学習を用いた病理組織画像からの乳癌診断", 電子情報通信学会技術研究報告 VOL.117 NO.50, JPN6023047599, 18 May 2017 (2017-05-18), ISSN: 0005201853 * |
Also Published As
| Publication number | Publication date |
|---|---|
| JP7458519B2 (en) | 2024-03-29 |
| JP2019148473A (en) | 2019-09-05 |
| JP7217589B2 (en) | 2023-02-03 |
| JP2024038396A (en) | 2024-03-19 |
Similar Documents
| Publication | Publication Date | Title |
|---|---|---|
| JP7217589B2 (en) | Image analysis method, image analysis device, program, method for manufacturing trained deep learning algorithm, and trained deep learning algorithm | |
| JP7198577B2 (en) | Image analysis method, device, program, and method for manufacturing trained deep learning algorithm | |
| JP7076698B2 (en) | Image analysis method, image analysis device, program, learned deep learning algorithm manufacturing method and learned deep learning algorithm | |
| JP7137935B2 (en) | Image analysis method, image analysis device, program, method for manufacturing trained deep learning algorithm, and trained deep learning algorithm | |
| CN109791693B (en) | Digital pathology system and related workflow for providing visualized whole-slice image analysis | |
| JP4376058B2 (en) | Quantitative video microscopy and related systems and computer software program products | |
| JP2023061956A (en) | Image analysis method, device, computer program, and method for producing deep learning algorithms | |
| JP5822425B2 (en) | Method for staining samples for microscopic images | |
| JP4550415B2 (en) | Quantitative video microscopy and related system and computer software program products | |
| CN108288506A (en) | A kind of cancer pathology aided diagnosis method based on artificial intelligence technology | |
| US20050265588A1 (en) | Method and system for digital image based flourescent in situ hybridization (FISH) analysis | |
| WO2017221592A1 (en) | Image processing device, image processing method, and image processing program | |
| CN111656393A (en) | Histological image analysis | |
| CN110838094B (en) | Pathological section dyeing style conversion method and electronic equipment | |
| EP3719739B1 (en) | Image coloring device, image coloring method, image learning device, image learning method, program, and image coloring system | |
| CN112703531A (en) | Generating annotation data for tissue images | |
| JPWO2019171909A1 (en) | Image processing method, image processing device and program | |
| JP5910637B2 (en) | Biological image analysis system, biological image analysis method, and biological image analysis program | |
| Shu et al. | Biomarker detection in whole slide imaging based on statistical color models | |
| CN117975453A (en) | Image analysis method, device, program and method for manufacturing deep learning algorithm after learning |
Legal Events
| Date | Code | Title | Description |
|---|---|---|---|
| A621 | Written request for application examination |
Free format text: JAPANESE INTERMEDIATE CODE: A621 Effective date: 20230124 |
|
| RD04 | Notification of resignation of power of attorney |
Free format text: JAPANESE INTERMEDIATE CODE: A7424 Effective date: 20230927 |
|
| RD02 | Notification of acceptance of power of attorney |
Free format text: JAPANESE INTERMEDIATE CODE: A7422 Effective date: 20231004 |
|
| A977 | Report on retrieval |
Free format text: JAPANESE INTERMEDIATE CODE: A971007 Effective date: 20231113 |
|
| A131 | Notification of reasons for refusal |
Free format text: JAPANESE INTERMEDIATE CODE: A131 Effective date: 20231121 |
|
| A521 | Request for written amendment filed |
Free format text: JAPANESE INTERMEDIATE CODE: A523 Effective date: 20240116 |
|
| TRDD | Decision of grant or rejection written | ||
| A01 | Written decision to grant a patent or to grant a registration (utility model) |
Free format text: JAPANESE INTERMEDIATE CODE: A01 Effective date: 20240227 |
|
| A61 | First payment of annual fees (during grant procedure) |
Free format text: JAPANESE INTERMEDIATE CODE: A61 Effective date: 20240318 |
|
| R150 | Certificate of patent or registration of utility model |
Ref document number: 7458519 Country of ref document: JP Free format text: JAPANESE INTERMEDIATE CODE: R150 |