JP2022013409A - Relationship estimation system - Google Patents
Relationship estimation system Download PDFInfo
- Publication number
- JP2022013409A JP2022013409A JP2020115945A JP2020115945A JP2022013409A JP 2022013409 A JP2022013409 A JP 2022013409A JP 2020115945 A JP2020115945 A JP 2020115945A JP 2020115945 A JP2020115945 A JP 2020115945A JP 2022013409 A JP2022013409 A JP 2022013409A
- Authority
- JP
- Japan
- Prior art keywords
- relationship
- time
- series data
- nodes
- attributes
- Prior art date
- Legal status (The legal status is an assumption and is not a legal conclusion. Google has not performed a legal analysis and makes no representation as to the accuracy of the status listed.)
- Pending
Links
- 230000001364 causal effect Effects 0.000 claims abstract description 59
- 239000000284 extract Substances 0.000 claims abstract description 11
- 230000000694 effects Effects 0.000 claims abstract description 9
- 238000012545 processing Methods 0.000 claims description 99
- 230000008859 change Effects 0.000 description 21
- 230000035622 drinking Effects 0.000 description 14
- 230000004622 sleep time Effects 0.000 description 11
- 238000004891 communication Methods 0.000 description 9
- 230000036541 health Effects 0.000 description 9
- 230000003860 sleep quality Effects 0.000 description 6
- 230000002354 daily effect Effects 0.000 description 5
- 230000003796 beauty Effects 0.000 description 3
- 238000000034 method Methods 0.000 description 3
- 241000282412 Homo Species 0.000 description 2
- 230000036772 blood pressure Effects 0.000 description 2
- 238000013075 data extraction Methods 0.000 description 2
- 230000003111 delayed effect Effects 0.000 description 2
- 230000007613 environmental effect Effects 0.000 description 2
- 230000003203 everyday effect Effects 0.000 description 2
- 238000005259 measurement Methods 0.000 description 2
- 230000007246 mechanism Effects 0.000 description 2
- 238000012986 modification Methods 0.000 description 2
- 230000004048 modification Effects 0.000 description 2
- 230000035764 nutrition Effects 0.000 description 2
- 235000016709 nutrition Nutrition 0.000 description 2
- 230000002618 waking effect Effects 0.000 description 2
- 230000001133 acceleration Effects 0.000 description 1
- 238000004140 cleaning Methods 0.000 description 1
- 238000001514 detection method Methods 0.000 description 1
- 238000010586 diagram Methods 0.000 description 1
- 230000037213 diet Effects 0.000 description 1
- 235000005911 diet Nutrition 0.000 description 1
- 230000006870 function Effects 0.000 description 1
- 230000005484 gravity Effects 0.000 description 1
- 230000002650 habitual effect Effects 0.000 description 1
- 238000012905 input function Methods 0.000 description 1
- 230000037081 physical activity Effects 0.000 description 1
- 230000008569 process Effects 0.000 description 1
- 230000009933 reproductive health Effects 0.000 description 1
- 238000011160 research Methods 0.000 description 1
- 208000024891 symptom Diseases 0.000 description 1
- 238000012360 testing method Methods 0.000 description 1
- 238000005406 washing Methods 0.000 description 1
Images


Classifications
-
- G—PHYSICS
- G06—COMPUTING; CALCULATING OR COUNTING
- G06F—ELECTRIC DIGITAL DATA PROCESSING
- G06F16/00—Information retrieval; Database structures therefor; File system structures therefor
- G06F16/90—Details of database functions independent of the retrieved data types
- G06F16/904—Browsing; Visualisation therefor
-
- G—PHYSICS
- G16—INFORMATION AND COMMUNICATION TECHNOLOGY [ICT] SPECIALLY ADAPTED FOR SPECIFIC APPLICATION FIELDS
- G16H—HEALTHCARE INFORMATICS, i.e. INFORMATION AND COMMUNICATION TECHNOLOGY [ICT] SPECIALLY ADAPTED FOR THE HANDLING OR PROCESSING OF MEDICAL OR HEALTHCARE DATA
- G16H40/00—ICT specially adapted for the management or administration of healthcare resources or facilities; ICT specially adapted for the management or operation of medical equipment or devices
- G16H40/60—ICT specially adapted for the management or administration of healthcare resources or facilities; ICT specially adapted for the management or operation of medical equipment or devices for the operation of medical equipment or devices
- G16H40/67—ICT specially adapted for the management or administration of healthcare resources or facilities; ICT specially adapted for the management or operation of medical equipment or devices for the operation of medical equipment or devices for remote operation
-
- G—PHYSICS
- G06—COMPUTING; CALCULATING OR COUNTING
- G06F—ELECTRIC DIGITAL DATA PROCESSING
- G06F16/00—Information retrieval; Database structures therefor; File system structures therefor
- G06F16/20—Information retrieval; Database structures therefor; File system structures therefor of structured data, e.g. relational data
- G06F16/28—Databases characterised by their database models, e.g. relational or object models
- G06F16/284—Relational databases
- G06F16/288—Entity relationship models
-
- G—PHYSICS
- G16—INFORMATION AND COMMUNICATION TECHNOLOGY [ICT] SPECIALLY ADAPTED FOR SPECIFIC APPLICATION FIELDS
- G16H—HEALTHCARE INFORMATICS, i.e. INFORMATION AND COMMUNICATION TECHNOLOGY [ICT] SPECIALLY ADAPTED FOR THE HANDLING OR PROCESSING OF MEDICAL OR HEALTHCARE DATA
- G16H10/00—ICT specially adapted for the handling or processing of patient-related medical or healthcare data
- G16H10/60—ICT specially adapted for the handling or processing of patient-related medical or healthcare data for patient-specific data, e.g. for electronic patient records
Abstract
Description
本発明は、人の身体または活動に関する属性の時系列データに基づいて、該人にとって意味のある属性の関係性を推定する関係性推定システムに関するものである。 The present invention relates to a relationship estimation system that estimates relationships of attributes that are meaningful to a person based on time-series data of attributes related to the person's body or activity.
近年、パンデミック対策のための体調管理ニーズや健康ブームと相まって、人の体内の状態変化を収集して視覚化することにより、自分自身の体内の状態変化を意識しながら健康や美容の維持に役立てることが注目されている。 In recent years, in combination with physical condition management needs for pandemic countermeasures and health boom, by collecting and visualizing changes in the state of the human body, it helps to maintain health and beauty while being aware of the changes in the state inside the body. Is attracting attention.
特に最近では、人の身体に身に着ける眼鏡型、腕時計型、リストバンド型などの様々なウェアラブルデバイスが登場しており、日常生活においてそれらを着用しているだけで、デバイスが搭載しているセンサにより人の体内の状態変化を収集して、その状態変化をデバイス自身またはスマートフォンを通じて視覚化するアプリケーションも提供されている。 Especially recently, various wearable devices such as eyeglasses, wristwatches, and wristbands that can be worn on the human body have appeared, and the devices are equipped with them just by wearing them in daily life. There is also an application that collects state changes in the human body with sensors and visualizes the state changes through the device itself or a smartphone.
ところが、このようにウェアラブルデバイスと連携し、スマートフォン上で健康情報や美容情報の管理ができるようになったが、スマートフォン上でデータ管理できるのは歩数のみの情報であったり、心拍数のみの情報であったり、あるいは血圧のみの情報であったりと、単体の情報ばかりであり、複合的に管理することが少なかった。 However, in this way, it has become possible to manage health information and beauty information on smartphones in cooperation with wearable devices, but data can be managed on smartphones only for steps or heart rate. It was only information on a single basis, such as information on blood pressure only, or information on only blood pressure, and it was rarely managed in a complex manner.
そこで、複数のウェアラブルデバイスから取得できる身体の活動情報を一元管理する仕組みとして、Android端末には「Google Fit(登録商標)」、iOS端末には「ヘルスケア」という健康管理の仕組みが用意されている。 Therefore, as a mechanism to centrally manage physical activity information that can be acquired from multiple wearable devices, a health management mechanism called "Google Fit (registered trademark)" for Android terminals and "health care" for iOS terminals is prepared. There is.
例えば、「Google Fit」は、Google社が提供するフィットネスデータに関する情報をデバイスやアプリケーション利用者をまたいで、まとめて保存・参照することができる。また、「Google Fit」単体でもAndroid端末の位置情報や各種センサを用いて、アクティビティ情報、位置情報データ、身体測定値、栄養情報、睡眠情報を記録することができる。一方、「ヘルスケア」は、端末の位置情報や各種センサからアクティビティ情報、バイタル情報、身体測定値、リプロダクティブヘルス情報、検査結果、栄養情報、マインドフルネス、睡眠情報などを記録でき、サードパーティのアプリから「ヘルスケア」に記録されている情報の読み出しや保存が可能である。 For example, "Google Fit" can collectively store and refer to information on fitness data provided by Google Inc. across devices and application users. In addition, the "Google Fit" alone can record activity information, position information data, body measurement values, nutrition information, and sleep information by using the position information and various sensors of the Android terminal. On the other hand, "health care" can record activity information, vital information, body measurement values, reproductive health information, test results, nutrition information, mindfulness, sleep information, etc. from the position information of the terminal and various sensors, and is a third party. It is possible to read and save the information recorded in "Healthcare" from the app.
しかしながら、上述のようにウェアラブルデバイスや情報管理のシステムが数多く提供されているものの、それらが普及するには至っていないのが現状である。この普及しない原因としては、高額なウェアラブルデバイスを毎日身に着けてまで健康管理をする必然性を感じない人が多いことや、プライバシー保護などのセキュリティ面が十分に確保されていないことのほか、日々集積される膨大な数のデータからいかにして意味のあるデータを抽出するのかといった問題があるためである。特に人にとって意味のあるデータを抽出することができれば、その健康や美容に関するデータの活用の重要性は益々高まっていくものと考えられる。 However, although many wearable devices and information management systems are provided as described above, the current situation is that they have not become widespread. The reasons why this does not spread are that many people do not feel the need to manage their health by wearing expensive wearable devices every day, security aspects such as privacy protection are not sufficiently secured, and every day. This is because there is a problem of how to extract meaningful data from the huge amount of accumulated data. In particular, if data that is meaningful to humans can be extracted, it is thought that the importance of utilizing the data related to health and beauty will increase more and more.
本発明は、上述の問題に鑑みてなされたものであって、人の身体または活動に関する属性の時系列データに基づいて、該人にとって意味のある属性の関係性を推定することができる関係性推定システムを提供することを目的とする。 The present invention has been made in view of the above-mentioned problems, and is a relationship that can estimate the relationship of attributes that are meaningful to the person based on the time-series data of the attributes related to the person's body or activity. The purpose is to provide an estimation system.
本発明は、上記目的を達成するために、人の身体または活動に関する属性の時系列データを少なくとも含む、複数の属性の時系列データを取得するデータ取得部と、前記データ取得部により取得された各属性の時系列データ間の類似度を計算する時系列データ処理部と、前記データ取得部により取得された時系列データの属性をノードとして該ノードをリンクで接続した関係性グラフを生成し、前記時系列データ処理部により計算された属性の時系列データ間の類似度をノード間のリンクの重みの計算に利用する関係性グラフ生成部と、前記関係性グラフ生成部により生成された関係性グラフにおいて、総合的なリンクの重みが大きいノード間を抽出するノードデータ処理部と、前記ノードデータ処理部により抽出されたノード間に対応する属性間の関係性を推定する関係性推定部とを備えることを特徴とする。 In order to achieve the above object, the present invention is a data acquisition unit that acquires time-series data of a plurality of attributes including at least time-series data of attributes related to a person's body or activity, and is acquired by the data acquisition unit. A relationship graph is generated in which the time-series data processing unit that calculates the similarity between the time-series data of each attribute and the time-series data attributes acquired by the data acquisition unit are used as nodes and the nodes are connected by a link. The relationship graph generation unit that uses the similarity between the time-series data of the attributes calculated by the time-series data processing unit to calculate the weight of the link between the nodes, and the relationship generated by the relationship graph generation unit. In the graph, a node data processing unit that extracts nodes with a large overall link weight and a relationship estimation unit that estimates the relationship between the corresponding attributes between the nodes extracted by the node data processing unit. It is characterized by being prepared.
前記関係性グラフ生成部は、前記時系列データ処理部により計算された属性の時系列データ間の類似度をノード間のリンクの重みとして関係性グラフを生成してもよい。 The relationship graph generation unit may generate a relationship graph using the similarity between the time-series data of the attributes calculated by the time-series data processing unit as the weight of the link between the nodes.
また、前記ノードデータ処理部は、前記関係性グラフ生成部により生成された関係性グラフにおいて、ノード間ごとにリンクの重みが大きい複数の経路を算出して、各経路のリンクの重みに基づいて総合的なリンクの重みが大きいノード間を抽出するのが好ましい。 Further, the node data processing unit calculates a plurality of routes having a large link weight for each node in the relationship graph generated by the relationship graph generation unit, and based on the link weight of each route. It is preferable to extract between nodes with a large overall link weight.
また、前記ノードデータ処理部は、ノード間における経路ごとのリンクの重みを演算することにより、ノード間の総合的なリンクの重みを算出するのが好ましい。 Further, it is preferable that the node data processing unit calculates the total link weight between the nodes by calculating the link weight for each route between the nodes.
また、前記ノードデータ処理部は、ノード間における経路ごとのリンクの長さの逆数をリンクの重みとして加算することにより、ノード間の総合的なリンクの重みを算出するのが好ましい。 Further, it is preferable that the node data processing unit calculates the total weight of the link between the nodes by adding the reciprocal of the length of the link for each route between the nodes as the weight of the link.
また、属性の時系列データ間の相関を計算することにより、関係性グラフのノード間の因果関係を算定する因果関係処理部を備えるのが好ましい。 Further, it is preferable to provide a causal relationship processing unit for calculating the causal relationship between the nodes of the relationship graph by calculating the correlation between the time series data of the attribute.
また、前記因果関係処理部は、属性の時系列データ間の相関の正負の極性と時間のずれを計算するのが好ましい。 Further, it is preferable that the causal relationship processing unit calculates the positive / negative polarities of the correlation between the time-series data of the attributes and the time lag.
また、前記ノードデータ処理部は、前記因果関係処理部により算出されたノード間の因果関係に基づいて、関係性グラフにおける当該ノード間のリンクに向きを付するのが好ましい。 Further, it is preferable that the node data processing unit directs the link between the nodes in the relationship graph based on the causal relationship between the nodes calculated by the causal relationship processing unit.
また、前記関係性推定部は、前記因果関係処理部により算定されたノード間の因果関係に基づいて、当該ノード間に対応する属性間の関係性を推定するのが好ましい。 Further, it is preferable that the relationship estimation unit estimates the relationship between the attributes corresponding to the nodes based on the causal relationship between the nodes calculated by the causal relationship processing unit.
また、前記データ取得部は、外部のIotデバイスのセンサが計測した属性の時系列データ、外部のWebサービスの属性の時系列データ、および本システムが搭載された情報端末装置で計測または入力された属性の時系列データの少なくとも一つを含む時系列データを取得するのが好ましい。 Further, the data acquisition unit is measured or input by the time-series data of the attributes measured by the sensor of the external Iot device, the time-series data of the attributes of the external Web service, and the information terminal device equipped with this system. It is preferable to acquire time series data including at least one of the attribute time series data.
また、前記時系列データ処理部は、前記データ取得部により取得された各属性の時系列データを正規化するのが好ましい。 Further, it is preferable that the time-series data processing unit normalizes the time-series data of each attribute acquired by the data acquisition unit.
また、本発明は、上記の関係性推定システムが搭載されたことを特徴とする情報端末装置である。 Further, the present invention is an information terminal device equipped with the above-mentioned relationship estimation system.
また、本発明は、上記の複数の情報端末装置と、各情報端末装置とネットワークを介して接続されたサーバ装置とを備え、前記サーバ装置は、各情報端末装置から収集した属性の時系列データに基づいて関係性グラフを生成することを特徴とする関係性推定システムである。 Further, the present invention includes the above-mentioned plurality of information terminal devices and a server device connected to each information terminal device via a network, and the server device includes time-series data of attributes collected from each information terminal device. It is a relationship estimation system characterized by generating a relationship graph based on.
本発明によれば、人の身体または活動に関する属性の時系列データを収集して、属性の時系列データ間の類似度を計算し、属性をノード、類似度をリンクの重みとしてノードをリンクで接続した関係性グラフを生成したあと、該関係性グラフにおけるノード間の総合的なリンクの重みが大きいノード間を抽出して、該ノード間に対応する属性間の関係性を推定する。このため、関係性グラフのノード間において、類似度が計算された直接的なリンクの経路のみならず、他のノードを介した間接的なリンクの経路も含めた総合的なリンクの経路を考慮しながら、総合的なリンクの経路の重みが大きいノードを抽出することにより、人にとって意味のある属性間の関係性を精度良く推定することができる。 According to the present invention, time-series data of an attribute related to a person's body or activity is collected, the similarity between the time-series data of the attribute is calculated, the attribute is a node, and the similarity is a link weight, and the node is linked. After generating the connected relationship graph, the nodes having a large total link weight between the nodes in the relationship graph are extracted, and the relationship between the corresponding attributes between the nodes is estimated. Therefore, consider not only the direct link route for which the similarity is calculated between the nodes of the relationship graph, but also the comprehensive link route including the indirect link route via other nodes. However, by extracting the nodes with a large weight of the comprehensive link route, it is possible to accurately estimate the relationships between the attributes that are meaningful to humans.
次に、本発明に係る関係性推定システム(以下、本システムという)の実施形態について図面を参照しつつ説明する。 Next, an embodiment of the relationship estimation system (hereinafter referred to as the present system) according to the present invention will be described with reference to the drawings.
[本システムの全体構成]
本システムは、図1に示すように、スマートフォンやロボットなどのユーザの情報端末装置1と、各種属性の時系列データを計測するIoTデバイス2と、各種属性の時系列データを提供する外部Webサービス3と、各情報端末装置1の属性の時系列データを収集するサーバ装置4とを備え、情報端末装置1と、サーバ装置4、IoTデバイス2、あるいは外部Webサービス3とがインターネット等のネットワークを介して接続されている。
[Overall configuration of this system]
As shown in FIG. 1, this system includes an
前記IoTデバイス2は、ユーザ(人)の身体や活動に関する一ないし複数の種類の属性の時系列データ(ヘルスケアデータ、ライフログ)を計測するものであり、各属性の時系列データを計測するセンサ部21と、センサ部21により計測した各属性の時系列データを情報端末装置1に送信する通信部22とを備える。
The
このIoTデバイス2は、例えば、ユーザが身に着ける、眼鏡型、腕時計型、リスト型などのウェアラブルデバイスが挙げられる。また、センサは、カメラなどの2次元イメージセンサや、LIDAR(Light Detection and Ranging)などの3次元イメージセンサ、加速度センサの他、各種属性の時系列データを計測するあらゆるセンサが挙げられる。なお、IoTデバイス2で計測する属性の時系列データの種類については、後述の情報端末装置1の構成において説明する。
Examples of the
前記外部Webサービス3は、気候、環境、場所など、主に自然、社会、あるいは経済などの事象に関する一ないし複数の種類の属性の時系列データを収集して提供するものであり、収集した各属性の時系列データを情報端末装置1に送信する。この外部Webサービス3としては、例えば、気象データベース、海洋データベース、交通データベース、株式データベースなどが挙げられる。なお、外部Webサービス3が提供する属性の時系列データの種類については、後述の情報端末装置1の構成において説明する。
The
前記サーバ装置4は、多数のユーザの情報端末装置1から個人情報以外の各種属性の時系列データを受け取り、集約的な関係性グラフ(モデル)を生成するものであり、多数のユーザの各種属性の時系列データに基づいて関係性グラフ(モデル)を生成する学習部41と、関係性グラフ(モデル)や時系列データを記憶する記憶部42と、情報端末装置1と通信を行う通信部43とを備える。
The
例えば、各属性の時系列データに基づく関係性グラフを各個人で生成するのではなく、多数のユーザの各属性の時系列データの平均値に基づいて関係性グラフを生成する。これによれば、あるユーザの属性の時系列データが欠損している場合、平均的な関係性グラフを用いることで欠損を補償することができる。また、平均的な関係性グラフと個人の関係性グラフを比較することにより、一般とどれくらいかけ離れているかをユーザに提示することができる。 For example, instead of generating a relationship graph based on the time series data of each attribute for each individual, a relationship graph is generated based on the average value of the time series data of each attribute of a large number of users. According to this, when the time series data of the attribute of a certain user is missing, the loss can be compensated by using the average relation graph. Also, by comparing the average relationship graph with the individual relationship graph, it is possible to show the user how far they are from the general public.
[情報端末装置1の構成]
前記情報端末装置1は、スマートフォン、タブレット端末あるいはロボットなどのデバイスであって、図2に示すように、ユーザとのインターフェースとなるユーザインターフェース部11と、データの入出力を実行するデータ入出力部12と、各属性の時系列データを取得するデータ取得部13と、所定のアルゴリズムを処理するアルゴリズム処理部14と、各属性の時系列データや関係性グラフなどを記憶する記憶部15と、外部とネットワークを介して通信を実行する通信部16とを備える。なお、情報端末装置1は、内部のCPU等により所定のOSデータやアプリケーションデータを保存・実行する。
[Configuration of information terminal device 1]
The
前記ユーザインターフェース部11は、例えばスマートフォン等におけるディスプレイ画面であって、ユーザによる各種操作を行う入力機能と、ユーザに対して各種情報を提示する出力機能とを有する。
The
前記データ入出力部12は、前記ユーザインターフェース部11により入力された入力データをアルゴリズム処理部14に送信したり、アルゴリズム処理部14から得られた出力データをユーザインターフェース部11に送信したりする。
The data input /
前記データ取得部13は、端末外部または端末内部から各属性の時系列データを取得するものであり、第1のデータ取得部131、第2のデータ取得部132および第3のデータ取得部133を備える。
The
前記第1のデータ取得部131は、ウェアラブルデバイス等のIoTデバイス2で計測した各属性の時系列データを取得する。また、前記第2のデータ取得部132は、外部Webサービス3から各属性の時系列データを取得する。また、前記第3のデータ取得部133は、情報端末装置1のアプリケーションで計測または入力した各属性の時系列データを取得する。
The first
これら属性の時系列データとしては、図3に示すように、気候時系列、環境条件時系列、場所カテゴリカル、習慣カテゴリカル、習慣時系列、バイタルデータ時系列、体調カテゴリカルに属する各属性の時系列データが挙げられる。このうち、場所カテゴリカル、習慣カテゴリカル、習慣時系列、バイタルデータ時系列、体調カテゴリカルに関する属性の時系列データは、第1の取得部によりIoTデバイス2から取得される場合が多い。また、気候時系列、環境条件時系列の属性に関する時系列データは、第2のデータ取得部132により外部Webサービス3から取得される場合が多い。また、バイタルデータ時系列に関する属性の時系列データは、第3のデータ取得部133により情報端末装置1から取得される場合もある。但し、これらの各属性の時系列データの取得は一例であって、その他にも様々な種類の属性の時系列データを取得してもよい。
As the time series data of these attributes, as shown in FIG. 3, each attribute belonging to the climate time series, the environmental condition time series, the place categorical, the habit categorical, the habit time series, the vital data time series, and the physical condition categorical Time series data can be mentioned. Of these, time-series data of attributes related to location categorical, habit categorical, habit time-series, vital data time-series, and physical condition categorical are often acquired from the
また、特に前記第3のデータ取得部133は、情報端末装置1にインストールされたヘルスキット、カレンダ、外部天候データ、睡眠アプリ、ライフログアプリなどのアプリケーションにおいて、データ自動入力プラグインにより各属性の時系列データを自動的に取得したり、手入力により体調、運動、衛生、食事、場所、独自設定、メモなどに関する属性の時系列データを取得したりする。例えば、手入力により各属性の時系列データを取得する例として、図4に示すように、自分で1ルーチンの単位を設定して、0.5ルーチン、1.5ルーチンなどの単位で入力したり、ランチ、清掃、手洗いのように習慣の時間を入力したり、あるいは1日の体調(体調が悪い箇所がある場合には、その症状)を入力したりする。
In particular, the third
なお、本実施形態では、前記データ取得部13により取得される具体的な属性の時系列データとして、下記のものが挙げられる。
In this embodiment, the following can be mentioned as time-series data of specific attributes acquired by the
・asleep:睡眠時間
・temperature_min:当日の最低気温
・Efficiency :睡眠効率(睡眠時間/就寝~起床の時間)
・wakingBPM_diff:起床時の心拍数(Beats per minute)の日ごとの変化量(差分)
・quality :睡眠の質
・dayBPM:日中の心拍数(Beats per minute)
・wakingBPM:起床時の心拍数(Beats per minute)
・pressure_noon_diff:気圧の日ごとの変化量(差分)
・hrv:心拍間隔の変動
・deep:深い睡眠の時間
・asleep_diff:睡眠時間の日ごとの変化量(差分)
・ Asleep: Sleep time ・ temperature_min: Minimum temperature of the day ・ Efficiency: Sleep efficiency (sleep time / bedtime-wake-up time)
・ WakingBPM_diff: Daily change (difference) in heart rate (Beats per minute) when waking up
・ Quality: Sleep quality ・ dayBPM: Daytime heart rate (Beats per minute)
・ WakingBPM: Heart rate when waking up (Beats per minute)
・ Pressure_noon_diff: Daily change in barometric pressure (difference)
・ Hrv: Heart rate variability ・ deep: Deep sleep time ・ asleep_diff: Daily change in sleep time (difference)
前記アルゴリズム処理部14は、属性の時系列データ間の類似度を計算する時系列データ処理部141と、関係性グラフを生成する関係性グラフ生成部142と、関係性グラフにおいて総合的なリンクの重みが大きいノード間を抽出するノードデータ処理部143と、ノード間の因果関係を算定する因果関係処理部144と、属性間の関係性を推定する関係性推定部145とを備える。
The
前記時系列データ処理部141は、データ取得部13により取得された各属性の時系列データ間の類似度を計算する。本実施形態では、この時系列データ処理部141は、DTW(Dynamic Time Warping)を用いて各属性の時系列データ間の類似度を計算する。DTWでは 2つの時系列の各点の距離を総当りで比較した上で、系列同士の距離が最短となるパスを見つけて、これがDTWの距離になる。このため、2つの属性の時系列データの周期性や長さが違っても 、DTWの距離を定義することができ、類似度が大きいほど距離は短く(近く)なる。
The time-series data processing unit 141 calculates the degree of similarity between the time-series data of each attribute acquired by the
なお、本実施形態では、前記時系列データ処理部141は、取得した各属性の時系列データを事前に正規化する。例えば、気温の時系列データの場合、-5度から40度である一方、1日の歩数の時系列データの場合、0歩から2万歩といったように時系列データによって絶対値のとり得る幅は大きく異なるため、一定範囲(例えば、0から1の範囲)に正規化する。 In this embodiment, the time-series data processing unit 141 normalizes the acquired time-series data of each attribute in advance. For example, in the case of time-series data of temperature, it is -5 degrees to 40 degrees, while in the case of time-series data of the number of steps per day, it is 0 to 20,000 steps. Is very different, so normalize to a certain range (eg, range from 0 to 1).
前記関係性グラフ生成部142は、図5に示すように、データ取得部13により取得された時系列データの各属性をノードとし、時系列データ処理部141により計算された各属性の時系列データ間の類似度をノード間の直接的なリンクの重みとして、各ノードをリンクで接続した無向性の関係性グラフを生成する。なお、図5において、Gが関係性グラフ、lがリンク、nがノードを示す。
As shown in FIG. 5, the relationship graph generation unit 142 uses each attribute of the time series data acquired by the
この関係性グラフは、属性の時系列データ間の類似度が高いほど、当該属性間に対応するノード間の直接的なリンクの重みが大きくなる。また、類似度が計算されたノード間は一のリンクで直接的に接続される一方、類似度が計算されていないノード間も他のノードを介して複数のリンクで間接的に接続される。このため、各ノード間は、一ないし複数のリンクで直接的および間接的に接続された複数の経路を有し、経路上の各リンクの重みの総計が当該経路のリンクの重みを構成し、ノード間の各経路のリンクの重みの総計が当該ノード間の総合的なリンクの重みを構成する。本実施形態では、ノード間のリンクの重みとしてリンクの長さを採用しており、リンクの長さが短いほどリンクの重みが大きいものとなされている。 In this relationship graph, the higher the similarity between the time-series data of an attribute, the greater the weight of the direct link between the corresponding nodes between the attributes. Further, while the nodes for which the similarity is calculated are directly connected by one link, the nodes for which the similarity is not calculated are also indirectly connected by a plurality of links via other nodes. Therefore, each node has a plurality of routes directly and indirectly connected by one or a plurality of links, and the total weight of each link on the route constitutes the weight of the link of the route. The sum of the link weights for each route between the nodes constitutes the overall link weights between the nodes. In the present embodiment, the length of the link is adopted as the weight of the link between the nodes, and the shorter the length of the link, the larger the weight of the link.
なお、図5では、関係性グラフの各ノード間のリンクに向きが付されているが、この向きは後述の因果関係処理部144によりノード間の因果関係が算定されたあと、ノードデータ処理部143により向きが付されるため、関係性グラフが生成された当初はリンクの向きは付されていない。 In FIG. 5, the link between each node of the relationship graph is oriented, and this direction is determined by the causal relationship processing unit 144 described later, after the causal relationship between the nodes is calculated, and then the node data processing unit. Since the orientation is given by 143, the orientation of the link is not attached at the beginning when the relationship graph is generated.
前記ノードデータ処理部143は、関係性グラフ生成部142により生成された関係性グラフにおいて、ノード間ごとに経路のリンクの重みが大きい一ないし複数の経路(本実施形態では、1番目から3番目までの経路)を算出する。
The node
例えば、図6は、ある関係性グラフにおける各ノード間における経路のリンクの重みを表に示したものである。図6において、「source」は元となるノード(属性)、「target」は「source」の対象となるノード(属性)、「dist」はノード間の直接的なリンクの重み(リンクの長さ)、「k1path」「k2path」「k3path」はノード間の1番目から3番目までのリンクの重みが大きい経路(1番目から3番目までの最短経路)、「i_k1dist」「i_k2dist」「i_k3dist」はノード間の1番目から3番目までの経路のリンクの重み(経路のリンクの長さの逆数)、「i_ksum」はノード間の1番目から3番目までの経路のリンクの重みの総和(経路のリンクの長さの逆数の総和:総合スコア)である。このように経路のリンクの重みとして、経路のリンクの長さ(経路長)の逆数をとるのは、逆数とすることにより経路長が短いものほど総合スコアが大きくなるためである。これにより、経路のリンクの重みの総合スコアが大きいほど、ノード間においてリンクの重みが大きい経路(短い経路)が多く、総合的なリンクの重みが大きいと評価することができる。 For example, FIG. 6 tabulates the weights of the route links between each node in a relationship graph. In FIG. 6, "source" is the original node (attribute), "target" is the target node (attribute) of "source", and "dist" is the weight of the direct link between the nodes (link length). ), "K1path", "k2path" and "k3path" are routes with a large weight of the first to third links between nodes (the shortest route from the first to the third), and "i_k1dist", "i_k2dist" and "i_k3dist" are. The weights of the links of the 1st to 3rd routes between the nodes (reciprocal length of the link lengths of the routes), "i_ksum" is the sum of the weights of the links of the 1st to 3rd routes between the nodes (of the routes). The sum of the inverse numbers of the link lengths: total score). The reason why the reciprocal of the length of the link of the route (path length) is taken as the weight of the link of the route in this way is that the shorter the route length is, the larger the total score is. As a result, it can be evaluated that the larger the total score of the link weights of the routes, the larger the number of routes (short routes) with the larger link weights between the nodes, and the larger the total link weights.
また、前記ノードデータ処理部143は、ノードデータ処理部143によりノード間ごとに算出された経路のリンクの重みが大きい一ないし複数の経路に基づいて、総合的なリンクの重みが大きい一ないし複数のノード間を抽出する。本実施形態では、ノードデータ処理部143は、ノード間ごとに算出された1番目から3番目までの経路のリンクの重みの総和「i_ksum」を当該ノード間の総合的なリンクの重みとしているため、その総合的なリンクの重みが大きいノード間を抽出する。例えば、図6によると、図6の1列目における経路のリンクの重みの総和「i_ksum」が大きいため、1列目の「asleep(睡眠時間)」と「quality(睡眠の質)」のノード間を総合的なリンクの重みが大きいノード間として抽出する。
Further, the node
前記因果関係処理部144は、関係性グラフのノード間の因果関係を算定するものである。本実施形態では、因果関係処理部144は、各属性の時系列データ間の相関(相関の正負の極性と時間のずれ)を計算することにより、当該各属性の時系列データ間に対応する関係性グラフのノード間の因果関係を算定する。 The causal relationship processing unit 144 calculates the causal relationship between the nodes of the relationship graph. In the present embodiment, the causal relationship processing unit 144 calculates the correlation between the time-series data of each attribute (the positive / negative polarity of the correlation and the time lag), thereby corresponding to the relationship between the time-series data of each attribute. Calculate the causal relationship between the nodes of the sex graph.
例えば、図7は、「source」の属性と、「target」の属性との因果関係を表に示したものである。「sign」は、「source」の属性の時系列データと、「target」の属性の時系列データとの相関を数値で表したものであり、「1」が正の相関、「-1」が負の相関である。仮に属性間が正の相関の場合、一方の属性が大きくなるほど、他方の属性も大きくなる関係にある一方、仮に属性間が負の相関の場合、一方の属性が大きくなるほど、他方の属性は小さくなる関係にある。 For example, FIG. 7 shows a table showing the causal relationship between the attribute of "source" and the attribute of "target". "Sign" is a numerical value representing the correlation between the time-series data of the "source" attribute and the time-series data of the "target" attribute. "1" is a positive correlation and "-1" is a positive correlation. It is a negative correlation. If there is a positive correlation between attributes, the larger one attribute is, the larger the other attribute is. On the other hand, if there is a negative correlation between attributes, the larger one attribute is, the smaller the other attribute is. There is a relationship.
また、同じく図7において、「estimated_delay」は各属性の時系列データ間の時間のずれを表わしており、「source」に対して「target」の属性が遅れれば、「source」が要因となる一方、「target」に対して「source」の属性が遅れれば、「target」が要因となる。例えば、図7の1列目によると、「asleep(睡眠時間)」の属性は「quality(睡眠の質)」の属性と正の相関があり、時間のずれは0である。 Similarly, in FIG. 7, "stimated_delay" represents a time lag between time-series data of each attribute, and if the attribute of "target" is delayed with respect to "source", "source" is a factor. , If the attribute of "source" is delayed with respect to "target", "target" becomes a factor. For example, according to the first column of FIG. 7, the attribute of "sleep" has a positive correlation with the attribute of "quality", and the time lag is 0.
この各属性の時系列データの相関を計算するに際しては、「source」の属性の時系列データと、「target」の属性の時系列データとを重ねて表記したり、いずれかの属性の時系列データを反転させて重ねて表記したり、あるいは時間的にずらして表記するなどして、属性の時系列データを互いに比較することにより相関を計算する方法が挙げられる。 When calculating the correlation of the time-series data of each attribute, the time-series data of the "source" attribute and the time-series data of the "target" attribute may be superimposed or expressed, or the time-series of any of the attributes. There is a method of calculating the correlation by comparing the time-series data of the attributes with each other by inverting the data and expressing it in an overlapping manner or by staggering the notation in time.
例えば、図8(a)は、「step_count(歩数)」の属性の時系列データと、「dayBPM(日中の心拍数)」の属性の時系列データとについて、「step_count」の属性の時系列データを未来に1日ずらして表記したものである。図8(a)によると、「step_count(歩数)」の属性の時系列データと、「dayBPM(日中の心拍数)」の属性の時系列データの起伏が概ね類似しているため、「step_count(歩数)」の属性と「dayBPM(日中の心拍数)」の属性は正の相関があり、「step_count(歩数)」の属性が1日後の「dayBPM(日中の心拍数)」の属性の要因となることが把握される。 For example, FIG. 8A shows a time series of the attribute of "step_count" with respect to the time series data of the attribute of "step_count (step count)" and the time series data of the attribute of "dayBPM (heart rate during the day)". The data is shown one day off in the future. According to FIG. 8A, since the undulations of the time-series data of the attribute of "step_count (step count)" and the time-series data of the attribute of "dayBPM (daytime heart rate)" are generally similar, "step_count". There is a positive correlation between the "(step count)" attribute and the "dayBPM (daytime heart rate)" attribute, and the "step_count (step count)" attribute is the "dayBPM (daytime heart rate)" attribute one day later. It is understood that it becomes a factor of.
一方、図8(b)は、同じく「step_count(歩数)」の属性の時系列データと、「dayBPM(日中の心拍数)」の属性の時系列データとについて、「step_count(歩数)」の属性の時系列データを反転させたあと、未来に2日ずらして表記したものである。図8(b)によると、「step_count(歩数)」の属性の時系列データと、「dayBPM(日中の心拍数)」の属性の時系列データとの起伏が一致している部分もあるが、図8(a)に比べると、その相関は低いものと把握されるため、図8(a)による相関(正の相関、1日のずれ)を採用することになる。 On the other hand, FIG. 8B shows the time-series data of the attribute of "step_count (step count)" and the time-series data of the attribute of "dayBPM (daytime heart rate)" of "step_count (step count)". After inverting the time-series data of the attributes, it is shown with a shift of 2 days in the future. According to FIG. 8B, there is a part where the undulations of the time-series data of the attribute of "step_count (step count)" and the time-series data of the attribute of "dayBPM (daytime heart rate)" match. Since the correlation is understood to be lower than that of FIG. 8A, the correlation according to FIG. 8A (positive correlation, one-day deviation) is adopted.
なお、前記因果関係処理部144は、必ずしも全てのノード間の因果関係を算定する必要はなく、例えばノードデータ処理部143により抽出された総合的なリンクの重みが大きいノード間の因果関係のみを算定してもよい。
The causal relationship processing unit 144 does not necessarily have to calculate the causal relationship between all the nodes, for example, only the causal relationship between the nodes with a large total link weight extracted by the node
而して、前記ノードデータ処理部143は、図5に示すように、因果関係処理部144により算定された関係性グラフのノード間の因果関係に基づいて、各ノード間のリンクに向き(矢印の元が要因/矢印の先が結果)を付する。
Therefore, as shown in FIG. 5, the node
前記関係性推定部145は、ノードデータ処理部143により抽出されたノード間に対応する属性間の関係性を推定する。例えば、ノードデータ処理部143において「asleep(睡眠時間)」と「quality(睡眠の質)」のノード間が抽出された場合、関係性推定部145は「asleep(睡眠時間)」と「quality(睡眠の質)」の属性間の関係性があるまたは強いと推定する。この際、関係性グラフにおいて、「asleep(睡眠時間)」と「quality(睡眠の質)」のノード間の直接的なリンクに矢印(「asleep(睡眠時間)」が矢印の元、「quality(睡眠の質)」が矢印の先)が付されている場合、「asleep(睡眠時間)」が「quality(睡眠の質)」に影響していると推定する。また、因果関係処理部144により「asleep(睡眠時間)」と「quality(睡眠の質)」の「estimated_day」(時間のずれ)が1日と算出されている場合、「asleep(睡眠時間)」の1日経過後に「quality(睡眠の質)」に影響していると推定する。
The
また、前記関係性推定部145は、属性間の関係性を推定した際、図9に示すように、ユーザインターフェース部11の画面において属性間の関係性を文章(図9の右側))として出力せしめたり、直観的なグラフ(図9の左側の画面内)として出力せしめたりする。
Further, when the
なお、前記データ抽出部17は、サーバ装置4に対して各属性の時系列データや関係性グラフを通信部16を介して送信したり、サーバ装置4から通信部16を介して受信した各種情報を抽出して、アルゴリズム処理部14に送信したりする。
The
[本システムの動作]
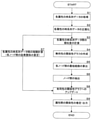
次に本システムの動作について、図10のフローチャートを参照しつつ説明する。
[Operation of this system]
Next, the operation of this system will be described with reference to the flowchart of FIG.
まず、前記データ取得部13(第1~第3のデータ取得部131~133)は、端末外部のIoTデバイス2または外部Webサービス3や、端末内部のアプリケーションから複数の種類の属性の時系列データを取得する(S1)。
First, the data acquisition units 13 (first to third
そして、前記時系列データ処理部141は、データ取得部13により取得された各属性の時系列データを事前に正規化したあと(S2)、各属性の時系列データ間の類似度を計算する(S3)。 Then, the time-series data processing unit 141 calculates the similarity between the time-series data of each attribute after pre-normalizing the time-series data of each attribute acquired by the data acquisition unit 13 (S2) (S2). S3).
そして、前記関係性グラフ生成部142は、時系列データの各属性をノードとし、時系列データ処理部141により計算された各属性の時系列データの類似度を各ノード間のリンクの重みとして、各ノードをリンクで接続した無向性の関係性グラフを生成する(S4)。 Then, the relationship graph generation unit 142 uses each attribute of the time series data as a node, and the similarity of the time series data of each attribute calculated by the time series data processing unit 141 as the weight of the link between the nodes. Generate an undirected relationship graph in which each node is connected by a link (S4).
そして、前記ノードデータ処理部143は、関係性グラフ生成部142により生成された関係性グラフにおいて、ノード間ごとにリンクの重みが大きい一ないし複数の経路(最短経路)を算出する(S5)。
Then, the node
そして、前記ノードデータ処理部143は、ノード間ごとに算出された経路のリンクの重みが大きい一ないし複数の経路に基づいて、総合的なリンクの重みが大きい一ないし複数のノード間を抽出する(S6)。
Then, the node
一方、前記因果関係処理部144は、各属性の時系列データ間の相関を計算することにより、当該各属性間に対応する関係性グラフの各ノード間の因果関係を算定する(S7)。 On the other hand, the causal relationship processing unit 144 calculates the causal relationship between each node of the relationship graph corresponding to each attribute by calculating the correlation between the time series data of each attribute (S7).
そして、前記ノードデータ処理部143は、図5に示すように、因果関係処理部144により算定された関係性グラフの各ノード間の因果関係に基づいて、関係性グラフの各ノード間のリンクに向き(矢印の元が要因/矢印の先が結果)を付することにより有向性の関係性グラフにアップデートする(S8)。
Then, as shown in FIG. 5, the node
そして、前記関係性推定部145は、ノードデータ処理部143により抽出されたノード間に対応する属性間の関係性を推定する。このとき、関係性推定部145は、関係性グラフに付されたリンクの向きに基づいて属性間の関係性を推定してもよいし、因果関係処理部144により算定されたノード間の因果関係(要因と結果、時間のずれ)に基づいて属性間の関係性を直接推定してもよい。また、関係性推定部145は、インターフェース部の画面において各属性間の関係性を文章(図9の右側)として出力せしめたり、直観的なグラフ(図9の左側の画面内)として出力せしめたりする(S9)。
Then, the
なお、本実施形態では、ノード間の因果関係を算定する因果関係処理部144が設けられるものとしたが、因果関係処理部144が設けられなくてもよい。この場合、関係性推定部145は、ノードデータ処理部143により抽出されたノード間の属性間の関係性を推定する際、当該属性間に何らかの関係があることのみを推定する。
In this embodiment, the causal relationship processing unit 144 for calculating the causal relationship between the nodes is provided, but the causal relationship processing unit 144 may not be provided. In this case, when the
また、前記ノードデータ処理部143は、因果関係処理部144により算定されたノード間の因果関係に基づいて関係性グラフのノード間のリンクに向きを付するものとしたが、関係性グラフのノード間にリンクの向きを付さなくてもよい。この場合、関係性推定部145は、因果関係処理部144により算定されたノード間の因果関係に基づいて、該ノード間に対応する属性間の関係性を直接推定するとよい。
Further, the node
また、前記関係性グラフ生成部142は、時系列データ処理部141により計算された属性の時系列データ間の類似度をノード間のリンクの重みとしたが、その他の方法により属性の時系列データ間の類似度をノード間のリンクの重みの計算に利用しててもよい。例えば、属性の時系列データ間の類似度をノードそのものの重みとして、ノードそのものは重力モデルなどで重み(距離)を定義することが挙げられる。 Further, the relationship graph generation unit 142 uses the similarity between the time-series data of the attributes calculated by the time-series data processing unit 141 as the weight of the link between the nodes, but the time-series data of the attributes is obtained by another method. The similarity between the nodes may be used to calculate the weight of the link between the nodes. For example, the similarity between time-series data of attributes is used as the weight of the node itself, and the node itself defines the weight (distance) by a gravity model or the like.
(実施例1)
次に、本発明の実施例1について、図11を参照しつつ説明する。
(Example 1)
Next, Example 1 of the present invention will be described with reference to FIG.
本実施例1では、属性の時系列データとして、IoTデバイス2から自動で取得される歩数の時系列データ並びに睡眠効率の時系列データ、情報端末装置1から手動で取得される体調の時系列データを対象として説明するが、実際にはその他の属性の時系列データも取得される。
In the first embodiment, as the attribute time-series data, the time-series data of the number of steps automatically acquired from the
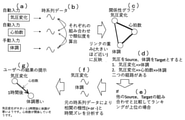
まず、前記データ取得部13(第1~第3のデータ取得部131~133)は、図11(a)に示すように、端末外部のIoTデバイス2または外部Webサービス3や、端末内部のアプリケーションから上記3種類の属性(歩数、睡眠効率、体調)の時系列データを含む、複数種類の属性の時系列データを取得する。
First, as shown in FIG. 11A, the data acquisition units 13 (first to third
そして、前記時系列データ処理部141は、図11(b)に示すように、データ取得部13により取得された各属性の時系列データを事前に正規化したあと、歩数、睡眠効率、体調などの各属性の時系列データ間の類似度を計算する。
Then, as shown in FIG. 11B, the time-series data processing unit 141 pre-normalizes the time-series data of each attribute acquired by the
そして、前記関係性グラフ生成部142は、図11(c)に示すように、各時系列データの各属性(歩数、睡眠効率、体調など)をノードとし、時系列データ処理部141により計算された各属性(歩数、睡眠効率、体調など)の時系列データの類似度を各ノード間のリンクの重みとして、各ノードをリンクで接続した無向性の関係性グラフを生成する。なお、図11(c)では、歩数、睡眠効率、体調の3つのノードをリンクで接続した関係性グラフを図示しているが、実際にはその他のノードも接続した関係性グラフを生成する。 Then, as shown in FIG. 11C, the relationship graph generation unit 142 is calculated by the time series data processing unit 141 with each attribute (step count, sleep efficiency, physical condition, etc.) of each time series data as a node. Using the similarity of time-series data of each attribute (step count, sleep efficiency, physical condition, etc.) as the weight of the link between each node, an undirected relationship graph in which each node is connected by a link is generated. Although FIG. 11C shows a relationship graph in which three nodes of the number of steps, sleep efficiency, and physical condition are connected by a link, a relationship graph in which other nodes are also connected is actually generated.
そして、前記ノードデータ処理部143は、図11(d)に示すように、関係性グラフ生成部142により生成された関係性グラフにおいて、リンクの重みが大きいノード間の一ないし複数の経路を算出する。例えば、歩数を「Source」のノード(属性)、体調を「Target」のノード(属性)とした場合、経路(歩数-体調)と経路(歩数-睡眠効率-体調)の2つの経路が存在するため、当該2つの経路を算出するとともに、当該2つの経路のリンクの重みに基づいて歩数と体調のノード間の総合的なリンクの重みを算出する。
Then, as shown in FIG. 11D, the node
そして、前記ノードデータ処理部143は、図11(e)に示すように、他の「Source」のノードと「Target」のノードの組み合わせと比較して、歩数と体調のノード間における総合的なリンクの重みが上位である場合、歩数と体調のノード間を抽出する。
Then, as shown in FIG. 11 (e), the node
そして、前記因果関係処理部144は、図11(f)に示すように、属性(歩数、体調)の時系列データ間の相関(正負の極性、時間のずれ)を計算することにより、当該属性(歩数、体調)の時系列データ間に対応する関係性グラフのノード間の因果関係(歩数が要因、体調が結果、12時間のずれ)を算定する。 Then, as shown in FIG. 11 (f), the causal relationship processing unit 144 calculates the correlation (positive / negative polarity, time lag) between the time-series data of the attribute (step count, physical condition), and thereby the attribute. Calculate the causal relationship between the nodes of the relationship graph corresponding to the time-series data of (step count, physical condition) (step count is a factor, physical condition is the result, and a 12-hour shift).
そして、前記ノードデータ処理部143は、図11(g)に示すように、因果関係処理部144により算定された関係性グラフのノード間の因果関係(歩数が要因、体調が結果)に基づいて、関係性グラフの歩数と体調のノード間のリンクに向き(歩数→体調)を付する。
Then, as shown in FIG. 11 (g), the node
また、前記関係性推定部145は、図11(g)に示すように、歩数と体調の関係性は強く、また歩数が12時間後の体調に影響していることや、歩数と体調の間に睡眠効率が関係していることを推定して、ユーザインターフェース部11の画面において所定の文章やグラフを出力せしめる。
Further, as shown in FIG. 11 (g), the
(実施例2)
次に、本発明の実施例2について、図12を参照しつつ説明する。
(Example 2)
Next, Example 2 of the present invention will be described with reference to FIG.
本実施例2では、属性の時系列データとして、IoTデバイス2から自動で取得される気圧変化の時系列データ、情報端末装置1から自動で取得される心拍数の時系列データ、情報端末装置1から手動で取得される体調の時系列データを対象として説明するが、実際にはその他の属性の時系列データも取得される。
In the second embodiment, as the attribute time-series data, the time-series data of the pressure change automatically acquired from the
まず、前記データ取得部13(第1~第3のデータ取得部131~133)は、図12(a)に示すように、端末外部のIoTデバイス2または外部Webサービス3や、端末内部のアプリケーションから上記3種類の属性(気圧変化、心拍数、体調)の時系列データを含む、複数種類の属性の時系列データを取得する。
First, as shown in FIG. 12A, the data acquisition units 13 (first to third
そして、前記時系列データ処理部141は、図12(b)に示すように、データ取得部13により取得された各属性の時系列データを事前に正規化したあと、気圧変化、心拍数、体調などの各属性の時系列データ間の類似度を計算する。
Then, as shown in FIG. 12B, the time-series data processing unit 141 preliminarily normalizes the time-series data of each attribute acquired by the
そして、前記関係性グラフ生成部142は、図12(c)に示すように、各時系列データの各属性(気圧変化、心拍数、体調など)をノードとし、時系列データ処理部141により計算された各属性(気圧変化、心拍数、体調など)の時系列データの類似度を各ノード間のリンクの重みとして、各ノードをリンクで接続した無向性の関係性グラフを生成する。なお、図12(c)では、気圧変化、心拍数、体調の3つのノードをリンクで接続した関係性グラフを図示しているが、実際にはその他のノードも接続した関係性グラフを生成する。 Then, as shown in FIG. 12 (c), the relationship graph generation unit 142 uses each attribute (pressure change, heart rate, physical condition, etc.) of each time series data as a node, and calculates by the time series data processing unit 141. Using the similarity of the time-series data of each attribute (change in pressure, heart rate, physical condition, etc.) as the weight of the link between each node, an undirected relationship graph in which each node is connected by the link is generated. Note that FIG. 12 (c) shows a relationship graph in which three nodes of barometric pressure change, heart rate, and physical condition are connected by a link, but in reality, a relationship graph in which other nodes are also connected is generated. ..
そして、前記ノードデータ処理部143は、図12(d)に示すように、関係性グラフ生成部142により生成された関係性グラフにおいて、リンクの重みが大きいノード間の一ないし複数の経路を算出する。例えば、気圧変化を「Source」のノード(属性)、体調を「Target」のノード(属性)とした場合、経路(気圧変化-体調)と経路(気圧変化-心拍数-体調)の2つの経路が存在するため、当該2つの経路を算出するとともに、当該2つの経路のリンクの重みに基づいて気圧変化と体調のノード間の総合的なリンクの重みを算出する。
Then, as shown in FIG. 12D, the node
そして、前記ノードデータ処理部143は、図12(e)に示すように、他の「Source」のノードと「Target」のノードの組み合わせと比較して、気圧変化と体調のノード間における総合的なリンクの重みが上位である場合、気圧変化と体調のノード間を抽出する。
Then, as shown in FIG. 12 (e), the node
そして、前記因果関係処理部144は、図12(f)に示すように、属性(気圧変化、体調)の時系列データ間の相関(正負の極性、時間のずれ)を計算することにより、当該属性(気圧変化、体調)の時系列データ間に対応する関係性グラフのノード間の因果関係(気圧変化が要因、体調が結果、1時間のずれ)を算定する。 Then, as shown in FIG. 12 (f), the causal relationship processing unit 144 calculates the correlation (positive / negative polarity, time lag) between the time-series data of the attributes (pressure change, physical condition). Calculate the causal relationship between the nodes of the relationship graph corresponding to the time-series data of the attributes (pressure change, physical condition) (the factor is the pressure change, the physical condition is the result, and the deviation is 1 hour).
そして、前記ノードデータ処理部143は、図12(g)に示すように、因果関係処理部144により算定された関係性グラフのノード間の因果関係(気圧変化が要因、体調が結果)に基づいて、関係性グラフの気圧変化と体調のノード間のリンクに向き(気圧変化→体調)を付する。
Then, as shown in FIG. 12 (g), the node
また、前記関係性推定部145は、図12(g)に示すように、気圧変化と体調の関係性は強く、また気圧変化が1時間後の体調に影響していることや、気圧変化と体調の間に心拍数が関係していることを推定して、ユーザインターフェース部11の画面において所定の文章やグラフを出力せしめる。
Further, as shown in FIG. 12 (g), the
(実施例3)
次に、本発明の実施例3について、図13を参照しつつ説明する。
(Example 3)
Next, Example 3 of the present invention will be described with reference to FIG.
本実施例3では、属性の時系列データとして、IoTデバイス2から自動で取得される気温の時系列データ、情報端末装置1から手動で取得される飲酒時間の時系列データ並びに体調の時系列データを対象として説明するが、実際にはその他の属性の時系列データも取得される。
In the third embodiment, as the attribute time-series data, the temperature time-series data automatically acquired from the
まず、前記データ取得部13(第1~第3のデータ取得部131~133)は、図13(a)に示すように、端末外部のIoTデバイス2または外部Webサービス3や、端末内部のアプリケーションから上記3種類の属性(気温、飲酒時間、体調)の時系列データを含む、複数種類の属性の時系列データを取得する。
First, as shown in FIG. 13A, the data acquisition unit 13 (first to third
そして、前記時系列データ処理部141は、図13(b)に示すように、データ取得部13により取得された各属性の時系列データを事前に正規化したあと、気温、飲酒時間、体調などの各属性の時系列データ間の類似度を計算する。
Then, as shown in FIG. 13B, the time-series data processing unit 141 pre-normalizes the time-series data of each attribute acquired by the
そして、前記関係性グラフ生成部142は、図13(c)に示すように、各時系列データの各属性(気温、飲酒時間、体調など)をノードとし、時系列データ処理部141により計算された各属性(気温、飲酒時間、体調など)の時系列データの類似度を各ノード間のリンクの重みとして、各ノードをリンクで接続した無向性の関係性グラフを生成する。なお、図13(c)では、気温、飲酒時間、体調の3つのノードをリンクで接続した関係性グラフを図示しているが、実際にはその他のノードも接続した関係性グラフを生成する。 Then, as shown in FIG. 13C, the relationship graph generation unit 142 is calculated by the time-series data processing unit 141 with each attribute (temperature, drinking time, physical condition, etc.) of each time-series data as a node. Using the similarity of time-series data of each attribute (temperature, drinking time, physical condition, etc.) as the weight of the link between each node, an undirected relationship graph connecting each node with a link is generated. Note that FIG. 13 (c) illustrates a relationship graph in which three nodes of temperature, drinking time, and physical condition are connected by a link, but in reality, a relationship graph in which other nodes are also connected is generated.
そして、前記ノードデータ処理部143は、図13(d)に示すように、関係性グラフ生成部142により生成された関係性グラフにおいて、リンクの重みが大きいノード間の一ないし複数の経路を算出する。例えば、気温を「Source」のノード(属性)、体調を「Target」のノード(属性)とした場合、経路(気温-体調)と経路(気温-飲酒時間-体調)の2つの経路が存在するため、当該2つの経路を算出するとともに、当該2つの経路のリンクの重みに基づいて気温と体調のノード間の総合的なリンクの重みを算出する。但し、経路(気温-飲酒時間-体調)において、ノード(飲酒時間)とノード(体調)のリンクの重みが小さいものとする。
Then, as shown in FIG. 13D, the node
そして、前記ノードデータ処理部143は、図13(e)に示すように、他の「Source」のノードと「Target」のノードの組み合わせと比較して、気温と体調のノード間における総合的なリンクの重みが上位である場合、気温と体調のノード間を抽出する。
Then, as shown in FIG. 13 (e), the node
そして、前記因果関係処理部144は、図13(f)に示すように、属性(気温、体調)の時系列データ間の相関(正負の極性、時間のずれ)を計算することにより、当該属性(気温、体調)の時系列データ間に対応する関係性グラフのノード間の因果関係(気温が要因、体調が結果、3時間のずれ)を算定する。 Then, as shown in FIG. 13 (f), the causal relationship processing unit 144 calculates the correlation (positive / negative polarity, time lag) between the time-series data of the attribute (temperature, physical condition), and thereby the attribute. Calculate the causal relationship between the nodes of the relationship graph corresponding to the time series data of (temperature, physical condition) (temperature is a factor, physical condition is the result, and a deviation of 3 hours).
そして、前記ノードデータ処理部143は、図13(g)に示すように、因果関係処理部144により算定された関係性グラフのノード間の因果関係(気温が要因、体調が結果)に基づいて、関係性グラフの気温と体調のノード間のリンクに向き(気温→体調)を付する。なお、前記ノードデータ処理部143が飲酒時間と体調のノード間を総合的なリンクの重みが大きいノード間として抽出している場合、因果関係処理部144により算定された関係性グラフのノード間の因果関係(飲酒時間が要因、体調が結果)に基づいて、関係性グラフの飲酒時間と体調のノード間のリンクに向き(飲酒時間→体調)を付する。
Then, as shown in FIG. 13 (g), the node
また、前記関係性推定部145は、図13(g)に示すように、気温と体調の関係性は強く、また気温が3時間後の体調に影響していることを推定したり、飲酒時間と体調の関係性が強く、また飲酒時間が6時間後の体調に影響していることを推定するとともに、気温と飲酒時間は関係性が弱いことを推定して、ユーザインターフェース部11の画面において所定の文章やグラフを出力せしめる。
Further, as shown in FIG. 13 (g), the
以上、図面を参照して本発明の実施形態を説明したが、本発明は、図示した実施形態のものに限定されない。図示された実施形態に対して、本発明と同一の範囲内において、あるいは均等の範囲内において、種々の修正や変形を加えることが可能である。 Although the embodiments of the present invention have been described above with reference to the drawings, the present invention is not limited to those of the illustrated embodiments. Various modifications and modifications can be made to the illustrated embodiments within the same range as the present invention or within the same range.
1…ユーザの情報端末装置
11…ユーザインターフェース部
12…データ入出力部
13…データ取得部
131…第1のデータ取得部
132…第2のデータ取得部
133…第3のデータ取得部
14…アルゴリズム処理部
141…時系列データ処理部
142…関係性グラフ生成部
143…ノードデータ処理部
144…因果関係処理部
145…関係性推定部
15…記憶部
16…通信部
17…データ抽出部
2…IoTデバイス
21…センサ部
22…通信部
3…外部Webサービス
4…サーバ装置
41…学習部
42…記憶部
43…通信部
1 ... User
Claims (13)
前記データ取得部により取得された各属性の時系列データ間の類似度を計算する時系列データ処理部と、
前記データ取得部により取得された時系列データの属性をノードとして該ノードをリンクで接続した関係性グラフを生成し、前記時系列データ処理部により計算された属性の時系列データ間の類似度をノード間のリンクの重みの計算に利用する関係性グラフ生成部と、
前記関係性グラフ生成部により生成された関係性グラフにおいて、総合的なリンクの重みが大きいノード間を抽出するノードデータ処理部と、
前記ノードデータ処理部により抽出されたノード間に対応する属性間の関係性を推定する関係性推定部とを備えることを特徴とする関係性推定システム。 A data acquisition unit that acquires time-series data of multiple attributes, including at least time-series data of attributes related to the human body or activity.
A time-series data processing unit that calculates the degree of similarity between time-series data of each attribute acquired by the data acquisition unit, and
Using the attributes of the time-series data acquired by the data acquisition unit as nodes, a relationship graph connecting the nodes with a link is generated, and the similarity between the time-series data of the attributes calculated by the time-series data processing unit is calculated. The relationship graph generator used to calculate the weights of the links between the nodes,
In the relationship graph generated by the relationship graph generation unit, a node data processing unit that extracts between nodes with a large overall link weight and a node data processing unit.
A relationship estimation system including a relationship estimation unit that estimates the relationship between the corresponding attributes between the nodes extracted by the node data processing unit.
前記サーバ装置は、各情報端末装置から収集した属性の時系列データに基づいて関係性グラフを生成することを特徴とする関係性推定システム。 The plurality of information terminal devices according to claim 12 and a server device connected to each information terminal device via a network are provided.
The server device is a relationship estimation system characterized by generating a relationship graph based on time-series data of attributes collected from each information terminal device.
Priority Applications (3)
| Application Number | Priority Date | Filing Date | Title |
|---|---|---|---|
| JP2020115945A JP2022013409A (en) | 2020-07-03 | 2020-07-03 | Relationship estimation system |
| US18/014,279 US20230260646A1 (en) | 2020-07-03 | 2021-06-17 | Relationship estimatation system |
| PCT/JP2021/023005 WO2022004404A1 (en) | 2020-07-03 | 2021-06-17 | Relationship estimation system |
Applications Claiming Priority (1)
| Application Number | Priority Date | Filing Date | Title |
|---|---|---|---|
| JP2020115945A JP2022013409A (en) | 2020-07-03 | 2020-07-03 | Relationship estimation system |
Publications (1)
| Publication Number | Publication Date |
|---|---|
| JP2022013409A true JP2022013409A (en) | 2022-01-18 |
Family
ID=79316052
Family Applications (1)
| Application Number | Title | Priority Date | Filing Date |
|---|---|---|---|
| JP2020115945A Pending JP2022013409A (en) | 2020-07-03 | 2020-07-03 | Relationship estimation system |
Country Status (3)
| Country | Link |
|---|---|
| US (1) | US20230260646A1 (en) |
| JP (1) | JP2022013409A (en) |
| WO (1) | WO2022004404A1 (en) |
Family Cites Families (2)
| Publication number | Priority date | Publication date | Assignee | Title |
|---|---|---|---|---|
| JP6354192B2 (en) * | 2014-02-14 | 2018-07-11 | オムロン株式会社 | Causal network generation system |
| JP6320143B2 (en) * | 2014-04-15 | 2018-05-09 | 株式会社東芝 | Health information service system |
-
2020
- 2020-07-03 JP JP2020115945A patent/JP2022013409A/en active Pending
-
2021
- 2021-06-17 WO PCT/JP2021/023005 patent/WO2022004404A1/en active Application Filing
- 2021-06-17 US US18/014,279 patent/US20230260646A1/en active Pending
Also Published As
| Publication number | Publication date |
|---|---|
| US20230260646A1 (en) | 2023-08-17 |
| WO2022004404A1 (en) | 2022-01-06 |
Similar Documents
| Publication | Publication Date | Title |
|---|---|---|
| Yang et al. | Lifelogging data validation model for internet of things enabled personalized healthcare | |
| JP7336549B2 (en) | Methods and systems for monitoring and influencing gesture-based behavior | |
| Forkan et al. | CoCaMAAL: A cloud-oriented context-aware middleware in ambient assisted living | |
| US20230004580A1 (en) | Data tagging | |
| US9750433B2 (en) | Using health monitor data to detect macro and micro habits with a behavioral model | |
| Kim et al. | Prediction model of user physical activity using data characteristics-based long short-term memory recurrent neural networks | |
| Erdogan et al. | A data mining approach for fall detection by using k-nearest neighbour algorithm on wireless sensor network data | |
| KR20150069331A (en) | Method for providing user life log and system thereof | |
| US20220115137A1 (en) | Wearable device for reducing exposure to pathogens of possible contagion | |
| US20160314185A1 (en) | Identifying events from aggregated device sensed physical data | |
| CN106126895A (en) | Healthy living behavior management system and method based on mobile terminal | |
| JP2017097401A (en) | Behavior modification analysis system, behavior modification analysis method and behavior modification analysis program | |
| JP7250647B2 (en) | Nap assistance system and program for nap assistance | |
| Khowaja et al. | Internet of Everything enabled solution for COVID-19, its new variants and future pandemics: Framework, Challenges, and Research Directions | |
| Omoloye et al. | Mathematical analysis of sensitive parameters on the dynamical transmission of Ebola-malaria co-infections | |
| Jalali et al. | Personicle: personal chronicle of life events | |
| JP6478327B2 (en) | Server and program for estimating user state in portable terminal not equipped with sensor | |
| Zhang et al. | Toward a wearable crowdsource system to monitor respiratory symptoms for pandemic early warning | |
| WO2022004404A1 (en) | Relationship estimation system | |
| Malott et al. | Detecting self-harming activities with wearable devices | |
| Stojanović et al. | Sensor data fusion and big mobility data analytics for activity recognition | |
| Puspitaningayu et al. | The emerging wireless body area network on android smartphones: a review | |
| Huang et al. | Implementation of a wireless sensor network for heart rate monitoring in a senior center | |
| Sarkar et al. | An approach to continuous pervasive care of remote patients based on priority based assignment of nurse | |
| TWI756992B (en) | Method for calculating activity duration and efficiency |
Legal Events
| Date | Code | Title | Description |
|---|---|---|---|
| A621 | Written request for application examination |
Free format text: JAPANESE INTERMEDIATE CODE: A621 Effective date: 20230508 |