JP2020060444A - Mass spectrometer, mass spectrometry, and mass spectrometry program - Google Patents
Mass spectrometer, mass spectrometry, and mass spectrometry program Download PDFInfo
- Publication number
- JP2020060444A JP2020060444A JP2018191764A JP2018191764A JP2020060444A JP 2020060444 A JP2020060444 A JP 2020060444A JP 2018191764 A JP2018191764 A JP 2018191764A JP 2018191764 A JP2018191764 A JP 2018191764A JP 2020060444 A JP2020060444 A JP 2020060444A
- Authority
- JP
- Japan
- Prior art keywords
- strain
- data
- mass
- target data
- teacher data
- Prior art date
- Legal status (The legal status is an assumption and is not a legal conclusion. Google has not performed a legal analysis and makes no representation as to the accuracy of the status listed.)
- Pending
Links
- 238000004949 mass spectrometry Methods 0.000 title claims abstract description 15
- 238000004458 analytical method Methods 0.000 claims abstract description 86
- 238000001819 mass spectrum Methods 0.000 claims abstract description 41
- 239000000654 additive Substances 0.000 claims abstract description 30
- 239000011159 matrix material Substances 0.000 claims abstract description 30
- 230000000996 additive effect Effects 0.000 claims abstract description 25
- 238000010801 machine learning Methods 0.000 claims abstract description 15
- 244000005700 microbiome Species 0.000 claims description 53
- 238000000034 method Methods 0.000 claims description 21
- 238000012706 support-vector machine Methods 0.000 claims description 15
- 238000012545 processing Methods 0.000 claims description 14
- 229910052783 alkali metal Inorganic materials 0.000 claims description 6
- 150000001340 alkali metals Chemical class 0.000 claims description 6
- 238000013528 artificial neural network Methods 0.000 claims description 6
- 150000001875 compounds Chemical class 0.000 claims description 6
- 238000001514 detection method Methods 0.000 claims description 6
- 239000004094 surface-active agent Substances 0.000 claims description 6
- WOQQAWHSKSSAGF-WXFJLFHKSA-N decyl beta-D-maltopyranoside Chemical compound O[C@@H]1[C@@H](O)[C@H](OCCCCCCCCCC)O[C@H](CO)[C@H]1O[C@@H]1[C@H](O)[C@@H](O)[C@H](O)[C@@H](CO)O1 WOQQAWHSKSSAGF-WXFJLFHKSA-N 0.000 claims description 5
- PCMORTLOPMLEFB-ONEGZZNKSA-N sinapic acid Chemical compound COC1=CC(\C=C\C(O)=O)=CC(OC)=C1O PCMORTLOPMLEFB-ONEGZZNKSA-N 0.000 claims description 5
- PCMORTLOPMLEFB-UHFFFAOYSA-N sinapinic acid Natural products COC1=CC(C=CC(O)=O)=CC(OC)=C1O PCMORTLOPMLEFB-UHFFFAOYSA-N 0.000 claims description 5
- MBKDYNNUVRNNRF-UHFFFAOYSA-N medronic acid Chemical compound OP(O)(=O)CP(O)(O)=O MBKDYNNUVRNNRF-UHFFFAOYSA-N 0.000 claims description 4
- -1 tolylene diphosphonic acid Chemical compound 0.000 claims description 2
- 230000000052 comparative effect Effects 0.000 description 14
- 238000012795 verification Methods 0.000 description 11
- 238000010586 diagram Methods 0.000 description 9
- 238000000513 principal component analysis Methods 0.000 description 8
- 238000002790 cross-validation Methods 0.000 description 6
- 239000003550 marker Substances 0.000 description 6
- 150000002500 ions Chemical class 0.000 description 4
- 241000607142 Salmonella Species 0.000 description 3
- 102000002278 Ribosomal Proteins Human genes 0.000 description 2
- 108010000605 Ribosomal Proteins Proteins 0.000 description 2
- 238000003795 desorption Methods 0.000 description 2
- 230000002068 genetic effect Effects 0.000 description 2
- 230000000813 microbial effect Effects 0.000 description 2
- 102000004169 proteins and genes Human genes 0.000 description 2
- 108090000623 proteins and genes Proteins 0.000 description 2
- 239000013598 vector Substances 0.000 description 2
- 241000193830 Bacillus <bacterium> Species 0.000 description 1
- 238000004364 calculation method Methods 0.000 description 1
- 230000000694 effects Effects 0.000 description 1
- 238000011156 evaluation Methods 0.000 description 1
- 238000002474 experimental method Methods 0.000 description 1
- 230000006870 function Effects 0.000 description 1
- 208000015181 infectious disease Diseases 0.000 description 1
- 238000000752 ionisation method Methods 0.000 description 1
- 239000004973 liquid crystal related substance Substances 0.000 description 1
- 238000001840 matrix-assisted laser desorption--ionisation time-of-flight mass spectrometry Methods 0.000 description 1
- 239000004065 semiconductor Substances 0.000 description 1
- 241000894007 species Species 0.000 description 1
- 230000001988 toxicity Effects 0.000 description 1
- 231100000419 toxicity Toxicity 0.000 description 1
Images


Classifications
-
- G—PHYSICS
- G16—INFORMATION AND COMMUNICATION TECHNOLOGY [ICT] SPECIALLY ADAPTED FOR SPECIFIC APPLICATION FIELDS
- G16B—BIOINFORMATICS, i.e. INFORMATION AND COMMUNICATION TECHNOLOGY [ICT] SPECIALLY ADAPTED FOR GENETIC OR PROTEIN-RELATED DATA PROCESSING IN COMPUTATIONAL MOLECULAR BIOLOGY
- G16B25/00—ICT specially adapted for hybridisation; ICT specially adapted for gene or protein expression
-
- G—PHYSICS
- G16—INFORMATION AND COMMUNICATION TECHNOLOGY [ICT] SPECIALLY ADAPTED FOR SPECIFIC APPLICATION FIELDS
- G16C—COMPUTATIONAL CHEMISTRY; CHEMOINFORMATICS; COMPUTATIONAL MATERIALS SCIENCE
- G16C20/00—Chemoinformatics, i.e. ICT specially adapted for the handling of physicochemical or structural data of chemical particles, elements, compounds or mixtures
- G16C20/20—Identification of molecular entities, parts thereof or of chemical compositions
-
- G—PHYSICS
- G16—INFORMATION AND COMMUNICATION TECHNOLOGY [ICT] SPECIALLY ADAPTED FOR SPECIFIC APPLICATION FIELDS
- G16B—BIOINFORMATICS, i.e. INFORMATION AND COMMUNICATION TECHNOLOGY [ICT] SPECIALLY ADAPTED FOR GENETIC OR PROTEIN-RELATED DATA PROCESSING IN COMPUTATIONAL MOLECULAR BIOLOGY
- G16B40/00—ICT specially adapted for biostatistics; ICT specially adapted for bioinformatics-related machine learning or data mining, e.g. knowledge discovery or pattern finding
- G16B40/10—Signal processing, e.g. from mass spectrometry [MS] or from PCR
-
- G—PHYSICS
- G01—MEASURING; TESTING
- G01N—INVESTIGATING OR ANALYSING MATERIALS BY DETERMINING THEIR CHEMICAL OR PHYSICAL PROPERTIES
- G01N27/00—Investigating or analysing materials by the use of electric, electrochemical, or magnetic means
- G01N27/62—Investigating or analysing materials by the use of electric, electrochemical, or magnetic means by investigating the ionisation of gases, e.g. aerosols; by investigating electric discharges, e.g. emission of cathode
-
- G—PHYSICS
- G06—COMPUTING; CALCULATING OR COUNTING
- G06N—COMPUTING ARRANGEMENTS BASED ON SPECIFIC COMPUTATIONAL MODELS
- G06N20/00—Machine learning
- G06N20/10—Machine learning using kernel methods, e.g. support vector machines [SVM]
-
- G—PHYSICS
- G06—COMPUTING; CALCULATING OR COUNTING
- G06N—COMPUTING ARRANGEMENTS BASED ON SPECIFIC COMPUTATIONAL MODELS
- G06N5/00—Computing arrangements using knowledge-based models
- G06N5/04—Inference or reasoning models
-
- G—PHYSICS
- G16—INFORMATION AND COMMUNICATION TECHNOLOGY [ICT] SPECIALLY ADAPTED FOR SPECIFIC APPLICATION FIELDS
- G16B—BIOINFORMATICS, i.e. INFORMATION AND COMMUNICATION TECHNOLOGY [ICT] SPECIALLY ADAPTED FOR GENETIC OR PROTEIN-RELATED DATA PROCESSING IN COMPUTATIONAL MOLECULAR BIOLOGY
- G16B40/00—ICT specially adapted for biostatistics; ICT specially adapted for bioinformatics-related machine learning or data mining, e.g. knowledge discovery or pattern finding
-
- G—PHYSICS
- G06—COMPUTING; CALCULATING OR COUNTING
- G06N—COMPUTING ARRANGEMENTS BASED ON SPECIFIC COMPUTATIONAL MODELS
- G06N20/00—Machine learning
-
- G—PHYSICS
- G16—INFORMATION AND COMMUNICATION TECHNOLOGY [ICT] SPECIALLY ADAPTED FOR SPECIFIC APPLICATION FIELDS
- G16B—BIOINFORMATICS, i.e. INFORMATION AND COMMUNICATION TECHNOLOGY [ICT] SPECIALLY ADAPTED FOR GENETIC OR PROTEIN-RELATED DATA PROCESSING IN COMPUTATIONAL MOLECULAR BIOLOGY
- G16B40/00—ICT specially adapted for biostatistics; ICT specially adapted for bioinformatics-related machine learning or data mining, e.g. knowledge discovery or pattern finding
- G16B40/20—Supervised data analysis
-
- G—PHYSICS
- G16—INFORMATION AND COMMUNICATION TECHNOLOGY [ICT] SPECIALLY ADAPTED FOR SPECIFIC APPLICATION FIELDS
- G16C—COMPUTATIONAL CHEMISTRY; CHEMOINFORMATICS; COMPUTATIONAL MATERIALS SCIENCE
- G16C20/00—Chemoinformatics, i.e. ICT specially adapted for the handling of physicochemical or structural data of chemical particles, elements, compounds or mixtures
- G16C20/80—Data visualisation
Abstract
Description
本発明は、微生物を同定する質量分析装置、質量分析方法および質量分析プログラムに関する。 The present invention relates to a mass spectrometer, a mass spectrometry method, and a mass spectrometry program for identifying a microorganism.
種々の微生物のサンプルを同定するために質量分析装置が用いられる。複数のサンプルについて得られた複数のマススペクトルを比較することにより、各サンプルを識別するためのマーカピークを検出することができる。MALDI−MS(マトリックス支援レーザ脱離イオン化質量分析法)による微生物同定システム(以下、MALDI−MSシステムと呼ぶ。)は、迅速性および低コスト性に優れ、近年、臨床現場で急速に普及している。 Mass spectrometers are used to identify samples of various microorganisms. A marker peak for identifying each sample can be detected by comparing the plurality of mass spectra obtained for the plurality of samples. A microbial identification system by MALDI-MS (Matrix Assisted Laser Desorption / Ionization Mass Spectrometry) (hereinafter referred to as MALDI-MS system) is excellent in rapidity and low cost, and has been rapidly popularized in clinical sites in recent years. There is.
現時点では、臨床現場においては、MALDI−MSシステムによる微生物同定は種レベルの識別に留まっている。一方で、学術研究においては、微生物が菌株レベルで識別されたことが報告されている。例えば、非特許文献1では、遺伝子情報に基づいて特定の株にのみ発現するタンパク質(主にリボソームタンパク質)の理論質量が算出される。算出された理論質量に対応する質量電荷比におけるピーク(マーカピーク)の有無により株の識別が行われる。
At present, microbial identification by the MALDI-MS system is limited to species-level identification in clinical practice. On the other hand, academic studies have reported that microorganisms were identified at the strain level. For example, in
臨床現場においても、微生物の株の識別が実用化されることにより、微生物の感染ルートの解明または毒性の有無の判別が可能になることが期待されている。しかしながら、微生物の株を高い精度で識別することは容易ではない。 It is expected that even in the clinical field, the practical application of the identification of the strain of the microorganism will enable the elucidation of the infection route of the microorganism or the determination of the presence or absence of toxicity. However, it is not easy to identify strains of microorganisms with high accuracy.
本発明の目的は、微生物の株の識別の精度を向上させることが可能な質量分析装置、質量分析方法および質量分析プログラムを提供することである。 An object of the present invention is to provide a mass spectroscope, a mass spectrometric method, and a mass spectrometric program capable of improving the accuracy of identifying a microorganism strain.
本発明者らは、複数のマススペクトルを用いて機械学習を行うことにより微生物の株を識別するための判別分析モデルを作成することを検討した。そして、種々の実験および考察を行った結果、各マススペクトルにおけるピーク強度のばらつきを抑制することにより、株の識別に用いることが可能な判別分析モデルを作成することができるという知見を得た。これらの知見に基づいて、以下の本発明に想到した。 The present inventors examined creating a discriminant analysis model for identifying a strain of a microorganism by performing machine learning using a plurality of mass spectra. As a result of various experiments and consideration, it was found that a discriminant analysis model that can be used for strain identification can be created by suppressing the variation in peak intensity in each mass spectrum. Based on these findings, the present invention has been made as follows.
(1)第1の発明に係る質量分析装置は、微生物の株を識別する質量分析装置であって、株が既知の微生物を含みかつ添加剤を含むとともにマトリックスが混合された複数のサンプルについての複数のマススペクトルデータの各々を教師データとして取得する教師データ取得部と、機械学習を行うことにより、教師データ取得部により取得された複数の教師データに基づいて株を識別するための判別分析モデルを作成するモデル作成部と、株が未知の微生物を含みかつ添加剤を含むとともにマトリックスが混合されたサンプルについてのマススペクトルデータを対象データとして取得する対象データ取得部と、モデル作成部により作成された株ごとの判別分析モデルと対象データ取得部により取得された対象データとに基づいて当該対象データに対応する微生物の株を識別する識別部とを備える。 (1) A mass spectrometer according to a first aspect of the present invention is a mass spectrometer for identifying a strain of a microorganism, wherein the strain contains a known microorganism, contains additives, and contains a plurality of samples mixed with a matrix. A discriminant analysis model for identifying a stock based on a plurality of teacher data acquired by the teacher data acquisition unit by performing machine learning with a teacher data acquisition unit that acquires each of a plurality of mass spectrum data as teacher data The model creation unit that creates the data, the target data acquisition unit that acquires the mass spectrum data of the sample in which the strain contains an unknown microorganism and the additive and the matrix is mixed as the target data, and the model creation unit. Based on the discriminant analysis model for each stock and the target data acquired by the target data acquisition unit. And a recognition unit for identifying a strain of microorganism which corresponds to.
この質量分析装置においては、株が既知の微生物に対応する複数のマススペクトルデータの各々が教師データとして取得される。各教師データに対応するサンプルは添加剤を含むとともにマトリックスが混合されている。機械学習を行うことにより、取得された複数の教師データに基づいて株を識別するための判別分析モデルが作成される。また、株が未知の微生物に対応するマススペクトルデータが対象データとして取得される。対象データに対応するサンプルは添加剤を含むとともにマトリックスが混合されている。作成された株ごとの判別分析モデルと取得された対象データとに基づいて当該対象データに対応する微生物の株が識別される。 In this mass spectrometer, each of a plurality of mass spectrum data corresponding to a microorganism whose strain is known is acquired as teacher data. The sample corresponding to each teacher data contains the additive and the matrix is mixed. By performing machine learning, a discriminant analysis model for identifying a stock is created based on a plurality of acquired teacher data. In addition, mass spectrum data corresponding to a microorganism whose strain is unknown is acquired as target data. The sample corresponding to the data of interest contains the additive and the matrix is mixed. Based on the created discriminant analysis model for each strain and the acquired target data, the strain of the microorganism corresponding to the target data is identified.
この構成によれば、各教師データにおけるピーク強度のばらつきが抑制される。そのため、取得される複数の教師データを機械学習することにより、株の識別に用いることが可能な判別分析モデルを作成することができる。また、各教師データと同様に、対象データにおけるピーク強度のばらつきが抑制される。これにより、作成された判別分析モデルと対象データとに基づいて対象データに対応する微生物の株を高い精度で識別することができる。その結果、微生物の株の識別の精度が向上する。 According to this configuration, variations in peak intensity among the teacher data are suppressed. Therefore, by machine learning a plurality of acquired teacher data, it is possible to create a discriminant analysis model that can be used for stock identification. Further, as in the case of each teacher data, variation in peak intensity in target data is suppressed. As a result, the strain of the microorganism corresponding to the target data can be identified with high accuracy based on the created discriminant analysis model and the target data. As a result, the accuracy of identifying the microorganism strain is improved.
(2)添加剤は、アルカリ金属付加イオン検出を抑制する化合物および界面活性剤の少なくとも一方を含んでもよい。この場合、複数の教師データおよび対象データの各々におけるピーク強度のばらつきを効率的に抑制することができる。 (2) The additive may include at least one of a compound that suppresses the detection of alkali metal addition ions and a surfactant. In this case, it is possible to efficiently suppress variations in peak intensity in each of the plurality of teacher data and the target data.
(3)添加剤は、メチレンジホスホン酸またはデシル−β−D−マルトピラノシドを含んでもよい。この場合、複数の教師データおよび対象データの各々におけるピーク強度のばらつきをより効率的に抑制することができる。 (3) The additive may include methylenediphosphonic acid or decyl-β-D-maltopyranoside. In this case, it is possible to more efficiently suppress variations in peak intensity in each of the plurality of teacher data and the target data.
(4)モデル作成部は、サポートベクターマシンまたはニューラルネットワークにより判別分析モデルを作成してもよい。この場合、高い精度で株を識別するための判別分析モデルを容易に作成することができる。 (4) The model creating unit may create the discriminant analysis model by a support vector machine or a neural network. In this case, a discriminant analysis model for identifying strains with high accuracy can be easily created.
(5)マトリックスはシナピン酸を含んでもよい。この場合、複数の教師データおよび対象データの各々を容易に取得することができる。また、複数の教師データおよび対象データの各々におけるピーク強度のばらつきを効率的に抑制することができる。 (5) The matrix may include sinapinic acid. In this case, each of the plurality of teacher data and the target data can be easily acquired. Further, it is possible to efficiently suppress the variation in peak intensity in each of the plurality of teacher data and the target data.
(6)第2の発明に係る質量分析方法は、微生物の株を識別する質量分析方法であって、株が既知の微生物を含みかつ添加剤を含むとともにマトリックスが混合された複数のサンプルについての複数のマススペクトルデータの各々を教師データとして取得するステップと、機械学習を行うことにより、取得された複数の教師データに基づいて株を識別するための判別分析モデルを作成するステップと、株が未知の微生物を含みかつ添加剤を含むとともにマトリックスが混合されたサンプルについてのマススペクトルデータを対象データとして取得するステップと、作成された株ごとの判別分析モデルと取得された対象データとに基づいて当該対象データに対応する微生物の株を識別するステップとを含む。 (6) The mass spectrometric method according to the second aspect of the present invention is a mass spectrometric method for identifying a strain of a microorganism, wherein the strain includes a plurality of samples containing known microorganisms, containing additives, and mixed with a matrix. A step of acquiring each of the plurality of mass spectrum data as teacher data, a step of creating a discriminant analysis model for identifying a stock based on the plurality of acquired teacher data by performing machine learning, and a stock Based on the step of obtaining the mass spectrum data of the sample containing the unknown microorganism and containing the additive and the matrix mixed as the target data, the discriminant analysis model for each strain created and the target data obtained Identifying the strain of the microorganism corresponding to the target data.
この質量分析方法によれば、作成された判別分析モデルと対象データとに基づいて対象データに対応する微生物の株を高い精度で識別することができる。その結果、微生物の株の識別の精度が向上する。 According to this mass spectrometry method, the strain of the microorganism corresponding to the target data can be identified with high accuracy based on the created discriminant analysis model and the target data. As a result, the accuracy of identifying the microorganism strain is improved.
(7)添加剤は、アルカリ金属付加イオン検出を抑制する化合物および界面活性剤の少なくとも一方を含んでもよい。この場合、複数の教師データおよび対象データの各々におけるピーク強度のばらつきを効率的に抑制することができる。 (7) The additive may include at least one of a compound that suppresses the detection of alkali metal addition ions and a surfactant. In this case, it is possible to efficiently suppress variations in peak intensity in each of the plurality of teacher data and the target data.
(8)添加剤は、チレンジホスホン酸またはデシル−β−D−マルトピラノシドを含んでもよい。この場合、複数の教師データおよび対象データの各々におけるピーク強度のばらつきをより効率的に抑制することができる。 (8) The additive may contain tolylene diphosphonic acid or decyl-β-D-maltopyranoside. In this case, it is possible to more efficiently suppress variations in peak intensity in each of the plurality of teacher data and the target data.
(9)判別分析モデルを作成するステップは、サポートベクターマシンまたはニューラルネットワークにより判別分析モデルを作成することを含んでもよい。この場合、高い精度で株を識別するための判別分析モデルを容易に作成することができる。 (9) The step of creating a discriminant analysis model may include creating a discriminant analysis model by a support vector machine or a neural network. In this case, a discriminant analysis model for identifying strains with high accuracy can be easily created.
(10)マトリックスはシナピン酸を含んでもよい。この場合、複数の教師データおよび対象データの各々を容易に取得することができる。また、複数の教師データおよび対象データの各々におけるピーク強度のばらつきを効率的に抑制することができる。 (10) The matrix may include sinapinic acid. In this case, each of the plurality of teacher data and the target data can be easily acquired. Further, it is possible to efficiently suppress the variation in peak intensity in each of the plurality of teacher data and the target data.
(11)第3の発明に係る質量分析プログラムは、処理装置により実行可能な微生物の株を識別する質量分析プログラムであって、株が既知の微生物を含みかつ添加剤を含むとともにマトリックスが混合された複数のサンプルについての複数のマススペクトルデータの各々を教師データとして取得する処理と、機械学習を行うことにより、取得された複数の教師データに基づいて株を識別するための判別分析モデルを作成する処理と、株が未知の微生物を含みかつ添加剤を含むとともにマトリックスが混合されたサンプルについてのマススペクトルデータを対象データとして取得する処理と、作成された株ごとの判別分析モデルと取得された対象データとに基づいて当該対象データに対応する微生物の株を識別する処理とを、処理装置に実行させる。 (11) A mass spectrometric program according to a third aspect of the present invention is a mass spectrometric program capable of identifying a strain of a microorganism that can be executed by a processing device, wherein the strain contains a known microorganism, contains additives, and is mixed with a matrix. Creates a discriminant analysis model for identifying stocks based on multiple acquired teacher data by performing processing to acquire each of multiple mass spectrum data for multiple samples as teacher data and machine learning. And the process of obtaining the mass spectrum data of the sample in which the strain contains an unknown microorganism and contains the additive and the matrix is mixed as the target data, and the discriminant analysis model for each strain created Perform processing on the processing device to identify the microorganism strain corresponding to the target data based on the target data To.
この質量分析プログラムによれば、作成された判別分析モデルと対象データとに基づいて対象データに対応する微生物の株を高い精度で識別することができる。その結果、微生物の株の識別の精度が向上する。 According to this mass spectrometry program, the strain of the microorganism corresponding to the target data can be identified with high accuracy based on the created discriminant analysis model and the target data. As a result, the accuracy of identifying the microorganism strain is improved.
本発明によれば、微生物の株の識別の精度を向上させることができる。 According to the present invention, the accuracy of identifying a strain of a microorganism can be improved.
(1)質量分析装置の構成
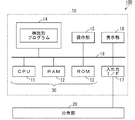
以下、本発明の実施の形態に係る質量分析装置、質量分析方法および株識別プログラムについて図面を参照しながら詳細に説明する。図1は、本発明の一実施の形態に係る質量分析装置の構成を示す図である。図1においては、主として質量分析装置100のハードウエアの構成が示される。図1に示すように、質量分析装置100は、処理装置10および分析部20を含む。
(1) Configuration of Mass Spectrometer Hereinafter, a mass spectrometer, a mass spectrometric method, and a stock identification program according to embodiments of the present invention will be described in detail with reference to the drawings. FIG. 1 is a diagram showing the configuration of a mass spectrometer according to an embodiment of the present invention. In FIG. 1, the hardware configuration of the
処理装置10は、CPU(中央演算処理装置)11、RAM(ランダムアクセスメモリ)12、ROM(リードオンリメモリ)13、記憶装置14、操作部15、表示部16および入出力I/F(インターフェイス)17により構成される。CPU11、RAM12、ROM13、記憶装置14、操作部15、表示部16および入出力I/F17はバス18に接続される。CPU11、RAM12およびROM13が株識別装置30を構成する。
The
RAM12は、CPU11の作業領域として用いられる。ROM13にはシステムプログラムが記憶される。記憶装置14は、ハードディスクまたは半導体メモリ等の記憶媒体を含み、株識別プログラムを記憶する。CPU11が記憶装置14に記憶された株識別プログラムをRAM12上で実行することにより、後述する株識別処理が行われる。
The
操作部15は、キーボード、マウスまたはタッチパネル等の入力デバイスである。使用者は、操作部15を操作することにより、分析部20または株識別装置30に所定の指示を与えることができる。表示部16は、液晶表示装置等の表示デバイスであり、株識別装置30による株識別の結果を表示する。入出力I/F17は、分析部20に接続される。
The
分析部20は、MALDI(マトリックス支援レーザ脱離イオン化法)を用いて、微生物の種々のサンプルのマススペクトルを示すマススペクトルデータを生成する。サンプルは、株が既知であるサンプル(以下、教師サンプルと呼ぶ。)と、株が未知である識別対象のサンプル(以下、対象サンプルと呼ぶ。)とを含む。教師サンプルおよび対象サンプルの各々には、マトリックスが混合される。また、教師サンプルおよび対象サンプルの各々は、所定の添加剤を含む。
The
マトリックスは、例えばシナピン酸を含む。添加剤は、アルカリ金属付加イオンの検出を抑制する化合物および界面活性剤の少なくとも一方を含む。具体的には、アルカリ金属付加イオンの検出を抑制する化合物は、メチレンジホスホン酸(MDPNA:methylenediphosphonic acid)を含む。界面活性剤は、デシル−β−D−マルトピラノシド(DMP:decyl-B-D-maltopyranoside)を含む。これらにより、生成されたマススペクトルデータにおけるピーク強度のばらつきを抑制することができる。 The matrix comprises, for example, sinapinic acid. The additive contains at least one of a compound that suppresses the detection of alkali metal adduct ions and a surfactant. Specifically, the compound that suppresses the detection of alkali metal addition ions includes methylenediphosphonic acid (MDPNA). Surfactants include decyl-β-D-maltopyranoside (DMP). As a result, it is possible to suppress variations in peak intensity in the generated mass spectrum data.
株識別装置30は、複数の教師サンプルにそれぞれ対応する複数のマススペクトルデータに基づいて判別分析モデルを作成する。また、株識別装置30は、作成された判別分析モデルに基づいて対象サンプルの株を識別する。以下、株識別装置30の動作について説明する。
The
(2)株識別装置
図2は、株識別装置30の構成を示す図である。図3は、図2の株識別装置30により作成される判別分析モデルを説明するための図である。図2に示すように、株識別装置30は、機能部として、教師データ取得部31、株情報取得部32、モデル作成部33、対象データ取得部34および識別部35を含む。図1のCPU11が記憶装置14に記憶された株識別プログラムを実行することにより、株識別装置30の機能部が実現される。株識別装置30の機能部の一部または全てが電子回路等のハードウエアにより実現されてもよい。
(2) Stock Identification Device FIG. 2 is a diagram showing the configuration of the
教師データ取得部31は、分析部20により生成された複数の教師サンプルにそれぞれ対応する複数のマススペクトルデータ(以下、教師データと呼ぶ。)を取得する。使用者は、操作部15を操作することにより、分析部20に所望の複数の教師データを教師データ取得部31に与えるように指示することができる。図2の例では、教師データ取得部31は複数の教師データを分析部20から直接取得するが、本発明はこれに限定されない。分析部20により生成された複数の教師データが図1の記憶装置14に記憶されている場合には、教師データ取得部31は、複数の教師データを記憶装置14から取得してもよい。
The teacher
株情報取得部32は、教師データ取得部31により取得された複数の教師データにそれぞれ対応する複数の教師サンプルの各々の株を示す株情報を操作部15から取得する。使用者は、操作部15を操作することにより、複数の教師データにそれぞれ対応する複数の教師サンプルの各々の株情報を株情報取得部32に与えることができる。
The stock
なお、使用者は、分析部20により教師データが生成される際に、当該教師データに対応する株情報を分析部20に登録してもよい。この場合、各教師データと、これに対応する株情報とを紐付けた状態で一体的に取り扱うことが可能となる。したがって、教師データ取得部31により教師データが取得される際に、当該教師データに対応する株情報が株情報取得部32により自動的に分析部20または記憶装置14から取得される。
It should be noted that the user may register the stock information corresponding to the teacher data in the
モデル作成部33は、株情報取得部32により取得された株情報に基づいて、教師データ取得部31により取得された複数の教師データを株ごとに分類する。また、モデル作成部33は、同一の株に分類された複数の教師データを用い、機械学習(教師あり学習)を行うことにより当該株を識別するためのマススペクトルのパターンを判別分析モデルとして作成する。判別分析モデルは、サポートベクターマシン(SVM:support vector machine)またはニューラルネットワーク(NN:neural network)により作成されることが好ましい。
The
図3(a)の左欄には、第1の株に分類された複数の教師データに基づく複数のマススペクトルが示される。図3(a)の右欄には、図3(a)左欄の複数の教師データを機械学習することにより作成された第1の株を識別するための判別分析モデルが示される。図3(b)の左欄には、第2の株に分類された複数の教師データに基づく複数のマススペクトルが示される。図3(b)の右欄には、図3(b)左欄の複数の教師データを機械学習することにより作成された第2の株を識別するための判別分析モデルが示される。 The left column of FIG. 3A shows a plurality of mass spectra based on a plurality of teacher data classified into the first stock. The right column of FIG. 3A shows a discriminant analysis model for identifying the first stock created by machine learning the plurality of teacher data in the left column of FIG. 3A. In the left column of FIG. 3B, a plurality of mass spectra based on a plurality of teacher data classified into the second strain are shown. The right column of FIG. 3B shows a discriminant analysis model for identifying the second stock created by machine learning the plurality of teacher data in the left column of FIG. 3B.
図3の例では、判別分析モデルは連続波形を対象とするが、本発明はこれに限定されない。判別分析モデルは離散的なピークリスト(ピークの質量電荷比とピーク強度との組)を対象としてもよい。なお、理解を容易にするために、図3(a)における各マススペクトルと図3(b)における各マススペクトルとは、明確に識別できるように脚色して異なるパターンで図示されている。しかしながら、実際には、一の株に対応するマススペクトルと他の株に対応するマススペクトルとは、類似したパターンを有し、識別することが困難であることも多い。 In the example of FIG. 3, the discriminant analysis model targets a continuous waveform, but the present invention is not limited to this. The discriminant analysis model may target a discrete peak list (a set of peak mass-to-charge ratio and peak intensity). For easy understanding, each mass spectrum in FIG. 3 (a) and each mass spectrum in FIG. 3 (b) are dramatized and shown in different patterns for clear identification. However, in practice, the mass spectrum corresponding to one strain and the mass spectrum corresponding to another strain have similar patterns, and it is often difficult to distinguish them.
対象データ取得部34は、分析部20により生成された対象サンプルに対応するマススペクトルデータ(以下、対象データと呼ぶ。)を取得する。使用者は、操作部15を操作することにより、分析部20に所望の対象データを対象データ取得部34に与えるように指示することができる。図2の例では、対象データ取得部34は対象データを分析部20から直接取得するが、本発明はこれに限定されない。分析部20により生成された対象データが記憶装置14に記憶されている場合には、対象データ取得部34は、対象データを記憶装置14から取得してもよい。
The target
識別部35は、モデル作成部33により作成された判別分析モデルと対象データ取得部34により取得された対象データとに基づいて、対象サンプルの株を識別する。具体的には、対象データに基づくマススペクトルと、複数の株にそれぞれ対応する複数の判別分析モデルの各々とのパターン認証が行われる。マススペクトルへの一致度が最も高い判別分析モデルに対応する株が、対象サンプルの株として識別される。識別部35は、識別された株を表示部16に表示させる。
The
(3)株識別処理
図4は、株識別プログラムにより行われる株識別処理のアルゴリズムを示すフローチャートである。以下、図2の株識別装置30および図4のフローチャートを用いて株識別処理を説明する。なお、以下の説明では、教師データおよび対象データは分析部20から取得されるが、記憶装置14から取得されてもよい。
(3) Stock Identification Processing FIG. 4 is a flowchart showing an algorithm of stock identification processing performed by the stock identification program. The stock identifying process will be described below with reference to the
まず、教師データ取得部31は、分析部20から教師データを取得する(ステップS1)。本実施の形態においては、各教師データと、これに対応する株情報とが紐付けられた状態で分析部20に登録されている。そのため、ステップS1において、株情報取得部32は株情報を分析部20から取得する。
First, the teacher
次に、教師データ取得部31は、教師データの取得の終了が指示されたか否かを判定する(ステップS2)。使用者は、操作部15を操作することにより教師データの取得の終了を教師データ取得部31に指示することができる。教師データの取得の終了が指示されない場合、教師データ取得部31は、ステップS1に戻る。教師データの取得の終了が指示されるまでステップS1,S2が繰り返される。これにより、複数の教師データが取得される。
Next, the teacher
教師データの取得の終了が指示された場合、モデル作成部33は、ステップS1で取得された教師データと株情報とに基づいて、判別分析モデルを作成する(ステップS3)。なお、ステップS1で複数の株の各々について複数組の教師データと株情報とが取得された場合には、モデル作成部33は判別分析モデルを株ごとに作成する。対象データ取得部34は、分析部20から対象データを取得する(ステップS4)。ステップS4は、ステップS3と同時に実行されてもよいし、ステップS4よりも前の時点に実行されてもよい。
When the end of acquisition of the teacher data is instructed, the
識別部35は、ステップS3で作成された判別分析モデルと、ステップS4で取得された対象データに基づくマススペクトルとのパターン認証を行う(ステップS5)。その後、識別部35は、ステップS3で作成された全部の判別分析モデルについてパターン認証が行われたか否かを判定する(ステップS6)。全部の判別分析モデルについてパターン認証が行われていない場合、識別部35はステップS5に戻る。全部の判別分析モデルについてパターン認証が行われるまでステップS5,S6が繰り返される。
The
全部の判別分析モデルについてパターン認証が行われた場合、識別部35は、ステップS5の認証結果に基づいて対象サンプルの株を識別する(ステップS7)。最後に、識別部35は、ステップS7で識別された株を表示部16に表示させ(ステップS8)、株識別処理を終了する。
When the pattern authentication is performed for all the discriminant analysis models, the
(4)効果
本実施の形態に係る質量分析装置100においては、株が既知の微生物に対応する複数のマススペクトルデータの各々が教師データとして教師データ取得部31により取得される。各教師データに対応するサンプルは添加剤を含むとともにマトリックスが混合されている。機械学習を行うことにより、教師データ取得部31により取得された複数の教師データに基づいて株を識別するための判別分析モデルがモデル作成部33により作成される。
(4) Effects In the
また、株が未知の微生物に対応するマススペクトルデータが対象データとして対象データ取得部34により取得される。対象データに対応するサンプルは添加剤を含むとともにマトリックスが混合されている。モデル作成部33により作成された株ごとの判別分析モデルと対象データ取得部34により取得された対象データとに基づいて当該対象データに対応する微生物の株が識別部35により識別される。
In addition, the target
この構成によれば、各教師データにおけるピーク強度のばらつきが抑制される。そのため、取得される複数の教師データを機械学習することにより、株の識別に用いることが可能な判別分析モデルを作成することができる。また、各教師データと同様に、対象データにおけるピーク強度のばらつきが抑制される。これにより、作成された判別分析モデルと対象データとに基づいて対象データに対応する微生物の株を高い精度で識別することができる。その結果、微生物の株の識別の精度が向上する。 According to this configuration, variations in peak intensity among the teacher data are suppressed. Therefore, by machine learning a plurality of acquired teacher data, it is possible to create a discriminant analysis model that can be used for stock identification. Further, as in the case of each teacher data, variation in peak intensity in target data is suppressed. As a result, the strain of the microorganism corresponding to the target data can be identified with high accuracy based on the created discriminant analysis model and the target data. As a result, the accuracy of identifying the microorganism strain is improved.
(5)参考例
微生物の株の識別の手法として、非特許文献1に記載されたようにマーカピークを判定することが考えられる。図5は、サルモネラ菌のマススペクトルを示す図である。図5の横軸は質量電荷比を示し、縦軸はピーク強度を示す。遺伝子情報に基づいて図5のサルモネラ菌の株にのみ発現するタンパク質の理論質量を算出すると、質量電荷比23000の付近にマーカピークが存在することが予想される。
(5) Reference Example As a method for identifying a strain of a microorganism, it is possible to determine a marker peak as described in
しかしながら、図5に示すように、質量電荷比23000の付近には複数のピークが存在する。また、各ピーク強度は比較的低い。このように、ピーク強度が低い場合、またはマーカピークが他のピークと近接している場合には、マーカピークの有無を高い精度で安定的に判定することは困難である。 However, as shown in FIG. 5, there are a plurality of peaks near the mass-to-charge ratio of 23000. Also, the intensity of each peak is relatively low. Thus, when the peak intensity is low, or when the marker peak is close to other peaks, it is difficult to stably determine the presence or absence of the marker peak with high accuracy.
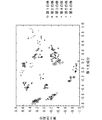
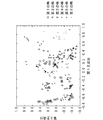
微生物の株の識別の他の手法として、主成分分析が考えられる。具体的には、第1〜第6の株のいずれかに分類される微生物のサンプルが複数準備され、各サンプルについてマススペクトルが測定された。また、サンプルごとにピーク強度の列からなるベクトルが作成され、作成された複数のベクトルを入力とする主成分分析が行われた。なお、主成分分析の演算方法についてはよく知られているので、ここでは説明を省略する。 Principal component analysis can be considered as another method of identifying strains of microorganisms. Specifically, a plurality of samples of microorganisms classified into any of the first to sixth strains were prepared, and the mass spectrum was measured for each sample. In addition, a vector consisting of a column of peak intensities was created for each sample, and principal component analysis was performed using the created multiple vectors as input. Note that the calculation method of the principal component analysis is well known, and therefore the description thereof is omitted here.
図6および図7は、複数のサンプルについての主成分分析の結果を示す図である。図6の横軸は第1主成分を示し、縦軸は第2主成分を示す。図7の横軸は第1主成分を示し、縦軸は第3主成分を示す。第1〜第3の主成分は、複数のピーク強度の線形結合量である。また、図6および図7においては、同一の株に分類される微生物のサンプルについての主成分分析の結果が同一の指標により示されるように、複数の指標「〇」、「□」、「◇」、「×」、「+」および「・」がプロットされる。 6 and 7 are diagrams showing the results of the principal component analysis for a plurality of samples. The horizontal axis of FIG. 6 represents the first principal component, and the vertical axis represents the second principal component. The horizontal axis of FIG. 7 represents the first principal component and the vertical axis represents the third principal component. The first to third main components are linear combination amounts of a plurality of peak intensities. In addition, in FIG. 6 and FIG. 7, a plurality of indexes “◯”, “□”, “◇” are provided so that the results of the principal component analysis for the samples of the microorganisms classified into the same strain are shown by the same index. , “×”, “+” and “•” are plotted.
図6および図7に示すように、同一の株に対応する指標はクラスタを形成する傾向がある。しかしながら、同一の指標により形成されるクラスタは、複数の領域に分離して存在する。また、一の指標により形成されるクラスタと他の指標により形成されるクラスタとは互いに重複する。そのため、主成分分析のようにピーク強度の線形結合量等を評価関数とする単純な識別方法によっては、微生物の株を高い精度で識別するのは困難であることが示唆される。 As shown in FIGS. 6 and 7, indicators corresponding to the same strain tend to form clusters. However, the cluster formed by the same index exists separately in a plurality of regions. Further, a cluster formed by one index and a cluster formed by another index overlap each other. Therefore, it is suggested that it is difficult to identify the strain of the microorganism with high accuracy by a simple identification method such as a principal component analysis that uses a linear combination amount of peak intensities as an evaluation function.
(6)実施例
以下の実施例では、上記実施の形態に基づいてSVMにより作成された判別分析モデルを用いてサンプルの株が識別された。一方で、比較例では、一般の線形判別法により作成された線形モデルを用いてサンプルの株が識別された。実施例および比較例の各々における誤識別率がホールドアウト検証および交差検証(cross validation)の各々により評価された。以下に詳細を説明する。
(6) Examples In the following examples, sample strains were identified using the discriminant analysis model created by SVM based on the above-described embodiment. On the other hand, in the comparative example, the sample strain was identified using a linear model created by a general linear discriminant method. The misidentification rate in each of the examples and comparative examples was evaluated by each of holdout verification and cross validation. The details will be described below.
(a)ホールドアウト検証
2日間にわたって、株が既知である205個のサンプルの各々についてのマススペクトルデータ(以下、単にデータと呼ぶ。)が生成された。具体的には、第1日目に107個のデータが生成され、第2日目に98個のデータが生成された。生成された205個のデータの一部または全部を用いて、教師データと対象データとの組み合わせが複数定義された。
(A) Holdout Verification Mass spectrum data (hereinafter, simply referred to as data) was generated for each of 205 samples of known strains over 2 days. Specifically, 107 data were generated on the first day and 98 data were generated on the second day. Using some or all of the generated 205 pieces of data, a plurality of combinations of teacher data and target data are defined.
図8は、ホールドアウト検証における教師データおよび対象データの組み合わせを説明するための図である。図8に示すように、第1の組み合わせにおいては、同日に生成された49個のデータが教師データとされ、教師データと同日に生成された他の49個のデータが対象データとされた。第2の組み合わせにおいては、第1日目に生成された107個のデータが教師データとされ、第2日目に生成された98個のデータが対象データとされた。第3の組み合わせにおいては、2日間にわたって生成された102個のデータが教師データとされ、他の103個のデータが対象データとされた。 FIG. 8 is a diagram for explaining a combination of teacher data and target data in holdout verification. As shown in FIG. 8, in the first combination, 49 pieces of data generated on the same day were used as teacher data, and other 49 pieces of data generated on the same day as the teacher data were used as target data. In the second combination, 107 pieces of data generated on the first day were used as teacher data, and 98 pieces of data generated on the second day were used as target data. In the third combination, 102 pieces of data generated over two days were used as teacher data, and the other 103 pieces of data were used as target data.
実施例では、第1の組み合わせの教師データを用いてSVMにより作成された判別分析モデルに基づいて第1の組み合わせの各対象データの株が識別された。同様に、第2の組み合わせの教師データを用いてSVMにより作成された判別分析モデルに基づいて第2の組み合わせの各対象データの株が識別された。第3の組み合わせの教師データを用いてSVMにより作成された判別分析モデルに基づいて第3の組み合わせの各対象データの株が識別された。 In the example, the strain of each target data of the first combination was identified based on the discriminant analysis model created by SVM using the teacher data of the first combination. Similarly, the strain of each target data of the second combination was identified based on the discriminant analysis model created by SVM using the teacher data of the second combination. A strain of each target data of the third combination was identified based on the discriminant analysis model created by SVM using the teacher data of the third combination.
なお、上記の205個のデータの生成の際には、全部のサンプルにマトリックスが混合され、添加剤が配合された。サンプルにマトリックスが混合されない場合、または添加剤が配合されない場合には、データにおけるノイズ成分が増加するとともに、ピーク強度のばらつきが大きくなり、判別分析モデルを作成することができなかった。 In addition, when generating the above-mentioned 205 data, the matrix was mixed with all the samples and the additives were blended. When the matrix was not mixed with the sample or when the additive was not mixed, the noise component in the data increased and the variation in the peak intensity became large, and the discriminant analysis model could not be created.
比較例では、第1の組み合わせの教師データを用いて線形判別法により作成された線形モデルに基づいて第1の組み合わせの各対象データの株が識別された。同様に、第2の組み合わせの教師データを用いて線形判別法により作成された線形モデルに基づいて第2の組み合わせの各対象データの株が識別された。第3の組み合わせの教師データを用いて線形判別法により作成された線形モデルに基づいて第3の組み合わせの各対象データの株が識別された。 In the comparative example, the strain of each target data of the first combination was identified based on the linear model created by the linear discriminant method using the teacher data of the first combination. Similarly, the strain of each target data of the second combination was identified based on the linear model created by the linear discriminant method using the teacher data of the second combination. The strain of each target data of the third combination was identified based on the linear model created by the linear discriminant method using the teacher data of the third combination.
また、実施例および比較例における誤識別率がホールドアウト検証により評価された。図9は、ホールドアウト検証による実施例および比較例における誤識別率を示す図である。図9(a)に示すように、実施例における第1〜第3の組み合わせに対応する誤識別率は、それぞれ12%、5%および3%となった。図9(b)に示すように、比較例における第1〜第3の組み合わせに対応する誤識別率は、それぞれ12%、44%および27%となった。ホールドアウト検証による実施例と比較例との比較の結果、SVMにより作成された判別分析モデルを用いることにより、高い精度で株を識別することが可能であることが確認された。 In addition, the misidentification rate in Examples and Comparative Examples was evaluated by holdout verification. FIG. 9 is a diagram showing misidentification rates in the example and the comparative example by the holdout verification. As shown in FIG. 9A, the misidentification rates corresponding to the first to third combinations in the example were 12%, 5% and 3%, respectively. As shown in FIG. 9B, the misidentification rates corresponding to the first to third combinations in the comparative example were 12%, 44% and 27%, respectively. As a result of comparison between the example and the comparative example by holdout verification, it was confirmed that the strain can be identified with high accuracy by using the discriminant analysis model created by SVM.
(b)交差検証
図10は、交差検証における教師データおよび対象データの組み合わせを説明するための図である。図10に示すように、第4の組み合わせにおいては、第1の組み合わせの教師データのうち、無作為に選択された1/10のデータが対象データとされ、他のデータが教師データとされた。第5の組み合わせにおいては、第2の組み合わせの教師データのうち、無作為に選択された1/10のデータが対象データとされ、他のデータが教師データとされた。第6の組み合わせにおいては、第3の組み合わせの教師データのうち、無作為に選択された1/10のデータが対象データとされ、他のデータが教師データとされた。
(B) Cross-validation FIG. 10 is a diagram for explaining a combination of teacher data and target data in cross-validation. As shown in FIG. 10, in the fourth combination, among the teacher data of the first combination, 1/10 randomly selected data is the target data, and the other data is the teacher data. . In the fifth combination, out of the teacher data of the second combination, 1/10 randomly selected data is the target data, and the other data is the teacher data. In the sixth combination, among the teacher data of the third combination, 1/10 randomly selected data is the target data, and the other data is the teacher data.
交差検証においては、上記の教師データの無作為の選択は複数回繰り返される。したがって、選択が行われるごとに対象データが変化するとともに、教師データが変化する。 In cross-validation, the above random selection of teacher data is repeated multiple times. Therefore, the target data changes and the teacher data changes each time selection is made.
実施例では、第4の組み合わせの教師データが選択されるごとに、当該教師データを用いてSVMにより作成された判別分析モデルに基づいて第4の組み合わせの各対象データの株が識別された。同様に、第5の組み合わせの教師データが選択されるごとに、当該教師データを用いてSVMにより作成された判別分析モデルに基づいて第5の組み合わせの各対象データの株が識別された。第6の組み合わせの教師データが選択されるごとに、当該教師データを用いてSVMにより作成された判別分析モデルに基づいて第6の組み合わせの各対象データの株が識別された。 In the embodiment, each time the teacher data of the fourth combination is selected, the strain of each target data of the fourth combination is identified based on the discriminant analysis model created by SVM using the teacher data. Similarly, each time the teacher data of the fifth combination is selected, the strain of each target data of the fifth combination is identified based on the discriminant analysis model created by SVM using the teacher data. Every time the teacher data of the sixth combination was selected, the strain of each target data of the sixth combination was identified based on the discriminant analysis model created by SVM using the teacher data.
比較例では、第4の組み合わせの教師データが選択されるごとに、当該教師データを用いて線形判別法により作成された線形モデルに基づいて第4の組み合わせの各対象データの株が識別された。同様に、第5の組み合わせの教師データが選択されるごとに、当該教師データを用いて線形判別法により作成された線形モデルに基づいて第5の組み合わせの各対象データの株が識別された。第6の組み合わせの教師データが選択されるごとに、当該教師データを用いて線形判別法により作成された線形モデルに基づいて第6の組み合わせの各対象データの株が識別された。 In the comparative example, each time the teacher data of the fourth combination was selected, the strain of each target data of the fourth combination was identified based on the linear model created by the linear discriminant method using the teacher data. . Similarly, every time the teacher data of the fifth combination is selected, the strain of each target data of the fifth combination is identified based on the linear model created by the linear discriminant method using the teacher data. Every time the teacher data of the sixth combination was selected, the strain of each target data of the sixth combination was identified based on the linear model created by the linear discriminant method using the teacher data.
また、実施例および比較例における誤識別率の平均が交差検証により評価された。図11は、交差検証による実施例および比較例における誤識別率の平均を示す図である。図11(a)に示すように、実施例における第4〜第6の組み合わせに対応する誤識別率の平均は、それぞれ0%、1%および1%となった。図11(b)に示すように、比較例における第4〜第6の組み合わせに対応する誤識別率の平均は、それぞれ61%、35%および49%となった。交差検証による実施例と比較例との比較の結果、SVMにより作成された判別分析モデルを用いることにより、高い精度で株を識別することが可能であることが確認された。 In addition, the average of the misidentification rates in Examples and Comparative Examples was evaluated by cross-validation. FIG. 11 is a diagram showing the average of the misidentification rates in the example and the comparative example by cross-verification. As shown in FIG. 11A, the average of the misidentification rates corresponding to the fourth to sixth combinations in the example was 0%, 1%, and 1%, respectively. As shown in FIG. 11B, the averages of the misidentification rates corresponding to the fourth to sixth combinations in the comparative example were 61%, 35%, and 49%, respectively. As a result of comparison between the example and the comparative example by cross-validation, it was confirmed that the strain can be identified with high accuracy by using the discriminant analysis model created by SVM.
10…処理装置,11…CPU,12…RAM,13…ROM,14…記憶装置,15…操作部,16…表示部,17…入出力I/F,18…バス,20…分析部,30…株識別装置,31…教師データ取得部,32…株情報取得部,33…モデル作成部,34…対象データ取得部,35…識別部,100…質量分析装置 10 ... Processing device, 11 ... CPU, 12 ... RAM, 13 ... ROM, 14 ... Storage device, 15 ... Operation part, 16 ... Display part, 17 ... Input / output I / F, 18 ... Bus, 20 ... Analysis part, 30 ... stock identification device, 31 ... teacher data acquisition unit, 32 ... stock information acquisition unit, 33 ... model creation unit, 34 ... target data acquisition unit, 35 ... identification unit, 100 ... mass spectrometer
Claims (11)
株が既知の微生物を含みかつ添加剤を含むとともにマトリックスが混合された複数のサンプルについての複数のマススペクトルデータの各々を教師データとして取得する教師データ取得部と、
機械学習を行うことにより、前記教師データ取得部により取得された複数の教師データに基づいて株を識別するための判別分析モデルを作成するモデル作成部と、
株が未知の微生物を含みかつ前記添加剤を含むとともに前記マトリックスが混合されたサンプルについてのマススペクトルデータを対象データとして取得する対象データ取得部と、
前記モデル作成部により作成された株ごとの判別分析モデルと対象データ取得部により取得された対象データとに基づいて当該対象データに対応する微生物の株を識別する識別部とを備える、質量分析装置。 A mass spectrometer for identifying a strain of a microorganism,
A teacher data acquisition unit that acquires, as teacher data, each of a plurality of mass spectrum data for a plurality of samples in which a matrix contains a known microorganism and contains an additive and a matrix is mixed,
A model creating unit that creates a discriminant analysis model for identifying a stock based on a plurality of teacher data acquired by the teacher data acquiring unit by performing machine learning,
A target data acquisition unit that acquires mass spectrum data about a sample in which the strain contains an unknown microorganism and contains the additive and the matrix is mixed as target data,
A mass spectrometer comprising a discriminant analysis model for each strain created by the model creating unit and an identifying unit that identifies a strain of a microorganism corresponding to the target data based on the target data acquired by the target data acquisition unit .
株が既知の微生物を含みかつ添加剤を含むとともにマトリックスが混合された複数のサンプルについての複数のマススペクトルデータの各々を教師データとして取得するステップと、
機械学習を行うことにより、取得された複数の教師データに基づいて株を識別するための判別分析モデルを作成するステップと、
株が未知の微生物を含みかつ前記添加剤を含むとともに前記マトリックスが混合されたサンプルについてのマススペクトルデータを対象データとして取得するステップと、
作成された株ごとの判別分析モデルと取得された対象データとに基づいて当該対象データに対応する微生物の株を識別するステップとを含む、質量分析方法。 A mass spectrometric method for identifying a strain of a microorganism, comprising:
Acquiring each of a plurality of mass spectrum data for a plurality of samples in which the strain contains known microorganisms and contains additives and a matrix is mixed, as teacher data,
A step of creating a discriminant analysis model for identifying a stock based on a plurality of acquired teacher data by performing machine learning,
Obtaining mass spectrum data for a sample in which the strain contains an unknown microorganism and contains the additive and the matrix is mixed as target data,
A method of mass spectrometry, comprising the step of identifying a strain of a microorganism corresponding to the target data based on the created discriminant analysis model for each strain and the acquired target data.
株が既知の微生物を含みかつ添加剤を含むとともにマトリックスが混合された複数のサンプルについての複数のマススペクトルデータの各々を教師データとして取得する処理と、
機械学習を行うことにより、取得された複数の教師データに基づいて株を識別するための判別分析モデルを作成する処理と、
株が未知の微生物を含みかつ前記添加剤を含むとともに前記マトリックスが混合されたサンプルについてのマススペクトルデータを対象データとして取得する処理と、
作成された株ごとの判別分析モデルと取得された対象データとに基づいて当該対象データに対応する微生物の株を識別する処理とを、
前記処理装置に実行させる、質量分析プログラム。 A mass spectrometric program for identifying strains of microorganisms that can be executed by a processing device,
A process of acquiring, as teacher data, each of a plurality of mass spectrum data of a plurality of samples in which a matrix contains a known microorganism and contains an additive and a matrix is mixed,
A process of creating a discriminant analysis model for identifying a stock based on a plurality of acquired teacher data by performing machine learning,
A process of obtaining mass spectrum data about a sample in which the strain contains an unknown microorganism and contains the additive and the matrix is mixed as target data,
A process for identifying the strain of the microorganism corresponding to the target data based on the discriminant analysis model created for each strain and the acquired target data,
A mass spectrometry program to be executed by the processing device.
Priority Applications (4)
| Application Number | Priority Date | Filing Date | Title |
|---|---|---|---|
| JP2018191764A JP2020060444A (en) | 2018-10-10 | 2018-10-10 | Mass spectrometer, mass spectrometry, and mass spectrometry program |
| EP19201774.7A EP3660853A3 (en) | 2018-10-10 | 2019-10-07 | Mass spectrometer, mass spectrometry method, and mass spectrometry program for discriminating a strain in a microorganism |
| US16/594,124 US20200118650A1 (en) | 2018-10-10 | 2019-10-07 | Mass spectrometer, mass spectrometry method, and non-transitory computer readable medium |
| CN201910960315.3A CN111028886A (en) | 2018-10-10 | 2019-10-10 | Mass spectrometry device, mass spectrometry method, and computer-readable medium |
Applications Claiming Priority (1)
| Application Number | Priority Date | Filing Date | Title |
|---|---|---|---|
| JP2018191764A JP2020060444A (en) | 2018-10-10 | 2018-10-10 | Mass spectrometer, mass spectrometry, and mass spectrometry program |
Publications (2)
| Publication Number | Publication Date |
|---|---|
| JP2020060444A true JP2020060444A (en) | 2020-04-16 |
| JP2020060444A5 JP2020060444A5 (en) | 2021-07-26 |
Family
ID=68172137
Family Applications (1)
| Application Number | Title | Priority Date | Filing Date |
|---|---|---|---|
| JP2018191764A Pending JP2020060444A (en) | 2018-10-10 | 2018-10-10 | Mass spectrometer, mass spectrometry, and mass spectrometry program |
Country Status (4)
| Country | Link |
|---|---|
| US (1) | US20200118650A1 (en) |
| EP (1) | EP3660853A3 (en) |
| JP (1) | JP2020060444A (en) |
| CN (1) | CN111028886A (en) |
Families Citing this family (2)
| Publication number | Priority date | Publication date | Assignee | Title |
|---|---|---|---|---|
| CN112614547A (en) * | 2020-12-28 | 2021-04-06 | 广州禾信仪器股份有限公司 | Microbial serum type classification model training and microbial serum type classification method |
| CN112505133B (en) * | 2020-12-28 | 2023-09-12 | 黑龙江莱恩检测有限公司 | Mass spectrum detection method based on deep learning |
Citations (4)
| Publication number | Priority date | Publication date | Assignee | Title |
|---|---|---|---|---|
| JP2007316063A (en) * | 2006-04-28 | 2007-12-06 | National Institute Of Advanced Industrial & Technology | Method and device for quickly identifying cell |
| JP2017038620A (en) * | 2016-10-26 | 2017-02-23 | エラスムス ユニバーシティ メディカル センター ロッテルダムErasmus University Medical Center Rotterdam | Method for determining whether microorganism is potentially resistant to antimicrobial compound |
| JP2018513382A (en) * | 2015-04-24 | 2018-05-24 | ビオメリューBiomerieux | A method for identifying unknown microbial subgroups from a set of reference subgroups by mass spectrometry |
| JP2018141795A (en) * | 2014-10-17 | 2018-09-13 | エスケーテレコム カンパニー リミテッドSk Telecom Co., Ltd. | Composition for diagnosing pancreatic cancer and method of diagnosing pancreatic cancer using the same |
-
2018
- 2018-10-10 JP JP2018191764A patent/JP2020060444A/en active Pending
-
2019
- 2019-10-07 US US16/594,124 patent/US20200118650A1/en not_active Abandoned
- 2019-10-07 EP EP19201774.7A patent/EP3660853A3/en not_active Withdrawn
- 2019-10-10 CN CN201910960315.3A patent/CN111028886A/en not_active Withdrawn
Patent Citations (4)
| Publication number | Priority date | Publication date | Assignee | Title |
|---|---|---|---|---|
| JP2007316063A (en) * | 2006-04-28 | 2007-12-06 | National Institute Of Advanced Industrial & Technology | Method and device for quickly identifying cell |
| JP2018141795A (en) * | 2014-10-17 | 2018-09-13 | エスケーテレコム カンパニー リミテッドSk Telecom Co., Ltd. | Composition for diagnosing pancreatic cancer and method of diagnosing pancreatic cancer using the same |
| JP2018513382A (en) * | 2015-04-24 | 2018-05-24 | ビオメリューBiomerieux | A method for identifying unknown microbial subgroups from a set of reference subgroups by mass spectrometry |
| JP2017038620A (en) * | 2016-10-26 | 2017-02-23 | エラスムス ユニバーシティ メディカル センター ロッテルダムErasmus University Medical Center Rotterdam | Method for determining whether microorganism is potentially resistant to antimicrobial compound |
Non-Patent Citations (1)
| Title |
|---|
| MEETANI ET AL.: "MALDI Mass Spectrometry Analysis of High Molecular Weight Proteins from Whole Bacterial Cells: Pretr", JOURNAL OF THE AMERICAN SOCIETY FOR MASS SPECTROMETRY, vol. Vol.16/Iss.9, JPN6022011276, 2005, pages 1422 - 1426, ISSN: 0004876501 * |
Also Published As
| Publication number | Publication date |
|---|---|
| EP3660853A2 (en) | 2020-06-03 |
| CN111028886A (en) | 2020-04-17 |
| EP3660853A3 (en) | 2020-07-08 |
| US20200118650A1 (en) | 2020-04-16 |
Similar Documents
| Publication | Publication Date | Title |
|---|---|---|
| Li et al. | Spectral entropy outperforms MS/MS dot product similarity for small-molecule compound identification | |
| Degroeve et al. | MS2PIP: a tool for MS/MS peak intensity prediction | |
| Heinonen et al. | Metabolite identification and molecular fingerprint prediction through machine learning | |
| US20090254314A1 (en) | Systems and methods for identifying correlated variables in large amounts of data | |
| Karamichalis et al. | An investigation into inter-and intragenomic variations of graphic genomic signatures | |
| JPWO2018037569A1 (en) | Imaging mass spectrometry data processing apparatus and method | |
| JP2020060444A (en) | Mass spectrometer, mass spectrometry, and mass spectrometry program | |
| WO2013104004A1 (en) | Comprehensive interference treatment for icp-ms analysis | |
| US9442887B2 (en) | Systems and methods for processing fragment ion spectra to determine mechanism of fragmentation and structure of molecule | |
| Ahmed et al. | Improving feature ranking for biomarker discovery in proteomics mass spectrometry data using genetic programming | |
| Gross et al. | Isotopic composition and accurate mass | |
| JP7057973B2 (en) | Microorganism identification device and microorganism identification method | |
| US7587285B2 (en) | Method for identifying correlated variables | |
| Song et al. | Algorithms for automatic processing of data from mass spectrometric analyses of lipids | |
| Bai et al. | Classification of methicillin-resistant and methicillin-susceptible Staphylococcus aureus using an improved genetic algorithm for feature selection based on mass spectra | |
| US10825668B2 (en) | Library search tolerant to isotopes | |
| US20230410947A1 (en) | Systems and methods for rapid microbial identification | |
| EP3341737B1 (en) | Rapid scoring of lc-ms/ms peptide data | |
| JP6295910B2 (en) | Mass spectrometry data processor | |
| Dittwald et al. | Towards automated discrimination of lipids versus peptides from full scan mass spectra | |
| Lewis et al. | Peptide refinement by using a stochastic search | |
| US8073639B2 (en) | Method for identifying a convolved peak | |
| JP2021025953A (en) | Mass analysis data processing method, mass analysis data processing system, and mass analysis data processing program | |
| CN104798174A (en) | Compound identification using multiple spectra at different collision energies | |
| CN114184668B (en) | Microorganism identification method and bipolar standard spectrogram generation method |
Legal Events
| Date | Code | Title | Description |
|---|---|---|---|
| A521 | Request for written amendment filed |
Free format text: JAPANESE INTERMEDIATE CODE: A523 Effective date: 20210604 |
|
| A621 | Written request for application examination |
Free format text: JAPANESE INTERMEDIATE CODE: A621 Effective date: 20210604 |
|
| A977 | Report on retrieval |
Free format text: JAPANESE INTERMEDIATE CODE: A971007 Effective date: 20220316 |
|
| A131 | Notification of reasons for refusal |
Free format text: JAPANESE INTERMEDIATE CODE: A131 Effective date: 20220329 |
|
| A601 | Written request for extension of time |
Free format text: JAPANESE INTERMEDIATE CODE: A601 Effective date: 20220526 |
|
| A521 | Request for written amendment filed |
Free format text: JAPANESE INTERMEDIATE CODE: A523 Effective date: 20220708 |
|
| A02 | Decision of refusal |
Free format text: JAPANESE INTERMEDIATE CODE: A02 Effective date: 20220920 |