JP2019093140A - Optical ultrasonic diagnostic apparatus, medical image processing apparatus, medical image processing program, and ultrasonic diagnostic apparatus - Google Patents
Optical ultrasonic diagnostic apparatus, medical image processing apparatus, medical image processing program, and ultrasonic diagnostic apparatus Download PDFInfo
- Publication number
- JP2019093140A JP2019093140A JP2018217375A JP2018217375A JP2019093140A JP 2019093140 A JP2019093140 A JP 2019093140A JP 2018217375 A JP2018217375 A JP 2018217375A JP 2018217375 A JP2018217375 A JP 2018217375A JP 2019093140 A JP2019093140 A JP 2019093140A
- Authority
- JP
- Japan
- Prior art keywords
- image data
- blood vessel
- vessel structure
- blood
- ultrasonic diagnostic
- Prior art date
- Legal status (The legal status is an assumption and is not a legal conclusion. Google has not performed a legal analysis and makes no representation as to the accuracy of the status listed.)
- Pending
Links
Images


Abstract
Description
本発明の実施形態は、光超音波診断装置、医用画像処理装置、医用画像処理プログラム、及び超音波診断装置に関する。 Embodiments of the present invention relate to an optical ultrasonic diagnostic apparatus, a medical image processing apparatus, a medical image processing program, and an ultrasonic diagnostic apparatus.
被検体内の光吸収体を画像化する技術として、光音響イメージング(PAI:Photoacoustic Imaging)が知られている。光音響イメージングは、被検体に光が照射されると光音響効果により光吸収体から光音響波(光超音波とも呼ばれる)が発生することを利用し、光吸収体の分布を画像情報化する技術である。 Photoacoustic imaging (PAI: Photoacoustic Imaging) is known as a technique for imaging a light absorber in a subject. Photoacoustic imaging utilizes the generation of a photoacoustic wave (also referred to as photoacoustic wave) from a light absorber due to the photoacoustic effect when light is irradiated to a subject, and converts the distribution of the light absorber into image information It is a technology.
例えば、光音響イメージングを行うための装置として、光超音波診断装置(光音響装置とも呼ばれる)の開発が進められている。光超音波診断装置は、例えば、赤血球に含まれるヘモグロビンを光吸収体として利用することで、被検体内に存在する赤血球を画像化することができる。 For example, as a device for performing photoacoustic imaging, development of an optical ultrasonic diagnostic device (also referred to as a photoacoustic device) is in progress. The optical ultrasonic diagnostic apparatus can image red blood cells present in a subject by using, for example, hemoglobin contained in red blood cells as a light absorber.
本発明が解決しようとする課題は、血管構造を容易に描出することができる光超音波診断装置、医用画像処理装置、医用画像処理プログラム、及び超音波診断装置を提供することである。 The problem to be solved by the present invention is to provide an optical ultrasonic diagnostic apparatus, a medical image processing apparatus, a medical image processing program, and an ultrasonic diagnostic apparatus that can easily visualize a blood vessel structure.
実施形態に係る光超音波診断装置は、照射部と、受信部と、画像生成部と、推定部と、出力制御部とを備える。照射部は、予め設定された波長を有する光を照射する。受信部は、前記光の照射により被検体内で発生した光超音波を受信する。画像生成部は、前記光超音波に基づいて、赤血球が描出された血球画像データを生成する。推定部は、所定期間にわたって生成された前記血球画像データに基づいて、前記被検体の血管構造を推定する。出力制御部は、前記血管構造に関する情報を出力する。 The optical ultrasonic diagnostic apparatus according to the embodiment includes an irradiation unit, a reception unit, an image generation unit, an estimation unit, and an output control unit. The irradiating unit irradiates light having a preset wavelength. The receiving unit receives the light ultrasonic waves generated in the subject by the irradiation of the light. The image generation unit generates blood cell image data in which red blood cells are drawn based on the light ultrasonic waves. The estimation unit estimates the blood vessel structure of the subject based on the blood cell image data generated over a predetermined period. The output control unit outputs information on the blood vessel structure.
以下、図面を参照して、実施形態に係る光超音波診断装置、医用画像処理装置、医用画像処理プログラム、及び超音波診断装置を説明する。なお、以下の実施形態は、以下の説明に限定されるものではない。また、実施形態は、処理内容に矛盾が生じない範囲で他の実施形態や従来技術との組み合わせが可能である。 Hereinafter, with reference to the drawings, an optical ultrasonic diagnostic device, a medical image processing device, a medical image processing program, and an ultrasonic diagnostic device according to an embodiment will be described. The following embodiments are not limited to the following description. Also, the embodiment can be combined with other embodiments or the prior art as long as no contradiction occurs in the processing content.
なお、光超音波診断装置は、光音響イメージング(PAI:Photoacoustic Imaging)により被検体内の光吸収体を画像化する装置であり、例えば、個々の赤血球を識別可能な程度の高分解能を有する光音響顕微鏡である。ただし、光超音波診断装置は光音響顕微鏡に限定されるものではなく、例えば、個々の赤血球を識別可能な程度の分解能(解像度)を有していればよい。 The optical ultrasonic diagnostic apparatus is an apparatus for imaging a light absorber in a subject by photoacoustic imaging (PAI), and for example, light having a high resolution capable of identifying individual red blood cells. It is an acoustic microscope. However, the optical ultrasonic diagnostic apparatus is not limited to the photoacoustic microscope, and may have, for example, a resolution (resolution) that can distinguish individual red blood cells.
また、以下の実施形態では、開示の技術が光超音波診断装置に適用される場合を説明するが、実施形態はこれに限定されるものではない。例えば、開示の技術は、光超音波診断装置に限らず、医用画像を処理する機能を備えた医用画像処理装置にも適用可能である。医用画像処理装置としては、例えば、ワークステーションやPACS(Picture Archiving Communication System)ビューワ等が適用可能である。 Moreover, although the following embodiment demonstrates the case where the technique of an indication is applied to an optical ultrasound diagnostic apparatus, embodiment is not limited to this. For example, the disclosed technology is not limited to the optical ultrasonic diagnostic apparatus, and is also applicable to a medical image processing apparatus having a function of processing a medical image. As a medical image processing apparatus, for example, a workstation, a PACS (Picture Archiving Communication System) viewer, or the like can be applied.
(第1の実施形態)
図1は、第1の実施形態に係る光超音波診断装置1の構成例を示すブロック図である。図1に示すように、第1の実施形態に係る光超音波診断装置1は、装置本体100と、超音波プローブ102と、光照射部101と、入力インターフェース103と、ディスプレイ104とを有する。超音波プローブ102、光照射部101、入力インターフェース103、及びディスプレイ104は、装置本体100に通信可能に接続される。なお、被検体Pは、光超音波診断装置1の構成に含まれない。
First Embodiment
FIG. 1 is a block diagram showing a configuration example of the optical ultrasonic
光照射部101は、光ファイバやレンズ等の光学系(光伝搬部材)により構成される。光照射部101は、後述する光源110により発生した光(パルス光)を被検体Pに対して照射する。例えば、光照射部101は、被検体Pの指、四肢、乳房など、体動の少ない部位に対してパルス光を照射するのが好適である。照射されたパルス光は、被検体P内を伝搬・拡散し、被検体P内に存在する物質において吸収される。このような光を吸収する物質(光吸収体)は、各波長のパルス光のエネルギーをそれぞれ吸収して、光超音波をそれぞれ発生する。すなわち、光照射部101は、予め設定された波長を有する光を照射する照射部の一例である。
The
光吸収体としては、例えば、生体内に含まれるヘモグロビンやグルコース(血糖)等の物質が挙げられる。各光吸収体は、特定の波長を有するパルス光のエネルギーを吸収して、光超音波をそれぞれ発生する。発生した光超音波は、被検体P内を伝搬し、後述する超音波プローブ102が備える複数の振動子により受信される。なお、光吸収体としては、上記の物質に限らず、パルス光のエネルギーを吸収しうるあらゆる物質が適用可能である。例えば、体表面に存在するメラニンも光吸収体に含まれる。また、生体内物質に限らず、例えば、メチレンブルー、インドシニアングリーン等の色素や金微粒子、及び、それらを集積あるいは化学的に修飾した物質(若しくは薬剤)等も、被検体P内に投与することで光吸収体として利用可能である。
Examples of the light absorber include substances contained in the living body such as hemoglobin and glucose (blood sugar). Each light absorber absorbs the energy of pulsed light having a specific wavelength to generate light ultrasonic waves. The generated optical ultrasonic waves propagate in the subject P and are received by a plurality of transducers provided in an
第1の実施形態に係る光照射部101は、分解能を向上させるため、ビーム径を集束させたパルス光を照射する。言い換えると、光照射部101は、PAIの対象領域に含まれる各位置に対して集束させたパルス光を順次照射する。PAIの対象領域は、2次元領域(被検体P内の断面に相当)であっても3次元領域であってもよい。なお、これに限らず、光照射部101は、個々の赤血球を識別可能な程度の分解能を維持できる範囲内で、ビーム径を広げて照射することも可能である。
The
超音波プローブ102は、複数の振動子(例えば、圧電振動子)、プリアンプ、及びA/D(Analog/Digital)変換器等を有する探触子である。複数の振動子は、被検体P内で発生した光超音波を受信する。プリアンプは、受信された光超音波をチャネル毎に増幅する。A/D変換器は、増幅された光超音波をA/D変換し、デジタルの電気信号を出力する。超音波プローブ102は、A/D変換器により出力されるデジタルの電気信号を、後述する受信回路120に送信する。
The
超音波プローブ102の光超音波受信面は、平面であってもよいし、被検体Pの体表面に沿うような曲面であってもよい。一例としては、複数の振動子は、平面上に、所定間隔で直線状に配列される。また、他の例としては、複数の振動子は、2次元アレイ状(格子状)、若しくは同心円状に配列される。また、光超音波受信面を半球状に形成し、この半球状の曲面に、同心円状や螺旋状に複数の振動子を配列してもよい。半球状の光超音波受信面は、乳房の撮像に好適である。また、光超音波受信面を円筒状若しくは半円筒状に形成し、この面上に複数の振動子を配列してもよい。円筒状若しくは半円筒状の光超音波受信面は、四肢の撮像に好適である。
The optical ultrasonic wave receiving surface of the
第1の実施形態に係る超音波プローブ102は、分解能を向上させるため、高い周波数の光超音波を受信可能な構成であることが好適である。例えば、超音波プローブ102は、個々の赤血球を識別可能な程度の分解能を実現可能な程度の周波数を受信可能に構成される。
The
入力インターフェース103は、マウス、キーボード、ボタン、パネルスイッチ、タッチコマンドスクリーン、フットスイッチ、トラックボール、ジョイスティック等に対応する。例えば、入力インターフェース103は、光超音波診断装置1の操作者からの各種設定要求を受け付け、受け付けた各種設定要求を装置本体100に対して転送する。
The
ディスプレイ104は、光超音波診断装置1の操作者が入力インターフェース103を用いて各種設定要求を入力するためのGUI(Graphical User Interface)を表示したり、装置本体100において生成された画像データ等を表示したりする。
The
装置本体100は、超音波プローブ102が受信した光超音波に基づいて画像データを生成する装置であり、図1に示すように、光源110と、受信回路120と、信号処理回路130と、画像生成回路140と、記憶回路150と、処理回路160とを有する。光源110、受信回路120、信号処理回路130、画像生成回路140、記憶回路150、及び処理回路160は、相互に通信可能に接続される。
The
光源110は、予め設定された波長を有する光(パルス光)を発する。例えば、光源110は、大出力の光を発生するレーザ光源である。レーザ光源の一例としては、固体レーザ、ガスレーザ、色素レーザ、半導体レーザなどが挙げられる。光源110としては、PAIの対象となる光吸収体の種類に応じて、任意の波長の光を発することが可能な光源を適宜利用可能である。また、光源110は、後述する処理回路160による制御により、光の照射タイミング、パルス幅、強度等を調節可能である。
The light source 110 emits light (pulsed light) having a preset wavelength. For example, the light source 110 is a laser light source that generates light of high output. Examples of the laser light source include solid-state lasers, gas lasers, dye lasers, semiconductor lasers and the like. As the light source 110, a light source capable of emitting light of an arbitrary wavelength can be appropriately used according to the type of light absorber to be subjected to PAI. In addition, the light source 110 can adjust the light irradiation timing, the pulse width, the intensity, and the like under the control of the
なお、光源110は、出力が強く連続的に波長を変えられるものが好適であるが、波長が異なる複数の単波長レーザにより構成されてもよい。また、光源110は、レーザ光源に限らず、発光ダイオードやフラッシュランプ等により構成されてもよい。また、光源110は、例えば、装置本体100の外部に設置された個別の筐体に備えられても良いし、光照射部101の内部に備えられていてもよい。
Although it is preferable that the light source 110 has a strong output and can change the wavelength continuously, it may be configured by a plurality of single wavelength lasers having different wavelengths. Further, the light source 110 is not limited to the laser light source, and may be configured by a light emitting diode, a flash lamp or the like. In addition, the light source 110 may be provided, for example, in a separate housing installed outside the device
受信回路120は、受信遅延部及び加算器等を有し、超音波プローブ102から送信されたデジタルの電気信号に対して各種処理を行って受信データを生成する。受信遅延部は、受信指向性を決定するために必要な遅延時間をデジタルの電気信号に与える。加算器は、受信遅延部によって処理された電気信号の加算処理を行って受信データを生成する。受信回路120は、生成した受信データを信号処理回路130へ送信する。すなわち、受信回路120は、光の照射により被検体内で発生した光超音波を受信する受信部の一例である。
The
信号処理回路130は、受信回路120から受信した受信データを用いて、被検体P内の特性値の分布データを生成する。例えば、信号処理回路130は、チャネル毎の時系列の受信データを用いて画像再構成を行うことにより、PAIの対象領域(2次元又は3次元の領域)の空間座標上の各位置に対応する特性値の分布データを求める。画像再構成手法としては、公知の再構成手法を適宜利用可能である。
The signal processing circuit 130 generates distribution data of characteristic values in the subject P using the reception data received from the
画像生成回路140は、信号処理回路130により生成された分布データから画像データを生成する。例えば、画像生成回路140は、信号処理回路130が生成した分布データから、光超音波の強度を輝度で表した画像データを生成する。なお、画像生成回路140は、PAIの対象領域が2次元領域である場合、2次元の画像データを生成し、3次元領域である場合、3次元の画像データを生成する。なお、画像生成回路140は、画像生成部の一例である。
The
第1の実施形態に係る画像生成回路140は、予め設定された波長を有する光の照射により被検体内で発生した光超音波に基づいて、赤血球が描出された画像データ(血球画像データ)を生成する。具体的には、画像生成回路140は、所定期間にわたる複数回の受信により得られた光超音波に基づいて、血球画像データを複数生成する。赤血球は、400〜700nm程度の波長を有するレーザ光によりヘモグロビンを励起させることで光超音波を発生する。例えば、画像生成回路140は、個々の赤血球から発生した光超音波の分布データに基づいて、血球画像データを生成する。
The
また、画像生成回路140は、生成した画像データに対して各種の画像処理を実行可能である。例えば、画像生成回路140は、平滑化処理やエッジ強調処理等、各種の画像処理を操作者の求めに応じて実行する。また、画像生成回路140は、画像データに対して付帯情報(種々のパラメータの文字情報、目盛り、ボディーマーク等)を付帯させ、記憶回路150に格納する。
Further, the
記憶回路150は、PAI、各種の画像処理、及び表示処理等を行うための制御プログラムや、診断情報(例えば、患者ID、医師の所見等)、診断プロトコル、各種ボディーマーク等の各種データを記憶する。また、記憶回路150は、画像生成回路140により生成された画像データを付帯情報とともに記憶する。また、記憶回路150が記憶するデータは、図示しない通信用インターフェースを介して、外部装置へ転送可能である。
The
処理回路160は、光超音波診断装置1の処理全体を制御する。例えば、処理回路160は、入力インターフェース103を介して操作者から入力された各種設定要求や、記憶回路150から読込んだ各種制御プログラム及び各種データに基づき、光源110、受信回路120、信号処理回路130、及び画像生成回路140の処理を制御する。また、処理回路160は、記憶回路150が記憶する画像データをディスプレイ104にて表示させる。
The
また、処理回路160は、図1に示すように、推定機能161と、算出機能162と、出力制御機能163とを実行する。ここで、推定機能161は、推定部の一例である。また、算出機能162は、算出部の一例である。また、出力制御機能163は、出力制御部の一例である。
Further, as shown in FIG. 1, the
ここで、例えば、図1に示す処理回路160の構成要素である推定機能161、算出機能162、及び出力制御機能163が実行する各処理機能は、コンピュータによって実行可能なプログラムの形態で光超音波診断装置1の記憶装置(例えば、記憶回路150)に記録されている。処理回路160は、各プログラムを記憶装置から読み出し、実行することで各プログラムに対応する機能を実現するプロセッサである。換言すると、各プログラムを読み出した状態の処理回路160は、図1の処理回路160内に示された各機能を有することとなる。なお、推定機能161、算出機能162、及び出力制御機能163が実行する各処理機能については、後述する。
Here, for example, each processing function executed by the
以上、第1の実施形態に係る光超音波診断装置1の構成について説明した。かかる構成のもと、第1の実施形態に係る光超音波診断装置1は、血管構造を容易に描出するために、以下の処理機能を実行する。
The configuration of the
すなわち、第1の実施形態に係る光超音波診断装置1において、画像生成回路140は、予め設定された波長を有する光の照射により被検体内で発生した光超音波に基づいて、赤血球が描出された血球画像データを生成する。また、推定機能161は、所定期間にわたって生成された血球画像データに基づいて、被検体Pの血管構造を推定する。出力制御機能163は、血管構造に関する情報を出力する。
That is, in the optical ultrasonic
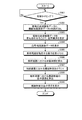
図2を用いて、第1の実施形態に係る光超音波診断装置1における処理について具体的に説明する。図2は、第1の実施形態に係る光超音波診断装置1における処理の処理手順を示すフローチャートである。図2に示す処理手順は、例えば、血管体積を測定する旨の入力(指示)を操作者から受け付けた場合に開始される。図2では、図3及び図4を参照しつつ説明する。図3は、第1の実施形態に係る推定機能161の処理を説明するための図である。図4は、第1の実施形態に係る算出機能162の処理を説明するための図である。
The process in the optical ultrasonic
ステップS101において、処理回路160は、処理タイミングか否かを判定する。例えば、操作者は、入力インターフェース103を用いて、血管体積を測定する旨の入力を行う。入力インターフェース103は、操作者により入力された血管体積を測定する旨の情報を、処理回路160へ出力する。処理回路160は、血管体積を測定する旨の情報を入力インターフェース103から受け付けた場合に、血管体積を測定する旨の入力を受け付けたと判定し(ステップS101肯定)、ステップS102以降の処理を開始する。なお、処理回路160は、血管体積を測定する旨の入力を受け付けるまで(ステップS101否定)、ステップS102以降の処理を開始せず、待機状態である。
In step S101, the
ステップS102において、処理回路160は、複数の血球画像データを読み出す。例えば、処理回路160は、複数の血球画像データを記憶回路150から読み出す。ここで、複数の血球画像データは、時系列に並んだ複数枚の画像データである。例えば、複数の血球画像データは、同一の対象領域から複数フレームにわたって連続的に撮像された画像データである。
In step S102, the
ステップS103において、推定機能161は、複数の血球画像データを重ね合わせることで、血管構造を推定する。例えば、推定機能161は、同一の対象領域から異なるタイミングにおいて生成された複数の血球画像データを、互いの位置が一致するように重ね合わせる。そして、推定機能161は、重ね合わせた血球画像データにおいて赤血球が存在する位置を血管位置として特定する。
In step S103, the
図3を用いて、推定機能161の処理を説明する。図3には、1〜Nフレーム目までの各血球画像データ10と、血管構造画像データ20とを例示する。図3において、各血球画像データ10の領域11を拡大させた拡大画像12には、複数の赤血球13が描出される。
The process of the
図3に示すように、1フレーム目からNフレーム目までの各血球画像データ10には、複数の赤血球13が描出されている。各血球画像データ10において、複数の赤血球13は、個別に識別可能な程度に離散的に描出されている。
As shown in FIG. 3, a plurality of
ここで、推定機能161は、1〜Nフレーム目までの複数枚の血球画像データ10を重ね合わせることで、血管構造画像データ20を生成する。この血管構造画像データ20には、複数の赤血球13が連続的に描出される。具体的に、血管構造画像データ20の領域21を拡大させた拡大画像22には、それぞれの赤血球13が互いに連なって描出される。この結果、推定機能161は、連なって描出される赤血球13の位置を血管位置として特定する。すなわち、推定機能161は、複数の血球画像データを重ね合わせることで、血管構造が描出された血管構造画像データを生成し、血管構造画像データに基づいて血管構造を推定する。
Here, the
このように、推定機能161は、複数枚の血球画像データ10を重ね合わせることで、血管の走行状態や分岐位置を表す血管構造が描出された血管構造画像データ20を生成する。すなわち、推定機能161は、被検体Pの3次元領域における赤血球の分布が描出された3次元の血球画像データに基づいて、3次元の血管構造を推定する。なお、ここでは、複数枚の血球画像データ10を重ね合わせた画像データを血管構造画像データ20として生成する場合を説明したが、これに限定されるものではない。例えば、推定機能161は、複数枚の血球画像データ10を重ね合わせた画像データに対して、輪郭を平滑化する処理を行って、血管構造画像データ20としてもよい。これにより、推定機能161は、描出される血管構造の表面が滑らかにすることができる。
As described above, the
また、血管構造画像データ20を生成するために重ね合わせる血球画像データ10の枚数は、任意に設定可能である。また、重ね合わせる枚数は、撮像前に予め決定されていても良いし、撮像後に記憶された複数の血球画像データ10の中から任意の画像データを操作者が選択してもよい。
Further, the number of blood
ステップS104において、出力制御機能163は、血管構造画像データ20を表示させる。例えば、出力制御機能163は、推定機能161により生成された血管構造画像データ20を、ディスプレイ104に表示させる。
In step S104, the
ステップS105において、算出機能162は、解析範囲を指定する操作を受け付ける。ここで、解析範囲とは、推定機能161により推定された血管構造のうち、血管体積を測定する対象となる範囲を示す。例えば、図4に示すように、操作者は、解析範囲を示すマーカ23を血管構造画像データ20上に設定する。操作者は、マーカ23の位置、形状、大きさ、及び方向等を任意に設定することができる。
In step S105, the
ステップS106において、算出機能162は、解析範囲における血管体積を算出する。例えば、算出機能162は、血管構造のうち、操作者により指定された範囲に含まれる血管の体積(血管体積)を算出する。具体的には、操作者がマーカ23の位置、形状、大きさ、及び方向等を確定する操作を行うと、算出機能162は、確定されたマーカ23に含まれる血管の体積を算出する。より具体的には、算出機能162は、マーカ23に含まれる複数の赤血球13の画素位置を特定し、特定した画素の数に応じた体積を血管体積として算出する。
In step S106, the
ステップS107において、出力制御機能163は、血管体積を表示させる。例えば、出力制御機能163は、算出機能162により算出された血管体積をディスプレイ104に表示させる。
In step S107, the
このように、第1の実施形態に係る光超音波診断装置1は、血管構造画像データ20を生成し、血管体積を算出する。なお、光超音波診断装置1は、血管構造画像データ20及び血管体積を表示させるだけでなく、記憶回路150や可搬性記憶媒体に格納させたり、ネットワークを介して所定の外部装置に送信したりすることができる。
Thus, the optical ultrasonic
また、算出機能162は、血管体積のみならず、赤血球数やヘマトクリット値を算出する算出処理も実行可能である。例えば、算出機能162は、任意のタイミング(時相)における血球画像データから、解析範囲に含まれる赤血球数をカウントする。具体的には、算出機能162は、赤血球の形状認識により解析範囲内の赤血球をそれぞれ特定し、特定した赤血球の数をカウントする。また、赤血球1個当たりの質量(及び体積)は既知である。そこで、算出機能162は、解析範囲内の血管体積と赤血球の質量から、ヘマトクリット値を算出可能である。
Further, the
なお、図2に示した処理手順はあくまで一例であり、図示した順序に限定されるものではない。例えば、図示した処理手順は、処理内容に矛盾が生じない範囲で任意に変更可能である。 In addition, the process sequence shown in FIG. 2 is an example to the last, and is not limited to the illustrated order. For example, the illustrated processing procedure can be arbitrarily changed as long as no contradiction occurs in the processing content.
上述してきたように、第1の実施形態に係る光超音波診断装置1において、画像生成回路140は、予め設定された波長を有する光の照射により被検体内で発生した光超音波に基づいて、赤血球が描出された画像データを生成する。また、推定機能161は、所定期間にわたって生成された画像データに基づいて、被検体Pの血管構造を推定する。出力制御機能163は、血管構造に関する情報を出力する。これにより、第1の実施形態に係る光超音波診断装置1は、血管構造を容易に描出することができる。
As described above, in the optical ultrasonic
例えば、光音響顕微鏡であれば、個々の赤血球を識別可能な程度の分解能を有する血球画像データ10を撮像可能である。しかしながら、血球画像データ10には、複数の赤血球が離散的に描出されることとなり、本来赤血球が存在している血管そのものを描出することはできない。そこで、第1の実施形態に係る光超音波診断装置1は、同一の対象領域にて異なるタイミングに撮像された複数の血球画像データ10を重ね合わせることで、血管構造画像データ20を生成する。血管構造画像データ20には、それぞれの赤血球が互いに連なって描出される。この結果、第1の実施形態に係る光超音波診断装置1は、連なって描出される赤血球の位置を血管位置として特定することで、血管構造を容易に描出することができる。
For example, in the case of a photoacoustic microscope, it is possible to image blood
また、一般的に、赤血球濃度を測定する場合、採血が行われる。例えば、被検体Pから血液を採血し、血液を遠心分離させて赤血球とそれ以外を分離する。そして、分離した赤血球の質量を測定し、遠心分離させた血液の体積と赤血球の質量からヘマトクリット値を算出する。しかしながら、採血では、患者(被検体)の負担が大きいため、1日に複数回採血を行うことは困難である。また、採血には感染症などの危険性があるので、注射針や採血管などをディスポーザブル化したり、滅菌作業が必要となったりするので、ランニングコストがかかってしまう。また、採血は、看護師など資格保有者により行われる必要があるため、人件費もかかる。 Also, in general, when measuring red blood cell concentration, blood collection is performed. For example, blood is collected from the subject P, and the blood is centrifuged to separate red blood cells from others. Then, the mass of the separated red blood cells is measured, and the hematocrit value is calculated from the volume of the centrifuged blood and the mass of the red blood cells. However, in blood collection, it is difficult to collect blood several times a day because the burden on the patient (subject) is large. In addition, since there is a risk of infection or the like in blood collection, the injection needle and the blood collection tube are disposable, and a sterilization operation is required, which increases the running cost. In addition, blood collection has to be done by a qualified person such as a nurse, which also costs labor costs.
これに対して、第1の実施形態に係る光超音波診断装置1は、誰でも簡便に赤血球濃度を測定することを可能にする。例えば、光超音波診断装置1では、体表からレーザ光を照射するので非侵襲的であり、高分解能で赤血球を描出可能である。このため、光超音波診断装置1は、患者の負担を軽減させ、感染症などの危険性を低減する。また、光超音波診断装置1では、測定技師の技量に依らず測定でき、人件費のコストの低減も可能である。
On the other hand, the ultrasonic
(第2の実施形態)
第1の実施形態では、血球画像データに赤血球のみが描出される場合を説明したが、実施形態はこれに限定されるものではない。例えば、メラニンや腫瘍など、赤血球と吸収波長が重なる光吸収体がPAIの対象領域に含まれる場合には、これらの光吸収体がバックグラウンドとして血球画像データに描出されてしまう。そこで、第2の実施形態では、バックグラウンドの混在を低減するための処理を説明する。
Second Embodiment
In the first embodiment, the case where only red blood cells are depicted in blood cell image data has been described, but the embodiment is not limited thereto. For example, when a light absorber such as melanin or a tumor whose absorption wavelength overlaps with that of red blood cells is included in the target area of PAI, these light absorbers are drawn in blood cell image data as a background. Thus, in the second embodiment, a process for reducing the mixture of backgrounds will be described.
第2の実施形態に係る光超音波診断装置1は、図1に例示した光超音波診断装置1と同様の構成を備え、推定機能161及び出力制御機能163の処理の一部が相違する。そこで、第2の実施形態では、第1の実施形態と相違する点を中心に説明することとし、第1の実施形態において説明した構成と同様の機能を有する点については、説明を省略する。
The optical ultrasonic
図5を用いて、第2の実施形態に係る光超音波診断装置1における処理について具体的に説明する。図5は、第2の実施形態に係る光超音波診断装置1における処理の処理手順を示すフローチャートである。図5に示す処理手順は、例えば、血管構造を推定する旨の入力(指示)を操作者から受け付けた場合に開始される。図5では、図6を参照しつつ説明する。図6は、第2の実施形態に係る推定機能161の処理を説明するための図である。
The process in the optical ultrasonic
ステップS201において、処理回路160は、処理タイミングか否かを判定する。例えば、操作者は、入力インターフェース103を用いて、血管構造を推定する旨の入力を行う。入力インターフェース103は、操作者により入力された血管構造を推定する旨の情報を、処理回路160へ出力する。処理回路160は、血管構造を推定する旨の情報を入力インターフェース103から受け付けた場合に、血管構造を推定する旨の入力を受け付けたと判定し(ステップS201肯定)、ステップS202以降の処理を開始する。なお、処理回路160は、血管構造を推定する旨の入力を受け付けるまで(ステップS201否定)、ステップS202以降の処理を開始せず、待機状態である。
In step S201, the
ステップS202において、処理回路160は、複数の血球画像データを読み出す。なお、この処理は、図2に示したステップS102の処理と同様であるので説明を省略する。
In step S202, the
ステップS203において、推定機能161は、複数の血球画像データ同士を比較することで、動的な部分と静的な部分とを特定する。例えば、図6に示すように、推定機能161は、血球画像データ30に含まれる各位置(画素)について、時間方向における画素値の変動(分散値)が閾値以上であるか否かを判定する。ここで、分散値が閾値以上である位置は、動的な部分であり、例えば、赤血球が描出されている部分であると考えられる。一方、分散値が閾値未満である位置は、静的な部分であり、例えば、メラニンや腫瘍等、バックグラウンドとしての光吸収体31が描出されている部分であると考えられる。
In step S203, the
このように、推定機能161は、血球画像データ30に含まれる各位置(画素)について、時間方向における画素値の変動(分散値)が閾値以上であるか否かを判定することで、動的な部分に対応する領域と、静的な部分に対応する領域とを特定する。
As described above, the
ステップS204において、推定機能161は、複数の血球画像データを重ね合わせることで、血管構造を推定する。この処理は、図2に示したステップS103の処理と同様であるので説明を省略する。
In step S204, the
ステップS205において、出力制御機能163は、血管構造画像データを表示させる。この処理は、図2に示したステップS104の処理と同様であるので説明を省略する。
In step S205, the
ステップS206において、出力制御機能163は、動的な部分を強調表示する。例えば、図6の左下に示すように、出力制御機能163は、動的な部分を強調表示した画像データ40をディスプレイ104に表示させる。これにより、操作者は、バックグラウンドとしての光吸収体が混在する場合にも、血管構造を容易に把握することができる。
In step S206, the
なお、出力制御機能163は、動的な部分に限らず、静的な部分を表示してもよい。例えば、図6の右下に示すように、出力制御機能163は、静的な部分を描出した画像データ50をディスプレイ104に表示させる。これにより、操作者は、バックグラウンドとしての光吸収体の存在位置を明確に把握することができる。
The
なお、出力制御機能163は、動的な部分及び静的な部分のいずれか一方のみならず、双方を描出した画像データを表示することも可能である。つまり、出力制御機能163は、動的な部分及び静的な部分の少なくとも一方を示す画像データを表示する。
The
なお、図5に示した処理手順はあくまで一例であり、図示した順序に限定されるものではない。例えば、図示した処理手順は、処理内容に矛盾が生じない範囲で任意に変更可能である。 In addition, the process sequence shown in FIG. 5 is an example to the last, and is not limited to the illustrated order. For example, the illustrated processing procedure can be arbitrarily changed as long as no contradiction occurs in the processing content.
(第3の実施形態)
上述した実施形態では、赤血球を光吸収体とするPAIが行われる場合を説明したが、実施形態はこれに限定されるものではない。赤血球に限らず、例えば、メチレンブルー、インドシニアングリーン等の色素や金微粒子、及び、それらを集積あるいは化学的に修飾(標識)した物質(標識物質)を被検体P内に投与することで、光吸収体として利用可能である。
Third Embodiment
Although the embodiment described above describes the case where PAI is performed using red blood cells as a light absorber, the embodiments are not limited thereto. Not limited to red blood cells, for example, by administering a dye such as methylene blue or indosinian green, gold fine particles, and a substance (labeled substance) obtained by accumulating or chemically modifying (labeling) them into the subject P, It can be used as a light absorber.
第3の実施形態に係る光超音波診断装置1は、図1に例示した光超音波診断装置1と同様の構成を備え、算出機能162及び出力制御機能163の処理の一部が相違する。そこで、第3の実施形態では、第1の実施形態と相違する点を中心に説明することとし、第1の実施形態において説明した構成と同様の機能を有する点については、説明を省略する。
The optical ultrasonic
図7を用いて、第3の実施形態に係る光超音波診断装置1における処理について具体的に説明する。図7は、第3の実施形態に係る光超音波診断装置1における処理の処理手順を示すフローチャートである。図7に示す処理手順は、例えば、標識物質の血中濃度を算出する旨の入力(指示)を操作者から受け付けた場合に開始される。図7では、図8〜図11を参照しつつ説明する。図8及び図9は、第3の実施形態に係る算出機能162の処理を説明するための図である。図10及び図11は、第3の実施形態に係る出力制御機能163の処理を説明するための図である。
The process in the optical ultrasonic
ステップS301において、処理回路160は、処理タイミングか否かを判定する。例えば、操作者は、入力インターフェース103を用いて、標識物質の血中濃度を算出する旨の入力を行う。入力インターフェース103は、操作者により入力された標識物質の血中濃度を算出する旨の情報を、処理回路160へ出力する。処理回路160は、標識物質の血中濃度を算出する旨の情報を入力インターフェース103から受け付けた場合に、標識物質の血中濃度を算出する旨の入力を受け付けたと判定し(ステップS301肯定)、ステップS302以降の処理を開始する。なお、処理回路160は、標識物質の血中濃度を算出する旨の入力を受け付けるまで(ステップS301否定)、ステップS302以降の処理を開始せず、待機状態である。
In step S301, the
ステップS302において、処理回路160は、複数の血球画像データと、標識物質画像データとを読み出す。例えば、処理回路160は、複数の血球画像データと、標識物質画像データとを記憶回路150から読み出す。ここで、標識物質画像データは、標識物質を光吸収体とするPAIにより撮像された画像データである。なお、標識物質画像データは、血球画像データと同一の対象領域を、標識物質用の吸収波長で撮像した画像データである。標識物質画像データは、画像生成回路140により予め生成され、記憶回路150に格納される。つまり、画像生成回路140は、血球画像データの対象領域と同一の対象領域について、標識物質が描出された標識物質画像データを生成する。
In step S302, the
ステップS303において、推定機能161は、複数の血球画像データを重ね合わせることで、血管構造を推定する。この処理は、図2に示したステップS103の処理と同様であるので説明を省略する。
In step S303, the
ステップS304において、出力制御機能163は、血管構造画像データ20を表示させる。この処理は、図2に示したステップS104の処理と同様であるので説明を省略する。
In step S304, the
ステップS305において、算出機能162は、解析範囲を指定する操作を受け付ける。ここで、操作者は、解析範囲を示すマーカを血管構造画像データ20上に設定してもよいし、標識物質画像データ上に設定しても良い。つまり、操作者は、図8に示した血管構造画像データ20上でマーカ24を設定しても良いし、図9に示した標識物質画像データ60上でマーカ61を設定しても良い。マーカ24及びマーカ61の位置及び形状は互いに対応づけられており、一方に対する設定が他方にも反映されるよう構成される。なお、拡大画像25は、マーカ24に示す領域の拡大画像である。
In step S305, the
ステップS306において、算出機能162は、解析範囲における血管体積を算出する。例えば、算出機能162は、血管構造のうち、マーカ24に含まれる血管体積を算出する。
In step S306, the
ステップS307において、算出機能162は、解析範囲における標識物質をカウントする。例えば、図9に示すように、算出機能162は、マーカ61の拡大画像62に含まれる標識物質63の数をカウントする。
In step S307, the
ステップS308において、算出機能162は、解析範囲における標識物質の血中濃度を算出する。例えば、算出機能162は、標識物質画像データ60に描出された標識物質63の数と、血管体積とに基づいて、血管における標識物質63の濃度を算出する。具体的には、算出機能162は、マーカ61内の標識物質63の質量を、マーカ24内の血管体積で除算することにより、標識物質63の血中濃度[kg/m3]を算出する。なお、標識物質63の質量は、標識物質63の1個当たりの質量が既知であるので、マーカ61内の標識物質63の数から算出可能である。また、標識物質63の1個当たりの体積が既知である場合には、算出機能162は、血中濃度を体積比[%]として算出しても良い。
In step S308, the
ステップS309において、出力制御機能163は、標識物質の血中濃度を表示させる。例えば、出力制御機能163は、算出機能162により算出された標識物質の血中濃度をディスプレイ104に表示させる。
In step S309, the
例えば、出力制御機能163は、図10に示すように、解析範囲ごとの血中濃度の数値を血管構造画像データ20上に表示させる。図示の例では、解析範囲Aにおける血中濃度が50%であり、解析範囲Bにおける血中濃度が30%であり、解析範囲Cにおける血中濃度が50%である場合を例示する。また、これに限らず、図11に示すように、出力制御機能163は、血中濃度に応じた画素値(色調)を割り当てた血中濃度画像データ70を生成し、表示してもよい。
For example, as shown in FIG. 10, the
このように、光超音波診断装置1は、標識物質を被検体P内に投与することで、光吸収体として利用可能である。なお、光超音波診断装置1は、生体内の光吸収体として、血中グルコース(血糖)の濃度を算出することも可能である。
Thus, the optical ultrasonic
なお、図7に示した処理手順はあくまで一例であり、図示した順序に限定されるものではない。例えば、図示した処理手順は、処理内容に矛盾が生じない範囲で任意に変更可能である。 The processing procedure shown in FIG. 7 is merely an example, and the present invention is not limited to the illustrated order. For example, the illustrated processing procedure can be arbitrarily changed as long as no contradiction occurs in the processing content.
また、第3の実施形態では、1枚の標識物質画像データ60から標識物質の数を求める場合を説明したが、実施形態はこれに限定されるものではない。例えば、複数枚の標識物質画像データ60が得られる場合には、それぞれの標識物質画像データ60における標識物質の数を求め、それらの平均値を用いて血中濃度を算出しても良い。これにより、血中濃度の精度が向上することが期待される。
Moreover, although the case where the number of labeled substances was calculated | required from the label
(第4の実施形態)
上述した実施形態では、1回の血管体積測定が行われる場合を説明したが、実施形態は、複数回の血管体積測定が行われる場合にも適用可能である。この場合、1回目に測定した解析範囲の位置情報を記憶しておくことで、2回目以降の血管体積測定においても1回目と同一の解析範囲の血管体積を測定することが可能である。
Fourth Embodiment
Although the embodiment described above describes the case where one blood vessel volume measurement is performed, the embodiment is also applicable to the case where a plurality of blood vessel volume measurements are performed. In this case, by storing the position information of the analysis range measured at the first time, it is possible to measure the blood vessel volume of the same analysis range as the first time even in the second and subsequent blood vessel volume measurement.
図12は、第4の実施形態に係る光超音波診断装置1の処理を説明するための図である。図12に示すように、1回目の血管体積測定において、出力制御機能163は、血管構造のうち、解析範囲を示すマーカ23の周辺に存在する少なくとも一つの特徴部位を抽出する。図示の例では、出力制御機能163は、特徴部位26,27,28を抽出する。ここで、特徴部位26,27,28は、血管構造に含まれる分岐点や湾曲部位に対応する。
FIG. 12 is a diagram for explaining the process of the optical ultrasonic
続いて、出力制御機能163は、抽出した特徴部位との位置関係により表される解析範囲の位置情報を記憶回路150に格納する。例えば、出力制御機能163は、解析範囲の位置情報を、特徴部位26からの距離及び方向、特徴部位27からの距離及び方向、特徴部位28からの距離及び方向の組み合わせにより生成する。そして、出力制御機能163は、生成した解析範囲を示すマーカ23の位置情報を記憶回路150に格納する。
Subsequently, the
そして、算出機能162は、1回目の血管構造画像データ20とは異なる新たな血管構造画像データが生成された場合に、記憶回路150に記憶された解析範囲の位置情報に基づいて、新たな血管構造画像データにおける解析範囲の位置を特定する。例えば、2回目の血管体積測定において、新たな血管構造画像データ80が生成される。ここで、算出機能162は、1回目の血管体積測定において記憶回路150に格納された解析範囲の位置情報を、記憶回路150から読み出す。そして、算出機能162は、血管構造画像データ80から特徴部位81,82,83を抽出する。ここで、特徴部位81は、血管構造画像データ20における特徴部位26に対応する。また、特徴部位82は、血管構造画像データ20における特徴部位27に対応する。また、特徴部位83は、血管構造画像データ20における特徴部位28に対応する。そして、算出機能162は、特徴部位81からの距離及び方向、特徴部位82からの距離及び方向、特徴部位83からの距離及び方向に基づいて、解析範囲を示すマーカ84の位置を特定する。
Then, when new blood vessel structure image data different from the first blood vessel
このように、算出機能162は、解析範囲を示すマーカ23に対応する解析範囲を示すマーカ84の位置を特定する。これにより、光超音波診断装置1は、2回目以降の血管体積測定においても1回目と同一の解析範囲の血管体積を測定することが可能である。
Thus, the
(第5の実施形態)
また、光超音波診断装置1は、生成した血管構造画像データと、他の医用画像診断装置(モダリティ)により撮像された医用画像データとの位置合わせを行うことで、種々の機能を実現可能である。
Fifth Embodiment
In addition, the optical ultrasonic
図13は、第5の実施形態に係る光超音波診断装置1の構成例を示すブロック図である。第5の実施形態に係る光超音波診断装置1は、図1に例示した光超音波診断装置1と同様の構成を備え、処理回路160が位置合わせ機能164を更に備える点と、算出機能162及び出力制御機能163の処理の一部が相違する。そこで、第5の実施形態では、第1の実施形態と相違する点を中心に説明することとし、第1の実施形態において説明した構成と同様の機能を有する点については、図1と同一の符号を付し、説明を省略する。
FIG. 13 is a block diagram showing an example of the configuration of the optical ultrasonic
第5の実施形態に係る位置合わせ機能164は、血管構造画像データ20と、他の医用画像診断装置により撮像された医用画像データとの位置合わせを行う。例えば、位置合わせ機能164は、医用画像データとして、X線CT(Computed Tomography)装置により撮像されたCT画像データとの位置合わせを行う。
The
例えば、位置合わせ機能164は、血管構造画像データ20とCT画像データとの間のパターンマッチングにより位置合わせを行う。具体的には、位置合わせ機能164は、血管構造画像データ20及びCT画像データのそれぞれから特徴的な領域(特徴部位)を抽出し、抽出した領域に類似する領域を互いに探索することで、血管構造画像データ20及びCT画像データの位置合わせを行う。なお、位置合わせ機能164は、パターンマッチングに限らず、従来の如何なる技術を用いて位置合わせを行っても良い。また、位置合わせ機能164は、CT画像データに限らず、任意のモダリティにより撮像された医用画像データとの位置合わせを実行可能である。なお、位置合わせ機能164は、位置合わせ部の一例である。
For example, the
図14は、第5の実施形態に係る位置合わせ機能の処理を説明するための図である。図14では、血管構造画像データ20とCT画像データ90とが位置合わせされる場合を例示する。
FIG. 14 is a diagram for explaining the processing of the alignment function according to the fifth embodiment. FIG. 14 illustrates the case where the blood vessel
図14に示すように、位置合わせ機能164は、血管構造画像データ20に含まれる特徴部位(血管構造に含まれる分岐点や湾曲部位)26,27,28と同一の特徴を有する特徴部位91,92,93を、CT画像データ90から抽出する。ここで、特徴部位91は、血管構造画像データ20における特徴部位26に対応する。また、特徴部位92は、血管構造画像データ20における特徴部位27に対応する。また、特徴部位93は、血管構造画像データ20における特徴部位28に対応する。そして、位置合わせ機能164は、互いに対応する特徴部位の位置を用いて、血管構造画像データ20及びCT画像データ90の位置合わせを行う。
As shown in FIG. 14, the
そして、出力制御機能163は、位置合わせ後の血管構造画像データ20及びCT画像データ90を重畳表示させる。例えば、CT画像データ90に血管以外の構造物(病変部等)が描出される場合には、出力制御機能163は、CT画像データ90上に血管構造画像データ20(若しくは血球画像データ10)を重畳表示させる。これにより、出力制御機能163は、病変部周辺における赤血球の様子を操作者に提示することができる。
Then, the
また、造影剤を用いて撮像された造影画像データがCT画像データ90として利用される場合には、出力制御機能163は、造影画像データであるCT画像データ90上に血管構造画像データ20(若しくは血球画像データ10)を重畳表示させる。血管構造画像データ20は、造影画像データよりも微細な血管を描出可能であるので、出力制御機能163は、重畳表示により、被検体P内の大小様々な血管を同時に表示することが可能となる。
When contrast image data imaged using a contrast agent is used as the
また、算出機能162は、位置合わせ後の血管構造画像データ20及びCT画像データ90に基づいて、血管構造画像データ20上で操作者により指定された解析範囲に含まれる血管体積を、CT画像データ90から算出する。例えば、算出機能162は、位置合わせ後の血管構造画像データ20及びCT画像データ90に基づいて、CT画像データ90上の解析範囲を示すマーカ94を特定する。ここで、解析範囲を示すマーカ94は、血管構造画像データ20上で設定された解析範囲を示すマーカ23に対応する。そして、算出機能162は、解析範囲を示すマーカ94に含まれる血管の画素位置を特定し、特定した画素の数に応じた体積を血管体積として算出する。これにより、算出機能162は、形態情報の信頼性が高いCT画像データ90に基づいて、血管体積を算出することができる。なお、算出機能162は、CT画像データ90に基づいて算出した血管体積を、ヘマトクリット値や血中濃度の算出に利用することができる。
In addition, the
(第6の実施形態)
上述した血管構造の推定処理は、超音波診断装置に適用することも可能である。
Sixth Embodiment
The estimation process of the blood vessel structure described above can also be applied to an ultrasonic diagnostic apparatus.
例えば、超音波診断装置は、ドラッグデリバリーシステムに利用されている。ドラッグデリバリーシステムとは、薬剤が封入されたマイクロバブルと超音波を用いて、特定の組織(ターゲット部位)に薬剤を注入する技術である。そこで、この技術と共に、上述した血管構造を推定する処理を実行可能な超音波診断装置を利用することで、ターゲット部位周辺の血管構造を描出するとともに、マイクロバブルの血中濃度や注入割合を解析することが可能となる。なお、マイクロバブルは、「造影バブル」又は単に「バブル」とも呼ばれる。 For example, ultrasound diagnostic devices are used in drug delivery systems. The drug delivery system is a technology for injecting a drug into a specific tissue (target site) using microbubbles in which the drug is enclosed and ultrasound. Therefore, together with this technology, by using an ultrasonic diagnostic device that can execute the above-described process of estimating the blood vessel structure, the blood vessel structure around the target site is depicted, and the blood concentration and injection ratio of the microbubbles are analyzed. It is possible to The microbubbles are also referred to as "contrast bubbles" or simply "bubbles".
図15は、第6の実施形態に係る超音波診断装置2の構成例を示すブロック図である。図15に示すように、第6の実施形態に係る超音波診断装置2は、装置本体300と、超音波プローブ102と、入力インターフェース103と、ディスプレイ104とを有する。なお、超音波プローブ102、入力インターフェース103、及びディスプレイ104の構成は、図1に示した超音波プローブ102、入力インターフェース103、及びディスプレイ104の構成と基本的に同様であるので説明を省略する。なお、被検体Pは、光超音波診断装置1の構成に含まれない。また、超音波診断装置2は、ドラッグデリバリーシステムにより薬剤の注入を行うための超音波診断装置と同一装置であっても良いし、別装置であっても良い。
FIG. 15 is a block diagram showing a configuration example of an ultrasonic
装置本体300は、超音波プローブ102が受信した超音波に基づいて画像データを生成する装置であり、図15に示すように、送受信回路310と、信号処理回路130と、画像生成回路140と、記憶回路150と、処理回路320とを有する。送受信回路310、信号処理回路130、画像生成回路140、記憶回路150、及び処理回路320は、相互に通信可能に接続される。
The apparatus
送受信回路310は、超音波(光超音波)を受信する受信回路120としての構成に加え、超音波を送信する送信回路としての構成を備える。つまり、送受信回路310は、レートパルサ発生回路と、送信遅延回路と、送信パルサとを有し、超音波プローブ102に駆動信号を供給する。これにより、送受信回路310は、超音波プローブ102から2次元又は3次元領域を走査するための超音波ビームを送信させる。
The transmitting and receiving
超音波プローブ102により送信された超音波の反射波は、超音波プローブ102により受信され、増幅及びA/D変換されてデジタルの電気信号として送受信回路310に入力される。送受信回路310は、超音波プローブ102から送信されたデジタルの電気信号に対して各種処理を行って受信データ(反射波データ)を生成する。この受信データを生成する処理は、図1に示した受信回路120の処理と同様であるので説明を省略する。すなわち、送受信回路310は、造影バブルが注入された被検体に対する超音波走査を行って、被検体Pから反射波データを収集する。なお、送受信回路310は、送受信部の一例である。
The reflected wave of the ultrasonic wave transmitted by the
信号処理回路130、画像生成回路140、及び記憶回路150の構成は、図1に示した信号処理回路130、画像生成回路140、及び記憶回路150の構成と基本的に同様であるが、送受信回路310により生成された反射波データに関する処理を行うことができる点が相違する。
The configurations of the signal processing circuit 130, the
信号処理回路130は、送受信回路310から受信した反射波データを用いて、被検体P内の特性値の分布データを生成する。具体的には、信号処理回路130は、反射波データに対して対数増幅及び包絡線検波処理等を行って、サンプル点ごとの信号強度(振幅強度)が輝度の明るさで表現されるデータ(Bモードデータ)を生成する。また、信号処理回路130は、検波周波数を変化させることで、映像化する周波数帯域を変えることができる。この機能を用いることにより、信号処理回路130は、造影バブルからの非線形信号を映像化するコントラストハーモニックイメージング(CHI:Contrast Harmonic Imaging)を実行可能である。例えば、信号処理回路130は、造影画像データの元となるBモードデータを生成することができる。
The signal processing circuit 130 generates distribution data of characteristic values in the object P using the reflected wave data received from the transmitting and receiving
また、信号処理回路130は、反射波データを周波数解析することで、ドプラ効果に基づく移動体(血流や組織、造影剤エコー成分等)の運動情報を抽出し、抽出した運動情報を示すデータ(ドプラデータ)を生成する。例えば、信号処理回路130は、移動体の運動情報として、平均速度、平均分散値及び平均パワー値等を多点に渡り抽出し、抽出した移動体の運動情報を示すドプラデータを生成する。 The signal processing circuit 130 also analyzes the frequency of the reflected wave data to extract motion information of a moving body (blood flow, tissue, contrast agent echo component, etc.) based on the Doppler effect, and data indicating the extracted motion information. Generate (Doppler data). For example, the signal processing circuit 130 extracts an average velocity, an average dispersion value, an average power value, and the like over multiple points as motion information of the moving object, and generates Doppler data indicating motion information of the extracted moving object.
画像生成回路140は、反射波データに基づいて生成されたデータから、超音波画像データを生成する。例えば、画像生成回路140は、信号処理回路130が生成したBモードデータから、反射波の強度を輝度で表したBモード画像データを生成する。また、画像生成回路140は、CHIを行う場合、信号処理回路130が生成したBモードデータから、造影バブルからの非線形信号を映像化した造影画像データを生成する。また、画像生成回路140は、信号処理回路130が生成したドプラデータから、血流情報が映像化されたドプラ画像データを生成する。ドプラ画像データは、速度画像データ、分散画像データ、パワー画像データ、又は、これらを組み合わせた画像データである。すなわち、画像生成回路140は、反射波データに基づいて、造影バブルを反射源とする反射波の信号強度の分布を表す造影画像データを生成する。
The
記憶回路150は、画像生成回路140により生成された超音波画像データを付帯情報とともに記憶する。
The
処理回路320は、超音波診断装置2の処理全体を制御する。例えば、処理回路320は、入力インターフェース103を介して操作者から入力された各種設定要求や、記憶回路150から読込んだ各種制御プログラム及び各種データに基づき、送受信回路310、信号処理回路130、及び画像生成回路140の処理を制御する。また、処理回路320は、記憶回路150が記憶する超音波画像データをディスプレイ104にて表示させる。
The processing circuit 320 controls the entire processing of the ultrasound
また、処理回路320は、図15に示すように、推定機能321と、算出機能322と、出力制御機能323とを実行する。推定機能321、算出機能322、及び出力制御機能323の処理は、図1に示した推定機能161、算出機能162、出力制御機能163の処理と基本的に同様であるが、画像生成回路140により生成された超音波画像データに関する処理を行うことができる点が相違する。
Further, as shown in FIG. 15, the processing circuit 320 executes an
図16を用いて、第6の実施形態に係る超音波診断装置2における処理について具体的に説明する。図16は、第6の実施形態に係る超音波診断装置2における処理の処理手順を示すフローチャートである。図16に示す処理手順は、例えば、血管構造を表示する旨の入力(指示)を操作者から受け付けた場合に開始される。図16では、図17、図18、及び図19を参照しつつ説明する。図17、図18、及び図19は、第6の実施形態に係る算出機能322の処理を説明するための図である。
The process in the ultrasonic
ステップS401において、処理回路320は、処理タイミングか否かを判定する。この処理は、図2に示したステップS101の処理と基本的に同様であるので、説明を省略する。 In step S401, the processing circuit 320 determines whether processing timing has come. This process is basically the same as the process of step S101 shown in FIG.
ステップS402において、処理回路160は、複数の造影画像データを読み出す。この処理は、処理対象が「造影画像データ」である点を除き、図2に示したステップS102の処理と基本的に同様であるので、説明を省略する。なお、処理対象となる造影画像データは、ドラッグデリバリーシステムによる薬剤の注入が行われる際に撮像された3次元の画像データである。なお、処理回路160は、撮像(超音波検査)中に画像生成回路140により生成された造影画像データをリアルタイムで読み出すことも、撮像後(例えば、一定時間経過後)に事後的に読み出すことも可能である。なお、「リアルタイム」とは、処理対象となる各データが発生するたびに、即時に各処理を行うことを意味する。つまり、リアルタイムとは、各処理の処理時間による遅れを含む概念である。
In step S402, the
ステップS403において、推定機能321は、複数の造影画像データを重ね合わせることで、血管構造を推定する。例えば、図17に示すように、推定機能321は、1〜Nフレーム目までの複数枚の造影画像データを重ね合わせることで、血管構造画像データ330を生成する。すなわち、推定機能321は、所定期間にわたって生成された造影画像データに基づいて、被検体Pの血管構造を推定する。この処理(血管構造の推定処理)は、処理対象が「造影画像データ」である点を除き、図2に示したステップS103の処理と基本的に同様であるので、詳細な説明を省略する。
In step S403, the
ステップS404において、出力制御機能323は、血管構造画像データを表示させる。例えば、図17に示すように、出力制御機能323は、血管構造画像データ330を表示させる。この処理は、図2に示したステップS104の処理と基本的に同様であるので、詳細な説明を省略する。
In step S404, the output control function 323 displays blood vessel structure image data. For example, as shown in FIG. 17, the output control function 323 causes the blood vessel
ステップS405において、算出機能322は、解析範囲を指定する操作を受け付ける。例えば、図17に示すように、操作者は、解析範囲を示すマーカ331を血管構造画像データ330上に設定する。操作者は、マーカ331の位置、形状、大きさ、及び方向等を任意に設定することができる。なお、図17に示す拡大画像332は、マーカ331に含まれる領域の拡大画像である。この処理は、図2に示したステップS105の処理と基本的に同様であるので、詳細な説明を省略する。
In step S405, the calculation function 322 receives an operation for specifying an analysis range. For example, as shown in FIG. 17, the operator sets a
ステップS406において、算出機能322は、造影剤の血中濃度を算出する。つまり、算出機能322は、血管構造のうち操作者により指定された範囲(解析範囲)に含まれる造影バブルの濃度を算出する。 In step S406, the calculation function 322 calculates the blood concentration of the contrast agent. That is, the calculation function 322 calculates the density of the contrast bubble included in the range (analysis range) designated by the operator in the blood vessel structure.
図17に示すように、算出機能322は、まず、血管構造のうち、操作者により指定された範囲(解析範囲)に含まれる血管の体積(血管体積)を算出する。具体的には、操作者がマーカ331の位置、形状、大きさ、及び方向等を確定する操作を行うと、算出機能322は、確定されたマーカ331に含まれる血管の体積を算出する。より具体的には、算出機能322は、マーカ331に含まれる複数の造影バブルの画素位置を特定し、特定した画素の数に応じた体積を血管体積として算出する。なお、1画素当たりの体積は、超音波診断装置2や超音波プローブ102の装置構成により規定される。
As shown in FIG. 17, the calculation function 322 first calculates the volume (blood vessel volume) of the blood vessel included in the range (analysis range) designated by the operator in the blood vessel structure. Specifically, when the operator performs an operation to determine the position, shape, size, direction, and the like of the
続いて、算出機能322は、Nフレーム目の造影画像データにおいて、解析範囲に含まれるバブル量を計測する。図17に示す拡大画像340は、Nフレーム目の造影画像データのうち拡大画像332に対応する領域の画像である。例えば、算出機能322は、Nフレーム目の造影画像データにおける解析範囲(つまり、拡大画像340の領域)内に含まれる複数の造影バブルの画素位置を特定し、特定した画素の数に応じてバブル量を計測する。なお、1バブル当たりの体積は造影バブルごとに既知の情報であるので、1画素当たりの体積と組み合わせることでバブル量を算出可能である。
Subsequently, the calculation function 322 measures the bubble amount included in the analysis range in the contrast image data of the Nth frame. The
そして、算出機能322は、所定のフレームの造影画像データのうち解析範囲に含まれる造影バブルの量を、解析範囲に対応する血管の体積で除算することで、バブルの血中濃度を算出する。図19に示す例では、血管体積が「V」、バブル量が「A1」である。この場合、算出機能322は、バブルの血中濃度「C1=A1/V」を算出する。 Then, the calculation function 322 calculates the blood concentration of the bubble by dividing the volume of the contrast bubble included in the analysis range in the contrast image data of the predetermined frame by the volume of the blood vessel corresponding to the analysis range. In the example shown in FIG. 19, the blood vessel volume is “V” and the bubble amount is “A1”. In this case, the calculation function 322 calculates the blood concentration "C1 = A1 / V" of the bubble.
なお、上記の説明内容はあくまで一例であり、上記の説明内容に限定されるものではない。例えば、図17では、Nフレーム目の血中濃度を算出する場合を説明したが、これに限らず、任意のフレームにおける血中濃度を算出可能である。 In addition, said description content is an example to the last, It is not limited to said description content. For example, although FIG. 17 illustrates the case where the blood concentration at the Nth frame is calculated, the present invention is not limited to this, and the blood concentration in any frame can be calculated.
ステップS407において、算出機能322は、薬剤の注入量を算出する。つまり、算出機能322は、血管構造のうち操作者により指定された範囲における薬剤の組織への注入割合を算出する。 In step S407, the calculation function 322 calculates the injection amount of the medicine. That is, the calculation function 322 calculates the injection ratio of the drug into the tissue in the range designated by the operator in the blood vessel structure.
図18に示すように、算出機能322は、まず、血管構造のうち、操作者により指定された範囲(解析範囲)に含まれる血管の体積(血管体積)を算出する。なお、血管体積を算出する処理は、ステップS406の処理と同様であるので説明を省略する。 As shown in FIG. 18, the calculation function 322 first calculates the volume (blood vessel volume) of the blood vessel included in the range (analysis range) designated by the operator in the blood vessel structure. The process of calculating the blood vessel volume is the same as the process of step S406, and thus the description thereof is omitted.
そして、操作者は、Mフレーム目において、超音波の音圧で造影バブル(微小気泡)を崩壊させ、組織内に薬剤を注入する。この結果、Mフレーム目の造影画像データ341では造影バブルが消失する。なお、図18に示す拡大画像341は、Mフレーム目の造影画像データのうち拡大画像332に対応する領域の画像である。拡大画像332において、破線で囲まれた丸印は、崩壊した造影バブルを示す。図18の例では、Mフレーム目における解析範囲内の全ての造影バブルが完全に消失しているが、完全に消失しない場合もある。なお、Mは、1以上の整数である。
Then, at the M-th frame, the operator disrupts the contrast bubble (microbubble) with the sound pressure of the ultrasonic wave, and injects the drug into the tissue. As a result, the contrast bubble disappears in the
そして、算出機能322は、M+1フレーム目の造影画像データにおいて、解析範囲に含まれるバブル量を計測する。ここで計測されるバブル量は、崩壊せずに残存している「残存バブル量」に対応する。図18に示す拡大画像342は、M+1フレーム目の造影画像データのうち拡大画像332に対応する領域の画像である。例えば、算出機能322は、M+1フレーム目の造影画像データにおける解析範囲(つまり、拡大画像342の領域)内に含まれる複数の造影バブルの画素位置を特定し、特定した画素の数に応じて残存バブル量を計測する。なお、バブル量を計測する処理は、ステップS406の処理と同様であるので説明を省略する。
Then, the calculation function 322 measures the bubble amount included in the analysis range in the contrast image data of the (M + 1) th frame. The bubble amount measured here corresponds to the "remaining bubble amount" remaining without collapse. The
そして、算出機能322は、造影バブルの崩壊前のフレームの造影画像データにおける造影バブルの量から、造影バブルの崩壊後のフレームの造影画像データにおける造影バブルの量を減算した値を、解析範囲に対応する血管の体積で除算することで、注入割合を算出する。図19に示す例では、残存バブル量が「A2」である。この場合、算出機能322は、バブルの崩壊率「R1=A2/A1」を算出する。また、算出機能322は、薬剤の注入量「A3=A1−A2」を算出する。また、算出機能322は、薬剤の注入割合「R2=A3/V」を算出する。 The calculation function 322 sets a value obtained by subtracting the amount of contrast bubble in the contrast image data of the frame after the collapse of the contrast bubble from the amount of contrast bubble in the contrast image data of the frame before the collapse of the contrast bubble in the analysis range. The infusion rate is calculated by dividing by the volume of the corresponding blood vessel. In the example shown in FIG. 19, the remaining bubble amount is “A2”. In this case, the calculation function 322 calculates the collapse rate “R1 = A2 / A1” of the bubble. In addition, the calculation function 322 calculates the injection amount of medicine “A3 = A1-A2”. In addition, the calculation function 322 calculates the injection ratio “R2 = A3 / V” of the medicine.
なお、上記の説明内容はあくまで一例であり、上記の説明内容に限定されるものではない。例えば、図18では、残存バブル量を、Mフレーム目から「1フレーム後」の造影画像データから算出する場合を説明したが、「数フレーム後」の造影画像データから算出してもよい。 In addition, said description content is an example to the last, It is not limited to said description content. For example, although FIG. 18 illustrates the case where the residual bubble amount is calculated from contrast image data “one frame later” from the M-th frame, it may be calculated from contrast image data “some frames later”.
また、図19では、バブルの血中濃度、バブルの崩壊率、薬剤の注入量、及び薬剤の注入割合を算出する場合を説明したが、これに限定されるものではない。例えば、算出機能322は、バブルの血中濃度、バブルの崩壊率、薬剤の注入量、及び薬剤の注入割合のうち任意のパラメータのみを算出することができる。また、算出機能322は、血管体積「V」、バブル量「A1」、及び残存バブル量「A2」のうちの任意の組み合わせの四則演算により算出可能なあらゆるパラメータを算出することができる。 Although FIG. 19 illustrates the case where the blood concentration of the bubble, the decay rate of the bubble, the injection amount of the drug, and the injection ratio of the drug are calculated, the present invention is not limited thereto. For example, the calculation function 322 can calculate only arbitrary parameters among the blood concentration of the bubble, the decay rate of the bubble, the injection amount of the drug, and the injection ratio of the drug. Further, the calculation function 322 can calculate any parameter that can be calculated by four arithmetic operations of any combination of the blood vessel volume “V”, the bubble amount “A1”, and the remaining bubble amount “A2”.
ステップS408において、出力制御機能323は、算出結果を表示させる。例えば、出力制御機能323は、算出機能322により算出されたバブルの血中濃度、バブルの崩壊率、薬剤の注入量、及び薬剤の注入割合等の任意のパラメータをディスプレイ104に表示させる。
In step S408, the output control function 323 displays the calculation result. For example, the output control function 323 causes the
なお、図16に示した処理手順はあくまで一例であり、図示した順序に限定されるものではない。例えば、図示した処理手順は、処理内容に矛盾が生じない範囲で任意に変更可能である。例えば、図示した処理手順のうち、ステップS406及びステップS407の処理のうちいずれか一方は実行されなくても良い。 The processing procedure shown in FIG. 16 is merely an example, and the present invention is not limited to the illustrated order. For example, the illustrated processing procedure can be arbitrarily changed as long as no contradiction occurs in the processing content. For example, among the illustrated processing procedures, one of the processing of step S406 and step S407 may not be performed.
このように、第6の実施形態に係る超音波診断装置2は、造影画像データを用いて、血管構造の推定処理を実行することができる。これにより、超音波診断装置2は、ドラッグデリバリーシステムに関連する各種のパラメータを算出し、操作者(医師)に提供することができる。
As described above, the ultrasonic
一般的な超音波診断装置において、血管の造影を目的として造影画像を撮像する場合には、造影バブルが連なって描出されるのに十分な量の造影バブルが注入されるので、血管構造が描出される。しかしながら、ドラッグデリバリーシステムにおいては、患者(被検体)への薬剤の投与量に基づいて造影バブルの注入量が決定されるため、十分量の造影バブルが注入されるとは限らず、血管構造が描出されない場合がある。一方、第6の実施形態に係る超音波診断装置2は、造影バブルが連なって描出されていなくとも、複数の造影画像を重ねることで血管構造を推定する。このため、第6の実施形態に係る超音波診断装置2は、ドラッグデリバリーシステムにより薬剤注入が行われるターゲット部位周辺の血管構造を推定することができる。
In the case of imaging a contrast image for the purpose of imaging blood vessels in a general ultrasonic diagnostic apparatus, a sufficient amount of contrast bubbles are injected so that the contrast bubbles are continuously drawn, so that the blood vessel structure is visualized. Be done. However, in the drug delivery system, since the injection amount of the contrast bubble is determined based on the dose of the drug to the patient (subject), the sufficient amount of contrast bubble is not necessarily injected, and the blood vessel structure It may not be depicted. On the other hand, the ultrasonic
また、第6の実施形態に係る超音波診断装置2は、ドラッグデリバリーシステムが利用される場合に限らず、ドラッグデリバリーシステムが利用されない場合にも有用である。例えば、一般的なCHIにおいても、超音波走査を行うことによりマイクロバブルは徐々に崩壊してしまう。このため、超音波走査を一定期間以上行うと、造影バブルが崩壊し、造影バブルが連なって描出されなくなる可能性がある。このような場合にも、超音波診断装置2による血管構造の推定処理は有用である。
The ultrasonic
また、例えば、血管が細い場合には、血管に造影バブルが十分に入らず、造影バブルが連なって描出されない可能性がある。このような場合にも、超音波診断装置2による血管構造の推定処理は有用である。
Also, for example, when the blood vessel is thin, the contrast bubble may not sufficiently enter the blood vessel, and the contrast bubble may not be drawn continuously. Also in such a case, the estimation process of the blood vessel structure by the ultrasonic
また、例えば、撮像部位が造影バブルの注入部位から離れている場合にも、撮像部位に十分な量の造影バブルが到達せず、造影バブルが連なって描出されない可能性がある。このような場合にも、超音波診断装置2による血管構造の推定処理は有用である。
Also, for example, even when the imaging site is apart from the injection site of the contrast bubble, a sufficient amount of contrast bubbles may not reach the imaging site, and the contrast bubbles may not be drawn continuously. Also in such a case, the estimation process of the blood vessel structure by the ultrasonic
また、ドプラモードでは、一般的に、血流速度が遅い場合には描出能が低下する。一方、第6の実施形態に係る超音波診断装置2は、血流速度が遅くとも血管構造を描出することが可能である。
Also, in the Doppler mode, in general, when the blood flow velocity is slow, the imaging ability is reduced. On the other hand, the ultrasonic
なお、上述した超音波診断装置2の構成はあくまで一例であり、図15の内容に限定されるものではない。例えば、超音波診断装置2は、更に、PAIを実行可能な構成(例えば光照射部101、光源110等)を備えていても良い。
The configuration of the ultrasonic
(その他の実施形態)
上述した実施形態以外にも、種々の異なる形態にて実施されてもよい。
(Other embodiments)
The present invention may be embodied in various different forms other than the above-described embodiment.
(1回の光超音波の受信による血管構造画像データの撮像)
上記の実施形態では、複数枚の血球画像データ10を重ね合わせることで、血管構造画像データ20を生成する場合を説明したが、実施形態はこれに限定されるものではない。例えば、光超音波診断装置1は、1回の光超音波の受信により血管構造画像データ20を撮像することも可能である。
(Imaging of blood vessel structure image data by receiving light ultrasound once)
In the above embodiment, the blood vessel
例えば、画像生成回路140は、所定期間にわたる1回の受信により得られた光超音波に基づいて、赤血球の軌跡が描出された画像データを1つ生成する。つまり、超音波プローブ102は、所定期間(例えば、数ミリ秒)の間において光超音波を受信し続けることで、個々の赤血球が移動しながら発した光超音波を受信する。この光超音波により生成される画像データには、所定期間の間に赤血球が移動した軌跡が描出されることとなる。
For example, the
そこで、推定機能161は、この画像データに描出された赤血球の軌跡に基づいて、血管構造を推定する。具体的には、画像生成回路140により生成された画像データには、複数の赤血球の軌跡が互いに重なり合って描出されることとなる。そこで、推定機能161は、描出された全ての赤血球の軌跡を、血管位置として特定することで、血管構造を推定する。これにより、光超音波診断装置1は、1回の光超音波の受信により血管構造画像データ20を撮像することができる。
Therefore, the
(2次元画像データの利用)
また、上記の実施形態では、3次元の画像データ(血球画像データ、造影画像データ)を用いて血管体積を算出する場合を説明したが、実施形態はこれに限定されるものではない。例えば、2次元画像データ(断層像)が用いられる場合にも、血管体積を算出可能である。例えば、推定機能161は、複数の2次元の血球画像データを重ね合わせることで、2次元の血管構造を推定する。そして、算出機能162は、解析範囲に含まれる血管の芯線を回転軸とする回転体の体積を、血管体積として算出することができる。また、算出機能162は、断層像における血球(又は造影剤)の存在割合等から、血中濃度を推定することもできる。
(Use of 2D image data)
In the above embodiment, the blood vessel volume is calculated using three-dimensional image data (blood cell image data, contrast image data), but the embodiment is not limited to this. For example, even when two-dimensional image data (tomographic image) is used, the blood vessel volume can be calculated. For example, the
(医用画像処理装置への適用)
上述した実施形態において説明した処理は、医用画像処理装置においても同様に実現可能である。
(Application to medical image processing device)
The processing described in the above-described embodiment can be similarly realized in a medical image processing apparatus.
図20は、その他の実施形態に係る医用画像処理装置200の構成例を示すブロック図である。医用画像処理装置200は、例えば、パーソナルコンピュータやワークステーション等の情報処理装置、又は、X線CT装置に含まれるコンソール装置等の医用画像診断装置の制御装置に対応する。 FIG. 20 is a block diagram showing a configuration example of a medical image processing apparatus 200 according to another embodiment. The medical image processing apparatus 200 corresponds to, for example, an information processing apparatus such as a personal computer or a workstation, or a control apparatus of a medical image diagnostic apparatus such as a console apparatus included in an X-ray CT apparatus.
図20に示すように、医用画像処理装置200は、入力インターフェース201、ディスプレイ202、記憶回路210、及び処理回路220を備える。入力インターフェース201、ディスプレイ202、記憶回路210、及び処理回路220は、相互に通信可能に接続される。
As shown in FIG. 20, the medical image processing apparatus 200 includes an input interface 201, a
入力インターフェース201は、マウス、キーボード、タッチパネル等、操作者からの各種の指示や設定要求を受け付けるための入力装置である。ディスプレイ202は、医用画像を表示したり、操作者が入力インターフェース201を用いて各種設定要求を入力するためのGUIを表示したりする表示装置である。
The input interface 201 is an input device for receiving various instructions and setting requests from the operator, such as a mouse, a keyboard, and a touch panel. The
記憶回路210は、例えば、NAND(Not AND)型フラッシュメモリやHDD(Hard Disk Drive)であり、医用画像データやGUIを表示するための各種のプログラムや、当該プログラムによって用いられる情報を記憶する。
The
処理回路220は、医用画像処理装置200における処理全体を制御する電子機器(プロセッサ)である。処理回路220は、推定機能221、算出機能222、及び出力制御機能223を実行する。処理回路220が実行する各処理機能は、例えば、コンピュータによって実行可能なプログラムの形態で記憶回路210内に記録されている。処理回路220は、各プログラムを読み出し、実行することで読み出した各プログラムに対応する機能を実現する。
The
処理回路220は、図1に示した処理回路160と基本的に同様の処理を実行可能である。処理回路220は、複数の血球画像データを読み出す。つまり、取得部としての処理回路220は、予め設定された波長を有する光の照射により被検体内で発生した光超音波に基づいて生成された画像データであって、赤血球が描出された画像データを取得する。
The
また、推定機能221は、図1に示した推定機能161と基本的に同様の処理を実行可能である。つまり、推定機能221は、所定期間にわたって生成された画像データに基づいて、被検体の血管構造を推定する。
Further, the
また、算出機能222は、図1に示した算出機能162と基本的に同様の処理を実行可能である。つまり、算出機能222は、血管構造のうち、操作者により指定された範囲に含まれる血管体積を算出する。
Also, the
また、出力制御機能223は、図1に示した出力制御機能163と基本的に同様の処理を実行可能である。つまり、出力制御機能223は、血管構造に関する情報を出力する。これによれば、医用画像処理装置200は、血管構造を容易に描出することができる。
Also, the output control function 223 can execute basically the same processing as the
なお、上述した実施形態においては、単一の処理回路160にて、各処理機能が実現されるものとして説明したが、複数の独立したプロセッサを組み合わせて処理回路を構成し、各プロセッサがプログラムを実行することにより機能を実現するものとしても構わない。
In the embodiment described above, each processing function is realized by a
上記説明において用いた「プロセッサ」という文言は、例えば、CPU(Central Processing Unit)、GPU(Graphics Processing Unit)、或いは、特定用途向け集積回路(Application Specific Integrated Circuit:ASIC)、プログラマブル論理デバイス(例えば、単純プログラマブル論理デバイス(Simple Programmable Logic Device:SPLD)、複合プログラマブル論理デバイス(Complex Programmable Logic Device:CPLD)、及びフィールドプログラマブルゲートアレイ(Field Programmable Gate Array:FPGA))等の回路を意味する。プロセッサは記憶回路150に保存されたプログラムを読み出し実行することで機能を実現する。なお、記憶回路150にプログラムを保存する代わりに、プロセッサの回路内にプログラムを直接組み込むよう構成しても構わない。この場合、プロセッサは回路内に組み込まれたプログラムを読み出し実行することで機能を実現する。なお、本実施形態の各プロセッサは、プロセッサごとに単一の回路として構成される場合に限らず、複数の独立した回路を組み合わせて1つのプロセッサとして構成し、その機能を実現するようにしてもよい。更に、各図における複数の構成要素を1つのプロセッサへ統合してその機能を実現するようにしてもよい。
The word “processor” used in the above description is, for example, a central processing unit (CPU), a graphics processing unit (GPU), an application specific integrated circuit (ASIC), a programmable logic device (for example, It means circuits such as Simple Programmable Logic Device (SPLD), Complex Programmable Logic Device (CPLD), and Field Programmable Gate Array (FPGA). The processor implements a function by reading and executing a program stored in the
また、図示した各装置の各構成要素は機能概念的なものであり、必ずしも物理的に図示の如く構成されていることを要しない。すなわち、各装置の分散・統合の具体的形態は図示のものに限られず、その全部又は一部を、各種の負荷や使用状況等に応じて、任意の単位で機能的又は物理的に分散・統合して構成することができる。更に、各装置にて行なわれる各処理機能は、その全部又は任意の一部が、CPU及び当該CPUにて解析実行されるプログラムにて実現され、或いは、ワイヤードロジックによるハードウェアとして実現され得る。 Further, each component of each device illustrated is functionally conceptual, and does not necessarily have to be physically configured as illustrated. That is, the specific form of the dispersion and integration of each device is not limited to that shown in the drawings, and all or a part thereof is functionally or physically dispersed in any unit depending on various loads, usage conditions, etc. It can be integrated and configured. Furthermore, all or any part of each processing function performed in each device may be realized by a CPU and a program analyzed and executed by the CPU, or may be realized as wired logic hardware.
また、上記の実施形態において説明した各処理のうち、自動的に行なわれるものとして説明した処理の全部又は一部を手動的に行なうこともでき、或いは、手動的に行なわれるものとして説明した処理の全部又は一部を公知の方法で自動的に行なうこともできる。この他、上記文書中や図面中で示した処理手順、制御手順、具体的名称、各種のデータやパラメータを含む情報については、特記する場合を除いて任意に変更することができる。 Further, among the processes described in the above embodiment, all or part of the process described as being automatically performed may be manually performed, or the process described as being manually performed. All or part of can be performed automatically by known methods. In addition to the above, the processing procedures, control procedures, specific names, and information including various data and parameters shown in the above documents and drawings can be arbitrarily changed unless otherwise specified.
また、上記の実施形態で説明した医用画像処理方法は、予め用意された医用画像処理プログラムをパーソナルコンピュータやワークステーション等のコンピュータで実行することによって実現することができる。この医用画像処理プログラムは、インターネット等のネットワークを介して配布することができる。また、この医用画像処理プログラムは、ハードディスク、フレキシブルディスク(FD)、CD−ROM、MO、DVD等のコンピュータで読み取り可能な記録媒体に記録され、コンピュータによって記録媒体から読み出されることによって実行することもできる。 In addition, the medical image processing method described in the above embodiment can be realized by executing a medical image processing program prepared in advance by a computer such as a personal computer or a workstation. The medical image processing program can be distributed via a network such as the Internet. In addition, the medical image processing program may be recorded on a computer-readable recording medium such as a hard disk, a flexible disk (FD), a CD-ROM, an MO, and a DVD, and may be executed by being read from the recording medium by a computer. it can.
以上説明した少なくともひとつの実施形態によれば、血管構造を容易に描出することができる。 According to at least one embodiment described above, the blood vessel structure can be easily depicted.
本発明のいくつかの実施形態を説明したが、これらの実施形態は、例として提示したものであり、発明の範囲を限定することは意図していない。これら実施形態は、その他の様々な形態で実施されることが可能であり、発明の要旨を逸脱しない範囲で、種々の省略、置き換え、変更を行うことができる。これら実施形態やその変形は、発明の範囲や要旨に含まれると同様に、特許請求の範囲に記載された発明とその均等の範囲に含まれるものである。 While certain embodiments of the present invention have been described, these embodiments have been presented by way of example only, and are not intended to limit the scope of the invention. These embodiments can be implemented in other various forms, and various omissions, replacements, and modifications can be made without departing from the scope of the invention. These embodiments and modifications thereof are included in the invention described in the claims and the equivalents thereof as well as included in the scope and the gist of the invention.
1 光超音波診断装置
160 処理回路
161 推定機能
162 算出機能
163 出力制御機能
DESCRIPTION OF
Claims (17)
前記光の照射により被検体内で発生した光超音波を受信する受信部と、
前記光超音波に基づいて、赤血球が描出された血球画像データを生成する画像生成部と、
所定期間にわたって生成された前記血球画像データに基づいて、前記被検体の血管構造を推定する推定部と、
前記血管構造に関する情報を出力する出力制御部と
を備える、光超音波診断装置。 An irradiation unit for irradiating light having a preset wavelength;
A receiver configured to receive optical ultrasonic waves generated in the subject by the irradiation of the light;
An image generation unit that generates blood cell image data in which red blood cells are drawn based on the light ultrasonic waves;
An estimation unit configured to estimate the blood vessel structure of the subject based on the blood cell image data generated over a predetermined period;
An output control unit that outputs information related to the blood vessel structure.
前記推定部は、生成された複数の血球画像データを重ね合わせることで、前記血管構造が描出された血管構造画像データを生成し、前記血管構造画像データに基づいて前記血管構造を推定する、
請求項1に記載の光超音波診断装置。 The image generation unit generates a plurality of blood cell image data over the predetermined period, based on light ultrasonic waves obtained by the plurality of receptions over the predetermined period.
The estimation unit generates blood vessel structure image data in which the blood vessel structure is depicted by superimposing the plurality of generated blood cell image data, and estimates the blood vessel structure based on the blood vessel structure image data.
An optical ultrasonic diagnostic apparatus according to claim 1.
前記出力制御部は、前記動的な部分及び前記静的な部分の少なくとも一方を示す画像データを表示する、
請求項2に記載の光超音波診断装置。 The estimation unit identifies each of a dynamic part and a static part in the blood vessel structure image data by comparing the plurality of blood cell image data with each other,
The output control unit displays image data indicating at least one of the dynamic part and the static part.
The optical ultrasonic diagnostic device according to claim 2.
前記推定部は、前記画像データに描出された前記赤血球の軌跡に基づいて、前記血管構造が描出された血管構造画像データを生成し、前記血管構造画像データに基づいて前記血管構造を推定する、
請求項1に記載の光超音波診断装置。 The image generation unit generates one blood cell image data in which the trajectory of the red blood cell is drawn, based on the light ultrasonic waves obtained by one reception over the predetermined period.
The estimation unit generates blood vessel structure image data in which the blood vessel structure is drawn based on a locus of the red blood cells drawn in the image data, and estimates the blood vessel structure based on the blood vessel structure image data.
An optical ultrasonic diagnostic apparatus according to claim 1.
前記画像生成部は、前記被検体の3次元領域内で発生した前記光超音波に基づいて、3次元の血球画像データを生成し、
前記推定部は、前記3次元の血球画像データに基づいて、3次元の血管構造を推定し、
前記算出部は、前記3次元の血管構造のうち、操作者により指定された範囲に含まれる血管の体積を算出し、
前記出力制御部は、前記体積を出力する、
請求項1〜4のいずれか一つに記載の光超音波診断装置。 Further comprising a calculation unit that performs calculation processing;
The image generation unit generates three-dimensional blood cell image data based on the light ultrasonic waves generated in the three-dimensional region of the subject.
The estimation unit estimates a three-dimensional blood vessel structure based on the three-dimensional blood cell image data,
The calculation unit calculates the volume of the blood vessel included in the range designated by the operator in the three-dimensional blood vessel structure,
The output control unit outputs the volume.
The photoacoustic imaging apparatus according to any one of claims 1 to 4.
前記算出部は、前記標識物質画像データに描出された前記標識物質の数と、前記血管の体積とに基づいて、前記血管における前記標識物質の濃度を算出する、
請求項5に記載の光超音波診断装置。 The image generation unit generates labeled substance image data in which a labeled substance is drawn for the same target area as the target area of the three-dimensional blood cell image data;
The calculation unit calculates the concentration of the labeled substance in the blood vessel based on the number of the labeled substance depicted in the labeled substance image data and the volume of the blood vessel.
The optical ultrasonic diagnostic device according to claim 5.
前記算出部は、前記血管構造が描出された血管構造画像データとは異なる新たな血管構造画像データが生成された場合に、前記記憶回路に記憶された前記範囲の位置情報に基づいて、前記新たな血管構造画像データにおける前記範囲の位置を特定する、
請求項5又は6に記載の光超音波診断装置。 The output control unit extracts at least one feature site existing around the range in the blood vessel structure, and stores, in a memory circuit, position information of the range represented by a positional relationship with the extracted feature site. And
The calculation unit is configured to generate the new blood vessel structure image data different from the blood vessel structure image data in which the blood vessel structure is drawn, based on the position information of the range stored in the storage circuit. Identifying the location of the range in various blood vessel structure image data,
An optical ultrasonic diagnostic apparatus according to claim 5 or 6.
請求項1〜7のいずれか一つに記載の光超音波診断装置。 The apparatus further comprises an alignment unit that aligns the blood vessel structure image data in which the blood vessel structure is depicted with medical image data captured by another medical image diagnostic apparatus.
The optical ultrasonic diagnostic device according to any one of claims 1 to 7.
請求項8に記載の光超音波診断装置。 The output control unit superimposes and displays the blood vessel structure image data and the medical image data after the alignment.
The optical ultrasonic diagnostic device according to claim 8.
前記算出部は、更に、前記位置合わせ後の前記血管構造画像データ及び前記医用画像データに基づいて、前記血管構造画像データ上で操作者により指定された範囲に含まれる前記血管の体積を、前記医用画像データから算出する、
請求項8に記載の光超音波診断装置。 The blood vessel structure further includes a calculator configured to calculate the volume of the blood vessel included in the range designated by the operator in the blood vessel structure,
The calculation unit further determines the volume of the blood vessel included in a range designated by the operator on the blood vessel structure image data based on the blood vessel structure image data after the alignment and the medical image data. Calculated from medical image data
The optical ultrasonic diagnostic device according to claim 8.
所定期間にわたって生成された前記血球画像データに基づいて、前記被検体の血管構造を推定する推定部と、
前記血管構造に関する情報を出力する出力制御部と
を備える、医用画像処理装置。 An acquisition unit configured to acquire blood cell image data in which red blood cells are drawn, which is blood cell image data generated based on light ultrasonic waves generated in a subject by irradiation of light having a preset wavelength;
An estimation unit configured to estimate the blood vessel structure of the subject based on the blood cell image data generated over a predetermined period;
An output control unit configured to output information on the blood vessel structure.
所定期間にわたって生成された前記血球画像データに基づいて、前記被検体の血管構造を推定し、
前記血管構造に関する情報を出力する
各処理をコンピュータに実行させる、医用画像処理プログラム。 Blood cell image data generated based on light ultrasonic waves generated in a subject by irradiation of light having a preset wavelength, which is blood cell image data in which red blood cells are drawn,
Estimating a blood vessel structure of the subject based on the blood cell image data generated over a predetermined period;
A medical image processing program that causes a computer to execute each process for outputting information related to the blood vessel structure.
前記反射波データに基づいて、前記造影バブルを反射源とする反射波の信号強度の分布を表す造影画像データを生成する画像生成部と、
所定期間にわたって生成された前記造影画像データに基づいて、前記被検体の血管構造を推定する推定部と、
前記血管構造のうち操作者により指定された範囲に含まれる前記造影バブルの濃度を算出する算出部と、
前記算出部により算出された結果を出力する出力制御部と
を備える、超音波診断装置。 A transmitting / receiving unit that performs ultrasonic scanning on a subject into which a contrast bubble has been injected, and collects reflected wave data from the subject;
An image generation unit configured to generate contrast image data representing a distribution of signal intensity of a reflected wave having the contrast bubble as a reflection source based on the reflected wave data;
An estimation unit configured to estimate the blood vessel structure of the subject based on the contrast image data generated over a predetermined period;
A calculation unit that calculates the concentration of the contrast bubble included in the range designated by the operator in the blood vessel structure;
And an output control unit that outputs the result calculated by the calculation unit.
請求項13に記載の超音波診断装置。 The calculation unit calculates the concentration by dividing an amount of a contrast bubble included in the range in the contrast image data of a predetermined frame by a volume of a blood vessel corresponding to the range.
The ultrasonic diagnostic apparatus according to claim 13.
前記算出部は、前記血管構造のうち操作者により指定された範囲における前記薬剤の組織への注入割合を算出する、
請求項13又は14に記載の超音波診断装置。 The contrast bubble is sealed with a drug.
The calculation unit calculates an injection ratio of the medicine into the tissue in a range designated by the operator in the blood vessel structure.
The ultrasonic diagnostic apparatus according to claim 13.
請求項15に記載の超音波診断装置。 The calculation unit may calculate a value obtained by subtracting the amount of the contrast bubble in the contrast image data of the frame after the collapse of the contrast bubble from the amount of the contrast bubble in the contrast image data of the frame before the collapse of the contrast bubble. The injection rate is calculated by dividing by the volume of the blood vessel corresponding to the range.
The ultrasonic diagnostic apparatus according to claim 15.
前記反射波データに基づいて、前記造影バブルを反射源とする反射波の信号強度の分布を表す造影画像データを生成する画像生成部と、
所定期間にわたって生成された前記造影画像データに基づいて、前記被検体の血管構造を推定する推定部と、
前記血管構造のうち操作者により指定された範囲における前記薬剤の組織への注入割合を算出する算出部と、
前記算出部により算出された結果を出力する出力制御部と
を備える、超音波診断装置。 A transmitting / receiving unit that performs ultrasonic scanning on a subject into which a contrast bubble containing a drug is injected into the subject and collects reflected wave data from the subject;
An image generation unit configured to generate contrast image data representing a distribution of signal intensity of a reflected wave having the contrast bubble as a reflection source based on the reflected wave data;
An estimation unit configured to estimate the blood vessel structure of the subject based on the contrast image data generated over a predetermined period;
A calculator configured to calculate an injection ratio of the medicine into the tissue in a range designated by the operator in the blood vessel structure;
And an output control unit that outputs the result calculated by the calculation unit.
Applications Claiming Priority (2)
| Application Number | Priority Date | Filing Date | Title |
|---|---|---|---|
| JP2017226080 | 2017-11-24 | ||
| JP2017226080 | 2017-11-24 |
Publications (1)
| Publication Number | Publication Date |
|---|---|
| JP2019093140A true JP2019093140A (en) | 2019-06-20 |
Family
ID=66972364
Family Applications (1)
| Application Number | Title | Priority Date | Filing Date |
|---|---|---|---|
| JP2018217375A Pending JP2019093140A (en) | 2017-11-24 | 2018-11-20 | Optical ultrasonic diagnostic apparatus, medical image processing apparatus, medical image processing program, and ultrasonic diagnostic apparatus |
Country Status (1)
| Country | Link |
|---|---|
| JP (1) | JP2019093140A (en) |
Cited By (3)
| Publication number | Priority date | Publication date | Assignee | Title |
|---|---|---|---|---|
| JP2020028662A (en) * | 2018-08-24 | 2020-02-27 | キヤノン株式会社 | Image processing device, image processing method, and program |
| WO2020040181A1 (en) * | 2018-08-24 | 2020-02-27 | キヤノン株式会社 | Image processing device, image processing method, and program |
| WO2022195699A1 (en) * | 2021-03-16 | 2022-09-22 | オリンパスメディカルシステムズ株式会社 | Image generating device, endoscope system, and image generating method |
-
2018
- 2018-11-20 JP JP2018217375A patent/JP2019093140A/en active Pending
Cited By (4)
| Publication number | Priority date | Publication date | Assignee | Title |
|---|---|---|---|---|
| JP2020028662A (en) * | 2018-08-24 | 2020-02-27 | キヤノン株式会社 | Image processing device, image processing method, and program |
| WO2020040181A1 (en) * | 2018-08-24 | 2020-02-27 | キヤノン株式会社 | Image processing device, image processing method, and program |
| JP7125709B2 (en) | 2018-08-24 | 2022-08-25 | キヤノン株式会社 | Image processing device, image processing method and program |
| WO2022195699A1 (en) * | 2021-03-16 | 2022-09-22 | オリンパスメディカルシステムズ株式会社 | Image generating device, endoscope system, and image generating method |
Similar Documents
| Publication | Publication Date | Title |
|---|---|---|
| WO2014077396A1 (en) | Ultrasound diagnostic device and image processing method | |
| JP5707148B2 (en) | Medical image diagnostic apparatus and medical image processing apparatus | |
| JP5868067B2 (en) | Medical image diagnostic apparatus, image processing apparatus and method | |
| JP6629031B2 (en) | Ultrasound diagnostic device and medical image diagnostic device | |
| JP5762076B2 (en) | Ultrasonic diagnostic apparatus, ultrasonic image processing apparatus, and medical image diagnostic apparatus | |
| US20160317129A1 (en) | System and method for ultrasound and computed tomography image registration for sonothrombolysis treatment | |
| EP2938246B1 (en) | Subject information obtaining apparatus, display method, and program | |
| JP5632203B2 (en) | Ultrasonic diagnostic apparatus, ultrasonic image processing apparatus, and ultrasonic image processing program | |
| US9610094B2 (en) | Method and apparatus for ultrasonic diagnosis | |
| JP5019205B2 (en) | Ultrasonic diagnostic equipment | |
| JP7461530B2 (en) | Ultrasound diagnostic device and puncture support program | |
| JP2008272459A (en) | Ultrasonic diagnosis apparatus, breast imaging system, and breast imaging program | |
| JP2000107185A (en) | Ultrasonograph | |
| JP5689591B2 (en) | Ultrasonic diagnostic apparatus and ultrasonic image processing program | |
| JP2017113312A (en) | Medical image diagnostic apparatus and medical image diagnostic program | |
| US20150173721A1 (en) | Ultrasound diagnostic apparatus, medical image processing apparatus and image processing method | |
| JP2019093140A (en) | Optical ultrasonic diagnostic apparatus, medical image processing apparatus, medical image processing program, and ultrasonic diagnostic apparatus | |
| US20100324420A1 (en) | Method and System for Imaging | |
| KR20160062874A (en) | Probe, ultrasonic imaging apparatus, and control method of the unltrasonic imaing apparatus | |
| JP2008100094A (en) | Ultrasonic diagnostic apparatus | |
| WO2014125853A1 (en) | Photoacoustic image generating device and method | |
| WO2021214101A1 (en) | Vascular system visualization | |
| US20190150894A1 (en) | Control device, control method, control system, and non-transitory storage medium | |
| JP6465648B2 (en) | SUBJECT INFORMATION ACQUISITION DEVICE AND DEVICE | |
| JP2010075503A (en) | Multi-modality surgery supporting apparatus |