JP2016197029A - Electrostatic discharge source detecting method, and electrostatic discharge source visualizing method - Google Patents
Electrostatic discharge source detecting method, and electrostatic discharge source visualizing method Download PDFInfo
- Publication number
- JP2016197029A JP2016197029A JP2015076173A JP2015076173A JP2016197029A JP 2016197029 A JP2016197029 A JP 2016197029A JP 2015076173 A JP2015076173 A JP 2015076173A JP 2015076173 A JP2015076173 A JP 2015076173A JP 2016197029 A JP2016197029 A JP 2016197029A
- Authority
- JP
- Japan
- Prior art keywords
- electrostatic discharge
- hyperbola
- sampling
- source
- generation source
- Prior art date
- Legal status (The legal status is an assumption and is not a legal conclusion. Google has not performed a legal analysis and makes no representation as to the accuracy of the status listed.)
- Granted
Links
- 238000000034 method Methods 0.000 title claims abstract description 47
- 238000005070 sampling Methods 0.000 claims abstract description 87
- 238000001514 detection method Methods 0.000 claims description 23
- 238000003384 imaging method Methods 0.000 claims description 13
- 238000007794 visualization technique Methods 0.000 claims description 11
- 238000009434 installation Methods 0.000 claims description 9
- 238000012360 testing method Methods 0.000 claims description 8
- 238000005259 measurement Methods 0.000 description 21
- 230000001960 triggered effect Effects 0.000 description 5
- 238000005096 rolling process Methods 0.000 description 4
- 238000012544 monitoring process Methods 0.000 description 2
- 238000012800 visualization Methods 0.000 description 2
- 230000005540 biological transmission Effects 0.000 description 1
- 238000006243 chemical reaction Methods 0.000 description 1
- 238000004891 communication Methods 0.000 description 1
- 238000010586 diagram Methods 0.000 description 1
- 230000005611 electricity Effects 0.000 description 1
- 230000006870 function Effects 0.000 description 1
- 238000007689 inspection Methods 0.000 description 1
- 230000008054 signal transmission Effects 0.000 description 1
- 230000003068 static effect Effects 0.000 description 1
- 230000002123 temporal effect Effects 0.000 description 1
Images


Abstract
Description
本発明は、被測定物において静電気放電が発生した場合に、静電気放電発生源の位置を双曲線法によって算出し、サンプリングによる誤差範囲を含めて静電気放電発生源を検知する静電気放電発生源検知方法と、その位置を表示して可視化する静電気放電発生源可視化方法に関する。 The present invention relates to an electrostatic discharge source detection method for detecting the electrostatic discharge source including an error range by sampling, by calculating the position of the electrostatic discharge source by the hyperbola method when electrostatic discharge occurs in the object to be measured, and Further, the present invention relates to a method for visualizing an electrostatic discharge generation source for displaying and visualizing the position.
従来の静電気放電発生箇所可視化方法及び可視化装置の一例として、被測定物において静電気放電が発生する状況をビデオ画像上で分かりやすく可視化する手段が、特許文献1に記載されている。
As an example of a conventional electrostatic discharge occurrence location visualization method and visualization device,
特許文献1に記載の方法は、「静電気放電に伴う電磁波を受信するための4本以上のアンテナと、被測定物の様子を動画像で撮影するためのビデオカメラと、ビデオカメラの撮影範囲を調べるための方位・仰角基準板を取り付けた支持体を被測定物の近傍に設置し、被測定物で発生した静電気放電に伴う電磁波が各アンテナへ到達する時間の差から、双曲線法によって、被測定物において静電気放電が発生した位置を算出し、被測定物のビデオ画像上に、静電気放電源の位置を示すマ−キング表示や、静電気放電が発生するまでの残り時間表示や、静電気放電源の位置を数値で示す表示等を重ね表示することで、被測定物において静電気放電が発生する様子をビデオ画像で可視化する。」とするものである。
The method described in
この方法によると、被測定物で発生した静電気放電に伴う電磁波が各受信アンテナへ到達する時間の差から、双曲線法によって、被測定物において静電気放電が発生した位置を算出することで、理論的には、被測定物における静電気放電の発生座標を、非常に正確に算出することが可能である。 According to this method, the position where the electrostatic discharge occurred in the measured object is calculated by the hyperbolic method from the difference in the time that the electromagnetic wave generated by the electrostatic discharge generated in the measured object reaches each receiving antenna. Therefore, it is possible to calculate the coordinates of occurrence of electrostatic discharge in the measurement object very accurately.
また、被測定物のビデオ画像上に、静電気放電発生源の位置を示すマ−キング表示や、静電気放電が発生するまでの残り時間表示や、静電気放電発生源の位置を数値で示す表示等を重ね表示することで、被測定物において静電気放電が発生する様子をビデオ画像で、分かりやすく確認することができる。 In addition, on the video image of the object to be measured, a marking display indicating the position of the electrostatic discharge source, a display of the remaining time until the electrostatic discharge occurs, and a display indicating the position of the electrostatic discharge source numerically, etc. By superimposing and displaying, it is possible to easily confirm in a video image how electrostatic discharge occurs in the object to be measured.
特許文献1に記載の方法は、静電気放電に伴い発生する電磁波を検出するために用いる計測装置において、各アンテナ間での電磁波到達時間差を理論どおり、正確に算出できることを前提としているが、実際に実用化されている計測機器では、サンプリング速度が有限であるため、各アンテナ間での電磁波到達時間差を算出する際に誤差が生じ、これに伴って双曲線法で算出した放電位置にも誤差が生じてしまう。
The method described in
しかし、特許文献1では、サンプリング速度の制限に伴い算出誤差が生じることや、算出誤差への対処方法などについては一切言及されていない。
However,
このように、静電気放電発生源を検知するにあたって、静電気放電発生源から発せられる電磁波の電圧波形を検知しているが、その際に、所定のサンプリング速度のもとで検知がなされるため、サンプリングによる誤差範囲が生じる。そのため、計測器のサンプリング性能に応じて、サンプリングによる誤差範囲を含めて静電気放電発生源を特定することができれば、実用上極めて有効である。 As described above, when detecting the electrostatic discharge source, the voltage waveform of the electromagnetic wave emitted from the electrostatic discharge source is detected. At this time, since the detection is performed at a predetermined sampling speed, sampling is performed. An error range due to. Therefore, it is practically very effective if an electrostatic discharge source can be specified including the error range due to sampling according to the sampling performance of the measuring instrument.
本発明は、このような事情を考慮してなされたもので、静電気放電発生源検知を行う際に用いる計測器のサンプリング性能に応じて、サンプリングによる誤差範囲を含んで正確な静電気放電発生源が存在する領域である静電気放電発生源推定領域を特定することが可能な静電気放電発生源検知方法および静電気放電発生源可視化方法を提供することを目的とする。 The present invention has been made in consideration of such circumstances, and according to the sampling performance of the measuring instrument used for detecting the electrostatic discharge generation source, an accurate electrostatic discharge generation source including an error range due to sampling can be obtained. It is an object of the present invention to provide an electrostatic discharge source detection method and an electrostatic discharge source visualization method capable of specifying an electrostatic discharge source estimation region that is an existing region.
以上の課題を解決するために、本発明の静電気放電発生源検知方法は、静電気放電に伴い発生する電磁波を、異なる場所に設置した複数の受信アンテナからなる受信アンテナ群で検出し、各受信アンテナに電磁波が到達する時間差と受信アンテナの設置位置の関係から、双曲線法によって,静電気放電発生源の3次元座標を算出する静電気放電発生源検知方法において、全ての静電気放電発生源特定用双曲線に対して、サンプリング時間間隔の値を加算して得られる第一の双曲線と、サンプリング時間間隔の値を減算して得られる第二の双曲線とを求め、第一の双曲線による交差と、第二の双曲線による交差と、第一の双曲線と第二の双曲線との組み合わせによる交差とによって形成される領域を,サンプリングによる誤差範囲を含んで正確な静電気放電発生源が存在する領域である静電気放電発生源推定領域として特定することを特徴とする。 In order to solve the above problems, the electrostatic discharge generation source detection method of the present invention detects an electromagnetic wave generated due to electrostatic discharge with a reception antenna group including a plurality of reception antennas installed at different locations, and each reception antenna. In the electrostatic discharge source detection method that calculates the three-dimensional coordinates of the electrostatic discharge source by the hyperbola method from the relationship between the time difference in which the electromagnetic wave reaches the antenna and the installation position of the receiving antenna, The first hyperbola obtained by adding the sampling time interval values and the second hyperbola obtained by subtracting the sampling time interval values are obtained, and the intersection of the first hyperbola and the second hyperbola are obtained. The area formed by the intersection of the first hyperbola and the intersection of the first hyperbola and the second hyperbola, including the error range by sampling, is accurate. And identifies as electrostatic discharge source estimation region is a region where the electrostatic discharge source exists.
双曲線法を用いて静電気放電発生源の位置を算出する際、サンプリング時間間隔によって生じる静電気放電発生源の算出誤差領域を算出することにより、計測器のサンプリング性能に応じて、真の静電気放電発生源が存在する領域を特定することが可能となる。
ここで、静電気放電発生源特定用双曲線とは、2次元空間や3次元空間における静電気放電発生源を特定するために用いた双曲線を示す。
When calculating the position of the electrostatic discharge source using the hyperbola method, the true electrostatic discharge source is calculated according to the sampling performance of the measuring instrument by calculating the calculation error area of the electrostatic discharge source caused by the sampling time interval. It is possible to specify the area where the exists.
Here, the electrostatic discharge generation source specifying hyperbola is a hyperbola used for specifying an electrostatic discharge generation source in a two-dimensional space or a three-dimensional space.
本発明の静電気放電発生源可視化方法は、本発明の静電気放電発生源検知方法によって得られる静電気放電発生源推定領域を可視化する静電気放電発生源可視化方法であって、前記受信アンテナ群で構成される3次元空間に校正された映像撮影機器を用いて、被試験体の様子を撮影し、記録し続け、前記受信アンテナ群が静電気放電に伴い発生する電磁波を検出すると、前記受信アンテナ群で構成される3次元空間を示す平面図や、前記映像撮影機器が撮影していた画像に対して、前記静電気放電発生源推定領域をマーキング表示して、静電気放電発生源推定領域を表示することを特徴とする。 The electrostatic discharge generation source visualization method of the present invention is an electrostatic discharge generation source visualization method for visualizing an electrostatic discharge generation source estimation region obtained by the electrostatic discharge generation source detection method of the present invention, and is configured by the receiving antenna group. Using a video imaging device calibrated in a three-dimensional space, the state of the test object is continuously photographed and recorded, and when the receiving antenna group detects an electromagnetic wave generated due to electrostatic discharge, the receiving antenna group is configured. The electrostatic discharge generation source estimation area is marked and displayed on a plan view showing a three-dimensional space or an image captured by the video imaging device, and the electrostatic discharge generation source estimation area is displayed. To do.
受信アンテナ群で構成される3次元空間において、誤差領域を特定する交点の位置を、XY平面図、XZ平面図、YZ平面図として表示することにより、真の放電発生源が存在する領域を可視化することが可能となる。
また、被試験体のどの領域で放電が発生したかを、放電発生直後に画像上で確認することができる。
ここで、受信アンテナ群で構成される3次元空間に校正された映像撮影機器とは、撮影される画角や、撮影された画像における個々の画素が対応する角度、受信アンテナ群で構成される3次元空間における、ビデオカメラの撮影基準点の設置座標や撮影角度を予め明確にした映像撮影機器のことを意味する。
Visualize the region where the true discharge source exists by displaying the position of the intersection that specifies the error region as an XY, XZ, and YZ plan view in a three-dimensional space composed of receiving antenna groups It becomes possible to do.
Further, in which region of the device under test the discharge has occurred can be confirmed on the image immediately after the discharge has occurred.
Here, the video photographing device calibrated in the three-dimensional space composed of the receiving antenna group includes the angle of view to be photographed, the angle corresponding to each pixel in the photographed image, and the receiving antenna group. It means a video photographing device in which the installation coordinates and photographing angle of the photographing reference point of the video camera in a three-dimensional space are clarified in advance.
本発明の静電気放電発生源可視化方法においては、前記映像撮影機器で撮影した画像を任意の時間分、無限ループ記録し続け、前記受信アンテナ群が静電気放電を検出すると、検出した瞬間に撮影していた静止画像に静電気放電発生時基準番号を付与して、無限ループ記録した画像を静電気放電発生前後画像群として保存し、保存した個々の静止画像に静電気放電発生源推定領域を示すマーキング表示を加えた後、静止画像を時系列に表示して、被試験体で静電気放電が発生する前後の被測定物の状況を表示し確認する構成とすることができる。 In the electrostatic discharge generation source visualization method of the present invention, an image captured by the video imaging device is continuously recorded in an infinite loop for an arbitrary time, and when the receiving antenna group detects electrostatic discharge, the image is captured at the moment of detection. Assign a reference number when an electrostatic discharge occurs to a still image, save the image recorded in an infinite loop as a group of images before and after the occurrence of electrostatic discharge, and add markings indicating the estimated area of the electrostatic discharge generation to each stored still image After that, still images can be displayed in time series, and the state of the object to be measured before and after the occurrence of electrostatic discharge can be displayed and confirmed.
これにより、被試験体において静電気放電が生じる領域と、静電気放電が発生する瞬間が分かるため、被試験体で静電気放電が生じる状況を容易に確認することが可能となる。 As a result, the region where electrostatic discharge occurs in the device under test and the moment when the electrostatic discharge occurs can be known, so that it is possible to easily confirm the situation where electrostatic discharge occurs in the device under test.
本発明によると、静電気放電発生源検知を行う際に用いる計測器のサンプリング性能に応じて、サンプリングによる誤差範囲を含んで正確な静電気放電発生源が存在する領域である静電気放電発生源推定領域を特定することができる。 According to the present invention, according to the sampling performance of the measuring instrument used when detecting the electrostatic discharge source, the electrostatic discharge source estimation region, which is the region where the accurate electrostatic discharge source exists including the error range due to sampling, is determined. Can be identified.
以下に、本発明の静電気放電発生源検知方法および静電気放電発生源可視化方法を、その実施形態に基づいて説明する。
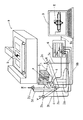
図1に、本発明の第一実施形態に係る静電気放電発生源検知方法および静電気放電発生源可視化方法を実現する装置の構成を示す。
The electrostatic discharge generation source detection method and electrostatic discharge generation source visualization method of the present invention will be described below based on the embodiments.
FIG. 1 shows a configuration of an apparatus for realizing an electrostatic discharge generation source detection method and an electrostatic discharge generation source visualization method according to the first embodiment of the present invention.
図1に示すように、静電気放電発生源bを特定したい被測定物aの近くの任意の場所に、受信アンテナ2a、2b、2c、2dが配置されており、ビデオカメラ4、方位・仰角基準板5を取り付けた支持体1が設置されている。
As shown in FIG. 1, receiving
受信アンテナ2a、2b、2c、2dは、それぞれ同軸ケ−ブル3a、3b、3c、3dを介して、デジタルオシロスコ−プ6の入力端子であるch1、ch2、ch3、ch4にそれぞれ接続されている。デジタルオシロスコ−プ6は、制御用コンピュ−タ9とデジタルインターフェースケーブル9aによって接続されており、制御用コンピュ−タ9は、デジタルオシロスコ−プ6を制御する。
The
ビデオカメラ4は、デジタルインターフェースケーブル9bによって制御用コンピュ−タ9と接続され、制御用コンピュ−タ9によって制御される。
The
支持体1において、受信アンテナ2aを取り付けた位置を可視化装置の測定基準点cとし、受信アンテナ2aに対して、それぞれ方角が90度異なる任意の場所に受信アンテナ2b、2c、2dを取り付ける。図1の場合、測定基準点cに対して、受信アンテナ2bを通過する軸線をY軸、受信アンテナ2cを通過する軸線をX軸、受信アンテナ2dを通過する軸線をZ軸とする。なお、XYZの各軸をどの受信アンテナの向きにするかは特に限定されない。
In the
すなわち、図1に示す場合には、受信アンテナ2aが基準点受信アンテナであり、この基準点受信アンテナと、基準点受信アンテナ以外の3つまたはそれ以上の受信アンテナによって受信アンテナ群が形成されている。基準点受信アンテナと他の2つの受信アンテナとで一つの平面を形成し、その他の受信アンテナは、この平面上はない位置に配置されている。
That is, in the case shown in FIG. 1, the
図1において、受信アンテナ2a、2b、2c、2dによって受信された信号は、高周波伝達経路である同軸ケ−ブル3a、3b、3c、3dを介して、4チャンネル入力のデジタルオシロスコ−プ6の入力チャンネルch1、ch2、ch3、ch4に、それぞれ入力される。
In FIG. 1, signals received by receiving
個々の受信アンテナ2a、2b、2c、2dからデジタルオシロスコ−プ6までの電気信号到達時間差を予め調べておき、電磁波到達時間差を算出する際には、電気信号伝達時間差が0になるよう補正する。
The electric signal arrival time difference from each receiving
デジタルオシロスコ−プ6は、制御用コンピュ−タ9とデジタルインターフェースケーブル9aで接続され、制御用コンピュ−タ9でデジタルオシロスコ−プ6の初期化と測定条件の設定を行う。なお、制御用コンピュ−タ9とデジタルオシロスコ−プ6とを接続する際の通信インタフェ−ス方式は、GP−IB、RS−232C、LAN、USB等、デジタルオシロスコ−プ6の制御やデ−タの受け渡しができるものであれば方式を問わない。制御用コンピュ−タ9の画面には、静電気放電発生源推定領域Rが表示される。この表示に至るプロセスは、後に詳述する。
The
図2に、3次元空間における方位と仰角を示す。
図2に示すように、3次元空間において、測定基準点cの存在するXY平面での測定基準点cからの向きを方位とし、測定基準点cの存在するXY平面に対する垂直方向の傾きの度合いを仰角とする。本実施形態の場合、+Y軸の向きを方位0度とし、+X軸側(右側)に右回転するに従って方位が増加することとし、仰角については、測定基準点cの存在するXY平面に向いている時を仰角0度とし、+Z軸の向きの時の仰角を+90度、−Z軸の向きの時の仰角を−90度とする。
FIG. 2 shows the azimuth and elevation angle in a three-dimensional space.
As shown in FIG. 2, in a three-dimensional space, the direction from the measurement reference point c on the XY plane where the measurement reference point c exists is an orientation, and the degree of inclination in the vertical direction with respect to the XY plane where the measurement reference point c exists Is the elevation angle. In the case of the present embodiment, the direction of the + Y axis is set to 0 degree, and the direction increases as it rotates clockwise to the + X axis side (right side), and the elevation angle is directed to the XY plane where the measurement reference point c exists. The elevation angle is 0 degree, the elevation angle is +90 degrees in the direction of the + Z axis, and the elevation angle is -90 degrees in the direction of the -Z axis.
静電気放電に伴い発生する電磁波を、受信アンテナ2a、2b、2c、2dのいずれかで受信すると、デジタルオシロスコ−プ6のトリガが掛かる状態にして、静電気放電の発生を監視する。デジタルオシロスコ−プ6のトリガ機能には、ある一定電位を超える入力があった場合にトリガの掛かるエッジトリガや、入力信号のパルス幅がある一定時間内であるときにトリガが掛かるパルス幅トリガや、それらを複数の入力チャンネルで組み合わせたパタ−ントリガなどがあり、どのようなトリガ条件にするかは、測定現場の状況に応じて調整して選択する。
When electromagnetic waves generated by electrostatic discharge are received by any of the receiving
静電気放電に伴い発生する電磁波を受信して、デジタルオシロスコ−プ6のトリガが掛かると、受信アンテナ2a、2b、2c、2dで受信した、静電気放電に伴い発生する電磁波の電圧的変化が、デジタルオシロスコ−プ6のチャンネルch1、ch2、ch3、ch4のデジタルデ−タとして記録される。
When the
デジタルオシロスコ−プ6において記録されるデジタルデ−タとは、デジタルオシロスコ−プ6において、その各チャンネルに入力された電圧の時間的変化を離散的に高速AD(アナログ値からデジタル値へ)変換して得られた電圧値を、設定したポイントの数だけ時系列に記録したデ−タ群のことである。
The digital data recorded in the
デジタルオシロスコ−プ6のトリガが掛かかると、そのことを制御用コンピュ−タ9で検知し、静電気放電の発生時刻として記録する。そして、デジタルオシロスコ−プ6で記録された4チャンネル分のデジタルデ−タを制御用コンピュ−タ9で読み込み、各チャンネルにおける電磁波到達基準点を見つけだす。
When the trigger of the
図3に、静電気放電に伴い発生する電磁波を、受信アンテナ2a、2b、2c、2dを接続したデジタルオシロスコープ6で検出した電圧波形のイメージと電磁波到達基準点を示す。
電磁波到達基準点とは、静電気放電に伴い発生する電磁波が各受信アンテナ2a、2b、2c、2dに到達した時刻を比較するための基準点のことである。デジタルオシロスコ−プ6に記録された静電気放電に伴う電磁波の波形デ−タの中で、静電気放電に伴い発生する電磁波によって発生した最初の電圧パルスのピ−クを示す測定ポイントを、電磁波到達基準点P(2a)、P(2b)、P(2c)、P(2d)とする。
FIG. 3 shows an image of a voltage waveform and an electromagnetic wave arrival reference point in which an electromagnetic wave generated due to electrostatic discharge is detected by a
The electromagnetic wave arrival reference point is a reference point for comparing the time when the electromagnetic wave generated due to electrostatic discharge reaches each receiving
測定ポイントとは、デジタルオシロスコ−プ6において時系列に記録されたデジタルデ−タの中の何番目のデ−タであるかを示すものである。
The measurement point indicates the number of the digital data recorded in time series in the
その電圧パルスのピ−ク部分がデジタルオシロスコ−プ6の表示範囲を超えている場合には、超えている区間の中間の測定ポイントを電磁波到達基準点とする。図3におけるP(2c)がその例である。
When the peak portion of the voltage pulse exceeds the display range of the
そして、ある任意の2つの受信アンテナ間において、電磁波到達基準点を示す測定ポイントの差分に、計測時のデジタルオシロスコ−プ6のサンプリングレ−トの逆数を掛けると、その2つの受信アンテナ間での、静電気放電に伴い発生する電磁波の到達時間差t(ba)、t(ca)、t(da)が算出される。
When the difference between the measurement points indicating the electromagnetic wave arrival reference point is multiplied by a reciprocal of the sampling rate of the
サンプリングレ−トとは、デジタルオシロスコ−プ6において電圧等の時間的変化を離散的に測定する際の、1秒間に測定する回数のことである。
The sampling rate is the number of times of measurement per second when discrete changes in voltage or the like are measured in the
サンプリング時間間隔とは、サンプリングレ−トの逆数のことで、デジタルオシロスコ−プ6において電圧等の時間的変化を離散的に測定する際の時間間隔を意味する。
The sampling time interval is the reciprocal of the sampling rate, and means the time interval when the
双曲線法とは、静電気放電に伴い発生する電磁波を、設置場所の異なる3台以上の受信アンテナで受信し、各受信アンテナに電磁波が到達する時間差と受信アンテナの設置位置の関係から、組み合わせの異なる任意の2本の受信アンテナ間における双曲線をそれぞれ算出し、それらの双曲線の交点を求めることで、静電気放電の発生源の位置を特定する手法である。 The hyperbolic method is a method of receiving electromagnetic waves generated by electrostatic discharge with three or more receiving antennas at different installation locations, and different combinations due to the relationship between the time difference at which the electromagnetic waves arrive at each receiving antenna and the installation position of the receiving antennas. This is a technique of calculating the hyperbola between any two receiving antennas and determining the position of the electrostatic discharge source by obtaining the intersection of the hyperbola.
2次元空間における放電源の座標を双曲線法で算出する場合、3台以上の受信アンテナを使用し、3次元空間における放電源の座標を双曲線法で算出する場合、3台の受信アンテナに加えて、それらのアンテナ群で構成される平面とは異なる位置に最低限、1台の受信アンテナを設置する必要がある。 When calculating the coordinates of the discharge source in the two-dimensional space using the hyperbolic method, when using three or more receiving antennas, and calculating the coordinates of the discharge source in the three-dimensional space using the hyperbolic method, in addition to the three receiving antennas It is necessary to install at least one receiving antenna at a position different from the plane formed by these antenna groups.
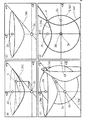
図4に基づいて、双曲線法による静電気放電発生源を特定する方法を説明する。
図4(a)に示すように、静電気放電発生源bと、受信アンテナ2a、2b、2cとが全て同じ2次元空間に存在する場合、静電気放電発生源bで発生した静電気放電に伴う電磁波を、受信アンテナ2a、2b、2cが受信すると、図4(b)に示すように、静電気放電発生源bと受信アンテナ2a、2bの設置場所との距離の差に応じて、受信アンテナ2aと受信アンテナ2bとの到達時間差t(ba)が生じる。同様に、静電気放電発生源bと受信アンテナ2a、2cの設置場所との距離の差に応じて、受信アンテナ2aと受信アンテナ2cとの到達時間差t(ca)が生じる。
Based on FIG. 4, a method for specifying an electrostatic discharge generation source by the hyperbola method will be described.
As shown in FIG. 4A, when the electrostatic discharge generation source b and the receiving
受信アンテナ2a、2bに対して到達時間差がt(ba)となる点を結んだ線が、アンテナ2a、2bに対する双曲線L(ba)となるが、一つの双曲線だけでは、双曲線L(ba)上のどの点が放電の発生源であるかは特定できない。そこで、もう一つの受信アンテナ2cを用意し、アンテナ2a、2b、2cで、電磁波を受信することによって、双曲線L(ba)と双曲線L(ca)を求め、2つの双曲線の交点を、静電気放電発生源bの位置として特定することができる。
A line connecting points at which the arrival time difference is t (ba) with respect to the receiving
図4(c)は、サンプリング速度が遅くなることによって、受信波形を正確に検出できない状況を説明しており、図中に白丸で示すものがサンプリングポイントである。各受信アンテナによって受信される電圧波形は、サンプリングによって離散的に検知されるため、真の時間差toと、サンプリングによって得られる実際に検知される時間差tとは異なっている。 FIG. 4C illustrates a situation in which the received waveform cannot be accurately detected due to the slow sampling rate. Sampling points are indicated by white circles in the figure. Since the voltage waveform received by each receiving antenna is discretely detected by sampling, the true time difference to is different from the actually detected time difference t obtained by sampling.
上述した静電気放電発生源bの位置の特定を、3次元空間に適用したものを、図5に示す。図5(a)に示すように、静電気放電発生源bが3次元空間に存在する場合、Z軸上に更に受信アンテナ2dを追加して、受信アンテナ2aと2dで得られる双曲線L(da)を求める。双曲線L(da)を、図5(b)に示すように、Z軸線を軸として360度回転させた曲面を算出する。同様に、図5(c)に示すように、受信アンテナ2aと受信アンテナ2bによる双曲線L(ba)を、Y軸線を軸として360度回転させた曲面を算出し、受信アンテナ2aと受信アンテナ2cによる双曲線L(ca)を、X軸線を軸として360度回転させた曲面を算出する。
なお、双曲線L(ba)、双曲線L(ca)、双曲線L(da)のそれぞれを回転して得られる曲面は、それぞれの双曲線による双曲線群で形成されるものであるため、ここでは、このような双曲線群も包括的に双曲線と称する。
FIG. 5 shows an example in which the above-described specification of the position of the electrostatic discharge generation source b is applied to a three-dimensional space. As shown in FIG. 5A, when the electrostatic discharge source b exists in a three-dimensional space, a receiving
In addition, since the curved surface obtained by rotating each of the hyperbola L (ba), the hyperbola L (ca), and the hyperbola L (da) is formed by the hyperbola group of each hyperbola, here, Such hyperbola groups are also collectively referred to as hyperbola.
図5(d)は、上記の方法で得られた双曲線の交差についてのXY断面を示しており、これらの3つの曲面が一つに交わる点を求めることによって、受信アンテナ2a、2b、2c、2dの配置を基準とした3次元空間における静電気放電発生源bの座標を算出することができる。
FIG. 5 (d) shows an XY cross-section for the intersection of the hyperbola obtained by the above method, and by obtaining the points where these three curved surfaces intersect each other, the receiving
支持体1に取り付ける受信アンテナの数を4本より、さらに増やし、既存の受信アンテ
ナ2a、2b、2c、2dとは異なる場所に取り付け、算出する双曲線の数を増やすこと
で、測定誤差が軽減され、静電気放電発生源の算出精度を向上させることもできる。
The number of receiving antennas attached to the
図6は、サンプリングによる到達時間差の誤差を示す。
双曲線法に用いる、2つの受信アンテナ間での電磁波の到達時間差を求める場合、比較する2つの受信アンテナの受信波形データの最初の電圧パルスのピークの検出時間差を正確に算出する必要がある。しかし、実際には、電磁波を検出するために用いる計測器のサンプリングレートにより、真のパルスピークを検出できない場合が多い。この場合、パルスピークの直前か直後のサンプリングポイントのうち、どちらか、よりピーク値に近い値のサンプリングポイントがサンプリング上のピークポイントとなる。
FIG. 6 shows the arrival time difference error due to sampling.
When calculating the arrival time difference of electromagnetic waves between two receiving antennas used in the hyperbolic method, it is necessary to accurately calculate the detection time difference of the peak of the first voltage pulse of the received waveform data of the two receiving antennas to be compared. However, in practice, the true pulse peak cannot often be detected due to the sampling rate of the measuring instrument used to detect electromagnetic waves. In this case, either the sampling point immediately before or after the pulse peak, the sampling point having a value closer to the peak value is the peak point on sampling.
図6における丸印はサンプリングポイントを示しており、黒丸は電圧パルスのピ−ク値として検知されるピークポイントである。従って、2つの黒丸による時間間隔が、検知される到達時間差となる。この場合、真のパルスピークとサンプリング上のパルスピークとの時間差は、サンプリング時間間隔の半分の値以内となる。 A circle in FIG. 6 indicates a sampling point, and a black circle is a peak point detected as a peak value of a voltage pulse. Therefore, the time interval between the two black circles is the detected arrival time difference. In this case, the time difference between the true pulse peak and the pulse peak on sampling is within half the value of the sampling time interval.
図6(a)は、2つのチャンネルにおける真の受信波形パルスピークの位置が、いずれもサンプリング上のピークポイントの外側である場合を示している。この場合には、サンプリングにより検知される電磁波到達時間差は、真の電磁波到達時間差よりも短く測定される。そのため、真の電磁波到達時間差は、サンプリング上の電磁波到達時間差より、最長、サンプリング時間間隔の時間分、長い値となる。 FIG. 6A shows a case where the positions of the true received waveform pulse peaks in the two channels are both outside the peak point on sampling. In this case, the electromagnetic wave arrival time difference detected by sampling is measured to be shorter than the true electromagnetic wave arrival time difference. For this reason, the true electromagnetic wave arrival time difference is longer than the sampling electromagnetic wave arrival time difference by the longest sampling time interval.
従ってこの場合には、サンプリングにより検知される到達時間差tに対して、その前後に、サンプリング時間間隔の半分の時間を加算した時間間隔tmax内に、真のピ−ク値が存在していることになる。従って、サンプリングにより検知される到達時間差に、サンプリング時間間隔の値を加算すると、その時間間隔内に必ず真のピークが存在する。 Therefore, in this case, a true peak value exists within the time interval tmax obtained by adding half the sampling time interval before and after the arrival time difference t detected by sampling. become. Therefore, when the value of the sampling time interval is added to the arrival time difference detected by sampling, a true peak always exists within the time interval.
逆に、図6(b)は、2つのチャンネルにおける真の受信波形パルスピークの位置が、いずれもサンプリング上のピークポイントの内側である場合を示している。この場合には、サンプリングにより検知される電磁波到達時間差は、真の電磁波到達時間差よりも長く測定される。そのため、真の電磁波到達時間差は、サンプリング上の電磁波到達時間差より、最短で、サンプリング時間間隔の時間分、短い値となる。 Conversely, FIG. 6B shows a case where the positions of the true received waveform pulse peaks in the two channels are both inside the peak point on sampling. In this case, the electromagnetic wave arrival time difference detected by sampling is measured longer than the true electromagnetic wave arrival time difference. Therefore, the true electromagnetic wave arrival time difference is the shortest and shorter than the sampling electromagnetic wave arrival time difference by the sampling time interval.
従ってこの場合には、サンプリングにより検知される到達時間差tに対して、その前後に、サンプリング間隔の半分の時間を減算した時間間隔tmin内に、真のピ−ク値が存在していることになる。従って、サンプリングにより検知される到達時間差に、サンプリング時間間隔の値を減算すると、その時間間隔内に必ず真のピークが存在する。 Therefore, in this case, the true peak value exists within the time interval tmin obtained by subtracting the half of the sampling interval before and after the arrival time difference t detected by sampling. Become. Therefore, when the value of the sampling time interval is subtracted from the arrival time difference detected by sampling, a true peak always exists within the time interval.
以上のことから、真の到達時間差は、有限のサンプリング速度を有する計測器を用いて得られる、「サンプリング上の電磁波到達時間差−サンプリング時間間隔」から、「サンプリング上の電磁波到達時間差+サンプリング時間間隔」の間に必ず存在する。本発明は、このことに基づいて、双曲線法により、到達時間差に対応する双曲線を用いて、静電気放電発生源を正確に検知するものであり、以下に、その方法について説明する。 From the above, the true arrival time difference can be obtained by using a measuring instrument having a finite sampling speed. From “the electromagnetic wave arrival time difference on sampling−sampling time interval”, “the electromagnetic wave arrival time difference on sampling + sampling time interval” ”Is always present. Based on this, the present invention accurately detects the electrostatic discharge generation source using the hyperbola corresponding to the arrival time difference by the hyperbola method, and the method will be described below.
図7に基づいて、サンプリングによる誤差範囲を含んで、正確な静電気放電発生源が存在する領域である静電気放電発生源推定領域を特定する方法を説明する。
図7(a)は、真の静電気放電発生源boを示しており、真の静電気放電発生源boは、双曲線Lo(ba)と双曲線Lo(ca)の交点として、理論上求められるものである。
Based on FIG. 7, a method for specifying an electrostatic discharge generation source estimation area, which is an area where an accurate electrostatic discharge generation source exists, including an error range due to sampling will be described.
FIG. 7A shows a true electrostatic discharge source bo, and the true electrostatic discharge source bo is theoretically obtained as the intersection of the hyperbola Lo (ba) and the hyperbola Lo (ca). .
図7(b)は、所定のサンプリング速度のもとで実際に検知される静電気放電発生源bと、静電気放電発生源特定用双曲線L(ba)、L(ca)を示しており、静電気放電発生源bは、双曲線L(ba)と双曲線L(ca)の交点として求められる。 FIG. 7B shows an electrostatic discharge generation source b actually detected at a predetermined sampling rate, and hyperbolic curves L (ba) and L (ca) for specifying the electrostatic discharge generation source. The generation source b is obtained as an intersection of the hyperbola L (ba) and the hyperbola L (ca).
図7(c)は、静電気放電発生源特定用双曲線L(ba)、L(ca)に対して、サンプリング時間間隔の値を加算して得られる第一の双曲線と、静電気放電発生源特定用双曲線L(ba)、L(ca)に対して、サンプリング時間間隔の値を減算して得られる第二の双曲線を示している。
受信アンテナ2aと受信アンテナ2bとの時間差によって得られる第一の双曲線L(ba+1)と第二の双曲線L(ba-1)、受信アンテナ2aと受信アンテナ2cとの時間差によって得られる第一の双曲線L(ca+1)と第二の双曲線L(ca-1)を求める。
FIG. 7 (c) shows a first hyperbola obtained by adding the sampling time interval to the electrostatic discharge generation source specifying hyperbola L (ba) and L (ca), and the electrostatic discharge generation source specifying A second hyperbola obtained by subtracting the value of the sampling time interval from the hyperbola L (ba) and L (ca) is shown.
The first hyperbola L (ba + 1) and the second hyperbola L (ba-1) obtained by the time difference between the
図7(d)は、上述した4つの双曲線が交差することによって得られる4つの交点Qを示しており、第一の双曲線による交点が1つ、第二の双曲線による交点が1つ、第一の双曲線と第二の双曲線との交点が2つ形成される。これにより、第一の双曲線による交差と、第二の双曲線による交差と、第一の双曲線と第二の双曲線との組み合わせによる交差とによって形成される領域Rが、平面上に得られる。この領域R内には必ず真の静電気放電発生源boが含まれており、この領域Rを、サンプリングによる誤差範囲を含んで正確な静電気放電発生源が存在する領域である静電気放電発生源推定領域として特定する。 FIG. 7 (d) shows four intersections Q obtained by the intersection of the four hyperbola described above, one intersection by the first hyperbola, one intersection by the second hyperbola, Two intersections of the hyperbola and the second hyperbola are formed. Thereby, the area | region R formed by the crossing by a 1st hyperbola, the crossing by a 2nd hyperbola, and the crossing by the combination of a 1st hyperbola and a 2nd hyperbola is obtained on a plane. This region R always includes a true electrostatic discharge generation source bo, and this region R is an area where an accurate electrostatic discharge generation source exists including an error range due to sampling. As specified.
上記の説明に対して、受信アンテナ2dを加えて3次元での検知を行うと、第一の双曲線による交点が1つ、第二の双曲線による交点が1つ、第一の双曲線と第二の双曲線との組み合わせによる交点が6つ形成される。これにより、第一の双曲線による交差と、第二の双曲線による交差と、第一の双曲線と第二の双曲線との組み合わせによる交差とによって形成される領域Rが、3次元空間内に得られる。この領域R内には必ず真の静電気放電発生源boが含まれており、この領域Rを、サンプリングによる誤差範囲を含んで正確な静電気放電発生源が存在する領域である静電気放電発生源推定領域として特定する。
When the three-dimensional detection is performed by adding the receiving
以下に、3次元空間を対象とした、具体的な一例を示す。
受信アンテナを4本使用する。受信アンテナの設置座標は、アンテナ1が(X:0cm、Y:0cm、Z:0cm)、アンテナ2が(X:0cm、Y:100cm、Z:0cm)、アンテナ3が(X:100cm、Y:0cm、Z:0cm)、アンテナ4が(X:0cm、Y:0cm、Z:100cm)とする。
A specific example for a three-dimensional space is shown below.
Use four receiving antennas. The installation coordinates of the receiving antenna are as follows: antenna 1 (X: 0 cm, Y: 0 cm, Z: 0 cm), antenna 2 (X: 0 cm, Y: 100 cm, Z: 0 cm), antenna 3 (X: 100 cm, Y : 0 cm, Z: 0 cm), and the
サンプリング上の電磁波到達時間差は、アンテナ1とアンテナ2との電磁波到達時間差が2ns(アンテナ1よりアンテナ2に電磁波が到達する時刻が2ns早い)、アンテナ1とアンテナ3との電磁波到達時間差が2ns(アンテナ1よりアンテナ3に電磁波が到達する時刻が2ns早い)、アンテナ1とアンテナ4との電磁波到達時間差が-0.5ns(アンテナ1よりアンテナ4に電磁波が到達する時刻が0.5ns遅い)とする。
The difference in arrival time of electromagnetic waves on sampling is that the difference in arrival time of electromagnetic waves between
使用する計測器のサンプリングレートが10GS/s(サンプリング時間間隔が0.1ns)である場合、真の放電発生源が存在すると推定される領域を特定するには、上述した各受信アンテナ間のサンプリング上の電磁波到達時間差に対して、サンプリング時間間隔の値を加算または減算して得られる、8通りの電磁波到達時間差の組み合わせから双曲線法で3次元座標が算出される。その算出結果を、表1に示す。
なお、GS/s(ギガサンプリング/セック)とは、計測機器のサンプリング速度を示すもので、1GS/sとは、1秒間に10の9乗回サンプリングを行うことを意味する。ns(ナノセック)とは時間の単位で、1nsとは、0.000000001秒のことを意味する。
When the sampling rate of the measuring instrument to be used is 10 GS / s (sampling time interval is 0.1 ns), in order to specify the region where the true discharge source is estimated to exist, the sampling between the receiving antennas described above is performed. Three-dimensional coordinates are calculated by the hyperbola method from the combination of the eight electromagnetic wave arrival time differences obtained by adding or subtracting the value of the sampling time interval to the upper electromagnetic wave arrival time difference. The calculation results are shown in Table 1.
Note that GS / s (giga sampling / sec) indicates the sampling speed of the measuring device, and 1 GS / s means that 10 9 times of sampling is performed per second. ns (nanosec) is a unit of time, and 1 ns means 0.000000001 seconds.

上記の手法により、3次元空間において、サンプリングによる誤差範囲を含んで正確な静電気放電発生源が存在する領域である静電気放電発生源推定領域として特定することができる。 According to the above method, in the three-dimensional space, it can be specified as an electrostatic discharge generation source estimation area that is an area where an accurate electrostatic discharge generation source exists including an error range due to sampling.
図8に、誤差範囲の算出例と表示例を示す。
図8は、上記の4つの受信アンテナによって受信された到達時間差をもとに、サンプリングによる誤差を考慮して得られた双曲線の交点と、これらの双曲線の交差によって形成される領域である、静電気放電発生源推定領域を表示している。
FIG. 8 shows a calculation example and display example of the error range.
FIG. 8 shows an intersection formed by a hyperbola intersection obtained by taking into account sampling errors based on the arrival time differences received by the four receiving antennas, and an area formed by the intersection of these hyperbola. The discharge source estimation area is displayed.
図8(a)は、その上面図(XY面)であり、図8(b)は、その側面図(XZ面)である。図中のA点、B点、C点、D点、E点、F点、G点、H点が、第一の双曲線による交差と、第二の双曲線による交差と、第一の双曲線と第二の双曲線との組み合わせによる交差とによって得られる交点である。また、図8(c)に示すように、受信アンテナ群で構成される3次元空間に校正されたビデオカメラで撮影した画像へのマーキングを行うと、6つの交点によって形成される画像領域内に、2つの交点が含まれた画像として表示され認識される。
なお、ここでは、ビデオカメラの撮影基準点はX:0cm、Y:0cm、Z:0cm
にあり、カメラの撮影角度は、ピッチング角度(=方位):+45度,ローリング角度(=仰角):0度,ヨーイング角度:0度(XY水平面に平行)という条件で撮影しているとする。
FIG. 8A is a top view (XY plane), and FIG. 8B is a side view (XZ plane). Point A, point B, point C, point D, point E, point F, point G, point H in the figure are intersected by the first hyperbola, intersected by the second hyperbola, It is an intersection obtained by intersection with a combination of two hyperbolas. Further, as shown in FIG. 8C, when marking an image taken with a video camera calibrated in a three-dimensional space composed of reception antenna groups, an image area formed by six intersections is included. The image is displayed and recognized as an image including two intersections.
Here, the photographing reference point of the video camera is X: 0 cm, Y: 0 cm, Z: 0 cm
The shooting angle of the camera is assumed to be shooting under the conditions of pitching angle (= direction): +45 degrees, rolling angle (= elevation angle): 0 degrees, and yawing angle: 0 degrees (parallel to the XY horizontal plane).
図9は、図8に示すものと同一条件で、サンプリングレートが20GS/s、10GS/s、5GS/sの場合の静電気放電発生源推定領域を、画像へマーキングしたものである。図9からわかるように、サンプリングレートが遅い程、静電気放電発生源推定領域が広くなっている。このように、静電気放電発生源検知を行う際に用いる計測器のサンプリング性能に応じて、サンプリングによる誤差範囲を含んで正確な静電気放電発生源が存在する領域である静電気放電発生源推定領域を特定できる点に、本発明の大きな特徴がある。 FIG. 9 is a diagram in which an electrostatic discharge generation source estimation region when the sampling rate is 20 GS / s, 10 GS / s, and 5 GS / s under the same conditions as those shown in FIG. 8 is marked on the image. As can be seen from FIG. 9, the slower the sampling rate, the wider the electrostatic discharge source estimation area. In this way, according to the sampling performance of the measuring instrument used when detecting the electrostatic discharge source, specify the electrostatic discharge source estimation area, which is the area where the accurate electrostatic discharge source exists, including the sampling error range. This is a major feature of the present invention.
静電気放電発生源推定領域の形状は、受信アンテナの配置や放電源の位置によって変化する。図10は、前記のものと同一条件で,サンプリングレートが10GS/sで,サンプリング上の電磁波到達時間差が、アンテナ1とアンテナ2との差が0.6ns、アンテナ1とアンテナ3との差が2.6ns、アンテナ1とアンテナ4との差が-1.5nsである場合の画像へのマーキング例である。この場合には、サンプリング上の放電発生源が、方位:+19.8°、仰角:-15,0°となっている、
The shape of the electrostatic discharge generation source estimation region varies depending on the arrangement of the receiving antenna and the position of the discharge source. FIG. 10 shows the same conditions as described above, the sampling rate is 10 GS / s, the electromagnetic wave arrival time difference on sampling is 0.6 ns, and the difference between
本装置では、図1に示すように、受信アンテナ群によって、静電気放電の発生を監視することと並行して、ビデオカメラ4で、被測定物aで静電気放電が発生する様子をビデオ画像で撮影する。
In this apparatus, as shown in FIG. 1, a video image is taken of the state in which the electrostatic discharge is generated in the measured object a by the
ビデオカメラ4で撮影されるビデオ画像には、ビデオカメラ4の撮像素子の焦点の中心である撮影基準点dを基点とした、ある方位と仰角の範囲に存在する被測定物aの領域が映り、ビデオ画像上の個々の画素には、その領域内の、ある特定の方位と仰角に存在する被測定物aの部位が映る。
The video image captured by the
そこで、撮影基準点dに対する静電気放電源bの方位と仰角を算出し、ビデオカメラ4で撮影したビデオ画像において、その方位と仰角が該当する画素の部分にマ−キング表示をすることで、静電気放電源bの場所をビデオ画像上で可視化する。
Therefore, the azimuth and elevation angle of the electrostatic discharge source b with respect to the imaging reference point d is calculated, and in the video image captured by the
撮影に用いるビデオカメラ4については、撮影に使用するカメラの撮影画角や撮影基準点の位置,撮影された画像における個々の画素が対応する角度(方位,仰角)を予め調べて、その結果を撮影画像角度データベースとして記録する。さらに,受信アンテナ群で構成される3次元空間における、ビデオカメラの撮影基準点(撮影画角に対する焦点位置)の設置座標や撮影角度(ピッチング・ヨーイング・ローリング)も予め明らかにしておく。
カメラの撮影角度において、ピッチングとは、受信アンテナ群で構成される3次元空間における方位の角度を意味し、ローリングは、受信アンテナ群で構成される3次元空間における仰角の角度を意味し、ヨーイングとは、受信アンテナ群で構成される3次元空間のXY平面に対する回転角を意味する。図2において、ピッチング、ローリング、ヨーイングを図示している。
For the
In terms of camera shooting angle, pitching means the azimuth angle in a three-dimensional space composed of receiving antenna groups, and rolling means the elevation angle in a three-dimensional space composed of receiving antenna groups, and yawing. Means a rotation angle with respect to the XY plane of a three-dimensional space constituted by the receiving antenna group. In FIG. 2, pitching, rolling, and yawing are illustrated.
双曲線法で得られた放電発生源の位置を撮影画像にマーキングする際は、算出された放電発生源の座標が、上述した方法により明らかにしたカメラの設置条件下で、撮影された画像のどの画素に位置づけされるかを計算し、その場所にマーキングする。 When marking the position of the discharge source obtained by the hyperbola method on the photographed image, the coordinates of the discharge source calculated are those of the photographed image under the camera installation conditions clarified by the method described above. Calculate whether the pixel is positioned and mark the location.
受信アンテナ群とビデオカメラ4とを支持体1で一体化すると、様々な場所に移動して監視する際に、ビデオカメラと受信アンテナ群との位置関係や撮影角度を校正(明らかに)する必要がないというメリットがあるが、例えば、部屋全体を常時監視するため、部屋の壁にビデオカメラと受信アンテナ群を固定して運用する場合などは、設置する際に、ビデオカメラと受信アンテナ群との位置関係や撮影角度を校正(明らかに)にすれば、一体化治具を用いなくても良い。
When the receiving antenna group and the
ビデオカメラ4を用いて無限ループ撮影する場合、カメラ内部もしくは外部の画像記録媒体を用いる。撮影条件として、撮影速度(fps)、トリガ発生前記録枚数、トリガ発生後記録枚数、付与するファイル名の開始番号などを設定する。
無限ループ撮影を開始し、計測器の放電検知トリガ信号を検知したら、予め設定していたトリガ発生後記録枚数分の撮影後に無限ループ撮影を終了する。
When shooting an infinite loop using the
When infinite loop imaging is started and the discharge detection trigger signal of the measuring instrument is detected, the infinite loop imaging is terminated after imaging for a preset number of recordings after the occurrence of the trigger.
その後、デジタルオシロスコープ6から受信波形データを読み込み、映像撮影機器が撮影していた画像の中から、静電気放電が発生した瞬間の画像に対して、静電気放電発生源推定領域をマーキング表示して、静電気放電発生源推定領域を表示することで静電気放電発生源を可視化する。
After that, the received waveform data is read from the
映像撮影機器で撮影した画像を任意の時間分、無限ループ記録し続け、受信アンテナ群が静電気放電現象を検出すると、検出した瞬間に撮影していた静止画像に静電気放電発生時基準番号を付与して、無限ループ記録した画像を静電気放電発生前後画像群として保存し、保存した個々の静止画像に静電気放電発生源推定領域を示すマーキング表示を加えた後、静止画像を時系列に表示して、被試験体で静電気放電が発生する前後の被測定物の状況を表示し確認することで、被試験体で静電気放電が発生する様子を可視化することもできる。 When an image taken with a video camera continues to be recorded in an infinite loop for an arbitrary amount of time, and the receiving antenna group detects an electrostatic discharge phenomenon, a reference number at the time of the occurrence of electrostatic discharge is assigned to the still image taken at the moment of detection. The images recorded in an infinite loop are stored as a group of images before and after the occurrence of electrostatic discharge, and after adding a marking display indicating the electrostatic discharge source estimation area to each stored still image, the still images are displayed in time series, By displaying and confirming the state of the object under measurement before and after the occurrence of electrostatic discharge in the device under test, it is possible to visualize the state of the occurrence of electrostatic discharge in the device under test.
なお、デジタルオシロスコープ6で放電を検知したタイミングと、ビデオカメラ4で静電気放電の発生した瞬間の画像のタイミングを合わせる方法として、以下の方法を用いることができる。
第一の方法は、デジタルオシロスコープ6を制御する制御用コンピュータ9の内部メモリを用いてビデオカメラ4の無限ループ撮影を行いながら、デジタルオシロスコープ6で放電検出を示すフラグがたっていないかモニタリングし続け、デジタルオシロスコープ6で放電検出を示すフラグがたったことを検出したら、その瞬間に記録していた画像の管理番号を記録する方法である。
Note that the following method can be used as a method of matching the timing when the discharge is detected by the
The first method continues to monitor the
また、第二の方法は、デジタルオシロスコープ6のトリガ出力端子と、ビデオカメラ4のトリガ入力端子を接続し、ビデオカメラ4の内部メモリを用いて無限ループ撮影を行い、デジタルオシロスコープ6で放電を検出した際のトリガ信号を、ビデオカメラ4のトリガ入力端子を介して伝達する方法である。
The second method is to connect the trigger output terminal of the
放電検出を知らせるトリガ信号やフラグを検知したら、予め設定されていた、トリガ発生後記録枚数分の撮影後に無限ループ撮影を終了する。
制御コンピュータ9の内部メモリで無限ループ記録していた場合、放電発生時の画像ビデオカメラ4の内部メモリで画像を記録していた場合、制御コンピュータ9にトリガ発生前後の指定枚数の画像を転送する。
When a trigger signal or flag for notifying the detection of discharge is detected, the infinite loop shooting is ended after shooting for the number of recorded sheets after the occurrence of the trigger.
When an infinite loop recording is performed in the internal memory of the
上記の第二の方法に基づく、本発明の第二実施形態についてより詳細に説明する。
本発明の第二実施形態は、第一実施形態で用いたビデオカメラ4の代わりに、TTL信号でトリガがかかる入力端子を有し、撮影画像を内部メモリに無限ループでデジタル記録できるビデオカメラを用いる方法である。
The second embodiment of the present invention based on the second method will be described in more detail.
In the second embodiment of the present invention, instead of the
デジタルオシロスコ−プ6のトリガ出力端子と、ビデオカメラ4のトリガ入力端子を接続し、静電気放電検出でデジタルオシロスコ−プ6にトリガがかかったら、ビデオカメラにトリガがかかるようにする。ビデオカメラは予め、無限ループ撮影状態にしておき、トリガがかかった時点から、予め設定されていた枚数分の画像を記録した後、撮影を終了する。撮影が終了したら、制御用コンピュ−タ9に、無限ループで記録した全ての静止画像を読み込み、デジタル記録媒体に記録する。場合によっては、一部の画像だけ限定して保存する場合もある。
The trigger output terminal of the
上記のいずれの実施形態においても、全ての静止画像ファイルには、撮影された順番に通し番号が付与され、トリガが発生した瞬間に撮影した画像であることが分かるようにファイル名が付与される。
例えば、「撮影モード:無限ループ、画像記録形式:JPG、撮影速度:30fps、記録枚数:トリガ発生前2秒分(60枚)・トリガ発生後1秒分(30枚)、開始ファイル番号:f000、ファイル名は撮影順に連番で付与」の条件である場合、ファイル名「f060」がトリガ発生時の画像であることが分かる。
In any of the above-described embodiments, all still image files are given serial numbers in the order of shooting, and file names are given so that it can be seen that the images were shot at the moment when the trigger occurred.
For example, “shooting mode: infinite loop, image recording format: JPG, shooting speed: 30 fps, number of recorded sheets: 2 seconds before trigger generation (60 sheets), 1 second after trigger generation (30 sheets), start file number: f000 If the file name is given in sequential order in the shooting order, the file name “f060” is the image when the trigger is generated.
読み込んだ全ての静止画像に、静電気放電発生源を示す枠をマーキング表示して保存する。マーキング表示に用いる色は、特に限定されないが、トリガ発生時の静止画像には、トリガ発生時の画像であることが識別できるよう、トリガ発生時以外のマーキング表示の色とは異なる色を用いる。 A frame indicating the electrostatic discharge generation source is marked and saved on all the read still images. The color used for the marking display is not particularly limited, but for the still image when the trigger is generated, a color different from the color of the marking display other than when the trigger is generated is used so that the image can be identified.
本発明は、静電気放電発生源検知を行う際に用いる計測器のサンプリング性能に応じて、サンプリングによる誤差範囲を含んで正確な静電気放電発生源が存在する領域である静電気放電発生源推定領域を特定することが可能な静電気放電発生源検知方法および静電気放電発生源可視化方法として、広く利用することができる。 In accordance with the sampling performance of the measuring instrument used when detecting the electrostatic discharge source, the present invention specifies the electrostatic discharge source estimation region, which is an accurate region including the error range due to sampling. It can be widely used as an electrostatic discharge source detection method and an electrostatic discharge source visualization method that can be performed.
1 支持体
2a、2b、2c、2d 受信アンテナ
3a、3b、3c、3d 同軸ケ−ブル
4 ビデオカメラ
5 方位・仰角基準板
6 デジタルオシロスコ−プ
9 制御用コンピュ−タ
9a、9b デジタルインターフェースケーブル
a 被測定物
b 静電気放電発生源
c 測定基準点
d 撮影基準点
P 電磁波到達基準点
t 到達時間差
L 双曲線
Q 交点
R 静電気放電発生源推定領域
DESCRIPTION OF
Claims (3)
Priority Applications (1)
| Application Number | Priority Date | Filing Date | Title |
|---|---|---|---|
| JP2015076173A JP6447918B2 (en) | 2015-04-02 | 2015-04-02 | Electrostatic discharge source detection method and electrostatic discharge source visualization method |
Applications Claiming Priority (1)
| Application Number | Priority Date | Filing Date | Title |
|---|---|---|---|
| JP2015076173A JP6447918B2 (en) | 2015-04-02 | 2015-04-02 | Electrostatic discharge source detection method and electrostatic discharge source visualization method |
Publications (2)
| Publication Number | Publication Date |
|---|---|
| JP2016197029A true JP2016197029A (en) | 2016-11-24 |
| JP6447918B2 JP6447918B2 (en) | 2019-01-09 |
Family
ID=57358425
Family Applications (1)
| Application Number | Title | Priority Date | Filing Date |
|---|---|---|---|
| JP2015076173A Active JP6447918B2 (en) | 2015-04-02 | 2015-04-02 | Electrostatic discharge source detection method and electrostatic discharge source visualization method |
Country Status (1)
| Country | Link |
|---|---|
| JP (1) | JP6447918B2 (en) |
Cited By (2)
| Publication number | Priority date | Publication date | Assignee | Title |
|---|---|---|---|---|
| CN107037401A (en) * | 2017-05-24 | 2017-08-11 | 国网辽宁省电力有限公司电力科学研究院 | One kind electric discharge source position visualization device |
| KR20210123004A (en) * | 2020-04-02 | 2021-10-13 | 코어인사이트 (주) | Apparatus and method for esd stress testing |
Citations (10)
| Publication number | Priority date | Publication date | Assignee | Title |
|---|---|---|---|---|
| JPH03120460A (en) * | 1989-10-02 | 1991-05-22 | Agency Of Ind Science & Technol | Method and device for locating ae generation position of thrust ball bearing |
| JPH10170589A (en) * | 1996-12-10 | 1998-06-26 | Takaoka Electric Mfg Co Ltd | In-substation failure point locating device |
| JP2003215225A (en) * | 2002-01-28 | 2003-07-30 | Mitsubishi Electric Corp | Time-difference direction detector |
| JP2005055190A (en) * | 2003-08-01 | 2005-03-03 | Japan Science & Technology Agency | Electromagnetic-wave radiation source detecting method and device by bayesian network |
| JP2006339982A (en) * | 2005-06-01 | 2006-12-14 | Hitachi Ltd | Device and system for monitor video recording |
| JP2007327956A (en) * | 2006-06-06 | 2007-12-20 | Sony Corp | Method and apparatus for measuring distance |
| JP2008271016A (en) * | 2007-04-18 | 2008-11-06 | Mitsubishi Electric Corp | Video monitor |
| JP2010236918A (en) * | 2009-03-30 | 2010-10-21 | Kagoshima Prefecture | Method and apparatus for visualizing area of generation of electrostatic discharge |
| JP2014016291A (en) * | 2012-07-10 | 2014-01-30 | Tokyo Institute Of Technology | Transmission source estimation method and transmission source estimation device using the same |
| US20150035699A1 (en) * | 2012-11-30 | 2015-02-05 | Korea Aerospace Research Institute | Detecting and localization method of unknown signal using aircraft with ads-b system |
-
2015
- 2015-04-02 JP JP2015076173A patent/JP6447918B2/en active Active
Patent Citations (10)
| Publication number | Priority date | Publication date | Assignee | Title |
|---|---|---|---|---|
| JPH03120460A (en) * | 1989-10-02 | 1991-05-22 | Agency Of Ind Science & Technol | Method and device for locating ae generation position of thrust ball bearing |
| JPH10170589A (en) * | 1996-12-10 | 1998-06-26 | Takaoka Electric Mfg Co Ltd | In-substation failure point locating device |
| JP2003215225A (en) * | 2002-01-28 | 2003-07-30 | Mitsubishi Electric Corp | Time-difference direction detector |
| JP2005055190A (en) * | 2003-08-01 | 2005-03-03 | Japan Science & Technology Agency | Electromagnetic-wave radiation source detecting method and device by bayesian network |
| JP2006339982A (en) * | 2005-06-01 | 2006-12-14 | Hitachi Ltd | Device and system for monitor video recording |
| JP2007327956A (en) * | 2006-06-06 | 2007-12-20 | Sony Corp | Method and apparatus for measuring distance |
| JP2008271016A (en) * | 2007-04-18 | 2008-11-06 | Mitsubishi Electric Corp | Video monitor |
| JP2010236918A (en) * | 2009-03-30 | 2010-10-21 | Kagoshima Prefecture | Method and apparatus for visualizing area of generation of electrostatic discharge |
| JP2014016291A (en) * | 2012-07-10 | 2014-01-30 | Tokyo Institute Of Technology | Transmission source estimation method and transmission source estimation device using the same |
| US20150035699A1 (en) * | 2012-11-30 | 2015-02-05 | Korea Aerospace Research Institute | Detecting and localization method of unknown signal using aircraft with ads-b system |
Cited By (3)
| Publication number | Priority date | Publication date | Assignee | Title |
|---|---|---|---|---|
| CN107037401A (en) * | 2017-05-24 | 2017-08-11 | 国网辽宁省电力有限公司电力科学研究院 | One kind electric discharge source position visualization device |
| KR20210123004A (en) * | 2020-04-02 | 2021-10-13 | 코어인사이트 (주) | Apparatus and method for esd stress testing |
| KR102344038B1 (en) * | 2020-04-02 | 2021-12-28 | 코어인사이트(주) | Apparatus and method for esd stress testing |
Also Published As
| Publication number | Publication date |
|---|---|
| JP6447918B2 (en) | 2019-01-09 |
Similar Documents
| Publication | Publication Date | Title |
|---|---|---|
| US7869026B2 (en) | Targeted artifacts and methods for evaluating 3-D coordinate system measurement accuracy of optical 3-D measuring systems using such targeted artifacts | |
| CN104457736A (en) | Method and device for acquiring target location information | |
| CN106709955B (en) | Space coordinate system calibration system and method based on binocular stereo vision | |
| JP5435631B2 (en) | Electromagnetic wave source visualization apparatus and method | |
| CN109061388B (en) | Power transmission line corona discharge point positioning system and positioning method thereof | |
| CN106646407B (en) | Radar Calibration equipment verification methods, devices and systems | |
| CN209372015U (en) | Vision measurement system | |
| JP5374687B2 (en) | Method and apparatus for visualizing electrostatic discharge occurrence location | |
| JP6447918B2 (en) | Electrostatic discharge source detection method and electrostatic discharge source visualization method | |
| JP5351466B2 (en) | Radio source visualization device | |
| CN108008349B (en) | Method for positioning explosive core | |
| WO2017107534A1 (en) | Method and device for measuring angle, and method and device for adjusting angle | |
| WO2021081963A1 (en) | Calibration board, method and apparatus for testing angular resolution, and computer storage medium | |
| EP2835657A1 (en) | Cable system and test cable therefore | |
| CN113884021A (en) | Scanning system, calibration device and calibration method of scanning system | |
| KR20220013757A (en) | Measuring system for crack | |
| CN104776826A (en) | Attitude measurement system and attitude measurement method | |
| CN1202498C (en) | EEG electrode space positioning method based on up shot measure | |
| CN111624418A (en) | Visual diagnostic device of space electromagnetic interference | |
| CN105717502B (en) | A kind of high-rate laser range unit based on line array CCD | |
| JP2018017569A (en) | Discharge generation place detector | |
| CN215639285U (en) | Sag measuring device and system for high-voltage tower line | |
| KR101142671B1 (en) | Imaging sonar with two arrays of transducers with position offset | |
| RU2584577C1 (en) | Method of calibrating magnetostrictive converters of linear displacements and device for therefor | |
| CN209928019U (en) | Wave height measuring device for ice-water mixed environment |
Legal Events
| Date | Code | Title | Description |
|---|---|---|---|
| A621 | Written request for application examination |
Free format text: JAPANESE INTERMEDIATE CODE: A621 Effective date: 20170324 |
|
| A977 | Report on retrieval |
Free format text: JAPANESE INTERMEDIATE CODE: A971007 Effective date: 20180122 |
|
| A131 | Notification of reasons for refusal |
Free format text: JAPANESE INTERMEDIATE CODE: A131 Effective date: 20180130 |
|
| A521 | Request for written amendment filed |
Free format text: JAPANESE INTERMEDIATE CODE: A523 Effective date: 20180307 |
|
| A131 | Notification of reasons for refusal |
Free format text: JAPANESE INTERMEDIATE CODE: A131 Effective date: 20180710 |
|
| A521 | Request for written amendment filed |
Free format text: JAPANESE INTERMEDIATE CODE: A523 Effective date: 20180821 |
|
| TRDD | Decision of grant or rejection written | ||
| A01 | Written decision to grant a patent or to grant a registration (utility model) |
Free format text: JAPANESE INTERMEDIATE CODE: A01 Effective date: 20181119 |
|
| A61 | First payment of annual fees (during grant procedure) |
Free format text: JAPANESE INTERMEDIATE CODE: A61 Effective date: 20181122 |
|
| R150 | Certificate of patent or registration of utility model |
Ref document number: 6447918 Country of ref document: JP Free format text: JAPANESE INTERMEDIATE CODE: R150 |
|
| R250 | Receipt of annual fees |
Free format text: JAPANESE INTERMEDIATE CODE: R250 |
|
| R250 | Receipt of annual fees |
Free format text: JAPANESE INTERMEDIATE CODE: R250 |
|
| R250 | Receipt of annual fees |
Free format text: JAPANESE INTERMEDIATE CODE: R250 |