JP2014526926A - Event sequencing and method using acoustic breathing markers - Google Patents
Event sequencing and method using acoustic breathing markers Download PDFInfo
- Publication number
- JP2014526926A JP2014526926A JP2014524483A JP2014524483A JP2014526926A JP 2014526926 A JP2014526926 A JP 2014526926A JP 2014524483 A JP2014524483 A JP 2014524483A JP 2014524483 A JP2014524483 A JP 2014524483A JP 2014526926 A JP2014526926 A JP 2014526926A
- Authority
- JP
- Japan
- Prior art keywords
- event
- acoustic
- subject
- relationship
- respiratory
- Prior art date
- Legal status (The legal status is an assumption and is not a legal conclusion. Google has not performed a legal analysis and makes no representation as to the accuracy of the status listed.)
- Pending
Links
Images


Classifications
-
- A—HUMAN NECESSITIES
- A61—MEDICAL OR VETERINARY SCIENCE; HYGIENE
- A61B—DIAGNOSIS; SURGERY; IDENTIFICATION
- A61B7/00—Instruments for auscultation
- A61B7/003—Detecting lung or respiration noise
-
- A—HUMAN NECESSITIES
- A61—MEDICAL OR VETERINARY SCIENCE; HYGIENE
- A61B—DIAGNOSIS; SURGERY; IDENTIFICATION
- A61B5/00—Measuring for diagnostic purposes; Identification of persons
- A61B5/08—Detecting, measuring or recording devices for evaluating the respiratory organs
-
- A—HUMAN NECESSITIES
- A61—MEDICAL OR VETERINARY SCIENCE; HYGIENE
- A61B—DIAGNOSIS; SURGERY; IDENTIFICATION
- A61B5/00—Measuring for diagnostic purposes; Identification of persons
- A61B5/08—Detecting, measuring or recording devices for evaluating the respiratory organs
- A61B5/0823—Detecting or evaluating cough events
-
- A—HUMAN NECESSITIES
- A61—MEDICAL OR VETERINARY SCIENCE; HYGIENE
- A61B—DIAGNOSIS; SURGERY; IDENTIFICATION
- A61B5/00—Measuring for diagnostic purposes; Identification of persons
- A61B5/08—Detecting, measuring or recording devices for evaluating the respiratory organs
- A61B5/0826—Detecting or evaluating apnoea events
-
- A—HUMAN NECESSITIES
- A61—MEDICAL OR VETERINARY SCIENCE; HYGIENE
- A61B—DIAGNOSIS; SURGERY; IDENTIFICATION
- A61B5/00—Measuring for diagnostic purposes; Identification of persons
- A61B5/103—Detecting, measuring or recording devices for testing the shape, pattern, colour, size or movement of the body or parts thereof, for diagnostic purposes
- A61B5/11—Measuring movement of the entire body or parts thereof, e.g. head or hand tremor, mobility of a limb
- A61B5/1116—Determining posture transitions
-
- A—HUMAN NECESSITIES
- A61—MEDICAL OR VETERINARY SCIENCE; HYGIENE
- A61B—DIAGNOSIS; SURGERY; IDENTIFICATION
- A61B5/00—Measuring for diagnostic purposes; Identification of persons
- A61B5/72—Signal processing specially adapted for physiological signals or for diagnostic purposes
- A61B5/7235—Details of waveform analysis
- A61B5/7264—Classification of physiological signals or data, e.g. using neural networks, statistical classifiers, expert systems or fuzzy systems
-
- A—HUMAN NECESSITIES
- A61—MEDICAL OR VETERINARY SCIENCE; HYGIENE
- A61B—DIAGNOSIS; SURGERY; IDENTIFICATION
- A61B5/00—Measuring for diagnostic purposes; Identification of persons
- A61B5/72—Signal processing specially adapted for physiological signals or for diagnostic purposes
- A61B5/7271—Specific aspects of physiological measurement analysis
- A61B5/7282—Event detection, e.g. detecting unique waveforms indicative of a medical condition
-
- A—HUMAN NECESSITIES
- A61—MEDICAL OR VETERINARY SCIENCE; HYGIENE
- A61B—DIAGNOSIS; SURGERY; IDENTIFICATION
- A61B5/00—Measuring for diagnostic purposes; Identification of persons
- A61B5/74—Details of notification to user or communication with user or patient ; user input means
- A61B5/742—Details of notification to user or communication with user or patient ; user input means using visual displays
-
- A—HUMAN NECESSITIES
- A61—MEDICAL OR VETERINARY SCIENCE; HYGIENE
- A61B—DIAGNOSIS; SURGERY; IDENTIFICATION
- A61B5/00—Measuring for diagnostic purposes; Identification of persons
- A61B5/145—Measuring characteristics of blood in vivo, e.g. gas concentration, pH value; Measuring characteristics of body fluids or tissues, e.g. interstitial fluid, cerebral tissue
- A61B5/14539—Measuring characteristics of blood in vivo, e.g. gas concentration, pH value; Measuring characteristics of body fluids or tissues, e.g. interstitial fluid, cerebral tissue for measuring pH
-
- A—HUMAN NECESSITIES
- A61—MEDICAL OR VETERINARY SCIENCE; HYGIENE
- A61B—DIAGNOSIS; SURGERY; IDENTIFICATION
- A61B5/00—Measuring for diagnostic purposes; Identification of persons
- A61B5/42—Detecting, measuring or recording for evaluating the gastrointestinal, the endocrine or the exocrine systems
- A61B5/4211—Diagnosing or evaluating reflux
-
- A—HUMAN NECESSITIES
- A61—MEDICAL OR VETERINARY SCIENCE; HYGIENE
- A61B—DIAGNOSIS; SURGERY; IDENTIFICATION
- A61B5/00—Measuring for diagnostic purposes; Identification of persons
- A61B5/48—Other medical applications
- A61B5/4806—Sleep evaluation
- A61B5/4818—Sleep apnoea
-
- A—HUMAN NECESSITIES
- A61—MEDICAL OR VETERINARY SCIENCE; HYGIENE
- A61B—DIAGNOSIS; SURGERY; IDENTIFICATION
- A61B5/00—Measuring for diagnostic purposes; Identification of persons
- A61B5/72—Signal processing specially adapted for physiological signals or for diagnostic purposes
- A61B5/7235—Details of waveform analysis
- A61B5/7242—Details of waveform analysis using integration
Abstract
被検者における音響呼吸マーカと事象との間の時間的関係を特徴付けるための方法であって、(a)被検者の呼吸器系からの音響信号と、被検者に関連付けられる生理学的パラメータ、病態生理学的パラメータ、患者報告症状及び治療的パラメータを含む群から選択される少なくとも1つのパラメータとを同時に監視するステップと、(c)監視されるパラメータにおいて上記事象を識別するステップと、(d)監視される音響信号において、上記事象と同時に、並びに/又は上記事象の前及び/若しくは上記事象の後に起こる1つ又は複数の呼吸マーカの存在を識別するステップと、を含み、上記関係は、上記事象と上記1つ又は複数の音響呼吸マーカとの間の時間的相関関係を求めることによって特徴付けられる、方法が提供される。
【選択図】 図1A method for characterizing a temporal relationship between an acoustic respiratory marker and an event in a subject, comprising: (a) an acoustic signal from the subject's respiratory system and physiological parameters associated with the subject Simultaneously monitoring at least one parameter selected from the group comprising pathophysiological parameters, patient-reported symptoms and therapeutic parameters; (c) identifying the event in the monitored parameters; (d Identifying the presence of one or more respiratory markers that occur in the monitored acoustic signal simultaneously with and / or before and / or after the event, the relationship comprising: A method is provided that is characterized by determining a temporal correlation between the event and the one or more acoustic respiratory markers.
[Selection] Figure 1
Description
[0001]本開示は、呼吸音響の分野に関する。本開示は、これらに限定するものではないが、詳細には、被検者からの音響呼吸マーカとともに生理学的及び/若しくは病態生理学的並びに/又は治療パラメータを監視し、1つ又は複数の音響呼吸マーカと、たとえば、被検者内で発生する生理学的事象との間の関係、たとえば時間的関係を特徴付けるための方法及びシステムに関する。 [0001] The present disclosure relates to the field of respiratory acoustics. In particular, but not exclusively, the present disclosure monitors physiological and / or pathophysiological and / or therapeutic parameters in conjunction with acoustic respiratory markers from a subject to monitor one or more acoustic breaths. The present invention relates to a method and system for characterizing a relationship, for example a temporal relationship, between a marker and, for example, a physiological event occurring within a subject.
[0002]身体は、生理学系の複雑な相互作用を含む。生理学的、病態生理学的、心理学的及び身体的事象などの事象は関連する「系」の文脈において説明することができる。たとえば、被検者内の逆流事象は、消化器系を参照することによって説明することができる。しかしながら、この事象は、たとえば、呼吸器系などの身体内の他の系に影響するか、又はそれに影響される場合がある。 [0002] The body includes complex interactions of the physiological system. Events such as physiological, pathophysiological, psychological and physical events can be described in the context of the relevant “system”. For example, a reflux event in a subject can be explained by referring to the digestive system. However, this event may affect or be affected by other systems in the body, such as the respiratory system.
[0003]いくつかのそのような相互作用は、証明済みのよく理解されている医療科学によって、発生することが知られており、また説明することができる。他の相互作用は証明されていないが、まだ完全には理解されていない科学理論又は研究に基づいて存在すると容認されているか、又は少なくともそう考えられている。相互作用の定量分析はこれまでは実現可能ではなく、相互作用は、経験的な感覚のみにおいて評価されてきた。 [0003] Several such interactions are known and can be explained by proven and well-understood medical science. Other interactions have not been proven, but are accepted or at least considered to exist based on scientific theories or studies that are not yet fully understood. Quantitative analysis of interactions has not been feasible so far, and interactions have been evaluated only on an empirical sensation.
[0004]「Phonopneumograph System」と題する、Gavrielyに対して2001年1月2日に発行された米国特許第6,168,568号、「Phonopneumograph System」と題する、Gavrielyに対して2001年7月17日に発行された米国特許第6,261,238号、及び胸部の音及びタイミングの定量的評価を可能にする、胸音方法(Breath Sounds Methodology)(N. Gavriely、Florida:CRC Press, Inc.、1995)において開示されているものなど、音響マーカを正確に検出するための方法が存在する。「Method and Apparatus for Determining Conditions of Biological Tissues」と題する、Wilkinson他に対して2008年3月25日に発行された米国特許第7,347,824号に開示されているものなどの他の方法は、導入される信号を使用することを含む。 [0004] United States Patent No. 6,168,568, issued January 2, 2001 to Gavrily, entitled "Phonopneumographic System", July 17, 2001 to Gaverry, entitled "Phonopneumographic System" U.S. Pat. No. 6,261,238 issued to date, and Breast Sounds Methodology (N. Gavrery, Florida: CRC Press, Inc.), which allows quantitative assessment of chest sound and timing. , 1995), there are methods for accurately detecting acoustic markers. Other methods, such as those disclosed in US Pat. No. 7,347,824, issued March 25, 2008 to Wilkinson et al., Entitled “Method and Apparatus for Determining Conditions of Biological Resources” Using the introduced signal.
[0005]生理学的及び病態生理学的事象を検出するための方法も存在する。例としては、たとえば、いくつか挙げると、睡眠時無呼吸症候群を患う患者の無呼吸の開始及び終了、呼吸若しくは強制呼気の検出、人工呼吸を受けている患者における人工呼吸器の設定の変化の判定、又は逆流事象の発生が挙げられる。加えて、姿勢変化(たとえば、直立から背臥位、又は左側臥位から右側臥位への移行)及び身体活動の開始を検出する手段が存在する。加えて、医薬の投与のタイミング並びに医薬の効果の開始時刻及び動態を、既知の方法を使用して究明することができる。 [0005] There are also methods for detecting physiological and pathophysiological events. Examples include, for example, the onset and termination of apnea in patients with sleep apnea syndrome, detection of breathing or forced expiration, and changes in ventilator settings in patients undergoing ventilation. A determination or the occurrence of a backflow event may be mentioned. In addition, there are means for detecting posture changes (e.g., transition from upright to supine position, or from left to right position) and the start of physical activity. In addition, the timing of drug administration and the onset time and kinetics of the drug effect can be determined using known methods.
[0006]本開示は、たとえば生理学的、病態生理学的及び治療的事象を検出し、これらの事象と音響呼吸マーカとの間の時間的関係を特徴付けるための方法を使用する。 [0006] The present disclosure uses methods for detecting, for example, physiological, pathophysiological, and therapeutic events and characterizing the temporal relationship between these events and acoustic respiratory markers.
[0007]文献、活動、資料、デバイス、記事などを含むこの背景の説明は、本開示の文脈を説明するように意図されている。この説明は、参照されている資料のいずれかが、特許請求項のいずれかの優先日現在で刊行されていた、既知であった、若しくは共通一般の知識であったことを認めるか、又は示唆するものと受け取られるべきではない。 [0007] This background description, including literature, activities, materials, devices, articles, etc., is intended to illustrate the context of the present disclosure. This explanation acknowledges or suggests that any of the referenced material was published, known, or common general knowledge as of any priority date of the claims. Should not be taken as what you do.
[0008]音響呼吸マーカ(ARM)は、上気道閉塞(睡眠時無呼吸)、呼吸操作、呼吸、気道内圧の段階変化(人工換気及び持続的気道陽圧(CPAP))及び側道への胃内容物の逆流(胃食道逆流症)など、他の生理学的、病態生理学的及び治療的事象と同時に起こることが多い。そのような音響マーカは、いくつか挙げると、通常の胸音振幅、喘鳴、他の連続性異常胸音(CABS)、咳、いびき及びクラックルを含む場合がある。食事及び会話などの最も基本的な事象でさえ、呼吸事象を引き起こす可能性がある。 [0008] Acoustic respiratory markers (ARMs) include upper airway obstruction (sleep apnea), breathing maneuver, breathing, airway pressure step changes (artificial ventilation and continuous positive airway pressure (CPAP)) and stomach to the sideways Often coincides with other physiological, pathophysiological and therapeutic events such as reflux of the contents (gastroesophageal reflux disease). Such acoustic markers may include normal chest sound amplitude, wheezing, other continuous abnormal chest sounds (CABS), cough, snoring, and crackles, to name a few. Even the most basic events such as meals and conversations can cause respiratory events.
[0009]本開示は、哺乳類の被検者又は患者における音響呼吸マーカと事象との間の時間的関係を特徴付けるための方法を提供する。方法は、(a)被検者の呼吸器系からの音響信号と、被検者に関連付けられる生理学的パラメータ、病態生理学的パラメータ、患者報告症状及び治療的パラメータを含む群から選択される少なくとも1つのパラメータとを同時に監視するステップと、(c)監視されるパラメータ(複数可)において事象を識別するステップと、(d)監視される音響信号において、事象と同時に、並びに/又は事象の前及び/若しくは事象の後に起こる1つ又は複数の呼吸マーカの存在を識別するステップとを含む。関係は、事象と1つ又は複数の音響呼吸マーカとの間の時間的相関関係を求めることによって特徴付けられる。 [0009] The present disclosure provides a method for characterizing a temporal relationship between an acoustic respiratory marker and an event in a mammalian subject or patient. The method comprises at least one selected from the group comprising: (a) an acoustic signal from the subject's respiratory system and physiological parameters, pathophysiological parameters, patient-reported symptoms and therapeutic parameters associated with the subject. Simultaneously monitoring two parameters; (c) identifying an event in the monitored parameter (s); (d) in the monitored acoustic signal simultaneously with and / or before the event and / or And / or identifying the presence of one or more respiratory markers that occur after the event. The relationship is characterized by determining a temporal correlation between the event and one or more acoustic respiratory markers.
[0010]本開示の一態様において、音響呼吸マーカは、これらに限定されないが、喘鳴、咳、いびき、クラックル及び胸音振幅を示す信号を含む群から選択される。事象は、これらに限定されないが、逆流事象、無呼吸の開始又は終了、人工呼吸器における設定の変更、姿勢変化、患者の症状の表示、並びに治療薬の投与又は措置を含む群から選択される。 [0010] In one aspect of the present disclosure, the acoustic respiratory marker is selected from the group comprising, but not limited to, signals indicative of wheezing, coughing, snoring, crackle and chest sound amplitude. The event is selected from the group including, but not limited to, a reflux event, the start or end of apnea, a change in settings on the ventilator, a change in posture, an indication of the patient's symptoms, and the administration or treatment of a therapeutic agent .
[0011]方法は、既知の音響特性を有する音波信号を被検者の呼吸器系に導入するステップを含み、監視される音響信号は、被検者の呼吸器系の少なくとも一部を通して伝わった後に、導入された音波信号を含む。 [0011] The method includes introducing a sound wave signal having a known acoustic characteristic into the subject's respiratory system, the monitored acoustic signal being transmitted through at least a portion of the subject's respiratory system. Later, the introduced sonic signal is included.
[0012]本開示の別の態様において、方法は、数学的モデルを使用して一定期間にわたって監視される音響信号を表し、当該モデルの1つ又は複数のパラメータを評価するステップを含む。1つ又は複数の評価されたパラメータは、事象と1つ又は複数の音響マーカとの間の関係の定量的な指標である。期間は事象の間又は後に開始するが、実施形態によっては、事象の前の期間をも含んでもよい。 [0012] In another aspect of the present disclosure, a method includes representing an acoustic signal monitored over a period of time using a mathematical model and evaluating one or more parameters of the model. The one or more evaluated parameters are a quantitative indicator of the relationship between the event and the one or more acoustic markers. The time period begins during or after the event, but in some embodiments may also include a time period before the event.
[0013]以下、すなわち、
(a)関係

を使用して求められる時定数τ、
(b)関係
を使用して求められるような分散σ2、
(c)関係
を使用して求められるような歪度γ1、
(d)関係
を使用して求められるような尖度γ2、及び
(e)関係
を使用して求められるようなヒルの式の指数n
のうちの1つ又は複数を使用して、数学的モデルに利用される多項式の関係若しくは係数又は監視される音響信号の他の表現を特徴付けることができる。
上記関係において、yは呼吸マーカ値であり、
A及びτは定数であり、
Nは音響信号データ点の数であり、
σは標準偏差であり、
xiはデータ点iの値であり、
x0は事象に対応するデータ点の値であり、
θは最大データのうちの割合であり、
T50はデータが最大値の50%である時刻であり、
tは時刻であり、
nは呼吸マーカの変化の鋭さを表す指数であり、
mは比例定数である。
[0013] The following:
(A) Relationship
The time constant τ obtained using
(B) Relationship
Variance σ 2 , as determined using
(C) Relationship
Skewness γ 1 as determined using
(D) Relationship
Kurtosis γ 2 as determined using, and (e) relationship
The index n of Hill's formula as found using
Can be used to characterize polynomial relationships or coefficients utilized in the mathematical model or other representations of the monitored acoustic signal.
In the above relationship, y is a respiratory marker value,
A and τ are constants,
N is the number of acoustic signal data points,
σ is the standard deviation,
x i is the value of data point i,
x 0 is the value of the data point corresponding to the event,
θ is the percentage of maximum data,
T 50 is the time when the data is 50% of the maximum value,
t is the time,
n is an index representing the sharpness of the change in the respiratory marker,
m is a proportionality constant.
[0014]本開示のさらに別の態様において、方法は、監視されるパラメータにおいて識別された複数の事象にわたって音響信号を表すデータを平均化して、関係を特徴付けるステップを含む。一実施形態はまた/代替的に、呼吸マーカの範囲を求めるステップを含んでもよい。 [0014] In yet another aspect of the present disclosure, the method includes averaging data representing the acoustic signal over a plurality of events identified in the monitored parameter to characterize the relationship. An embodiment may also / alternatively include determining a range of respiratory markers.
[0015]上記で参照した特徴付け方法は、被検者の状態を診断するための方法において採用されてもよい。 [0015] The characterization methods referenced above may be employed in a method for diagnosing a subject's condition.
[0016]別の視点から見ると、本開示は、被検者からの音響呼吸マーカと被検者内の事象との間の関係を特徴付けるためのシステムを提供し、このシステムは、(a)被検者の呼吸器系からの音響信号を監視することが可能な音響監視装置と、(b)被検者及び患者報告症状に関連付けられる生理学的パラメータ、病態生理学的パラメータ、治療的パラメータを含む群から選択される1つ又は複数のパラメータを監視することが可能なパラメータ監視装置と、(c)プロセッサであり、(i)監視されるパラメータ(複数可)において事象の発生を識別する識別モジュールと、(ii)事象と同時に、並びに/又は事象の前及び/若しくは事象の後に起こる1つ又は音響呼吸信号において1つ又は複数の音響マーカを位置特定するマーカモジュールと、(iii)事象と1つ又は複数の音響呼吸マーカとの間の時間的相関関係を求めることによって関係を特徴付けるように構成されている特徴付けモジュールとを組み込んでいる、プロセッサとを備える。 [0016] Viewed from another perspective, the present disclosure provides a system for characterizing a relationship between an acoustic respiratory marker from a subject and an event within the subject, the system comprising: (a) An acoustic monitoring device capable of monitoring an acoustic signal from the subject's respiratory system; and (b) including physiological parameters, pathophysiological parameters, and therapeutic parameters associated with the subject and patient-reported symptoms A parameter monitoring device capable of monitoring one or more parameters selected from the group; and (c) a processor, (i) an identification module that identifies the occurrence of an event in the monitored parameter (s) And (ii) a marker module that locates one or more acoustic markers in one or acoustic respiratory signals that occur simultaneously with and / or before and / or after the event When, and a characterization incorporated in and, a processor and a module configured to characterize the relationship by determining a temporal correlation between (iii) event and one or more acoustic respiratory marker.
[0017]また別の視点から見ると、本開示は、被検者からの音響呼吸マーカと被検者内の事象との間の関係を特徴付けるためのシステムを提供し、このシステムは、(a)被検者の呼吸器系からの音響信号を監視するための音響監視手段と、(b)被検者及び患者報告症状に関連付けられる生理学的パラメータ、病態生理学的パラメータ、治療的パラメータを含む群から選択されるパラメータを監視するためのパラメータ監視手段と、(c)処理手段であり、(i)監視されるパラメータ(複数可)において事象の発生を識別する識別モジュールと、(ii)事象と同時、及び/又は事象の前、及び/又は事象の後に起こる音響呼吸信号において1つ又は複数の音響マーカを位置特定するマーカモジュールと、(iii)事象と1つ又は複数の音響呼吸マーカとの間の時間的相関関係を求めることによって関係を特徴付けるように構成されている特徴付けモジュールとを組み込んでいる、処理手段とを備える。 [0017] Viewed from another perspective, the present disclosure provides a system for characterizing a relationship between an acoustic respiratory marker from a subject and an event within the subject, the system comprising: A) acoustic monitoring means for monitoring an acoustic signal from the subject's respiratory system; and (b) a group comprising physiological parameters, pathophysiological parameters, and therapeutic parameters associated with the subject and patient-reported symptoms. Parameter monitoring means for monitoring parameters selected from: (c) processing means; (i) an identification module for identifying the occurrence of an event in the monitored parameter (s); (ii) an event; A marker module for locating one or more acoustic markers in an acoustic respiration signal that occurs simultaneously and / or before and / or after the event; and (iii) the event and one or more sounds Incorporating a characterization module configured to characterize the relationship by determining a temporal correlation between respiratory marker, and a processing unit.
[0018]本開示のさらに別の態様において、システムは、既知の特性を有する音波信号を生成するための音源と、音波信号を被検者の呼吸器系に導入することが可能な導入装置又は導入するための手段とを含み、音響監視装置又は音響監視手段は、音波が被検者の呼吸器系の少なくとも一部を通して伝わった後に、導入された音波信号を監視することが可能である。システムはまた、監視される信号のグラフィック表示を提示し、さらに特徴付けるためのデータウィンドウのユーザ選択を受信するユーザインターフェースをも含んでもよい。 [0018] In yet another aspect of the present disclosure, a system includes a sound source for generating a sound wave signal having a known characteristic and an introduction device capable of introducing the sound wave signal into a subject's respiratory system or Means for introducing, wherein the sound monitoring device or means for monitoring is capable of monitoring the introduced sound wave signal after the sound wave has been transmitted through at least a portion of the subject's respiratory system. The system may also include a user interface that presents a graphical representation of the monitored signal and receives a user selection of a data window for further characterization.
[0019]一実施形態において、特徴付けモジュールは、監視される音響信号の少なくとも一部を近似する数学的モデルを計算することによって、被検者からの音響呼吸マーカと被検者内の事象との間の関係をさらに特徴付ける。特徴付けモジュールはまた、数学的モデルのパラメータを評価して特徴付けを定量化してもよい。 [0019] In one embodiment, the characterization module calculates an acoustic breathing marker from the subject and an event within the subject by calculating a mathematical model that approximates at least a portion of the monitored acoustic signal. Further characterize the relationship between. The characterization module may also evaluate the parameters of the mathematical model to quantify the characterization.
[0020]音響呼吸マーカは、これらに限定されないが、喘鳴、咳、いびき、クラックル及び胸音振幅を示す信号を含む群から選択されてもよい。事象は、これらに限定されないが、逆流事象、無呼吸の開始又は終了、人工呼吸器における設定の変更、姿勢変化、及び治療薬の投与又は措置を含む群から選択されてもよい。 [0020] The acoustic breathing marker may be selected from the group including, but not limited to, signals indicative of wheezing, coughing, snoring, crackle and chest sound amplitude. The event may be selected from the group including, but not limited to, a reflux event, the start or end of apnea, a change in settings on the ventilator, a posture change, and the administration or treatment of a therapeutic agent.
[0021]本明細書において言及しているすべての刊行物、特許、及び特許出願は、各個々の刊行物、特許又は特許出願が参照により組み込まれるものとして具体的に個別に指示されていたものと同じ範囲まで、参照により本明細書に援用される。 [0021] All publications, patents, and patent applications mentioned in this specification are specifically and individually designated as if each individual publication, patent or patent application was incorporated by reference. To the same extent as is incorporated herein by reference.
[0022]本発明の新規の特徴を、添付の特許請求の範囲において特に記載する。本発明の原理が利用される例示的な実施形態を記載する以下の詳細な説明、及び添付の図面を参照することによって、本発明の特徴及び利点がより良好に理解される。 [0022] The novel features of the invention are set forth with particularity in the appended claims. A better understanding of the features and advantages of the present invention will be obtained by reference to the following detailed description that sets forth illustrative embodiments, in which the principles of the invention are utilized, and the accompanying drawings of which:
[0032]最初に図1を参照すると、流れ図は、たとえば生理学的事象と1つ又は複数の音響呼吸マーカ(ARM)との間の関係を特徴付けるための方法のステップを示す。ステップ101において、被検者の呼吸器系から発した音響信号(101a)が、被検者又は患者からの少なくとも1つの生理学的パラメータ(101b)と同時に監視される。1つ又は複数の監視されるパラメータは、任意の生理学的、病態生理学的、治療的、心理学的又は他のパラメータであってもよく、監視される期間の間、対象の事象を識別することができる。たとえば、食道内pHの生理学的パラメータが監視されてもよい(たとえば図2参照)。
[0032] Referring initially to FIG. 1, a flow diagram illustrates the steps of a method for characterizing a relationship between, for example, a physiological event and one or more acoustic respiratory markers (ARMs). In
[0033]ステップ102において、監視されるパラメータにおいて事象が識別される。事象は、たとえば、生理学的事象、病態生理学的事象又は治療的事象であってもよい。事象は、たとえば、監視される期間にわたって監視されるパラメータを考慮している医療従業者によって手作業で識別されてもよい。事象はまた、患者、又は別の医療介護提供者によって監視されてもよい。代替的に、事象は、たとえば、監視されるパラメータを表す信号を受信して、その信号内の事象を識別するように(ハードウェア又はソフトウェア内で)プログラムされているコンピュータプロセッサによって自動的に識別されてもよい。自動化事象識別は、事前設定の閾値を超える(又は代替的に下回る)パラメータ値を識別することを含んでもよい。代替的に、事象を示す、監視されるパラメータのパターン(たとえば、被検者の椅子又はベッド内の圧力センサによって検出されるような、座位から背臥位への姿勢の変化)の検出が使用されてもよい。事象を自動的に識別する他の手法は、患者による症状(たとえば、疼痛緩和の開始、呼吸困難の開始)についての表示、又は患者に対するパータベーション(perturbation)の開始(たとえば、胸部理学療法の開始、静脈内投薬又は気管の抜管/挿管の始まり)についての医療専門家による表示を含む。
[0033] In
[0034]ステップ103において、監視される期間内の識別された事象のタイミングが求められ、ステップ104において、1つ又は複数のARMが、101aにおいて監視されている音響呼吸信号内で識別される。ARMは、事象の前の期間、及び事象の後の期間内に検出されてもよく、蓄積されてもよい。たとえば、音響マーカは、事象の10分前から事象の10分後まで蓄積されてもよいが、事象の前後の数秒程度の短い期間又は数時間程度の長い期間も企図される。事象が複数発生した場合、ARM値(又は割り当てられるスコア)は、事象の時刻に対する各マーカの相対的時刻に従って平均化することができる。
[0034] In
[0035]ARMの識別は、マーカを検出するようにハードウェア又はソフトウェア内でプログラムされているコンピュータプロセッサによって自動的又は半自動的に実行することができる。喘鳴、咳、クラックル、ロンカス及びいびきなどの不定呼吸音(有用なマーカをもたらす)を検出するための方法が、「Phonopneumograph System」と題する、Gavrielyに対して2001年7月17日に発行された米国特許第6,261,238号、及び「Phonopneumograph System」と題する、Gavrielyに対して2001年1月2日に発行された米国特許第6,168,568号に開示されている。決してこれらに限定されないが、既知の特性を有する音波信号を被検者の気道内に導入すること、及び信号が被検者の呼吸器系の少なくとも一部を通して伝わった後に信号を検出し、事象のタイミングに対する伝送した音波の伝達特性を計算することを含む、「Method and Appratus for Determining Conditions of Biological Tissues」と題する、Wilkinson他に対して2008年3月25日に発行された米国特許第7,347,824号に開示されている方法を含む、他の方法が企図されている。 [0035] ARM identification can be performed automatically or semi-automatically by a computer processor programmed in hardware or software to detect the marker. A method for detecting indeterminate breath sounds (resulting in useful markers) such as wheezing, coughing, crackles, roncas and snoring was published on July 17, 2001 for Gavory, entitled “Phonopneumograph System” U.S. Pat. No. 6,261,238 and U.S. Pat. No. 6,168,568, issued Jan. 2, 2001 to Gavriely, entitled “Phonopneumograph System”. In no way limited to these, the introduction of a sonic signal having known characteristics into the subject's respiratory tract, and the detection of the signal after the signal has been transmitted through at least a portion of the subject's respiratory system, the event US Pat. No. 7, issued March 25, 2008 to Wilkinson et al., Entitled “Method and Appratus for Determining Conditions of Biological Resources” Other methods are contemplated, including the method disclosed in 347,824.
[0036]1つ又は複数のARMは、監視される期間の間に取得されるデータセット全体、又は識別された事象の前及び/又は後の期間に対応するデータのサブセットのみを分析することによって識別することができる。ARMは、マーカの範囲に基づくスコアを与えられてもよく、又は(たとえば、ARMが胸音振幅である)固有値を有してもよい。1つ又は複数のARMを識別するための音響呼吸信号の分析は、事象のタイミングが求められる前、又は求められた後に実行されてもよい。後に実行される場合、事象が発生したデータウィンドウのみを分析することによって、効率化することができる。したがって、事象がない期間に対応する音響呼吸データのウィンドウはARMを検出するためには分析されない。ステップ105において、事象と1つ又は複数のARMとの間の時間的関係が特徴付けられる。特徴付けは、ARMの事象前範囲と事象後の期間内のARMの範囲とを比較することを含み得る。
[0036] One or more ARMs analyze the entire data set acquired during the monitored period, or only a subset of the data corresponding to the period before and / or after the identified event. Can be identified. The ARM may be given a score based on the range of the marker, or may have an eigenvalue (eg, ARM is a chest sound amplitude). Analysis of the acoustic respiratory signal to identify one or more ARMs may be performed before or after the timing of the event is determined. If performed later, it can be streamlined by analyzing only the data window in which the event occurred. Thus, the window of acoustic respiration data corresponding to a period of no event is not analyzed to detect ARM. In
[0037]ARMは、たとえば分布関数を使用したマーカの曲線適合又は数学的モデル化によって特徴付けることができる(ステップ106)。分布関数は、単一の事象を中心とした分布、又は複数の事象を中心とした分布の平均を表し得る。分布関数は、ヒストグラムプロットの形態で視覚的に表示することができ、音響マーカがそれらの発生の相対的時刻に従って分布する。この特徴付けから、定量的パラメータをステップ107において計算し、診断(108)及び/又はさらなる分析、臨床決定などに使用することができる。定量的パラメータは、分布関数を表す数学関数、事象の前及び/又は後の音響マーカの平均スコア、及び分布曲線の分散、歪度及び尖度などの分布関数の他の特性を使用してデータから導出することができる。
[0037] The ARM can be characterized, for example, by curve fitting or mathematical modeling of markers using a distribution function (step 106). A distribution function may represent a distribution centered on a single event or an average of distributions centered on multiple events. The distribution function can be displayed visually in the form of a histogram plot, with acoustic markers distributed according to the relative time of their occurrence. From this characterization, quantitative parameters can be calculated in
[0038]ここで、図2を参照すると、事象(上述のような)とARMとの間の関係を特徴付けるためのシステムの構成要素の概略図が示されている。トランスデューサT1及びT2の形態の音響監視装置は、被検者10の呼吸器系からの音響信号を監視することが可能である。音響信号は、被検者から発した不定音波、並びに/又は(たとえば、鼻/口を介して被検者の気道内に音波信号を導入することによって)被検者の呼吸器系に導入され、呼吸器系の少なくとも一部を通してT1及び/若しくはT2に伝送された音波信号成分を含み得る。アナログ/デジタル変換器216(A/D)からの信号は、トランスデューサT1及びT2に送信される前に事前処理212を受けることができる。 [0038] Referring now to FIG. 2, a schematic diagram of system components for characterizing the relationship between an event (as described above) and an ARM is shown. An acoustic monitoring device in the form of transducers T1 and T2 can monitor acoustic signals from the respiratory system of the subject 10. The acoustic signal is introduced into the subject's respiratory system and / or an indefinite sound wave emanating from the subject and / or (eg, by introducing a sonic signal into the subject's airway via the nose / mouth). May include sound wave signal components transmitted to T1 and / or T2 through at least a portion of the respiratory system. The signal from the analog / digital converter 216 (A / D) may be subjected to preprocessing 212 before being sent to the transducers T1 and T2.
[0039]パラメータ監視装置は、食道内pHトランスデューサPを使用してパラメータ、たとえば、食道内pHを監視することが可能である。監視装置からの信号は事前処理214を受けることができ、アナログ/デジタル変換器216(A/D)を介して、入力デバイス203及び表示デバイス204と通信しているプロセッサ202に入力される。プリンタ(図示せず)、及び他の電子周辺機器も設けてもよい。プロセッサは、監視されるパラメータを表す信号において1つ又は複数の事象の発生を識別するように構成されている識別モジュール210を含む。上記で示したように、事象(複数可)の識別は、データセット内の事象を識別するためにユーザが入力デバイス203を使用して手作業で実行してもよい。事象の識別は、ディスプレイ204を使用して、監視されるパラメータ値又は時刻ベースのグラフ表現を検討することによって行われてもよい。代替的に、事象の識別は、識別モジュール210によって、モジュールにプログラムされている選択規則に基づいて自動的に実行されてもよい。たとえば、モジュールは、逆流事象などのpH変化を自動的に識別するように予めプログラムされていてもよい。規則は、システム内に事前に設定されていてもよい。規則は、ユーザが入力デバイス203を介して追加又は変更することができることが好ましい。代替的に、規則は、監視される期間全体の統計的評価によって決定されてもよい。規則の決定は、監視される期間全体の特性に基づいて個々に決定される閾値を設定することによって行うことができ、たとえば、任意の時点における患者の心拍が99パーセンタイルを超えるか、又は1パーセンタイルを下回るときに発生するように、心拍閾値を設定してもよい。
[0039] The parameter monitoring device may use an intraesophageal pH transducer P to monitor a parameter, for example, the pH in the esophagus. Signals from the monitoring device can be subjected to pre-processing 214 and input to a
[0040]ARMモジュール220は、音響呼吸信号において1つ又は複数の音響マーカを位置特定するように構成されている。位置特定されたマーカ(複数可)は、識別された事象のタイミングと同時であり得るか、又は事象の前若しくは後にあり得る。場合によっては、呼吸マーカは、生理学的事象を含む一定期間にわたって持続することになる。したがって、マーカモジュールは、生理学的事象の前及び/又は後の短い間隔内のARMの範囲を決定することが好ましい。ARMの範囲を決定することによって、ARMの振幅、持続時間、周波数、数又はデューティサイクルのいずれか1つ又は組合せを評価することができる。他の定量的若しくは半定量的スコア又はスコアの組合せを使用してもよい。 [0040] The ARM module 220 is configured to locate one or more acoustic markers in the acoustic respiratory signal. The located marker (s) can be coincident with the timing of the identified event, or can be before or after the event. In some cases, the respiratory marker will persist for a period of time that includes a physiological event. Thus, the marker module preferably determines the range of the ARM within a short interval before and / or after the physiological event. By determining the ARM range, any one or combination of ARM amplitude, duration, frequency, number or duty cycle can be evaluated. Other quantitative or semi-quantitative scores or combinations of scores may be used.
[0041]特徴付けモジュール230は、事象(複数可)と1つ又は複数のARMとの間の関係をこれら2つの間の時間的関係を求めることによって特徴付ける。特徴付けモジュール230は、1つ又は複数の事象の発生と、音響信号において識別されるARMとの間の時間的関係を表す分布関数などの数学的モデルを推定することが好ましい。その後、数学的関係のパラメータを計算して関係を定量化することができる。数学的関係のパラメータを使用して、事象に関与する動態、たとえば、分布の第1の瞬間のタイミング、又は分布関数の変曲点のタイミングを客観的に評価することを行うことができる。
[0041] The
[0042]1つ又は複数のARMと生理学的事象との間の関係の特徴付けは、単一の事象の発生に基づいてもよい。しかしながら、同じタイプのいくつかの事象が識別されて事象データの集合が平均化された後に、関係が特徴付けられることが好ましい。たとえば、アルブテロール(気管支拡張薬)又はLasex(利尿薬)などの医薬の各投与の前、間及び後のARMが10日間の期間にわたって監視されてもよい。10日間の期間にわたって監視することによって、特徴付けの精度を改善することができる。ARMと生理学的事象との間の関係の特徴付けがそのような関係のグラフ表示に基づく場合、各短時間間隔内のARM発生の数学的モデル又は曲線適合を、特徴付けモジュールによって求めることができる。そのような数学的モデルは、たとえば、誤差関数若しくはシグモイド関数(ヒルの式)、又はガウス若しくはガンマ分布などの度数分布関数、又は多項式関数若しくは他の適切な数学関数に基づいてもよい。そのような数学的モデルは平均化されてもよい。 [0042] The characterization of the relationship between one or more ARMs and a physiological event may be based on the occurrence of a single event. However, the relationship is preferably characterized after several events of the same type have been identified and the collection of event data has been averaged. For example, the ARM before, during and after each administration of a drug such as albuterol (bronchodilator) or Laserx (diuretic) may be monitored over a period of 10 days. By monitoring over a 10 day period, the accuracy of the characterization can be improved. If the characterization of the relationship between the ARM and the physiological event is based on a graphical representation of such a relationship, a mathematical model or curve fit of the ARM occurrence within each short time interval can be determined by the characterization module. . Such a mathematical model may be based, for example, on an error function or sigmoid function (Hill's equation), or a frequency distribution function such as a Gaussian or gamma distribution, or a polynomial function or other suitable mathematical function. Such mathematical models may be averaged.
[0043]グラフ表現及び/又は数学的モデルから特定のパラメータを求めることは、たとえば、絶対的又は相対的な段階変化(たとえば、図3のΔWz%)を計算すること、生理学的事象の発生とARMにおける応答の開始との間の遅延(たとえば、図3のΔT)を求めること、病態生理学的事象後のARMの変化の動態を示す時定数(たとえば、図3のτ)を求めることを含んでもよい。代替的に/付加的に、事象の前又は後のARMを表す分布関数の特性を求めてもよい。そのような特性は、たとえば、分散(たとえば、図4のσ2)、歪度(たとえば、図4のγ1)又は尖度(たとえば、図4のγ2)、及び事象の前の曲線下の積分面積と事象の後の曲線下の積分面積との間の差を含んでもよい。 [0043] Determining specific parameters from the graphical representation and / or mathematical model may include, for example, calculating an absolute or relative step change (eg, ΔWz% in FIG. 3), occurrence of a physiological event, and Determining a delay (eg, ΔT in FIG. 3) between the start of the response in the ARM, and determining a time constant (eg, τ in FIG. 3) that indicates the kinetics of the change in the ARM after the pathophysiological event. But you can. Alternatively / additionally, a distribution function characteristic representing the ARM before or after the event may be determined. Such characteristics include, for example, variance (eg, σ 2 in FIG. 4), skewness (eg, γ 1 in FIG. 4) or kurtosis (eg, γ 2 in FIG. 4), and the curve before the event. And the integrated area under the curve after the event.
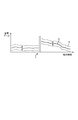
[0044]ここで、図3を参照すると、被検者の喘鳴率を時間の関数として表すグラフが示されている。喘鳴率(Wz%)は、所与の監視期間(たとえば、1分)における総呼吸時間に対する喘鳴時間のデューティサイクルとして計算される。気管支拡張薬の投与を含む事象がt1において示されている。曲線はyにおける喘鳴率データに適合され、yは、式1などの形態をとる指数方程式として表すことができる。
[0045]式1は指数関数を示し、式中、tは時刻(t=0が「応答時刻」、すなわち、喘鳴率に対して顕著な影響がある時刻)であり、正の値のみを有することができ、eは指数定数(「オイラーの数」)であり、A及びτは式の定数であり、yはデータフォーマット/呼吸マーカ値、この場合は喘鳴率である。曲線適合は、たとえば、最小二乗平均法など、当該技術分野において既知の任意の適切な方法を使用して行うことができる。
[0045]
[0046]この特徴付けから、いくつかの定量的パラメータを得ることができる。たとえば、事象Eと応答時刻(t=0)との間の時間差(ΔT)を使用して、発効するまでの時間を求めることができる。加えて、時定数(τ)、及び気管支拡張薬投与前と投与後との喘鳴率の差(ΔWz%)を使用して、被検者の応答の速さ及び措置の有効性をそれぞれ定量化することができる。 [0046] From this characterization, several quantitative parameters can be obtained. For example, a time difference (ΔT) between the event E and the response time (t = 0) can be used to determine the time until the effect takes effect. In addition, the time constant (τ) and the difference in wheezing rate before and after administration of bronchodilator (ΔWz%) are used to quantify the speed of response of the subject and the effectiveness of the measures, respectively. can do.
[0047]咳カウントを時間の関数として示したデータをプロットしたグラフ(図示せず)を参照して同様の例を考えてもよい。咳カウントは、監視される期間(たとえば、1分)内の咳の数として計算することができる。生理学的事象は、鎮咳薬の投与を含む。分布関数を、式1に示す指数方程式などの数学関数に対して曲線適合することができる。時間遅延ΔTの後、咳率は時定数に従って低減し、鎮咳薬投与の前と後との咳カウントの差を求めることができる。
[0047] A similar example may be considered with reference to a graph (not shown) plotting data showing cough count as a function of time. The cough count can be calculated as the number of coughs within a monitored period (eg, 1 minute). Physiological events include the administration of antitussives. The distribution function can be curve fitted to a mathematical function such as the exponential equation shown in
[0048]別の同様の例において、クラックルカウントを時間の関数としてグラフ(図示せず)に表すことができる。クラックルカウントは、監視される期間(たとえば、1分)内のクラックルの数として計算することができる。機械的に酸素供給されている患者に呼吸終末陽圧(PEEP)を加えることを含む事象が、治療的事象として識別される。再び、分布関数を、式1に示す指数などの数学関数に対して曲線適合することができる。この特徴付けから、治療の開始と応答の開始との間の時間遅延を示す時間差(ΔT)、応答の速さを示す時定数τ、及び治療の有効性を示す、PEEPの投与の前と後との咳カウントの差など、いくつかの定量的パラメータを得ることができる。
[0048] In another similar example, the crackle count can be represented graphically (not shown) as a function of time. The crackle count can be calculated as the number of crackles within a monitored period (eg, 1 minute). An event involving the application of positive end-tidal pressure (PEEP) to a mechanically oxygenated patient is identified as a therapeutic event. Again, the distribution function can be curve fit to a mathematical function such as the exponent shown in
[0049]さらに別の同様の例において、いびき率を時間の関数としてグラフに表すことができる。いびき率は、監視される期間(たとえば、1分)内のいびきの数として計算することができる。自発的に呼吸している患者にCPAPを加えることを含む治療的事象をグラフ上で識別することができ、分布関数を、式1に示す指数などの数学関数に対して曲線適合することができる。この特徴付けから、治療の開始と患者における応答の開始との間の遅延を示す時間遅延(ΔT)など、いくつかの定量的パラメータを得ることができる。時定数τは応答の速さを示し、CPAPの投与の前と後との咳カウントの差がいびきの改善(低減)の程度を示す。そのような方法は睡眠時無呼吸患者のCPAP措置の値を決定する上で有用である。
[0049] In yet another similar example, the snoring rate can be graphed as a function of time. The snoring rate can be calculated as the number of snores within a monitored period (eg, 1 minute). A therapeutic event involving the addition of CPAP to a spontaneously breathing patient can be identified on the graph, and the distribution function can be curve fit to a mathematical function such as the exponent shown in
[0050]ここで、時間の関数としての咳カウントグラフを示す図4を参照する。咳カウントは、監視される期間(たとえば、1分)内の咳の数として計算することができる。逆流事象を含む事象Rが示されている。分布関数を、ガウス分布などの数学関数(矢印のない破線で示す)に対して曲線適合することができる。加えて、分散(σ2)、歪度(γ1)、及び尖度(γ2)など、いくつかの定量的パラメータを得ることができる。 [0050] Reference is now made to FIG. 4, which shows a cough count graph as a function of time. The cough count can be calculated as the number of coughs within a monitored period (eg, 1 minute). Event R including a backflow event is shown. The distribution function can be curve-fitted to a mathematical function such as a Gaussian distribution (indicated by a dashed line without an arrow). In addition, several quantitative parameters can be obtained, such as variance (σ 2 ), skewness (γ 1 ), and kurtosis (γ 2 ).
[0051]分散は、事象Rの周りでグラフの値が変動する範囲を示す。分散(σ2)は、すべてのデータ点と事象データ点との間の距離の二乗の平均である。式2は分散の計算を示し、式中、σ2はグラフの分散であり、Nはグラフ内のデータ点の数であり、xiはデータ点iの値であり、x0は事象に対応するデータ点の値である。
[0052]グラフの歪度(γ1)は、事象データ点に関するグラフ内の非対称性のレベルに関連する。
[0053]式3は歪度の計算を示し、式中、γ1はグラフの歪度であり、Nはグラフ内のデータ点の数であり、σはグラフの分散(σ2)の平方根である、グラフの標準偏差であり、xiはデータ点iの値であり、x0は事象に対応するデータ点の値である。 [0053] Equation 3 shows the calculation of skewness, where γ 1 is the skewness of the graph, N is the number of data points in the graph, and σ is the square root of the variance (σ 2 ) of the graph. there, the standard deviation of the graph, x i is the value of the data points i, x 0 is the value of the data point corresponding to the event.
[0054]グラフの尖度(γ2)は、グラフ内で非常に小さい値又は非常に大きい値のいずれかが異常な割合で発生することに起因する、データの「尖り方」のレベルに関連する。
[0055]式4は尖度の計算を示し、式中、γ2はグラフの尖度であり、Nはグラフ内のデータ点の数であり、σはグラフの分散(σ2)の平方根である、グラフの標準偏差であり、xiはデータ点iの値であり、x0は事象に対応するデータ点の値である。 [0055] Equation 4 shows the calculation of kurtosis, where γ 2 is the kurtosis of the graph, N is the number of data points in the graph, and σ is the square root of the variance (σ 2 ) of the graph. there, the standard deviation of the graph, x i is the value of the data points i, x 0 is the value of the data point corresponding to the event.
[0056]図4に示す例において、グラフは「負の歪度」を有するように見える、すなわち、監視される期間全体を通じた咳の分布は、事象Rの前でより高い値に傾いている。このグラフは「咳によって誘発される逆流」に特有であり、咳が逆流事象につながる(また、引き起こす可能性がある)。 [0056] In the example shown in FIG. 4, the graph appears to have a “negative skewness”, ie, the distribution of cough throughout the monitored period is tilted to a higher value before event R . This graph is unique to “cough-induced reflux”, which leads to (and can cause) a reflux event.
[0057]ここで、時間の関数としての咳カウントグラフを示す図5を参照する。咳カウントは、監視される期間(たとえば、1分)内の咳の数として計算することができる。逆流事象を含む事象Rが示されている。分布関数を、ガウス分布などの数学関数(矢印のない破線で示す)に対して曲線適合することができる。加えて、分散(σ2)、歪度(γ1)、及び尖度(γ2)など、いくつかの定量的パラメータを得ることができる。分散は式2に示すように計算することができ、歪度は式3に示すように計算することができ、尖度は式4に示すように計算することができる。 [0057] Reference is now made to FIG. 5, which shows a cough count graph as a function of time. The cough count can be calculated as the number of coughs within a monitored period (eg, 1 minute). Event R including a backflow event is shown. The distribution function can be curve-fitted to a mathematical function such as a Gaussian distribution (indicated by a dashed line without an arrow). In addition, several quantitative parameters can be obtained, such as variance (σ 2 ), skewness (γ 1 ), and kurtosis (γ 2 ). The variance can be calculated as shown in Equation 2, the skewness can be calculated as shown in Equation 3, and the kurtosis can be calculated as shown in Equation 4.
[0058]図5に示す例において、グラフは「正の歪度」を有するように見える、すなわち、監視される期間全体を通じた咳の分布は、事象Rの後でより高い値に傾いている。このグラフは「逆流によって誘発される咳」に特有であり、逆流事象が咳の増加につながる(また、引き起こす可能性がある)。 [0058] In the example shown in FIG. 5, the graph appears to have a “positive skewness”, ie, the distribution of cough throughout the monitored period is tilted to a higher value after event R . This graph is unique to “reflux-induced cough”, where a reflux event leads to (and can also cause) an increase in cough.
[0059]ここで、時間の関数としての喘鳴率グラフを示す図6を参照する。喘鳴率(Wz%)は、監視される期間(たとえば、1分)における総呼吸時間に対する喘鳴時間のデューティサイクルとして計算される。識別される事象Rは、逆流事象を含む。分布関数を数学関数に対して曲線適合することができる。加えて、分散(σ2)及び歪度(γ1)など、いくつかの定量的パラメータを得ることができる。分散は式2に示すように計算することができ、歪度は式3に示すように計算することができる。
[0059] Reference is now made to FIG. 6, which shows a wheezing rate graph as a function of time. The wheezing rate (Wz%) is calculated as the duty cycle of the wheezing time relative to the total breathing time in the monitored period (
[0060]図6に示す例において、グラフは「正の歪度」を有するように見える、すなわち、監視される期間全体を通じた喘鳴の分布(喘鳴率によって示す)は、事象の後でより高い値に傾いている。このグラフは「逆流によって誘発される喘鳴」に特有であり、逆流事象が喘鳴率の上昇につながる(また、引き起こす可能性がある)。 [0060] In the example shown in FIG. 6, the graph appears to have a “positive skewness”, ie, the distribution of wheezing throughout the monitored period (indicated by wheezing rate) is higher after the event. Inclined to value. This graph is unique to “reflux-induced wheezing”, where a reflux event leads to (and can also cause) an increase in the rate of wheezing.
[0061]ここで、時間の関数としてのクラックルカウントグラフを示す図7を参照する。クラックルカウントは、監視される期間(たとえば、1分)内のクラックルの数として計算される。患者の姿勢の、直立から背臥位への変化を含む、事象Pが示されている。姿勢変化事象は、任意の適切な機構又は手段、たとえば、被検者とマットレスとの間に配置される圧力及び/又は温度センサを使用して識別することができる。分布関数を、たとえばヒルの式、誤差関数、及び多項式適合など、数学関数(破線で示す)に対して曲線適合することができる。 [0061] Reference is now made to FIG. 7, which shows a crackle count graph as a function of time. The crackle count is calculated as the number of crackles within a monitored period (eg, 1 minute). Event P is shown, including a change in patient posture from upright to supine position. Posture change events can be identified using any suitable mechanism or means, such as a pressure and / or temperature sensor disposed between the subject and the mattress. The distribution function can be curve fitted to mathematical functions (shown in dashed lines), such as Hill's formula, error function, and polynomial fit.
[0062]式5はヒルの式を示し、式中、tは時刻を表し(t=0が事象、この場合は姿勢変化の時刻)、正の値のみを有することができる。θは最大データの割合、この場合はグラフ内に現れるクラックルの最大量のうちのある割合であり、T50はデータが最大値の50%である時刻であり、nは、ARMの変化の鋭さを決定するヒルの式の指数である。mは比例定数である。
[0063]式6は誤差関数を示し、式中、tは時刻を表す(曲線適合中にt=0が決定される)。πは「パイ」定数であり、eは指数定数であり、yはデータフォーマット、この場合はクラックルカウントであり、kは積分の変数である。
[0064]ここで、時間の関数としてのクラックルカウントグラフを示す図8を参照する。クラックルカウントは、監視される期間(たとえば、1分)内のクラックルの数として計算される。利尿薬の投与を含む事象Dが示されている。分布関数を、たとえばヒルの式、誤差関数、及び多項式適合など、数学関数(破線で示す)に対して曲線適合することができる。ヒルの式は式5に示されており、誤差関数は式6に示されている。 [0064] Reference is now made to FIG. 8, which shows a crackle count graph as a function of time. The crackle count is calculated as the number of crackles within a monitored period (eg, 1 minute). Event D involving the administration of a diuretic is shown. The distribution function can be curve fitted to mathematical functions (shown in dashed lines), such as Hill's formula, error function, and polynomial fit. Hill's equation is shown in Equation 5, and the error function is shown in Equation 6.
[0065]ここで、複数の事象をどのように単一のプロット上に表示することができるかを示す、図9を参照する。事象R、この場合は逆流事象はグラフの中央に示されており、一方で音響マーカは「相対時間」軸上に事象の周りにマッピングされ、このマッピングは線形又は対数であり得る。音響マーカの例は、いくつか挙げると、喘鳴率、咳カウント、クラックルカウント及びいびき率を含んでもよい。音響マーカの値を72において実線として配置及び表示し、誤差間隔を74において示している。これらの誤差間隔は、音響マーカの標準偏差を表し得る。 [0065] Reference is now made to FIG. 9, which shows how multiple events can be displayed on a single plot. Event R, in this case a backflow event, is shown in the middle of the graph, while acoustic markers are mapped around the event on the “relative time” axis, and this mapping can be linear or logarithmic. Examples of acoustic markers may include wheezing rate, cough count, crackle count, and snoring rate, to name a few. The value of the acoustic marker is arranged and displayed as a solid line at 72 and the error interval is shown at 74. These error intervals may represent the standard deviation of the acoustic marker.
[0066]本開示は、一連の事象内で、被験者の状態に関する診断情報をもたらすことができる、音響マーカと、たとえば病態生理学的事象との間の相関関係を認識するための方法を提供する。さまざま実施形態が定量的分析を容易にする。 [0066] The present disclosure provides a method for recognizing a correlation between an acoustic marker and, for example, a pathophysiological event, that can provide diagnostic information regarding a subject's condition within a series of events. Various embodiments facilitate quantitative analysis.
[0067]たとえば、喘息患者は、聴診によって検出される喘鳴の減少によって判定される、ベントリンなどの気管支拡張薬に対する肯定的な反応を示し得る。喘鳴の減少は、気道閉塞の可逆性を示す。しかしながら、本発明以前は、この肯定的な反応の定量的な動態を究明することは実行可能でなかった。同様に、従来技術では、たとえば逆流事象とARMとの間の随時の、又は少なくとも一時的な関連性を究明するための方法、装置若しくはシステムを提供することはできなかった。同様に、たとえば、生理学的、病態生理学的及び治療的事象と肺音との間の他の時間的相関関係は、定量的、客観的方法によって特徴付けられてこなかった。 [0067] For example, asthmatic patients may exhibit a positive response to bronchodilators such as bentrin as determined by a reduction in wheezing detected by auscultation. Reduction in wheezing indicates reversibility of airway obstruction. However, prior to the present invention, it was not feasible to investigate the quantitative kinetics of this positive response. Similarly, the prior art has not been able to provide a method, apparatus or system for investigating the occasional, or at least temporary, relationship between a reflux event and an ARM, for example. Similarly, other temporal correlations between, for example, physiological, pathophysiological and therapeutic events and lung sounds have not been characterized by quantitative, objective methods.
[0068]本開示は、ARMと、被検者内で自然に発生するか、又は意図的に誘発されるかのいずれかである他の事象との間の時間的相関関係を識別し、任意選択的に定量化するための新規の手法を提供する。この新規の手法は、患者又は被検者の状態を積極的に診断するために、生理学的事象の間の因果関係を識別し、できれば定量化することが必要である医術において利点を有する。代替的に又は付加的に、この新規の手法は、定量化可能で反復可能な方法で医学的介入の有効性の評価における有用性をもたらすことができる。 [0068] This disclosure identifies temporal correlations between ARM and other events that either occur naturally in the subject or are intentionally triggered, and Provides a novel technique for selective quantification. This novel approach has advantages in medical procedures where it is necessary to identify and possibly quantify causal relationships between physiological events in order to proactively diagnose the patient or subject's condition. Alternatively or additionally, this novel approach can provide utility in assessing the effectiveness of medical interventions in a quantifiable and repeatable manner.
[0069]たとえば、逆流事象が平均して喘鳴又は咳が発生する前に起こっていることが分かれば、逆流事象によってぜん息が誘発されたという診断を導くことができる。一方、喘鳴又は咳が主に逆流事象の前に起こっている場合、ぜん息によって逆流が誘発されたと診断される可能性が高い。これらの状態は完全に異なる措置を必要とする。したがって、本開示を利用して逆流事象と呼吸マーカとの間の関係の性質を特徴付け、さらにより望ましくはその関係を定量化することが意義深く、重要である。 [0069] For example, knowing that a reflux event on average occurs before a wheezing or cough occurs can lead to a diagnosis that asthma was triggered by the reflux event. On the other hand, if wheezing or cough occurs mainly before a reflux event, it is likely that the reflux is triggered by asthma. These conditions require completely different measures. Therefore, it is meaningful and important to use this disclosure to characterize the nature of the relationship between reflux events and respiratory markers, and even more desirably to quantify the relationship.
[0070]別の例において、患者の姿勢が背臥位から直立に移行することによって、患者のクラックルカウントが肺を根本として緩やかに減少しているか否かを判定する能力を利用して、患者がうっ血性心疾患(正の重力効果)又は肺炎/肺線維症(負の重力効果)を患っているかを評価することができる。これらの状態の各々は完全に異なる措置を必要とする。 [0070] In another example, the patient takes advantage of the ability to determine whether the patient's crackle count is gradually decreasing from the lungs by shifting the patient's posture from supine to erect. Can be assessed whether it suffers from congestive heart disease (positive gravity effect) or pneumonia / pulmonary fibrosis (negative gravity effect). Each of these conditions requires completely different measures.
[0071]別の例において、アルブテロール又はアトロベント(アトロピン)などの薬剤の投与が喘鳴及び咳の時間的分布に影響を与えるか否かを判定する能力を利用して、喘鳴が認められる気道狭窄が可逆的であり(肯定的な結果)、定義上ぜん息であることを検証することができる。そうではなく、効果がない場合(否定的な反応)、ぜん息でない閉塞性気道疾患(たとえば、COPD、細気管支炎など)が診断される可能性がある。 [0071] In another example, the ability to determine whether the administration of a drug such as albuterol or atrovent (atropine) affects the temporal distribution of wheezing and cough, may cause airway stenosis with wheezing It can be verified that it is reversible (positive result) and by definition asthma. Otherwise, if ineffective (negative response), non-asthmatic obstructive airway diseases (eg, COPD, bronchiolitis, etc.) may be diagnosed.
[0072]別の例において、本開示は、高張食塩水又はカプサイシンなどの小用量の気道刺激物を吸入することで単回又は複数回の咳嗽発作が誘発されているか否かを判定するのに使用されてもよい。次にこの判定を使用して、患者が、特定の措置を必要とする慢性咳の傾向にあるか否かを判定することができる。 [0072] In another example, the present disclosure provides for determining whether inhaling a small dose of airway irritants such as hypertonic saline or capsaicin has induced one or more cough attacks. May be used. This determination can then be used to determine whether the patient is prone to chronic cough that requires specific measures.
[0073]本明細書に添付の特許請求の範囲において定義されている本発明の範囲から逸脱することなく、前述の部分にさまざまな変更、追加及び/又は改変を行うことができることは理解されたい。本願を基本とし、又は本願からの優先権を主張する将来の特許出願がオーストラリア又は海外において提出され得る。以下の仮の特許請求の範囲は、例としてのみ提供され、いかなるそのような将来の特許出願において特許請求され得るものの範囲を限定することも意図されていないことは理解されたい。1つ又は複数の発明をさらに定義又は再定義するように、後日、仮の特許請求の範囲に特徴を追加する、又は仮の特許請求の範囲から特徴を省く場合がある。
[0073] It should be understood that various changes, additions and / or modifications can be made to the foregoing parts without departing from the scope of the invention as defined in the claims appended hereto. . Future patent applications based on this application or claiming priority from this application may be filed in Australia or abroad. It is to be understood that the following provisional claims are provided by way of example only and are not intended to limit the scope of what may be claimed in any such future patent application. At a later date, features may be added to the provisional claims or may be omitted from the provisional claims to further define or redefine the invention or inventions.
Claims (20)
(a)前記被検者の呼吸器系からの音響信号と、前記被検者に関連付けられる生理学的パラメータ、病態生理学的パラメータ、患者報告症状及び治療的パラメータを含む群から選択される少なくとも1つのパラメータとを同時に監視するステップと、
(c)前記監視されるパラメータ(複数可)において前記事象を識別するステップと、
(d)前記監視される音響信号において、前記事象と同時に、並びに/又は前記事象の前及び/若しくは前記事象の後に起こる1つ又は複数の呼吸マーカの存在を識別するステップと、
を含み、
前記関係は、前記事象と前記1つ又は複数の音響呼吸マーカとの間の時間的相関関係を求めることによって特徴付けられる、方法。 A method for characterizing a temporal relationship between an acoustic respiratory marker and an event in a subject comprising:
(A) at least one selected from the group comprising an acoustic signal from the subject's respiratory system and physiological parameters, pathophysiological parameters, patient-reported symptoms and therapeutic parameters associated with the subject; Monitoring parameters simultaneously;
(C) identifying the event in the monitored parameter (s);
(D) identifying in the monitored acoustic signal the presence of one or more respiratory markers that occur simultaneously with and / or before and / or after the event;
Including
The method wherein the relationship is characterized by determining a temporal correlation between the event and the one or more acoustic respiratory markers.
(a)関係
を使用して求められる時定数τ、
(b)関係
を使用して求められるような分散σ2、
(c)関係
を使用して求められるような歪度γ1、
(d)関係
を使用して求められるような尖度γ2、及び
(e)関係
を使用して求められるようなヒルの式の指数n
のうちの1つ又は複数を使用して、多項式の関係又は係数を特徴付ける方法であって、上記関係において、yは呼吸マーカ値であり、
A及びτは定数であり、
Nは音響信号データ点の数であり、
σは標準偏差であり、
xiはデータ点iの値であり、
x0は事象に対応する前記データ点の値であり、
θは最大データのうちの割合であり、
T50はデータが最大値の50%である時刻であり、
tは時刻であり、
nは呼吸マーカの変化の鋭さを表す指数であり、
mは比例定数である、
方法。 The following:
(A) Relationship
The time constant τ obtained using
(B) Relationship
Variance σ 2 , as determined using
(C) Relationship
Skewness γ 1 as determined using
(D) Relationship
Kurtosis γ 2 as determined using, and (e) relationship
The index n of Hill's formula as found using
A method of characterizing a polynomial relationship or coefficient using one or more of: wherein y is a respiratory marker value;
A and τ are constants,
N is the number of acoustic signal data points,
σ is the standard deviation,
x i is the value of data point i,
x 0 is the value of the data point corresponding to the event;
θ is the percentage of maximum data,
T 50 is the time when the data is 50% of the maximum value,
t is the time,
n is an index representing the sharpness of the change in the respiratory marker,
m is a proportionality constant,
Method.
(a)前記被検者の呼吸器系からの音響信号を監視するための音響監視手段と、
(b)前記被検者及び患者報告症状に関連付けられる生理学的パラメータ、病態生理学的パラメータ、治療的パラメータを含む群から選択されるパラメータを監視するためのパラメータ監視手段と、
(c)処理手段であって、
(i)前記監視されるパラメータ(複数可)において前記事象の発生を識別する識別モジュールと、
(ii)前記事象と同時に、並びに/又は前記事象の前及び/若しくは前記事象の後に起こる前記音響呼吸信号において1つ又は複数の音響マーカを位置特定するマーカモジュールと、
(iii)前記事象と前記1つ又は複数の音響呼吸マーカとの間の時間的相関関係を求めることによって前記関係を特徴付けるように構成されている特徴付けモジュールと
を組み込んでいる、処理手段と、
を備える、システム。 A system for characterizing a relationship between an acoustic respiratory marker from a subject and an event within the subject,
(A) acoustic monitoring means for monitoring acoustic signals from the subject's respiratory system;
(B) parameter monitoring means for monitoring parameters selected from the group comprising physiological parameters, pathophysiological parameters, therapeutic parameters associated with the subject and patient reported symptoms;
(C) a processing means,
(I) an identification module that identifies the occurrence of the event in the monitored parameter (s);
(Ii) a marker module for locating one or more acoustic markers in the acoustic respiratory signal that occurs simultaneously with and / or before and / or after the event;
(Iii) a processing means incorporating a characterization module configured to characterize the relationship by determining a temporal correlation between the event and the one or more acoustic respiratory markers. ,
A system comprising:
A system for characterizing a relationship between an acoustic marker from a subject and an event occurring in or affecting the subject, substantially as shown in the accompanying drawings And a system having the elements described above with reference to any one of the embodiments illustrated herein.
Applications Claiming Priority (3)
| Application Number | Priority Date | Filing Date | Title |
|---|---|---|---|
| AU2011903164 | 2011-08-08 | ||
| AU2011903164A AU2011903164A0 (en) | 2011-08-08 | Event sequencing using acoustic respiratory markers | |
| PCT/IL2012/050294 WO2013021383A1 (en) | 2011-08-08 | 2012-08-07 | Event sequencing using acoustic respiratory markers and methods |
Publications (2)
| Publication Number | Publication Date |
|---|---|
| JP2014526926A true JP2014526926A (en) | 2014-10-09 |
| JP2014526926A5 JP2014526926A5 (en) | 2015-09-17 |
Family
ID=47667956
Family Applications (1)
| Application Number | Title | Priority Date | Filing Date |
|---|---|---|---|
| JP2014524483A Pending JP2014526926A (en) | 2011-08-08 | 2012-08-07 | Event sequencing and method using acoustic breathing markers |
Country Status (8)
| Country | Link |
|---|---|
| US (1) | US20150011840A1 (en) |
| EP (1) | EP2741665A4 (en) |
| JP (1) | JP2014526926A (en) |
| KR (1) | KR20140077150A (en) |
| CN (1) | CN103997962A (en) |
| AU (1) | AU2012293278B2 (en) |
| HK (1) | HK1201137A1 (en) |
| WO (1) | WO2013021383A1 (en) |
Families Citing this family (11)
| Publication number | Priority date | Publication date | Assignee | Title |
|---|---|---|---|---|
| US20060243280A1 (en) | 2005-04-27 | 2006-11-02 | Caro Richard G | Method of determining lung condition indicators |
| WO2006117780A2 (en) | 2005-04-29 | 2006-11-09 | Oren Gavriely | Cough detector |
| CN107847146B (en) * | 2015-07-21 | 2021-04-27 | 皇家飞利浦有限公司 | Method and system for automatically tagging activity on ECG data |
| US11717186B2 (en) | 2019-08-27 | 2023-08-08 | Medtronic, Inc. | Body stability measurement |
| US10750976B1 (en) * | 2019-10-21 | 2020-08-25 | Sonavi Labs, Inc. | Digital stethoscope for counting coughs, and applications thereof |
| US10709414B1 (en) | 2019-10-21 | 2020-07-14 | Sonavi Labs, Inc. | Predicting a respiratory event based on trend information, and applications thereof |
| US10702239B1 (en) | 2019-10-21 | 2020-07-07 | Sonavi Labs, Inc. | Predicting characteristics of a future respiratory event, and applications thereof |
| US10716534B1 (en) | 2019-10-21 | 2020-07-21 | Sonavi Labs, Inc. | Base station for a digital stethoscope, and applications thereof |
| US10709353B1 (en) | 2019-10-21 | 2020-07-14 | Sonavi Labs, Inc. | Detecting a respiratory abnormality using a convolution, and applications thereof |
| US11602313B2 (en) | 2020-07-28 | 2023-03-14 | Medtronic, Inc. | Determining a fall risk responsive to detecting body position movements |
| KR102445294B1 (en) | 2020-11-30 | 2022-09-20 | 한국전자기술연구원 | Respiratory disease diagnosis method and system based on vital signal including respiratory sound |
Citations (2)
| Publication number | Priority date | Publication date | Assignee | Title |
|---|---|---|---|---|
| JP2003530940A (en) * | 2000-04-20 | 2003-10-21 | パルモソニックス・プロプライエタリー・リミテッド | Method and apparatus for determining state of living tissue |
| JP2009060937A (en) * | 2007-09-04 | 2009-03-26 | Konica Minolta Medical & Graphic Inc | Biological signal analysis apparatus and program for biological signal analysis apparatus |
Family Cites Families (13)
| Publication number | Priority date | Publication date | Assignee | Title |
|---|---|---|---|---|
| US6168568B1 (en) * | 1996-10-04 | 2001-01-02 | Karmel Medical Acoustic Technologies Ltd. | Phonopneumograph system |
| US7127290B2 (en) | 1999-10-01 | 2006-10-24 | Cardiac Pacemakers, Inc. | Cardiac rhythm management systems and methods predicting congestive heart failure status |
| US7708697B2 (en) * | 2000-04-20 | 2010-05-04 | Pulmosonix Pty Ltd | Method and apparatus for determining conditions of biological tissues |
| US7079704B2 (en) * | 2002-06-26 | 2006-07-18 | Koninklijke Philips Electronics N.V. | Objective method and system for estimating perceived image and video sharpness |
| WO2004035137A1 (en) * | 2002-10-21 | 2004-04-29 | Noam Gavriely | Acoustic cardiac assessment |
| US20050096557A1 (en) * | 2003-01-08 | 2005-05-05 | Frederick Vosburgh | Noninvasive cardiovascular monitoring methods and devices |
| CN1299635C (en) * | 2003-11-19 | 2007-02-14 | 叶学强 | Method and apparatus for integrated multi-parameter detecting and treating |
| US20070118054A1 (en) * | 2005-11-01 | 2007-05-24 | Earlysense Ltd. | Methods and systems for monitoring patients for clinical episodes |
| CN101087559B (en) * | 2004-12-23 | 2011-03-30 | 雷斯梅德有限公司 | Method for detecting and discriminating breathing patterns from respiratory signals |
| ATE492875T1 (en) * | 2005-06-24 | 2011-01-15 | Univ Monash | VOICE ANALYSIS SYSTEM |
| CN1723839A (en) * | 2005-07-21 | 2006-01-25 | 高春平 | Method and device for testing health-index of individualized and three-D type |
| CN100418468C (en) * | 2006-01-20 | 2008-09-17 | 浙江工业大学 | Constrain-free, imperceptible sleep disorder measuring device and its method |
| CA2654095C (en) * | 2006-06-01 | 2015-12-22 | Biancamed Ltd. | Apparatus, system, and method for monitoring physiological signs |
-
2012
- 2012-08-07 WO PCT/IL2012/050294 patent/WO2013021383A1/en active Application Filing
- 2012-08-07 KR KR1020147006284A patent/KR20140077150A/en not_active Application Discontinuation
- 2012-08-07 JP JP2014524483A patent/JP2014526926A/en active Pending
- 2012-08-07 CN CN201280049375.6A patent/CN103997962A/en active Pending
- 2012-08-07 US US14/236,644 patent/US20150011840A1/en not_active Abandoned
- 2012-08-07 EP EP12822937.4A patent/EP2741665A4/en not_active Withdrawn
- 2012-08-07 AU AU2012293278A patent/AU2012293278B2/en not_active Ceased
-
2015
- 2015-02-18 HK HK15101796.7A patent/HK1201137A1/en unknown
Patent Citations (2)
| Publication number | Priority date | Publication date | Assignee | Title |
|---|---|---|---|---|
| JP2003530940A (en) * | 2000-04-20 | 2003-10-21 | パルモソニックス・プロプライエタリー・リミテッド | Method and apparatus for determining state of living tissue |
| JP2009060937A (en) * | 2007-09-04 | 2009-03-26 | Konica Minolta Medical & Graphic Inc | Biological signal analysis apparatus and program for biological signal analysis apparatus |
Also Published As
| Publication number | Publication date |
|---|---|
| KR20140077150A (en) | 2014-06-23 |
| AU2012293278A1 (en) | 2014-02-20 |
| EP2741665A1 (en) | 2014-06-18 |
| AU2012293278B2 (en) | 2017-03-16 |
| US20150011840A1 (en) | 2015-01-08 |
| CN103997962A (en) | 2014-08-20 |
| EP2741665A4 (en) | 2015-07-22 |
| HK1201137A1 (en) | 2015-08-28 |
| WO2013021383A1 (en) | 2013-02-14 |
Similar Documents
| Publication | Publication Date | Title |
|---|---|---|
| JP2014526926A (en) | Event sequencing and method using acoustic breathing markers | |
| US11191912B2 (en) | Methods and apparatus for detecting and treating respiratory insufficiency | |
| JP6564318B2 (en) | A system for evaluating real-time lung mechanics | |
| JP5053083B2 (en) | Method and apparatus for non-invasive prediction of positive end expiratory pressure (PEEPi) in a patient receiving ventilator support | |
| JP5944899B2 (en) | Device for monitoring respiratory variability by measuring respiratory volume, movement, and changes | |
| EP2584966B1 (en) | Method and system for sleep disturbance analysis | |
| JP5961116B2 (en) | System and method for obtaining an objective measure of dyspnea | |
| EP2806932A1 (en) | Discrimination of cheyne-stokes breathing patterns | |
| JP2007536026A (en) | A method to assess airway variability in airway hyperresponsiveness | |
| US10004452B2 (en) | System and methods for estimating respiratory airflow | |
| JP2014526926A5 (en) | ||
| JP2017516567A (en) | Method, system and software for evaluating extubation failure | |
| US20130102855A1 (en) | Bode index measurement | |
| CN210903016U (en) | Device for evaluating airflow limitation of subject | |
| Glazova et al. | A method and algorithm for remote monitoring of patients in asthma | |
| EP2819577A1 (en) | Tissue to end tidal co2 monitor | |
| CN110975085A (en) | Device and method for assessing efficacy of airway clearance treatment |
Legal Events
| Date | Code | Title | Description |
|---|---|---|---|
| A521 | Written amendment |
Free format text: JAPANESE INTERMEDIATE CODE: A523 Effective date: 20150729 |
|
| A621 | Written request for application examination |
Free format text: JAPANESE INTERMEDIATE CODE: A621 Effective date: 20150729 |
|
| A977 | Report on retrieval |
Free format text: JAPANESE INTERMEDIATE CODE: A971007 Effective date: 20160629 |
|
| A131 | Notification of reasons for refusal |
Free format text: JAPANESE INTERMEDIATE CODE: A131 Effective date: 20160712 |
|
| A02 | Decision of refusal |
Free format text: JAPANESE INTERMEDIATE CODE: A02 Effective date: 20170228 |