JP2014525028A - Method and system for spectral unmixing of tissue images - Google Patents
Method and system for spectral unmixing of tissue images Download PDFInfo
- Publication number
- JP2014525028A JP2014525028A JP2014508819A JP2014508819A JP2014525028A JP 2014525028 A JP2014525028 A JP 2014525028A JP 2014508819 A JP2014508819 A JP 2014508819A JP 2014508819 A JP2014508819 A JP 2014508819A JP 2014525028 A JP2014525028 A JP 2014525028A
- Authority
- JP
- Japan
- Prior art keywords
- distribution
- image
- spectral
- light
- species
- Prior art date
- Legal status (The legal status is an assumption and is not a legal conclusion. Google has not performed a legal analysis and makes no representation as to the accuracy of the status listed.)
- Pending
Links
Images


Classifications
-
- G—PHYSICS
- G06—COMPUTING; CALCULATING OR COUNTING
- G06V—IMAGE OR VIDEO RECOGNITION OR UNDERSTANDING
- G06V20/00—Scenes; Scene-specific elements
- G06V20/60—Type of objects
- G06V20/69—Microscopic objects, e.g. biological cells or cellular parts
- G06V20/695—Preprocessing, e.g. image segmentation
-
- G—PHYSICS
- G02—OPTICS
- G02B—OPTICAL ELEMENTS, SYSTEMS OR APPARATUS
- G02B21/00—Microscopes
- G02B21/36—Microscopes arranged for photographic purposes or projection purposes or digital imaging or video purposes including associated control and data processing arrangements
- G02B21/361—Optical details, e.g. image relay to the camera or image sensor
-
- G—PHYSICS
- G06—COMPUTING; CALCULATING OR COUNTING
- G06V—IMAGE OR VIDEO RECOGNITION OR UNDERSTANDING
- G06V10/00—Arrangements for image or video recognition or understanding
- G06V10/40—Extraction of image or video features
- G06V10/58—Extraction of image or video features relating to hyperspectral data
Abstract
生体組織と共役された量子ドットなどの蛍光種のスペクトル多重分離のための方法およびシステム。多重分離の処理は、量子ドットの推定されるスペクトルの曲線適合、および、典型的な量子ドットに対するそのような適合曲線のパラメータを説明する信頼区間に基づく非線形回帰を必然的に含む。
【選択図】図3Methods and systems for spectral demultiplexing of fluorescent species such as quantum dots conjugated to biological tissue. The demultiplexing process necessarily includes a curve fit of the estimated spectrum of the quantum dots and a non-linear regression based on confidence intervals describing the parameters of such a fit curve for a typical quantum dot.
[Selection] Figure 3
Description
本発明は、マルチスペクトル画像のスペクトル分解に関し、より詳細には、量子ドットを用いてマーキングされた生体試料を特徴付ける画像化データの非線形回帰に関しており、この非線形回帰は、量子ドット、およびこれらの量子ドットを用いてマーキングされた組織の成分の個々のスペクトルシグネチャを識別することを考慮したものである。 The present invention relates to spectral decomposition of multispectral images, and more particularly to non-linear regression of imaging data characterizing biological samples marked with quantum dots, which non-linear regression includes quantum dots and their quantum. Considering the identification of individual spectral signatures of tissue components marked with dots.
量子ドット(QD)は、半導体のナノ結晶構造であり、その電子特性は、個々の半導体結晶の大きさおよび形状と密接に関係がある。量子ドットのエネルギースペクトルは、幾何学的な大きさ、形状、および閉じ込めポテンシャルの強度を制御することによって量子閉じ込め効果を規定することにより操作され得る。したがって、QDの直接的に結果として得られる光学的特徴はその呈色であり、同じ材料の、ただし異なる大きさのQDは、異なる色の光を放出し得る。QDの呈色は、QDのエネルギー準位と直接関係がある。一般にはQDが大きいほど、その蛍光スペクトルはより赤色(より低いエネルギー)になる。逆により小さなQDは、より青色(より高いエネルギー)の光を放出する。研究者は、トランジスタ、太陽電池、LED、およびダイオードレーザにおいてQDを研究し、医用画像化用の作用物質として、特にバイオセンシング用途用の蛍光標識として量子ドットを使用することを試みてきた。 Quantum dots (QDs) are semiconductor nanocrystal structures whose electronic properties are closely related to the size and shape of individual semiconductor crystals. The energy spectrum of a quantum dot can be manipulated by defining the quantum confinement effect by controlling the geometric size, shape, and strength of the confinement potential. Thus, the direct optical result of QD is its coloration, and QDs of the same material but of different sizes can emit light of different colors. The coloration of QD is directly related to the energy level of QD. In general, the larger the QD, the more red the fluorescence spectrum (lower energy). Conversely, smaller QDs emit more blue (higher energy) light. Researchers have studied QDs in transistors, solar cells, LEDs, and diode lasers, and have attempted to use quantum dots as agents for medical imaging, particularly as fluorescent labels for biosensing applications.
現代の生物学的分析では、様々な種類の有機色素が使用される。しかしながら年を追うごとに、これらの色素のより高い操作上の柔軟性が必要とされてきており、従来の色素は期待に添うことが不可能であることが多い。 In modern biological analysis, various types of organic dyes are used. However, each year, more and more operational flexibility of these dyes is required, and conventional dyes are often unable to meet expectations.
この目的に対してQDが、その役割を急速に務めつつある可能性があり、いくつかの論点に関して従来の有機色素より優れていることが見出されており、最も直接的に明白であるそれらの論点のうちの2つが、(蛍光色素に匹敵する量子収率とともに高い吸光係数に起因する)より狭い蛍光帯域幅および輝度、ならびに安定性である。生体組織のターゲティングに対してQDを使用する試みが行われてきた。そのようなターゲティングを実施するためにQDは、組織の選定された一部分に選択的に結合するように組織特異的結合部位を伴って機能化されることが多い。例えばQDは、蛍光分光法を使用する生体組織成分の検出用の無機蛍光体として使用され得る。ここではQDは、組織分子の成分として使用され得るものであり、その成分によってこの分子が、対応する型の組織成分を具体的に識別するような形で蛍光を発するようになる。程なく組織試料のQD固有の蛍光を検出することにより、組織の生体構造および/または組織成分の場所に関して結論が得られ得る。 For this purpose, QD may be rapidly playing its role and has been found to be superior to conventional organic dyes on several issues, most directly evident Two of the issues are narrower fluorescence bandwidth and brightness (due to higher extinction coefficients with quantum yields comparable to fluorescent dyes) and stability. Attempts have been made to use QD for biological tissue targeting. To perform such targeting, QDs are often functionalized with tissue-specific binding sites to selectively bind to selected portions of tissue. For example, QD can be used as an inorganic phosphor for the detection of biological tissue components using fluorescence spectroscopy. Here, QD can be used as a component of a tissue molecule, which causes the molecule to fluoresce in a way that specifically identifies the corresponding type of tissue component. Shortly by detecting the QD intrinsic fluorescence of the tissue sample, a conclusion can be drawn regarding the location of tissue anatomy and / or tissue components.
しかしながらいくつかの蛍光種を用いてマーキングされた組織の蛍光の検出は、いくつかの未解決の問題を引き起こす。問題の1つは光学的位置合わせの問題点であり、この問題点は、光学検出器の表面での、組織の成分に選択的に結合された複数の蛍光体により放出される波面の空間的な重なりから生じる。この空間的な重なりは、空間的に入り組んだマルチスペクトル画像をもたらし、物体空間での組織の境界内部の所与の成分の物理的場所を満足のゆくように識別するために、組織の結果として得られる画像のスペクトル分解を必要とする。 However, the detection of fluorescence in tissues marked with several fluorescent species causes several unresolved problems. One problem is that of optical alignment, which is the spatial problem of the wavefront emitted by multiple phosphors selectively coupled to tissue components at the surface of the optical detector. Arising from the overlap. This spatial overlap results in a spatially intricate multispectral image and as a result of the tissue to satisfactorily identify the physical location of a given component within the tissue boundary in object space. Requires spectral decomposition of the resulting image.
蛍光体の個々のスペクトル寄与を分離するために、従来の多重化された蛍光顕微鏡法では、一方では広帯域の蛍光体色素および慎重に選択された光学フィルタを、ならびに他方では線形アンミキシング・スペクトル・アルゴリズムを用いてきた。フィルタに基づく方法は、スペクトルの相互干渉および不十分な標本化に起因する接近して重なるスペクトルシグネチャを定量的に区別するそれらの方法の能力が乏しいことが知られている。信号分離のために線形アンミキシング・アルゴリズムを使用することは、フィルタに基づく取得により引き起こされる標本化の不足に対処可能であるが、基準スペクトルの慎重な選択を必要とする。実際には線形アンミキシング・アルゴリズムが最適に動作するために、高い精度で選択された基準スペクトルまたは(自己蛍光などの)低いアーチファクトの条件のいずれかが必要とされる。しかしながら動作パラメータの大きな変動および許容差が存在する現実の用途では、線形アンミキシング・アルゴリズムの変換の精度および安定性は急速に低下する。 In order to separate the individual spectral contributions of the phosphors, conventional multiplexed fluorescence microscopy uses broadband phosphor dyes and carefully selected optical filters on the one hand, and linear unmixing spectrum on the other hand. An algorithm has been used. Filter-based methods are known to be poor in their ability to quantitatively distinguish between closely overlapping spectral signatures due to spectral mutual interference and poor sampling. Using a linear unmixing algorithm for signal separation can address the lack of sampling caused by filter-based acquisition, but requires careful selection of the reference spectrum. In practice, in order for a linear unmixing algorithm to work optimally, either a highly accurate selected reference spectrum or a low artifact condition (such as autofluorescence) is required. However, in real applications where there are large variations and tolerances in operating parameters, the conversion accuracy and stability of the linear unmixing algorithm rapidly degrades.
したがって、異なるQDが対応する組織成分に選択的に結合される組織のマルチスペクトル画像の信頼性の高いスペクトル分解、および、QD固有の組織成分を画定する組織画像を向上した精度によって生出することが可能な、装置および方法を提供することが所望されている。 Thus, reliable spectral decomposition of tissue multispectral images in which different QDs are selectively combined with corresponding tissue components, and tissue images defining QD-specific tissue components can be generated with improved accuracy. It would be desirable to provide possible apparatus and methods.
本発明の実施形態は、生体試料を画像化するための装置を考慮したものである。装置の1つの実施形態は、生体試料から取得される画像化データもしくはそのような試料の画像のいずれか、または両方を受け取るようになされ、試料が、光源が試料に位置する状態で照光される入力を含む。特定の実施形態では生体試料の受け取られる画像は、対応する複数の離散スペクトル帯域で取得された複数のスペクトル的に離散的な画像を表すマルチスペクトル画像を含む。光源からの光は平均波長により特徴付けられ、そのスペクトル強度は統計分布により説明される。装置は、入力から画像化データもしくは画像のいずれか、または両方を受け取るように、受け取られた画像化データまたは画像に関連するスペクトルデータを非線形回帰するように、かつ、光源の平均波長での生体試料の目標画像を表すデータを発生させるようになされる処理装置をさらに含む。特定の実装形態では装置は、処理装置に動作可能に接続され、生体試料の目標画像を表示するように構成される表示装置をさらに含む。表示装置は、目標画像上に重畳される光源の画像を表示するように追加的に構成され得る。特定の実施形態では試料での光源の場所は、光源と生体試料の個別の成分との間の親和性により規定される。関係する実施形態では、試料は複数の光源を用いて照光され、その場合処理装置は、画像化データを、必然的に含まれる光源の各々のスペクトル分布に対する統計的近似の組み合わせを表す関数にこれらのデータを適合させることにより非線形回帰するように、かつ、そのような統計分布に対応する信頼区間に関して回帰の結果を評価するようになされる。 Embodiments of the present invention consider an apparatus for imaging a biological sample. One embodiment of the apparatus is adapted to receive either or both imaging data obtained from a biological sample, an image of such a sample, and the sample is illuminated with a light source positioned on the sample. Contains input. In certain embodiments, the received image of the biological sample includes a multi-spectral image representing a plurality of spectrally discrete images acquired in a corresponding plurality of discrete spectral bands. The light from the light source is characterized by an average wavelength and its spectral intensity is explained by a statistical distribution. The apparatus is adapted to nonlinearly regress the received imaging data or spectral data associated with the image to receive either imaging data or images, or both from the input, and the biological at the average wavelength of the light source. Further included is a processing device adapted to generate data representative of the target image of the sample. In certain implementations, the device further includes a display device operatively connected to the processing device and configured to display a target image of the biological sample. The display device may additionally be configured to display an image of the light source superimposed on the target image. In certain embodiments, the location of the light source in the sample is defined by the affinity between the light source and the individual components of the biological sample. In a related embodiment, the sample is illuminated using a plurality of light sources, in which case the processing unit inevitably converts the imaging data into a function that represents a combination of statistical approximations to the spectral distribution of each of the included light sources. By fitting the data, a non-linear regression is performed, and a regression result is evaluated with respect to a confidence interval corresponding to such a statistical distribution.
本発明の実施形態は、病理画像を変換するための方法をさらに考慮したものであり、その方法は少なくとも、(i)上に蛍光種が配設される前記組織試料の画像の組を受け取って、組織試料を表す光強度のスペクトル分布を取得するステップ、ならびに、(ii)特定の場合では目標スペクトルデータおよびデータ信頼区間により規定される、目標スペクトル帯域での組織画像を表す光強度の目標分布を導出するように、少なくとも非線形回帰、およびこの蛍光種により規定されるデータ信頼区間に基づいて強度の取得されたスペクトル分布を修正するステップを含む。1つの実施形態では目標スペクトル帯域は、ガウス分布、逆ガウス分布、指数関数的に修飾されたガウス分布、ガンマ分布、逆ガンマ分布、対数分布、t分布、カイ二乗分布、f分布、指数分布、ラプラス分布、レイリー分布、ロジスティック分布、マクスウェル分布、ベータ分布、コーシー分布、パレート分布、レヴィ分布、極値分布、ワイブル分布、およびガンベル分布などの統計分布のうちの少なくとも1つにより規定される。 Embodiments of the present invention further consider a method for transforming a pathological image, the method receiving at least a set of images of the tissue sample on which fluorescent species are disposed on (i). Obtaining a spectral distribution of light intensity representative of the tissue sample, and (ii) a target distribution of light intensity representative of the tissue image in the target spectral band, which in certain cases is defined by the target spectral data and the data confidence interval To at least nonlinear regression and modifying the acquired spectral distribution of intensities based on a data confidence interval defined by the fluorescent species. In one embodiment, the target spectral band is Gaussian distribution, inverse Gaussian distribution, exponentially modified Gaussian distribution, gamma distribution, inverse gamma distribution, logarithmic distribution, t distribution, chi-square distribution, f distribution, exponential distribution, It is defined by at least one of statistical distributions such as Laplace distribution, Rayleigh distribution, logistic distribution, Maxwell distribution, beta distribution, Cauchy distribution, Pareto distribution, Levy distribution, extreme value distribution, Weibull distribution, and Gumbel distribution.
代替的または追加的に方法は、光強度の目標分布を、前記蛍光種により放出される光に対する組織試料の光学応答の視覚的に知覚可能な表現に対応付けするステップを含む。特定の実施形態では組織試料の光学応答は、蛍光種により放出される光の反射を表し、画像の受け取られる組は、複数の離散スペクトル帯域で取得された2次元画像を含む。1つの実施形態では対応付けするステップの処理は、目標分布をオフセットして、背景雑音の強度がないオフセット光強度分布を導出するステップを必然的に含む。1つの実施形態ではオフセットするステップは、データ配列の要素に光強度の目標分布の値を割り当てるステップ、データ配列の非ゼロの要素の平均値を決定するステップ、および、前記平均値より低い値を包含するデータ配列の要素をゼロにするステップを必然的に含む。オフセットするステップの処理は、次数1の十字行列(cross−matrix)の使用を必然的に含む処理を追加的に含み得る。 Alternatively or additionally, the method includes associating a target distribution of light intensity with a visually perceptible representation of the optical response of a tissue sample to light emitted by the fluorescent species. In certain embodiments, the optical response of the tissue sample represents a reflection of light emitted by the fluorescent species, and the received set of images includes a two-dimensional image acquired in multiple discrete spectral bands. In one embodiment, the process of associating necessarily includes offsetting the target distribution to derive an offset light intensity distribution that is free of background noise. In one embodiment, the offsetting step comprises assigning a value of a target distribution of light intensity to elements of the data array, determining an average value of non-zero elements of the data array, and lowering the average value. Naturally includes zeroing the elements of the containing data array. The processing of the offset step may additionally include processing that necessarily involves the use of a cross-matrix of order one.
代替的または追加的に方法のある実施形態は、前記蛍光種を前記組織試料の表面と共役させ、会合が前記組織試料の材料構造を表すステップを必然的に含む。代替的または追加的には画像の組を受け取るステップは、上に他の蛍光種を有する組織試料の超立方体画像を受け取るステップを含む。1つの実施形態では強度の取得されたスペクトル分布を修正するステップは、組織試料と共役された蛍光種の推定される蛍光スペクトルの線形重ね合わせを規定する適合関数への、取得されたスペクトル分布の非線形回帰を含む。特定の実施形態では非線形回帰は、推定される蛍光スペクトルを規定するパラメータのうちの少なくともいくつかが、データ信頼区間の範囲内に固定されることを確実にすることにより実行される。 Alternative or additional embodiments of the method necessarily include the step of conjugating the fluorescent species with the surface of the tissue sample and the association representing the material structure of the tissue sample. Alternatively or additionally, receiving the set of images includes receiving a hypercube image of a tissue sample having other fluorescent species thereon. In one embodiment, the step of modifying the acquired spectral distribution of intensity comprises the step of adapting the acquired spectral distribution to a fitting function that defines a linear superposition of the estimated fluorescent spectra of the fluorescent species conjugated with the tissue sample. Includes nonlinear regression. In certain embodiments, non-linear regression is performed by ensuring that at least some of the parameters defining the estimated fluorescence spectrum are fixed within the data confidence interval.
加えて本発明の実施形態は、生体試料を画像化するための計算機システム上で使用するための計算機プログラム製品を提供する。そのような計算機プログラム製品は、計算機可読プログラムコードを有する計算機使用可能有形媒体を包含し、計算機可読プログラムコードは、計算機システム内にロードされるときに計算機システムで実装される装置を確立し、その装置は、(i)生体試料の画像を表す画像データ配列を受け取るように構成され、前記画像の各々が、物体領域内の複数の光源から光学システムを通る画像領域への光によって照光される生体試料を画像化することにより、それぞれ対応する離散スペクトル帯域で取得されている入力、および、(ii)受け取られた画像データ配列のうちの少なくとも1つを、選定された対応する平均波長での生体試料の慣用画像(accustomed image)を表す、少なくとも1つの慣用画像データ配列に変換するようになされる処理装置を含む。 In addition, embodiments of the present invention provide a computer program product for use on a computer system for imaging a biological sample. Such a computer program product includes a computer usable tangible medium having computer readable program code, which establishes a device implemented in the computer system when loaded into the computer system, and The apparatus is configured to receive (i) an image data array representing an image of a biological sample, each of the images being illuminated by light from a plurality of light sources in the object region to the image region through the optical system. By imaging the sample, each of the inputs acquired in the corresponding discrete spectral bands, and (ii) at least one of the received image data arrays is selected from the living body at the selected corresponding average wavelength. Convert to at least one conventional image data array that represents an accumulative image of the sample It includes a processing apparatus made in so that.
試料を照光する光源の各々は、対応する平均波長を有する。少なくとも1つの光源は、多色性であり得るとともに、統計分布により説明されるスペクトルを有し得る。1つの実施形態では入力は、試料に配設される光源によって照光される試料を画像化することにより取得されている画像を表す画像データの組を受け取るように構成される。 Each of the light sources that illuminate the sample has a corresponding average wavelength. The at least one light source can be pleochroic and have a spectrum described by a statistical distribution. In one embodiment, the input is configured to receive a set of image data representing an image that has been acquired by imaging the sample illuminated by a light source disposed on the sample.
1つの実施形態では処理装置は、受け取られたデータ画像配列から、画像領域の所定の一部分の全域で強度のスペクトル分布を決定することにより、および、強度の決定されたスペクトル分布を非線形回帰して、複数の光源から光源のスペクトル分布を表す回帰されたパラメータを導出することにより、少なくとも1つの画像データ配列の変換を容易にする。特定の実施形態では計算機システムで実装される装置は、取得された画像および慣用画像のうちの少なくとも1つを表示するように構成されるグラフィカル出力を追加的に含む。処理装置は、画像領域の全域で、複数の光源から目標光源の目標強度の分布を表すデータ配列を生成すること、および、このデータ配列の要素を、要素に対応する目標強度の値がデータ配列の非ゼロの値の平均未満であるならばゼロに設定することにより、受け取られた画像データ配列のうちの少なくとも1つを変換するように追加的になされ得る。 In one embodiment, the processing device performs non-linear regression on the determined spectral distribution of the intensity by determining the spectral distribution of intensity across a predetermined portion of the image region from the received data image array. Deriving a regressed parameter representing the spectral distribution of the light source from a plurality of light sources to facilitate conversion of at least one image data array. In certain embodiments, an apparatus implemented with a computer system additionally includes a graphical output configured to display at least one of an acquired image and a conventional image. The processing device generates a data array representing a distribution of target intensity of the target light source from a plurality of light sources over the entire image area, and the elements of the data array have a target intensity value corresponding to the element as the data array. An additional can be made to convert at least one of the received image data arrays by setting it to zero if it is less than the average of the non-zero values.
本発明の実施形態は、生体試料を画像化するためのシステムを追加的に提供し、そのシステムは、光学システムと、光学システムと動作可能に通信する計算機処理装置と、有形計算機可読記憶媒体とを含む。光学システムは、(i)生体試料と合体させられた少なくとも1つの光源を包含する生体試料からの光を受け取るように構成される入力、(ii)少なくとも1つの光学軸に沿って入力と光学的に連通する出力、(iii)前記入力と前記出力との間の少なくとも1つの光学軸に沿って配設され、複数のスペクトル帯域幅内の光を処理して、前記複数のスペクトル帯域幅に対応する複数の画像形成信号を形成するように構成されるスペクトル的に選択的なシステム、および、(iv)複数のスペクトル帯域幅に対応する複数の画像形成信号を出力から受け取るように、かつ、これらの信号に基づいて複数の画像を形成するように構成される検出器を含む。 Embodiments of the present invention additionally provide a system for imaging a biological sample, the system including an optical system, a computer processing device in operative communication with the optical system, and a tangible computer readable storage medium. including. The optical system includes (i) an input configured to receive light from the biological sample including at least one light source combined with the biological sample, and (ii) the input and optical along at least one optical axis. (Iii) disposed along at least one optical axis between the input and the output, and processes light within a plurality of spectral bandwidths to accommodate the plurality of spectral bandwidths A spectrally selective system configured to form a plurality of imaging signals, and (iv) receiving a plurality of imaging signals corresponding to a plurality of spectral bandwidths from the output, and A detector configured to form a plurality of images based on the signals.
1つの実施形態では、試料での光源は例えば量子ドットなどの蛍光の発生源を含む。1つの実施形態では計算機処理装置は、光学システムの検出器と動作可能に接続される。1つの実施形態では有形非一時的記憶媒体は、組み込まれた計算機可読命令であり、計算機可読命令は、計算機処理装置上にロードされるときに処理装置に、生体試料を表す強度のスペクトル分布を複数の画像から導出させ、かつ、非線形回帰アルゴリズムを曲線適合方程式に適用させて、生体試料の全域で、試料と合体させられた光源の光の強度の分布を決定させる。生体試料に関連する2つ以上の光源が存在するとき、曲線適合方程式は、そのような複数の光源により放出される光のスペクトル分布の重ね合わせにより規定される。 In one embodiment, the light source at the sample includes a source of fluorescence, such as a quantum dot. In one embodiment, the computer processor is operatively connected to a detector of the optical system. In one embodiment, the tangible non-transitory storage medium is an embedded computer readable instruction that, when loaded onto the computer processor, causes the processor to display a spectral distribution of intensity representative of the biological sample. A non-linear regression algorithm is derived from a plurality of images and a non-linear regression algorithm is applied to the curve fitting equation to determine the distribution of the light intensity of the light source combined with the sample throughout the biological sample. When there are two or more light sources associated with a biological sample, the curve fitting equation is defined by the superposition of the spectral distributions of the light emitted by such multiple light sources.
本発明の実施形態は、量子ドット(QD)を使用して組織試料の生体構造を識別するための方法をさらに提供する。そのような方法は、組織試料から画像形成光を受け取り、その画像形成光がQD種により放出される光を含み、QD種が、組織試料の成分と、QD種と組織成分との間の所定の親和性によって共役されるステップ、および、複数のスペクトル帯域内の受け取られた画像形成光を分析して、この画像形成光の強度のスペクトル分布を決定するステップを包含する。方法は、パラメータ適合関数および前記パラメータ適合関数のパラメータを規定する信頼区間を用いてQD種のスペクトル分布を推定するステップ、ならびに、前記QD種に対応するスペクトル帯域幅内の組織試料の成分の空間的位置を表す画像データを導出するステップを追加的に含む。特定のパラメータ関数は、統計分布関数を含む。 Embodiments of the present invention further provide a method for identifying the anatomy of a tissue sample using quantum dots (QD). Such a method includes receiving imaging light from a tissue sample, the imaging light including light emitted by the QD species, wherein the QD species is a component of the tissue sample and a predetermined between the QD species and the tissue component. And analyzing the received imaging light within a plurality of spectral bands to determine a spectral distribution of the intensity of the imaging light. The method includes estimating a spectral distribution of a QD species using a parameter fitting function and a confidence interval defining a parameter of the parameter fitting function, and a space of a component of a tissue sample within a spectral bandwidth corresponding to the QD species. The method additionally includes the step of deriving image data representing the target position. Specific parameter functions include statistical distribution functions.
1つの実施形態では方法は、導出された画像データ、およびQD種と組織試料の成分との間の所定の親和性に基づいて、組織試料の成分を特定するステップを追加的に含む。1つの実施形態では画像データの導出の処理は、QD種の推定されるスペクトル分布を非線形回帰して、信頼区間を満足するパラメータ適合関数の回帰されたパラメータを決定するステップを含む。関係する実施形態では導出の処理は、組織試料の画像を発生させるステップを含む。 In one embodiment, the method additionally includes identifying a tissue sample component based on the derived image data and a predetermined affinity between the QD species and the tissue sample component. In one embodiment, the process of deriving the image data includes performing a non-linear regression on the estimated spectral distribution of the QD type to determine a regressed parameter of the parameter fitting function that satisfies the confidence interval. In a related embodiment, the derivation process includes generating an image of the tissue sample.
本発明は、図面と連関する以下の発明を実施するための形態を参照することにより、より完全に理解されよう。 The invention will be more fully understood by reference to the following detailed description, taken in conjunction with the drawings, in which:
以下で明細書では、付随する図面を参照して本発明の実施形態の説明を提供する。図面では可能であればどこでも、同じ参照番号および標識が、同じまたは類似する構成要素または要素を表す。しかしながら同様の構成要素または要素が、異なる番号および標識を用いて表される場合もあることが理解されよう。 In the following description, embodiments of the invention are provided with reference to the accompanying drawings. Wherever possible in the drawings, the same reference numbers and signs represent the same or similar components or elements. However, it will be understood that similar components or elements may be represented using different numbers and labels.
本明細書の全体を通して「1つの実施形態」、「ある実施形態」、または同様の文言に対する言及は、言及される実施形態に関して説明される個別の特徴、構造、または特性が、本発明の少なくとも1つの実施形態に含まれることを示唆する。したがって、本明細書の全体を通して使用される語句「1つの実施形態で」、「ある実施形態で」、および同様の用語は、必ずではないが、すべてが同じ実施形態を表す場合がある。さらに、本明細書で説明される本発明の様々な実施形態の特徴、要素、構成要素、構造、詳細、または特性が、1つまたは複数の実施形態において任意の適した様式で組み合わされ得ることが理解されよう。特定の特徴、要素、構成要素、構造、詳細、もしくは特性のうちの1つもしくは複数を用いずに、または、他の方法、構成要素、材料等々を使用して、本発明が場合によっては実践され得ることを当業者であれば認めるであろう。したがって本発明のある実施形態の個別の詳細が、そのような実施形態を説明するどの図面にも示されるとは限らない場合があるが、図面にこの詳細が存在することは、説明の文脈において他の方法を必要としない限り示唆され得る。他の事例では、よく知られている構造、詳細、材料、または動作が、本発明のある実施形態の態様を不明瞭にすることを避けるために、所与の図面に示されない、または詳細に説明されない場合がある。 Throughout this specification, references to “one embodiment,” “an embodiment,” or similar language refer to individual features, structures, or characteristics described with respect to the referenced embodiment, at least Suggested to be included in one embodiment. Thus, the phrases “in one embodiment,” “in an embodiment,” and like terms used throughout this specification, although not necessarily, may all represent the same embodiment. Furthermore, the features, elements, components, structures, details, or characteristics of the various embodiments of the invention described herein can be combined in any suitable manner in one or more embodiments. Will be understood. The invention may be practiced in some cases without one or more of the specific features, elements, components, structures, details, or characteristics, or using other methods, components, materials, etc. Those skilled in the art will appreciate that this can be done. Thus, although individual details of an embodiment of the invention may not be shown in any drawing that describes such embodiment, the presence of this detail in the drawing is not intended in the context of the description. It may be suggested unless other methods are required. In other instances, well-known structures, details, materials, or operations are not shown in or are not shown in detail in order to avoid obscuring aspects of certain embodiments of the invention. It may not be explained.
含まれる概略的な流れ図の図は、全体的に論理流れ図の図として記載される。したがって論理流れの図示される順序および標識されるステップは、提示される方法の1つの実施形態を指し示すものである。機能、論理、または効果において、例示される方法の1つもしくは複数のステップまたはそれらの一部分と同等であり得る他のステップおよび方法が考え出される場合がある。加えて、用いられる形式および記号は、方法の論理ステップを解説するために与えられ、方法の範囲を限定しないと理解される。様々な矢印の型および線の型が流れ図の図で用いられる場合があるが、それらは対応する方法の範囲を限定しないと理解される。実際いくつかの矢印または他の結合子は、方法の論理流れのみを指し示すために使用され得る。例えば矢印は、図示される方法の列挙されるステップ間の不特定の継続時間の待機または監視の期間を指し示す場合がある。加えて個別の方法が行われる順序は、示される対応するステップの順序を厳重に固守する場合もあればそうでない場合もある。 The schematic flow diagram included is generally described as a logical flow diagram. Accordingly, the depicted order and labeled steps of the logic flow are indicative of one embodiment of the presented method. Other steps and methods may be devised that may be equivalent in function, logic, or effect to one or more steps of the illustrated method or portions thereof. In addition, the format and symbols used are provided to describe the logical steps of the method and are understood not to limit the scope of the method. While various arrow types and line types may be used in the flow diagram, it is understood that they do not limit the scope of the corresponding method. In fact, some arrows or other connectors can be used to indicate only the logic flow of the method. For example, an arrow may point to a period of unspecified duration waiting or monitoring between the listed steps of the illustrated method. In addition, the order in which the individual methods are performed may or may not strictly adhere to the order of the corresponding steps shown.
本発明によれば、生体組織のマルチスペクトル画像を処理するための方法および装置が開示され、この処理は、画像化の処理によって多重化されている複数のスペクトルシグネチャから、画像空間においてQDなどの蛍光体のスペクトルシグネチャを非線形分離することによる組織の一部分の空間的識別を考えに入れたものである。 In accordance with the present invention, a method and apparatus for processing a multi-spectral image of a biological tissue is disclosed, which process includes a plurality of spectral signatures multiplexed by an imaging process, such as QD in image space. It takes into account the spatial identification of a portion of tissue by nonlinearly separating the spectral signature of the phosphor.
QDは、QDをある特定の抗体またはプローブと共役させることにより、組織の標識付け病理検査において使用される。これらの抗体またはプローブは、関心のある特定の受容体、特にウイルスまたはがんと相互に関連がある受容体に結合する。標識付けの処理は、異なる波長で蛍光を発する複数のQDが使用されるという意味で、スペクトル的に多重化されることが多い。診断目的で結果として得られる組織を使用するために、次いで個々のQDを観視し、組織内部でのそれらの位置(複数可)を確認することが必要である。したがって、組織のマルチスペクトル画像から使用されるQDの光学応答をアンミックスする(または多重分離する、またはスペクトル的に分離する)ための方法が達成される必要がある。 QD is used in tissue labeling pathology by coupling QD with certain antibodies or probes. These antibodies or probes bind to specific receptors of interest, particularly those that are correlated with viruses or cancers. The labeling process is often spectrally multiplexed in the sense that multiple QDs that fluoresce at different wavelengths are used. In order to use the resulting tissue for diagnostic purposes, it is then necessary to look at the individual QDs and confirm their location (s) within the tissue. Therefore, a method for unmixing (or demultiplexing or spectrally separating) the optical responses of QDs used from multispectral images of tissue needs to be achieved.
本発明の実施形態によれば、そのようなスペクトル多重分離を実施するために、最初に組織の画像が、標識付けのために使用されるQDのスペクトル特性により規定されるスペクトル範囲に集合的に広がるスペクトル帯域で取得される。そのような画像が得られた後、推定されるQD強度分布関数の非線形回帰が、例えば画素単位を基礎としてさらに遂行され得る。非線形回帰は、使用されるQDを特徴付ける、推定されるスペクトル分布(スペクトルシグネチャ)の組み合わせを表す適合曲線を基礎として実行され得る。非線形回帰は、非負の値のみを包含する、使用されるQDの蛍光スペクトル分布のどれかに対して曲線適合を実現するためにさらに最適化され得る。本発明は、広い蛍光シグネチャ(例えば、多くの折にスペクトル的に重なり、検出される際に信号取得の相互干渉の原因となる最高50〜60nmの帯域幅)を有する従来の蛍光色素と比較して類のない、QDにより提示される画像化条件を活用する。特に本発明は、低次元での、したがって分析的に扱いやすい空間でのQDの関心の(10〜20nmの程度の)比較的狭いスペクトルシグネチャをパラメータ的に説明する能力を供与する。そのようなパラメータ的な説明および厳密な最小化条件によって、例えば生体組織を扱う際に共通であるスペクトル信号の変動などの変化する動作条件に対する、本発明の方法の高い水準の計算的な適応性および安定性が可能になる。適応性および安定性が増大された結果として、本発明のある実施形態を用いる全体的な測定システムの出力での信号対雑音比が、関係する技術のシステムと比較して高められる。例えば図10Aおよび10Bは、本発明のある実施形態による非線形方法を用いる、試料に存在する単一のQD種のスペクトルシグネチャのアンミキシングの結果を包含する画像(図10A)、および従来の線形回帰アルゴリズムを用いて得られた画像を表す。これらの画像間の比較によって、線形の型の回帰が使用されるときに誤って識別されるQD種に対応する視覚的に知覚可能なより高い水準の画像雑音が明確に例示される(例えば区域1002A、1002B内のアンミックスされた個々のQDの密度を、それぞれ対応する区域1004A、1004B内の密度と比較されたい)。追加的な例示として図11は、2つのQD種、QD565およびQD655(Life Technologies Corp.)を識別する線形アンミキシング処理手順の結果を表すスペクトル曲線1120を示す。しかしながらこの場合での正しい結果は、本発明の非線形アンミキシング・アルゴリズムが正しく識別した、スペクトル曲線1110により示されるような単一のQD種、QD585(Life Technologies Corp.)の識別である。
According to an embodiment of the invention, in order to perform such spectral demultiplexing, the tissue image is initially collected in a spectral range defined by the spectral characteristics of the QD used for labeling. Acquired in a broad spectrum band. After such an image is obtained, a non-linear regression of the estimated QD intensity distribution function can be further performed, for example on a pixel basis. Non-linear regression may be performed on the basis of a fitted curve that represents a combination of estimated spectral distributions (spectral signatures) that characterize the QD used. Non-linear regression can be further optimized to achieve a curve fit for any of the QD fluorescence spectral distributions used, including only non-negative values. The present invention is compared to conventional fluorescent dyes that have broad fluorescent signatures (eg, bandwidths up to 50-60 nm that spectrally overlap in many occasions and cause signal acquisition mutual interference when detected). Take advantage of the unique imaging conditions presented by QD. In particular, the present invention provides the ability to parametrically describe the relatively narrow spectral signatures (of the order of 10-20 nm) of QD in a low dimension and thus in an analytically manageable space. Due to such parametric explanations and strict minimization conditions, the high level of computational applicability of the method of the present invention to changing operating conditions such as, for example, fluctuations in spectral signals that are common when dealing with living tissue. And stability is possible. As a result of the increased adaptability and stability, the signal to noise ratio at the output of the overall measurement system using an embodiment of the present invention is enhanced compared to the related art system. For example, FIGS. 10A and 10B are images (FIG. 10A) containing the results of unmixing the spectral signature of a single QD species present in a sample using a non-linear method according to an embodiment of the present invention, and conventional linear regression Represents an image obtained using an algorithm. A comparison between these images clearly illustrates a visually perceptible higher level of image noise corresponding to a QD species that is misidentified when a linear type of regression is used (eg, area Compare the density of the individual unmixed QDs in 1002A, 1002B with the density in the corresponding
本発明は、マルチスペクトル画像化(MSI)システムまたは蛍光顕微鏡法システムなどの画像化システムとともに用いられ得る。一般にMSIは、画素水準での画像のスペクトル分布へのアクセスをもたらすことにより、病理標本の分析に対して、計算機化された顕微鏡に基づく画像化システムを用意する。種々のマルチスペクトル画像化システムが存在するが、これらのシステムのすべてに共通である動作態様は、マルチスペクトル画像を形成する性能である。マルチスペクトル画像は、特定の波長での、または電磁スペクトルの全域での特定のスペクトル帯域幅での画像データを捕捉する画像である。これらの波長は、例えば赤外部(IR)などの可視光範囲の範囲を超えた波長での電磁放射を含む所定のスペクトル成分を選択可能な、光学フィルタにより、または他の機器の使用により選び出され得る。 The present invention may be used with imaging systems such as multispectral imaging (MSI) systems or fluorescence microscopy systems. In general, MSI provides a computerized microscope-based imaging system for the analysis of pathological specimens by providing access to the spectral distribution of the image at the pixel level. There are a variety of multispectral imaging systems, but the mode of operation common to all of these systems is the ability to form multispectral images. A multispectral image is an image that captures image data at a specific wavelength or at a specific spectral bandwidth across the electromagnetic spectrum. These wavelengths are selected by optical filters or by the use of other equipment that can select certain spectral components including electromagnetic radiation at wavelengths beyond the visible light range, such as the infrared (IR) range. Can be done.
標本の画像の取得を容易にする2つの一般的な型のMSIシステムが、図1Aおよび1Bに概略的に例示される。図1Aは光学画像化システム104を含む装置100を示し、光学画像化システム104の一部分108は、所定の数Nの離散光学帯域を規定するように調節可能であるスペクトル的に選択的なシステムを包含する。光学システム104は、光学検出器116上に広帯域光源112を用いて透過状態で照光される組織試料110を画像化するようになされる。示されるように、1つの実施形態では例えば顕微鏡などの拡大システムを含み得る光学画像化システム104は、光学システム104の単一の光学出力122と全体的に空間的にそろえられた単一の光学軸120を有する。システム104は、スペクトル的に選択的なシステム108が、異なる離散スペクトル帯域で画像が取得されることを確実にするように、(例えば計算機処理装置126を用いて)調整または調節されている際に、組織110の一連の画像を形成する。装置100は、一連の取得された画像からの組織の少なくとも1つの視覚的に知覚可能な画像が中に現れる表示装置122を追加的に包含し得る。スペクトル的に選択的なシステム108は、光源112から試料110を通って検出器116に向かって透過させられる光のスペクトルから個別の通過帯域を、使用者の入力またはあらかじめプログラムされた処理装置126の指令のいずれかに応答して選択するようになされる、回折格子などの光学分散要素、薄膜干渉フィルタなどの光学フィルタの集合体、または任意の他のシステムを含み得る。
Two general types of MSI systems that facilitate acquisition of specimen images are schematically illustrated in FIGS. 1A and 1B. FIG. 1A shows an
いくつかのスペクトル帯域での多数のスペクトル的に離散的な光学画像を同時に入手するようになされる装置の代替的実装形態150が、図1Bに示される。ここではスペクトル的に選択的なシステム154が、N個の離散スペクトル帯域に対応するいくつかの光学出力を規定する。システム154は、光学システム158からの透過させられた光出力156を取り入れ、識別されるスペクトル帯域で検出器システム166上に、この識別されるスペクトル帯域に対応する光学経路に沿って試料110を画像化するような形で、N個の空間的に異なる光学経路162−1から162−Nに沿って、この光出力の少なくとも一部分を、空間的に方向を変える。別の代替的実装形態(示されない)で、実施形態100および150の特徴を組み合わせる場合があることが認識される。
An
本発明の実施形態によれば生体組織は、QDなどの蛍光種を用いて標識される。使用されるQDに対する2つの典型的なスペクトルが図2Aおよび2Bに示され、各々のスペクトルは、図2A、2Bの場合では次式のように一般には表現されるガウス分布である、対応する曲線適合とともに重ね書きされている。 According to embodiments of the present invention, biological tissue is labeled with a fluorescent species such as QD. Two typical spectra for the QD used are shown in FIGS. 2A and 2B, and each spectrum is a corresponding curve, which in the case of FIGS. 2A and 2B is a Gaussian distribution generally expressed as: Overwritten with conformance.

ここでλは波長であり、μは平均値であり、σは標準偏差であり、a2は非負の前指数である。図2A、2Bの強度分布を説明するパラメータの値が表1に示され、565nmの付近の光を放出するQD種はQD565と標識され、655nmの付近の光を放出するQD種はQD655と標識される。 Here, λ is a wavelength, μ is an average value, σ is a standard deviation, and a 2 is a non-negative front index. The values of the parameters that explain the intensity distributions of FIGS. 2A and 2B are shown in Table 1, QD species emitting light near 565 nm are labeled QD565, and QD species emitting light near 655 nm are labeled QD655. Is done.
より従来型のガウス振幅因子aの代わりに非負のa2を用いることにより、本発明の実施形態で使用されるガウス分布は、(QD光の強度分布の正値と相互に関連がある)正値を有する。これに対して、別の統計分布(例えば逆ガウス、指数関数的に修飾されたガウス、ガンマ分布、逆ガンマ分布、対数分布、t分布、カイ二乗分布、f分布、指数、ラプラス分布、レイリー分布、ロジスティック分布、マクスウェル分布、ベータ分布、コーシー分布、パレート分布、レヴィ分布、極値分布、ワイブル分布、およびガンベル分布)により密接に近似されるスペクトルプロファイルなどの、QDにより放出される光の他のスペクトルプロファイルが本発明の範囲内にあることが認識される。 By using a non-negative a 2 instead of the more conventional Gaussian amplitude factor a, the Gaussian distribution used in embodiments of the present invention is positive (correlated to the positive value of the intensity distribution of QD light). Has a value. On the other hand, another statistical distribution (for example, inverse Gaussian, exponentially modified Gaussian, gamma distribution, inverse gamma distribution, logarithmic distribution, t distribution, chi-square distribution, f distribution, exponent, Laplace distribution, Rayleigh distribution. Other distributions of light emitted by QDs, such as spectral profiles closely approximated by logistic distribution, Maxwell distribution, beta distribution, Cauchy distribution, Pareto distribution, Levy distribution, extreme value distribution, Weibull distribution, and Gumbel distribution) It will be appreciated that the spectral profile is within the scope of the present invention.
図3の流れ図に概略的に提示される本発明のある実施形態によれば、QDなどの光源を有する所与の生体組織が、例えば400nmから900nmなどの(以降は画像化スペクトル範囲と呼ばれる)画像化波長の範囲にわたって画像化されて、画像化波長に対応する個々のスペクトル帯域で入手される組織の複数の個々の画像を含む超立方体画像などのマルチスペクトル画像の組を発生させる。画像化は、上記で説明されたようなMSIシステムを用いることが可能である。ステップ310では、画像(複数可)が本発明の装置の入力で受け取られる。一般に、組織がMSIシステムを使用して画像化されている画像化波長は、個別のQDのスペクトルの(中心波長または平均波長などの)特性波長と必ずしも一致しないということが認識される。1つの実施形態では超立方体画像は、実質的に重ならないスペクトル帯域で入手されるスペクトル的に離散的な画像を含み得る。ステップ314では、結果として得られるマルチスペクトル超立方体画像から所与のQDのスペクトルシグネチャを分離するために、動的スペクトル範囲が随意に選択され得る。動的範囲は、画像化スペクトル範囲より狭い場合があり、好ましくは、所与の使用されるQD種の推定される蛍光スペクトルを含むスペクトル全範囲に対応する。例えば565nmの推定される平均波長を伴うQD(QD565と呼ばれるLife Technologies Corp.の製品)に対しては、約529nmと598nmとの間の動的スペクトル範囲が選定され得る。
According to one embodiment of the present invention schematically presented in the flow diagram of FIG. 3, a given biological tissue having a light source such as QD is, for example, 400 nm to 900 nm (hereinafter referred to as the imaging spectral range). Imaged over a range of imaging wavelengths to generate a set of multispectral images, such as a hypercube image that includes a plurality of individual images of tissue obtained in individual spectral bands corresponding to the imaging wavelength. Imaging can use an MSI system as described above. In
図3を参照して説明されるような以下の処理手続きのステップは、(完全な画像化スペクトル範囲内で入手される)完全な超立方体画像に関して、(選定された動的スペクトル範囲に対応する)超立方体画像の部分集合に関して、または画像の別の組もしくは部分集合に関して実行され得る。これらのステップは、画素単位を基礎としてスペクトルデータを処理することにより、または代替的には、隣接する画素の群にわたる画像強度の平均もしくは中央値のスペクトル分布を得ることにより1回で画素の集団に関して演算することにより遂行され得る。単一の画像の大きさは、光学検出設備機器の利用可能な性能に応じて使用者の裁量で選定され得るものであり、1つの実施形態では縦横が800および600の画素であり得る。 The steps of the following processing procedure as described with reference to FIG. 3 correspond to the selected dynamic spectral range (for the complete hypercube image (obtained within the complete imaging spectral range)). It can be performed on a subset of hypercube images or on another set or subset of images. These steps can be done by processing the spectral data on a pixel-by-pixel basis, or alternatively by obtaining an average or median spectral distribution of image intensity over a group of adjacent pixels at one time. Can be accomplished by computing on. The size of a single image can be selected at the discretion of the user depending on the available performance of the optical detection equipment, and in one embodiment can be 800 and 600 pixels in height and breadth.
ステップ316では、強度のスペクトル分布が、個々の画像の選定された組を分析することにより取得された画像から導出される。ステップ318では、強度の導出されたスペクトル分布が、例えば各々の画像データ点から、選定された波長範囲にわたって取得された強度の最小値を減算することにより基線補正される。基線補正の処理手順は、基線補正された画像データの発生をもって終結する。代替的には画像は、画像の点(x,y)での画像データにより規定されるような強度の値から、その画像点に対応する(1次以上の多項式により表現される)適合関数の値を減算することにより基線補正され得る。基線補正のためのさらに別の代替方法には、主成分分析(PCA)の使用、または、非常に大きな、例えば数十nmの標準偏差を有するガウス適合関数の使用がある。
In
ステップ322では、基線補正された画像の各々が、例えば使用されるQD種のスペクトルのパラメータ規定を使用する非線形回帰によりさらに分析される。例えばレーベンバーグ・マルカート・アルゴリズム(Levenberg−Marquardt algorithm)(LMA)が、関数のパラメータの空間にわたって一般には非線形の関数を最小化する問題に数値解を与えることが知られている。本発明の着想によれば、LMAなどの非線形回帰アルゴリズムは、画像化される組織試料に配設されるQDのスペクトルを規定する、推定されるパラメータ関数(例えば単一のQD種に対する(1)のガウス関数、または、組織上のいくつかのQD種に対するガウス分布もしくは他の統計分布の組み合わせ)と連関して使用され得る。例えば、画像化されている組織に関連する単一のQD種が存在するときの場合では、非線形LMAが、上記で述べられたような統計分布のうちの1つを規定するQDスペクトルに適合する関数と連関して使用され得る。比較して、画像化されている組織に関連する複数のQD種が存在するとき、LMAが、複数のQD種にそれぞれ対応する推定される蛍光スペクトルの重ね合わせを規定する適合関数と連関して使用され得る。図3の実施形態の以下の検討は、簡単のために組織に関連する単一のQD種を参照して提示される。
In
個別の基線補正された画像から導出される画像データの非線形回帰の目的は、個別のQD種に関連するスペクトル帯域での組織試料から発出する光強度の空間分布を表す目標データを生出することである。そのような非線形回帰の精度を向上させるために、目標データが所与のQD種を確信的に識別することを確実にするために、所与のQD種のスペクトルプロファイルを規定するために選定されるパラメータ関数にいくつかのパラメータ制約が課せられる場合がある。そのようなパラメータ制約は部分的には、使用されるQDの特質に、および非線形回帰を実行するために用いられる計算機処理装置の能力に左右される場合がある。典型的な可視光QD種は、ガウス関数により近似または適合される場合に、20nmほどの程度の半値半幅(HWHM)および約11…20nmのσ値により特徴付けられる光放出スペクトルを有することに留意されたい。これらの典型的な値は、QDの光強度分布を説明していると推定される個別のスペクトル分布が現実に即したものであるかどうかを判断し、そのことによってデータ処理手続きの間のパラメータ信頼区間を規定する際に指針として使用され得る。例えば本発明による非線形回帰アルゴリズムに課せられる典型的な制約は、目標分布を特徴付ける回帰されるパラメータがパラメータ信頼区間の範囲内にあるかどうかの評価を含み得る。例としてガウススペクトル分布を規定するQD種を使用する場合では、典型的なパラメータ制約(パラメータ区間またはパラメータ信頼区間とも互換的に呼ばれる)は、i)回帰される平均波長の値μregは+/−5nmの範囲内などの、その期待値の周囲の狭い範囲内にあること、ii)回帰される標準偏差の値σregは20nm未満であること、iii)R2値により特徴付けられる非線形回帰分析の品質は0.95より大きいこと、および、iv)非線形回帰の収束を実現するために必要とされる反復の数は15より小さいこと、を含み得る。これらのパラメータ区間は変動し得るものであり、市販で入手可能な蛍光種の典型的なパラメータに基づいて選定されることが理解される。 The purpose of non-linear regression of image data derived from individual baseline corrected images is to produce target data representing the spatial distribution of light intensity emanating from a tissue sample in the spectral band associated with the individual QD species. is there. To improve the accuracy of such non-linear regression, the target data is selected to define the spectral profile of a given QD species to ensure that the target data confidently identifies the given QD species. Some parameter functions may be subject to some parameter functions. Such parameter constraints may depend, in part, on the nature of the QD used and on the ability of the computer processor used to perform the non-linear regression. Note that a typical visible light QD species has a light emission spectrum characterized by a half width at half maximum (HWHM) on the order of 20 nm and a σ value of about 11 ... 20 nm when approximated or fitted by a Gaussian function. I want to be. These typical values determine whether the individual spectral distribution presumed to account for the light intensity distribution of the QD is realistic and thereby parameters during the data processing procedure. Can be used as a guideline in defining confidence intervals. For example, typical constraints imposed on the non-linear regression algorithm according to the present invention may include an evaluation of whether the regressed parameters characterizing the target distribution are within the parameter confidence interval. In the case of using a QD species defining a Gaussian spectral distribution as an example, typical parameter constraints (also referred to interchangeably as parameter intervals or parameter confidence intervals) are: i) the average wavelength value μ reg being regressed is + / Be within a narrow range around its expected value, such as in the range of −5 nm, ii) the standard deviation value σ reg to be regressed is less than 20 nm, iii) nonlinear regression characterized by R 2 values The quality of the analysis may include greater than 0.95 and iv) the number of iterations required to achieve the convergence of the non-linear regression is less than 15. It is understood that these parameter intervals can vary and are selected based on typical parameters of commercially available fluorescent species.
上記で述べられた非線形回帰に対する代替方法として、特定の異形の線形回帰手法が使用される場合がある。この場合、例としてQD光の推定されるスペクトル分布を説明するガウス適合関数を使用すると、そのようなガウス関数は、線形回帰処理が乗算項のみに対処することを可能にするために固定された平均および標準偏差の両方のパラメータを有するべきである。例えば線形回帰は、適合関数の非線形振幅に関して、その適合関数のすべての他のパラメータが固定されている状態で遂行され得る。関係する技術のアルゴリズムとは対照的に、非線形回帰は、QD種の異なる単位体により放出される光のスペクトル分布を規定するパラメータ間の必然的な統計的広がりを補償可能であることにもまた留意されたい。例えば、約565nmでの、指定された標準偏差値を伴う光を発生させると想定される所与の種QD565に関しては、どの個々のQDも、565nmとは幾分異なる平均波長での、または、スペクトル偏差の指定された値と正確には一致しない標準偏差を伴う光を発生させる場合がある。非線形回帰アルゴリズムは、QD種の個々の単位体のQD間のそのような統計的差に対して責任をもつ必要がない回帰を考えに入れたものである。特に回帰アルゴリズムの非線形の性質によって、個々のQDにより放出される光の強度を説明する非線形分布の(非負の振幅、平均波長、および標準偏差などの)パラメータでの偏差を、部分的には非線形回帰がこれらのパラメータのいずれかに関して実施されるので、補償することが可能になる。対照的に線形回帰手法は、非負の振幅に関してのみ進められ、QDのスペクトル特性での実際的な広がりを受け入れず、そのことによって回帰の精度は低減する。 As an alternative to the nonlinear regression described above, certain variant linear regression techniques may be used. In this case, using a Gaussian fitting function describing the estimated spectral distribution of the QD light as an example, such a Gaussian function was fixed to allow linear regression processing to handle only the multiplication term. It should have both mean and standard deviation parameters. For example, linear regression can be performed with respect to the nonlinear amplitude of the fitting function, with all other parameters of the fitting function fixed. In contrast to the related art algorithm, nonlinear regression can also compensate for the inevitable statistical spread between parameters defining the spectral distribution of light emitted by different units of the QD species. Please keep in mind. For example, for a given species QD565 assumed to generate light with a specified standard deviation value at about 565 nm, any individual QD is at an average wavelength somewhat different from 565 nm, or It may generate light with a standard deviation that does not exactly match the specified value of the spectral deviation. Nonlinear regression algorithms take into account regressions that do not have to be responsible for such statistical differences between the QDs of individual units of the QD species. In particular, due to the non-linear nature of the regression algorithm, deviations in parameters (such as non-negative amplitude, mean wavelength, and standard deviation) of non-linear distributions that account for the intensity of light emitted by individual QDs are partially Since the regression is performed on any of these parameters, it can be compensated. In contrast, the linear regression approach is advanced only for non-negative amplitudes and does not accept a practical spread in the spectral characteristics of the QD, thereby reducing the accuracy of the regression.
少なくともステップ310の入力マルチスペクトル画像、およびステップ322でQDを説明するデータにより規定されるパラメータ信頼区間に基づく強度の取得されたスペクトル分布の修正により生出される目標画像データによって、画像空間内の使用されるQD種をスペクトル的に分解または単離すること、および、組織試料の全域で、使用されるQD種により放出される光の分布を規定することが可能になる。
Use in the image space by at least the input multispectral image of
ステップ326では、これらの目標データが、以下のように目標画像配列にさらに対応付けされる。目標画像配列は、使用されるQDの目標スペクトル帯域に対応し、画像取得の間に所与のスペクトル帯域で入手される個々の画像と同一の広がりをもつ、すなわち同じ寸法を有する。回帰処理が進行する際に、目標画像配列の要素は、対応する画像画素に関連する目標データ点が選定された信頼区間を満足するならばa2に設定され、対応する目標データ点が信頼区間の外側であるならばゼロ値が割り当てられる。ステップ326のデータ対応付け処理手順に続いて、随意の後処理手続き330が遂行され得る。例えばステップ330Aでは、背景雑音を表す目標画像強度データを除去するために、目標画像配列の非ゼロの要素の平均より低いデータ値を包含する目標画像配列の要素がゼロに設定され得る。加えてステップ330Bでは、(画像の高い空間周波数成分を単離し、そのことによって個々のQDを識別するために)残留背景雑音があれば除去するために、および信号対雑音比(SNR)を上昇させるために画像オープニング処理が遂行され得る。行列により表されるような様々な型の数学的「開口」(例えば平円形開口または細隙開口)がこの目的で使用され得るが、1つの実施形態では、次数1の十字行列
In
が使用され得る。したがってステップ336では、洗練された目標画像配列が、対応する目標画像を形成するためにさらに使用され、その目標画像は、波長の回帰された平均値での光を放出するスペクトル的にアンミックスされた蛍光種(ここではQD)を表し、このアンミックスされたQD種により放出される光に対する組織試料の光学応答の視覚的に知覚可能な表現を提供し得る。最後にステップ340では、例えば電子監視装置などのグラフィカル出力装置で目標画像が表示され得る。追加的または代替的に、ステップ310の入力超立方体画像を構成する個々の画像のいずれかが、別々に、または組み合わせてのいずれかで、および目標画像との比較のために表示される場合もある。代替的には目標画像配列のデータは、デジタルまたはアナログなどの他の形態での将来の処理手続きまたは使用のために、記憶かつ/または提示される場合がある(示されない)。
Can be used. Thus, in
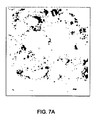
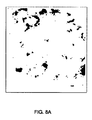
565nmで蛍光を発する単一のQD種(QD565)が結合された状態での前立腺組織の超立方体画像が、Applied Spectral Imaging(ASI、Migdal Ha’Emek、Israel)による画像化システムを使用して400nmから901nmに広がる波長の画像化範囲にわたって取得された。超立方体画像は、97個の656×832画素のスペクトル的に離散的な画像を含んだ。QD565により放出される光に対する組織の光学応答のアンミキシングを容易にするために、529nmから598nmの動的スペクトル範囲が選定されたが、このことは、個々のQD565の間でのスペクトルパラメータの起こり得る差または偏差を考慮したものである。選定された動的スペクトル範囲内の30個の個々の画像に対応する画像データから、画像強度のスペクトルが545,762画素の各々に対して決定された。これらのスペクトルデータは、図3のステップ318によって、データ点の各々からスペクトル強度の最小値を減算することによりさらに補正された。LMA非線形回帰が、(1)の関数としてのガウス適合関数を用いて、ならびに、a=1、μ=550および=1の初期条件を用いて適用された。所与の画素に対する非線形回帰の結果が上記で説明された信頼区間を満足したならば、そのような画素に対応する目標画像配列の要素が、areg 2の値を用いて創始された。そうでなかったならば、目標配列の要素は図3のステップ326によってゼロ値が割り当てられた。目標画像配列は、図3のアルゴリズムのステップ330A、330Bによって背景雑音を除去するために、および画像オープニング処理を遂行するためにさらに修正された。
Hypercube images of prostate tissue combined with a single QD species that fluoresces at 565 nm (QD565) are 400 nm using an imaging system with Applied Spectral Imaging (ASI, Migdal Ha'Emek, Israel). Was acquired over an imaging range of wavelengths ranging from The hypercube image contained 97 656 × 832 pixel spectrally discrete images. A dynamic spectral range of 529 to 598 nm was chosen to facilitate the unmixing of the tissue optical response to the light emitted by the QD565, which is the occurrence of spectral parameters between individual QD565s. It takes into account the difference or deviation to be obtained. From image data corresponding to 30 individual images within the selected dynamic spectral range, an image intensity spectrum was determined for each of 545,762 pixels. These spectral data were further corrected by subtracting the minimum value of the spectral intensity from each of the data points by
前立腺組織に関連するQD565のスペクトル・アンミキシングの結果が、図4Aおよび4Bに示される。ここで図4Aは、QD565を用いた前立腺組織の超立方体画像の565nmでのスライスを表す個々の画像であり、一方で図4Bは、スペクトル的にアンミックスされた565nmの量子ドット410の目標画像との、図4Aの個々の画像の重ね合わせである。本発明の方法の実装形態は、QDを確信的に識別する方法の能力を立証する。
The results of spectral unmixing of QD565 associated with prostate tissue are shown in FIGS. 4A and 4B. 4A is an individual image representing a slice at 565 nm of a hypercube image of prostate tissue using QD565, while FIG. 4B is a target image of a spectrally unmixed 565 nm
異なる実験では、n=5個の型(5つの種)のQDが接合された状態での胸部組織が、608×656の光学検出器画素を用いて、402nmから800nmの画像化スペクトル範囲での90個の離散波長で画像化され、そのことによってマルチスペクトル超立方体画像を取得した。蛍光QD種は、490nm、525nm、565nm、625nm、および655nmの典型的な波長により特徴付けられたものであり、そのことに応じてQD1=QD490、QD2=QD525、QD3=QD565、QD4=QD625、およびQD5=QD655(Life Technologies Corp.)と標識された。398,848画素の各々に対して、検出された光強度のスペクトルが、図3のステップ316、318によって導出され、さらに基線補正された。LMA非線形回帰が、図3のステップ322によって、次式の適合関数を用いて、基線補正されたスペクトル強度に対してさらに適用された。
In a different experiment, breast tissue with n = 5 types (5 species) of QDs joined, using a 608 × 656 optical detector pixel, in the imaging spectral range of 402 nm to 800 nm. 90 discrete wavelengths were imaged, thereby obtaining a multispectral hypercube image. Fluorescent QD species are characterized by typical wavelengths of 490 nm, 525 nm, 565 nm, 625 nm, and 655 nm, correspondingly QD 1 = QD490, QD 2 = QD525, QD 3 = QD565, QD 4 = QD625, and QD 5 = QD655 (Life Technologies Corp.). For each of the 398,848 pixels, the detected light intensity spectrum was derived by
この式は特定の場合では、個々のQD種のスペクトルプロファイルに対する近似として使用されるn=5個のガウス統計分布の重ね合わせを表す。初期条件が、i=1からi=5に対してai=1、および(μ1=490、μ2=525、μ3=565、μ4=625、μ5=655)であるように選定された。非線形回帰が、これらの型のQD種に対するスペクトル分布に対して典型的である標準偏差値に基づいて実行された。全体的には選定された適合関数の個別のパラメータが固定され、回帰が残りのパラメータに対して実施される。回帰されたパラメータのすべてが既定のパラメータ区間の範囲内にあると、かつ/または、しきい値条件が満足されると、回帰は終結させられ、決定された回帰されたパラメータが、個々のQD種のスペクトル分布を説明するために、選定された適合関数とともに使用される。1つの実施形態では、n=5個のQD種を用いる状況に適用されるような非線形回帰処理は以下のように進行する。 This equation represents, in a particular case, a superposition of n = 5 Gaussian statistical distributions used as an approximation to the spectral profile of the individual QD species. So that the initial conditions are a i = 1 and (μ 1 = 490, μ 2 = 525, μ 3 = 565, μ 4 = 625, μ 5 = 655) for i = 1 to i = 5 Selected. Nonlinear regression was performed based on standard deviation values that are typical for spectral distributions for these types of QD species. Overall, the individual parameters of the selected fitting function are fixed and regression is performed on the remaining parameters. If all of the regressed parameters are within the predefined parameter interval and / or if the threshold condition is met, the regression is terminated and the determined regressed parameters are assigned to the individual QDs. Used with a selected fitting function to describe the spectral distribution of the species. In one embodiment, the non-linear regression process as applied to the situation using n = 5 QD species proceeds as follows.
最初に回帰が、適切な動的スペクトル範囲を用いて、2つの選定された種のスペクトルに適用される。ここでは回帰は、402nmから581nmに広がるように選定された動的スペクトル範囲、および以下の初期条件、すなわち、固定されたσ1=10、σ2=10を用いて、QD1=QD490およびQD2=QD525の種に最初に適用された。信頼区間は、QD490に対する平均波長の回帰される値に対して470<μreg,1<500の区間を含んだ。QD490に対する回帰された平均波長がこの信頼区間の範囲内であったならば、かつ、QD490に対するスペクトル強度振幅値が、(特定の実施形態では、関心の範囲にわたる画像形成信号の最大強度の10倍の値として規定される)雑音しきい値の値を上回らなかったならば、(2)のスペクトル強度分布へのQD490種の寄与が、回帰されたパラメータを用いるガウス適合 First, a regression is applied to the two selected species of spectra using the appropriate dynamic spectral range. Here, the regression is performed using QD 1 = QD490 and QD with a dynamic spectral range chosen to extend from 402 nm to 581 nm and the following initial conditions: fixed σ 1 = 10, σ 2 = 10 2 = First applied to QD525 seeds. The confidence interval included an interval of 470 <μ reg, 1 <500 for the regressed value of the average wavelength for QD490. If the regressed average wavelength for QD490 was within this confidence interval, and the spectral intensity amplitude value for QD490 is (in certain embodiments, 10 times the maximum intensity of the imaging signal over the range of interest. If the noise threshold value (defined as the value of) is not exceeded, the contribution of the QD490 species to the spectral intensity distribution of (2) is a Gaussian fit using the regressed parameters
![]()
![]()
であるように設定された。そうでなかったならば、スペクトル強度分布(2)へのQD490種の寄与を表す(2)の成分がゼロに設定され、freg,1(λ)=0となった。
次に、非線形回帰が次式の組み合わせに適用された。
Was set to be. If not, the component of (2) representing the contribution of the QD490 species to the spectral intensity distribution (2) was set to zero and f reg, 1 (λ) = 0.
Next, nonlinear regression was applied to the combination of the following equations:
この式で用いる初期パラメータは、(QD2=QD525に対する)σ2=10、(QD3=QD565に対する)固定されたσ3=14、(QD4=QD625に対する)σ4=20、および(QD5=QD655に対する)固定されたσ5=10である。このステップでは、回帰される式はQD655に関して探索されている。結果として得られる回帰されたパラメータが、非線形回帰処理手順に対して選定されるように、信頼区間σreg,2<2、またはσreg,4<2、または[μreg,5−μreg,4]<5を満足するならば、代替的な回帰が、以下のパラメータ、すなわち、σ2=10、固定されたσ3=14、固定されたσ4=15、および固定されたσ5=10を用いて行われる。これに対して、結果として得られる回帰されたパラメータが、以下の「誤り」区間(μreg,3≦μreg,2、μreg,3>585、μreg,5≦μreg,4、μreg,5>700、σreg,3≦2、σreg,4≦4、σreg,4>30)のいずれかの範囲内にあり、それらの区間のいずれかを満足するならば、または、選定された信頼区間(例えば95%区間)がareg,4、μreg,4、σreg,4、areg,5のいずれかに対してゼロ値を含んだならば、スペクトル強度分布(3)へのQD655種の寄与を表す(3)の成分freg,5(λ)がゼロに定まった状態となって、freg,5(λ)=0となり、QD655の寄与は、これ以上は勘定に入れられない。
Initial parameters used in this formula, (
後者の場合では回帰の次のステップは、以下の適合式を使用して402nmから800nmの完全な画像化スペクトル範囲内でのQD2=QD525、QD3=QD565、およびQD4=QD625の回帰を含んだ。 In the latter case, the next step in the regression is to perform a regression with QD 2 = QD525, QD 3 = QD565, and QD 4 = QD625 within the complete imaging spectral range of 402 nm to 800 nm using the following fitting equation: Inclusive.
この式で用いる初期パラメータは、σ2=10、固定されたσ3=14、およびσ4=20である。ここでも、回帰されたパラメータがパラメータ区間μreg,3≦μreg,2もしくはμreg,4≦μreg,3の範囲内にあるならば、または、areg,2もしくはareg,3もしくはμreg,3もしくはσreg,3もしくはareg,4もしくはμreg,4もしくはσreg,4に対する信頼区間がゼロを含んだならば、スペクトル強度分布(4)へのQD565種の寄与を表す(4)の成分freg,3(λ)がゼロに設定され、freg,3(λ)=0となった。この場合、全体的な適合関数に対するQD565の寄与は、これ以上は勘定に入れられなかったことになり、残りの非線形回帰ステップが、残りの2つのQD種、QD2=QD525およびQD4=QD625を用いて、 The initial parameters used in this equation are σ 2 = 10, fixed σ 3 = 14, and σ 4 = 20. Again, if the regressed parameter is in the range of parameter interval μ reg, 3 ≦ μ reg, 2 or μ reg, 4 ≦ μ reg, 3 , or a reg, 2 or a reg, 3 or μ If the confidence interval for reg, 3 or σ reg, 3 or a reg, 4 or μ reg, 4 or σ reg, 4 contains zero, it represents the contribution of QD565 species to the spectral intensity distribution (4) (4 ) Component f reg, 3 (λ) is set to zero, and f reg, 3 (λ) = 0. In this case, QD565's contribution to the overall fit function would not have been accounted for any more, and the remaining nonlinear regression steps would result in the remaining two QD species, QD 2 = QD525 and QD 4 = QD625. Using,
および402nmから800nmの完全な画像化スペクトルの全域で取得された画像化データによって実行された。初期パラメータは、固定されたσ2=14、および固定されたσ4=15であった。 And performed with imaging data acquired across the entire imaging spectrum from 402 nm to 800 nm. The initial parameters were fixed σ 2 = 14 and fixed σ 4 = 15.
非線形回帰のこの最後のステップの結果がR2>0.95であることを確実にしたならば、図3のステップ326によって、QD1=QD490、QD2=QD525、QD3=QD565、QD4=QD625、およびQD5=QD655にそれぞれ対応する目標画像データ配列に、i=1、2、3、4、および5の各々に対する回帰された値
Once we have ensured that the result of this last step of the non-linear regression is R 2 > 0.95,
![]()
![]()
が割り当てられた。次の随意のステップ(図3には示されない)として、これらの目標画像配列に対応する目標画像は、例えばKapurら、Computer Vision,Graphics,and Image Processing(第29巻、273〜285頁、1985年)により検討されたような最大エントロピー法に基づく自動しきい値処理を使用して、2進形にさらに変換される場合がある。そのような2進変換によって、特定のQD種に対応する平均波長での組織の画像の形成および視覚化、ならびに、目標画像の背景上のこのQD種の視覚化および/または識別が容易になる。 Has been assigned. As the next optional step (not shown in FIG. 3), the target images corresponding to these target image arrays are described in, for example, Kapur et al., Computer Vision, Graphics, and Image Processing (Vol. 29, pages 273-285, 1985). May be further converted to a binary form using automatic thresholding based on the maximum entropy method as discussed by Y. Such binary transformation facilitates the formation and visualization of tissue images at an average wavelength corresponding to a particular QD species, and the visualization and / or identification of this QD species on the background of the target image. .
QD1=QD490、QD2=QD525、QD3=QD565、QD4=QD625、およびQD5=QD655を用いてマーキングされた胸部組織に適用されたような本発明の方法の例示的な結果が、図5A、5B、6A、6B、7A、7B、8A、8B、9A、および9Bに提示される。図5B、6B、7B、8B、および9Bは、QD種の各々に対して、関心の波長での(すなわちλ1=490nm、λ2=525nm、λ3=565nm、λ4=625nm、およびλ5=656nmでの)超立方体画像のスペクトルスライスに対応する個々の画像を例示する。比較として図5A、6A、7A、8A、および9Aは、対応する目標のアンミックスされた画像を表示し、それらの画像の各々は、QDのそれぞれ対応する種の蛍光放出に対する画像組織の光学応答を表す。図5B、7B、および9Bは、25倍に増大された強度によって提示され、一方で図6Bおよび8Bは、5倍に増大された強度を図示し、このことは両方の場合で、組織に入射する光の相対的強度を反映したものである。 Exemplary results of the method of the invention as applied to breast tissue marked with QD 1 = QD490, QD 2 = QD525, QD 3 = QD565, QD 4 = QD625, and QD 5 = QD655 are Presented in FIGS. 5A, 5B, 6A, 6B, 7A, 7B, 8A, 8B, 9A, and 9B. 5B, 6B, 7B, 8B, and 9B show, for each of the QD species, at the wavelength of interest (ie, λ 1 = 490 nm, λ 2 = 525 nm, λ 3 = 565 nm, λ 4 = 625 nm, and λ Illustrate individual images corresponding to spectral slices of a hypercube image (at 5 = 656 nm). For comparison, FIGS. 5A, 6A, 7A, 8A, and 9A display unmixed images of corresponding targets, each of which is an optical response of the image tissue to the fluorescence emission of the respective corresponding species of QD. Represents. FIGS. 5B, 7B, and 9B are presented with a 25-fold increased intensity, while FIGS. 6B and 8B illustrate a 5-fold increased intensity, which in both cases is incident on the tissue. This reflects the relative intensity of light.
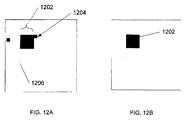
図12A、12Bは、(図3のステップ330Bの処理手順などの)画像オープニング処理手順の使用が好ましい場合がある状況の簡単な例示を与える。図12Aの画像は、目標画像データからの背景雑音の除去の後の、図3のステップ330Aの結果として得られた単一のQDの画像に対応する。識別されたQD(画素群1202)に加えて、残留雑音(画素1202、1204)の存在が観察され得る。円形開口を表す単位行列
12A, 12B provide a simple illustration of a situation where it may be preferable to use an image opening procedure (such as the procedure of
を用いて実行される「画像オープニング」処理手順の後、残留背景雑音が図12Bに示されるように除去される。
本発明は上記で説明された例示的な実施形態によって説明されているが、例示された実施形態に対する修正、およびそれらの実施形態の変形が、本明細書で開示された発明概念から逸脱することなく行われ得ることは、当業者には理解されるであろう。例えば本発明の方法のいくつかの態様は流れ図を参照して説明されたが、流れ図の各々のブロックのすべてもしくは一部分の、またはブロックの組み合わせの機能、動作、判断等が、組み合わされ得る、別々の動作に分離され得る、または他の順序で遂行され得ることを当業者は容易に認識するはずである。さらに実施形態は様々な例示のデータ構造に関して説明されているが、システムは種々のデータ構造を使用して実施され得ることを当業者であれば認めるであろう。本発明の実施形態に対して選定された特定の値が詳述されているが、本発明の範囲内で、パラメータのすべての値は異なる用途に合うように幅広い範囲にわたって変動し得ることを理解されたい。加えて、本明細書で利用されたものとは異なる波長特性を有するナノ結晶量子ドットの使用。さらには開示された態様、またはこれらの態様の一部分は、上記でリストアップされなかった形で組み合わされる場合がある。したがって本発明は、開示された実施形態(複数可)に限定されるとみなされるべきではない。
After the “image opening” procedure performed using, residual background noise is removed as shown in FIG. 12B.
While the invention has been described in terms of the exemplary embodiments described above, modifications to the illustrated embodiments and variations of those embodiments will depart from the inventive concepts disclosed herein. Those skilled in the art will appreciate that this can be done without. For example, although some aspects of the methods of the present invention have been described with reference to flowcharts, the functions, operations, decisions, etc. of all or a portion of each block of the flowchart, or a combination of blocks, can be combined separately. Those skilled in the art will readily recognize that these operations can be separated or performed in other orders. Further, although embodiments have been described with respect to various exemplary data structures, those skilled in the art will appreciate that the system may be implemented using various data structures. Although specific values chosen for embodiments of the present invention have been described in detail, it is understood that within the scope of the present invention, all values of parameters may vary over a wide range to suit different applications. I want to be. In addition, the use of nanocrystalline quantum dots having different wavelength characteristics than those utilized herein. Furthermore, the disclosed aspects, or portions of these aspects, may be combined in ways not listed above. Accordingly, the present invention should not be viewed as limited to the disclosed embodiment (s).
Claims (30)
前記生体試料上に位置する第1の光源を用いて照光される前記生体試料から取得される画像化データ、および前記生体試料の画像のうちの少なくとも1つを受け取るように構成され、前記第1の光源が、第1の統計分布により説明される第1の平均波長および第1のスペクトル強度を有する入力と、
前記入力から前記画像化データおよび前記画像のうちの前記少なくとも1つを受け取るように、前記画像化データおよび前記画像のうちの前記少なくとも1つに関連するスペクトルデータを非線形回帰するように、かつ、第1の平均波長での前記生体試料の目標画像を表すデータを発生させるようになされる処理装置と
を備える装置。 An apparatus for imaging a biological sample,
Configured to receive at least one of imaging data acquired from the biological sample illuminated using a first light source located on the biological sample, and an image of the biological sample, the first A light source having a first average wavelength and a first spectral intensity described by a first statistical distribution;
To nonlinearly regress spectral data associated with the imaging data and the at least one of the images to receive the imaging data and the at least one of the images from the input; and A processing device adapted to generate data representing a target image of the biological sample at a first average wavelength.
上に第1の蛍光種が配設される組織試料の画像の組を受け取って、前記組織試料を表す光強度のスペクトル分布を取得するステップと、
目標スペクトル帯域での前記組織画像を表す光強度の目標分布を導出するように、少なくとも非線形回帰、および前記蛍光種により規定されるデータ信頼区間に基づいて強度の前記取得されたスペクトル分布を修正するステップと、
光強度の前記目標分布を、前記蛍光種により放出される光に対する前記組織試料の光学応答の視覚的に知覚可能な表現に対応付けするステップと
を含む方法。 A method for converting a pathological image, comprising:
Receiving a set of images of a tissue sample on which a first fluorescent species is disposed to obtain a spectral distribution of light intensity representative of the tissue sample;
Modify the acquired spectral distribution of intensity based on at least nonlinear regression and a data confidence interval defined by the fluorescent species to derive a target distribution of light intensity representing the tissue image in a target spectral band Steps,
Correlating the target distribution of light intensity with a visually perceptible representation of the optical response of the tissue sample to light emitted by the fluorescent species.
をさらに含む、請求項6に記載の方法。 7. The method of claim 6, further comprising conjugating the fluorescent species with a surface of the tissue sample, wherein association represents a material structure of the tissue sample.
データ配列の要素に光強度の前記目標分布の値を割り当てるステップと、前記データ配列の非ゼロの要素の平均値を決定するステップと、前記平均値より低い値を包含する前記データ配列の要素をゼロにするステップとを含む、請求項11に記載の方法。 Said step of offsetting comprises:
Assigning a value of the target distribution of light intensity to an element of the data array; determining an average value of non-zero elements of the data array; and an element of the data array including a value lower than the average value 12. The method of claim 11, comprising zeroing.
前記生体試料の画像を表す画像データ配列を受け取るように構成され、前記画像の各々が、物体領域内の複数の光源から光学システムを通る画像領域への光によって照光される前記生体試料を画像化することにより、それぞれ対応する離散スペクトル帯域で取得されており、光源の各々が、対応する平均波長を有する入力と、
前記受け取られた画像データ配列から、前記画像領域の所定の一部分の全域で強度のスペクトル分布を決定すること、および、
強度の前記決定されたスペクトル分布を非線形回帰して、前記複数の光源から光源のスペクトル分布を表す回帰されたパラメータを導出すること
により、前記受け取られた画像データ配列のうちの少なくとも1つを、選定された対応する平均波長での前記生体試料の慣用画像を表す、少なくとも1つの慣用画像データ配列に変換するようになされる処理装置と、
前記取得された画像および慣用画像のうちの少なくとも1つを表示するように構成されるグラフィカル出力と
を備える計算機プログラム製品。 A computer program product for use on a computer system for imaging a biological sample, said computer program product comprising a computer usable tangible medium having computer readable program code thereon, said computer readable program Establishing a device to be implemented in the computer system when code is loaded into the computer system, the device comprising:
Imaging the biological sample configured to receive an image data array representing an image of the biological sample, each of the images being illuminated by light from a plurality of light sources in the object region to an image region through an optical system Each of the light sources is acquired in a corresponding discrete spectral band, and each of the light sources has a corresponding average wavelength,
Determining, from the received image data array, an intensity spectral distribution across a predetermined portion of the image region; and
Non-linear regression of the determined spectral distribution of intensity to derive a regressed parameter representing the spectral distribution of the light source from the plurality of light sources, so that at least one of the received image data arrays is A processing device adapted to convert into at least one conventional image data array representing a conventional image of said biological sample at a selected corresponding average wavelength;
A computer program product comprising a graphical output configured to display at least one of the acquired image and a conventional image.
前記画像領域の全域で、前記複数の光源から目標光源の目標強度の分布を表すデータ配列を生成すること、および、
前記データ配列の要素を、前記要素に対応する目標強度の値が前記データ配列の非ゼロの値の平均未満であるならばゼロに設定すること
により、前記受け取られたデータ配列のうちの少なくとも1つを変換するようにさらになされる、請求項17に記載の計算機プログラム製品。 The processing device is
Generating a data array representing a target intensity distribution of a target light source from the plurality of light sources across the image area; and
By setting an element of the data array to zero if the target intensity value corresponding to the element is less than the average of the non-zero values of the data array, at least one of the received data arrays The computer program product of claim 17, further adapted to convert one of them.
前記生体試料の表面上に少なくとも1つの光源を包含する前記生体試料からの光を受け取るように構成される入力、
少なくとも1つの光学軸に沿って前記入力と光学的に連通する出力、
前記入力と前記出力との間の前記少なくとも1つの光学軸に沿って配設され、複数のスペクトル帯域幅内の前記光を処理して、前記複数のスペクトル帯域幅に対応する複数の画像形成信号を形成するように構成されるスペクトル的に選択的なシステム、
前記複数のスペクトル帯域幅に対応する前記複数の画像形成信号を前記出力から受け取るように、かつ、前記複数の画像形成信号から複数の画像を形成するように構成される検出器
を含む光学システムと、
前記検出器と動作可能に接続される計算機処理装置と、
中に計算機可読命令が組み込まれた有形非一時的記憶媒体であって、前記計算機可読命令が、前記計算機処理装置上にロードされるときに前記処理装置に、
前記生体試料を表す強度のスペクトル分布を前記複数の画像から導出させ、かつ、
非線形回帰アルゴリズムを曲線適合方程式に適用させて、前記生体試料の全域で、前記少なくとも1つの光源により放出される光の強度の分布を決定させる有形非一時的記憶媒体と
を備えるシステム。 A system for imaging a biological sample,
An input configured to receive light from the biological sample including at least one light source on a surface of the biological sample;
An output in optical communication with the input along at least one optical axis;
A plurality of image forming signals disposed along the at least one optical axis between the input and the output and processing the light within a plurality of spectral bandwidths to correspond to the plurality of spectral bandwidths A spectrally selective system, configured to form
An optical system including a detector configured to receive the plurality of imaging signals corresponding to the plurality of spectral bandwidths from the output and to form a plurality of images from the plurality of imaging signals; ,
A computer processor operatively connected to the detector;
A tangible non-transitory storage medium having computer readable instructions embedded therein, wherein when the computer readable instructions are loaded onto the computer processing apparatus,
Deriving a spectral distribution of intensity representing the biological sample from the plurality of images; and
A tangible non-transitory storage medium that applies a non-linear regression algorithm to a curve fitting equation to determine a distribution of the intensity of light emitted by the at least one light source across the biological sample.
前記組織試料から画像形成光を受け取り、前記画像形成光がQD種により放出される光を含み、前記QD種が、前記組織試料の成分と、前記QD種と前記成分との間の所定の親和性によって共役されるステップと、
複数のスペクトル帯域内の前記画像形成光を分析して、前記画像形成光の強度のスペクトル分布を決定するステップと、
パラメータ適合関数および前記パラメータ適合関数のパラメータを規定する信頼区間を用いて前記QD種のスペクトル分布を推定するステップと、
前記QD種に対応するスペクトル帯域幅内の前記組織試料の前記成分の空間的位置を表す画像データを導出するステップと
を含む方法。 A method for identifying the anatomy of a tissue sample using quantum dots (QD) comprising:
Receiving image-forming light from the tissue sample, the image-forming light comprising light emitted by a QD species, wherein the QD species is a component of the tissue sample and a predetermined affinity between the QD species and the component A step coupled by sex;
Analyzing the imaging light within a plurality of spectral bands to determine a spectral distribution of the intensity of the imaging light;
Estimating a spectral distribution of the QD species using a parameter fitting function and a confidence interval defining parameters of the parameter fitting function;
Deriving image data representing a spatial position of the component of the tissue sample within a spectral bandwidth corresponding to the QD species.
Applications Claiming Priority (3)
| Application Number | Priority Date | Filing Date | Title |
|---|---|---|---|
| US201161483202P | 2011-05-06 | 2011-05-06 | |
| US61/483,202 | 2011-05-06 | ||
| PCT/EP2012/058253 WO2012152693A1 (en) | 2011-05-06 | 2012-05-04 | Method and system for spectral unmixing of tissue images |
Publications (2)
| Publication Number | Publication Date |
|---|---|
| JP2014525028A true JP2014525028A (en) | 2014-09-25 |
| JP2014525028A5 JP2014525028A5 (en) | 2015-02-12 |
Family
ID=46149403
Family Applications (1)
| Application Number | Title | Priority Date | Filing Date |
|---|---|---|---|
| JP2014508819A Pending JP2014525028A (en) | 2011-05-06 | 2012-05-04 | Method and system for spectral unmixing of tissue images |
Country Status (6)
| Country | Link |
|---|---|
| US (1) | US9377613B2 (en) |
| EP (1) | EP2705463A1 (en) |
| JP (1) | JP2014525028A (en) |
| AU (1) | AU2012252564B2 (en) |
| CA (1) | CA2831475C (en) |
| WO (1) | WO2012152693A1 (en) |
Cited By (1)
| Publication number | Priority date | Publication date | Assignee | Title |
|---|---|---|---|---|
| JP2016533475A (en) * | 2013-09-30 | 2016-10-27 | ベンタナ メディカル システムズ, インコーポレイテッド | System and method for adaptive histopathology image decomposition |
Families Citing this family (6)
| Publication number | Priority date | Publication date | Assignee | Title |
|---|---|---|---|---|
| US10778913B2 (en) | 2013-03-12 | 2020-09-15 | Ventana Medical Systems, Inc. | Digitally enhanced microscopy for multiplexed histology |
| US9792693B2 (en) * | 2013-03-15 | 2017-10-17 | Ventana Medical Systems, Inc. | Spectral unmixing |
| WO2015101507A1 (en) | 2013-12-31 | 2015-07-09 | Ventana Medical Systems, Inc. | Systems and methods for spectral unmixing of microscopic images using pixel grouping |
| EP3146463B1 (en) | 2014-05-23 | 2020-05-13 | Ventana Medical Systems, Inc. | Systems and methods for detection of biological structures and/or patterns in images |
| WO2016189065A1 (en) | 2015-05-26 | 2016-12-01 | Ventana Medical Systems, Inc. | Method and system for assessing stain quality for in-situ hybridization and immunohistochemistry |
| FR3091816B1 (en) * | 2019-01-18 | 2022-08-05 | Fabre Pierre Dermo Cosmetique | Device for characterizing and comparing erythemal areas |
Citations (4)
| Publication number | Priority date | Publication date | Assignee | Title |
|---|---|---|---|---|
| US20040223152A1 (en) * | 2003-01-23 | 2004-11-11 | Salvatore Atzeni | Microscope for performing multiple frequency fluorometric measurements |
| JP2006242899A (en) * | 2005-03-07 | 2006-09-14 | Institute Of Physical & Chemical Research | Method for estimating concentration of fluorescent dye from multiple fluorescence, and method for estimating fluorescence intensity from multiple fluorescence |
| JP2008215033A (en) * | 2007-03-07 | 2008-09-18 | Shibaura Institute Of Technology | Dry type spraying system of concrete, and dry type spraying method of concrete |
| JP2010512508A (en) * | 2006-12-20 | 2010-04-22 | ベンタナ・メデイカル・システムズ・インコーポレーテツド | Analysis of quantitative multi-spectral images of tissue samples stained with quantum dots |
Family Cites Families (8)
| Publication number | Priority date | Publication date | Assignee | Title |
|---|---|---|---|---|
| US5863504A (en) | 1995-03-16 | 1999-01-26 | Bio-Rad Laboratories, Inc. | Fluorescence imaging instrument utilizing fish |
| JP2000098244A (en) | 1998-09-24 | 2000-04-07 | Olympus Optical Co Ltd | Fluorescent microscope |
| US7321791B2 (en) * | 2003-09-23 | 2008-01-22 | Cambridge Research And Instrumentation, Inc. | Spectral imaging of deep tissue |
| US20060126959A1 (en) * | 2004-12-13 | 2006-06-15 | Digitalglobe, Inc. | Method and apparatus for enhancing a digital image |
| US8189191B2 (en) * | 2005-07-26 | 2012-05-29 | Tufts University | Spectroscopic imaging microscopy |
| JP2010020298A (en) | 2008-06-13 | 2010-01-28 | Nikon Corp | Imaging apparatus and microscope |
| US9693717B2 (en) * | 2009-07-10 | 2017-07-04 | Cas Medical Systems, Inc. | Method for spectrophotometric blood oxygenation monitoring of the lower gastrointestinal tract |
| CA2806621C (en) * | 2010-08-05 | 2018-09-11 | Cambridge Research & Instrumentation, Inc. | Enhancing visual assessment of samples |
-
2012
- 2012-05-04 US US14/112,354 patent/US9377613B2/en active Active
- 2012-05-04 JP JP2014508819A patent/JP2014525028A/en active Pending
- 2012-05-04 CA CA2831475A patent/CA2831475C/en active Active
- 2012-05-04 AU AU2012252564A patent/AU2012252564B2/en not_active Ceased
- 2012-05-04 WO PCT/EP2012/058253 patent/WO2012152693A1/en active Application Filing
- 2012-05-04 EP EP12723404.5A patent/EP2705463A1/en not_active Ceased
Patent Citations (4)
| Publication number | Priority date | Publication date | Assignee | Title |
|---|---|---|---|---|
| US20040223152A1 (en) * | 2003-01-23 | 2004-11-11 | Salvatore Atzeni | Microscope for performing multiple frequency fluorometric measurements |
| JP2006242899A (en) * | 2005-03-07 | 2006-09-14 | Institute Of Physical & Chemical Research | Method for estimating concentration of fluorescent dye from multiple fluorescence, and method for estimating fluorescence intensity from multiple fluorescence |
| JP2010512508A (en) * | 2006-12-20 | 2010-04-22 | ベンタナ・メデイカル・システムズ・インコーポレーテツド | Analysis of quantitative multi-spectral images of tissue samples stained with quantum dots |
| JP2008215033A (en) * | 2007-03-07 | 2008-09-18 | Shibaura Institute Of Technology | Dry type spraying system of concrete, and dry type spraying method of concrete |
Cited By (3)
| Publication number | Priority date | Publication date | Assignee | Title |
|---|---|---|---|---|
| JP2016533475A (en) * | 2013-09-30 | 2016-10-27 | ベンタナ メディカル システムズ, インコーポレイテッド | System and method for adaptive histopathology image decomposition |
| US10395371B2 (en) | 2013-09-30 | 2019-08-27 | Ventana Medical Systems, Inc. | Systems and methods for adaptive histopathology image unmixing |
| US10783641B2 (en) | 2013-09-30 | 2020-09-22 | Ventana Medical Systems, Inc. | Systems and methods for adaptive histopathology image unmixing |
Also Published As
| Publication number | Publication date |
|---|---|
| AU2012252564A1 (en) | 2013-09-26 |
| US9377613B2 (en) | 2016-06-28 |
| AU2012252564B2 (en) | 2015-11-26 |
| CA2831475C (en) | 2016-11-01 |
| US20140078286A1 (en) | 2014-03-20 |
| CA2831475A1 (en) | 2012-11-15 |
| EP2705463A1 (en) | 2014-03-12 |
| WO2012152693A1 (en) | 2012-11-15 |
Similar Documents
| Publication | Publication Date | Title |
|---|---|---|
| JP2014525028A (en) | Method and system for spectral unmixing of tissue images | |
| EP3005293B1 (en) | Image adaptive physiologically plausible color separation | |
| EP2888576B1 (en) | Visualization and measurement of cell compartments | |
| US9128055B2 (en) | Information processing apparatus, information processing method, program, and method of correcting intensity of fluorescence spectrum | |
| JP5832537B2 (en) | Enhanced visual evaluation of samples | |
| JP4504203B2 (en) | Scoring of estrogen and progesterone expressions based on image analysis | |
| EP2972223B1 (en) | Spectral unmixing | |
| US20120314930A1 (en) | Image Classifier Training | |
| WO2016007739A1 (en) | Pure spectrum extraction from biological samples | |
| CN117653040A (en) | System and method for real-time Raman spectroscopy for cancer detection | |
| Mahbub et al. | Statistically strong label-free quantitative identification of native fluorophores in a biological sample | |
| US20240119645A1 (en) | Signal processing apparatus and signal processing method | |
| WO2014083743A1 (en) | Image measuring device and image measuring method | |
| DE102017221187B4 (en) | Method for determining the concentration of different fluorescence emitters and microscopy systems contained in an object | |
| Septiana et al. | Elastic and collagen fibers discriminant analysis using H&E stained hyperspectral images | |
| DE102016105102A1 (en) | Method for examining distributed objects | |
| WO2018023165A1 (en) | A method for distinguishing between more than one fluorescent species present in a sample | |
| Ghosh et al. | A generalized framework for stain separation in digital pathology applications | |
| CN117546007A (en) | Information processing device, biological sample observation system, and image generation method | |
| DEMO | The Principles of Colocalization Microscopy and Image Analysis 23 Aug, 2022| Blog posts, Prisma |
Legal Events
| Date | Code | Title | Description |
|---|---|---|---|
| A521 | Request for written amendment filed |
Free format text: JAPANESE INTERMEDIATE CODE: A523 Effective date: 20141216 |
|
| A621 | Written request for application examination |
Free format text: JAPANESE INTERMEDIATE CODE: A621 Effective date: 20141216 |
|
| A977 | Report on retrieval |
Free format text: JAPANESE INTERMEDIATE CODE: A971007 Effective date: 20151014 |
|
| A131 | Notification of reasons for refusal |
Free format text: JAPANESE INTERMEDIATE CODE: A131 Effective date: 20151030 |
|
| A601 | Written request for extension of time |
Free format text: JAPANESE INTERMEDIATE CODE: A601 Effective date: 20160106 |
|
| A521 | Request for written amendment filed |
Free format text: JAPANESE INTERMEDIATE CODE: A523 Effective date: 20160406 |
|
| A02 | Decision of refusal |
Free format text: JAPANESE INTERMEDIATE CODE: A02 Effective date: 20160926 |