JP2014137635A - Response time monitoring program, method and device - Google Patents
Response time monitoring program, method and device Download PDFInfo
- Publication number
- JP2014137635A JP2014137635A JP2013004728A JP2013004728A JP2014137635A JP 2014137635 A JP2014137635 A JP 2014137635A JP 2013004728 A JP2013004728 A JP 2013004728A JP 2013004728 A JP2013004728 A JP 2013004728A JP 2014137635 A JP2014137635 A JP 2014137635A
- Authority
- JP
- Japan
- Prior art keywords
- response time
- job type
- job
- correspondence
- type
- Prior art date
- Legal status (The legal status is an assumption and is not a legal conclusion. Google has not performed a legal analysis and makes no representation as to the accuracy of the status listed.)
- Granted
Links
Images


Landscapes
- Debugging And Monitoring (AREA)
Abstract
Description
本発明は、コンピュータの応答時間監視処理に関する。 The present invention relates to a response time monitoring process of a computer.
監視対象であるコンピュータの応答時間を監視し、正常と許容できる範囲(正常範囲)を超えた応答時間となった場合にアラートを発するが、正常範囲の閾値(上限値、下限値)を適切に設定することは難しい。 Monitors the response time of the computer being monitored, and issues an alert when the response time exceeds normal and acceptable range (normal range), but properly sets the normal range threshold (upper limit, lower limit) It is difficult to set.
正常範囲の閾値が低過ぎる場合は、アラートが多発して管理者がアラートに慣れてしまい注意を払わなくなるおそれがある。また、閾値が高過ぎる場合は、問題が生じていてもアラートが発せられない状態となり、管理者が問題に対処するのが遅れてしまうおそれがある。 If the normal range threshold is too low, alerts may occur frequently and the administrator may become used to the alerts and not pay attention. If the threshold is too high, an alert is not issued even if a problem occurs, and there is a possibility that the administrator may be delayed in dealing with the problem.
さらに、コンピュータの短期的な負荷集中によって自然に応答時間が増加したような場合は、管理者が対処を要する問題が発生していないので、アラートを抑制することが望ましい。 Further, when the response time naturally increases due to short-term load concentration of the computer, it is desirable to suppress the alert because there is no problem that the administrator needs to deal with.
例えば、電子メール管理サーバ(コンピュータ)の応答時間が特定の時間帯に増加する場合、人事管理システムや給与管理システムのコンピュータの応答時間が特定の期間に増加する場合など、一時的な処理集中による応答時間の増加に基づくアラートが発せられると、管理者はアラートの原因の調査と、対応策が要求されるため、管理業務の負担になるだけでなく、不要なアラートに対する慣れによって本来のアラートを見落とす可能性が高くなる等の問題が生じる。 For example, when the response time of an e-mail management server (computer) increases during a specific time period, or when the response time of a computer of a personnel management system or salary management system increases during a specific period, due to temporary processing concentration When an alert is issued based on an increase in response time, the administrator is required to investigate the cause of the alert and take countermeasures. Problems such as an increased possibility of oversight occur.
そのため、従来では、管理者は、応答時間の増加によるアラートがあると、監視対象のコンピュータに対するアラートの原因調査と発生している問題への対処が必要であるかの判断を手作業で行っていた。詳しくは、監視対象のコンピュータの応答時間についてアラートが検出されると、管理者が他の様々な性能指標をチェックし、コンピュータに何が起こっているのかを総合的に判断し、問題が生じていると判断した場合に必要な対処を行っていた。 For this reason, conventionally, when there is an alert due to an increase in response time, the administrator manually investigates the cause of the alert on the monitored computer and determines whether it is necessary to deal with the problem that has occurred. It was. Specifically, when an alert is detected about the response time of a monitored computer, the administrator checks various other performance indicators to determine what is happening to the computer and to determine if there is a problem. Necessary actions were taken when it was determined that
また、従来、複数のランクの警報を発するために、監視対象の装置データ間の関係を示す不変量を抽出して、複数のルールの複数の等価しきい値を不変量のネットワークで計算し、監視対象の装置から警報を受信すると、普段の状態とどの程度異なる状況かによりその警報をランク付ける装置が知られている。 In addition, conventionally, in order to issue an alarm of a plurality of ranks, an invariant indicating a relationship between device data to be monitored is extracted, and a plurality of equivalent threshold values of a plurality of rules are calculated in an invariant network, When an alarm is received from a device to be monitored, a device is known that ranks the alarm according to how different the situation is from a normal state.
さらに、従来、分散システムの能力計画と資源最適化のために、各装置や資源から収集された測定値間の関係を示す不変式を求め、不変式とユーザ負荷を示すフロー強度とにより分散システムを構成する要素の能力を決定する方法が知られている。 Furthermore, conventionally, for the capacity planning and resource optimization of a distributed system, an invariant that indicates the relationship between measured values collected from each device or resource is obtained, and the distributed system is determined by the invariant and the flow intensity that indicates the user load. There are known methods for determining the abilities of the elements that make up.
監視対象のコンピュータに発生した問題による応答時間の増加の場合は、速やかにアラートを発生させる必要があるが、上記のように、コンピュータの短期的な負荷集中によって自然に応答時間が増加した場合にはアラートを抑制することが望ましい。 If the response time increases due to a problem with the monitored computer, it is necessary to promptly generate an alert. However, as described above, when the response time naturally increases due to short-term load concentration on the computer, It is desirable to suppress alerts.
コンピュータの負荷の集中による応答時間の増加する場合として、一般的に、多数のユーザが同時にアクセスする場合があるが、時間経過により自然解消するためアラートが不要である。また、排他ロックを行う処理が実行されている場合には、アクセスするユーザ数が少なくても応答時間が一時的に増加するが、アラートは不要である。 As a case where the response time increases due to the concentration of the load on the computer, generally, there are cases where a large number of users access at the same time. In addition, when processing for performing exclusive lock is executed, the response time temporarily increases even if the number of accessing users is small, but no alert is required.
そのため、短期的な負荷集中による自然な応答時間の増加と問題発生による異常な応答時間の増加とを区別してアラートを発生させられるような正常範囲の設定が必要であるが、従来手法では、2つの応答時間の増加を区別できる正常範囲の設定が難しい。 Therefore, it is necessary to set a normal range so that an alert can be generated by distinguishing between a natural increase in response time due to short-term load concentration and an abnormal response time increase due to the occurrence of a problem. It is difficult to set a normal range that can distinguish between two response time increases.
例えば、複数データ間の相関分析にもとづいて異常を判断する場合には、正常範囲の設定に用いる複数データの相関が不明であり、自然な負荷集中であっても相関が乱れただけで異常と判断されてアラートが多発する可能性がある。 For example, when judging abnormality based on correlation analysis between multiple data, the correlation of multiple data used for setting the normal range is unknown, and even if natural load concentration, the correlation is disturbed and Judgment may occur and alerts may occur frequently.
さらに、監視対象に実際に問題が発生することなく、応答時間の正常範囲の閾値を適切に設定する必要がある。 Furthermore, it is necessary to appropriately set the threshold value of the normal range of response time without actually causing a problem in the monitoring target.
本発明の目的は、監視対象のコンピュータの応答時間について、一時的な負荷集中と問題発生とを区別できるように正常範囲を設定し、異常な応答時間の増加のみにアラートを出力できる応答時間監視技術を提供することである。 The object of the present invention is to set a normal range for the response time of the computer to be monitored so that it can distinguish between temporary load concentration and the occurrence of a problem, and to output an alert only when the response time increases abnormally. Is to provide technology.
本発明の一態様として開示され応答時間監視プログラムは、監視対象コンピュータの応答時間を監視するために、コンピュータに、1)監視対象コンピュータで一定時間に実行される全ジョブ合計の同時実行数と、各ジョブ種について、ジョブ種単独の同時実行数と該ジョブ種の平均応答時間とを計算し、2)前記ジョブ種毎に、該ジョブ種の平均応答時間と全ジョブ合計の同時実行数との第1の対応関係と、該ジョブ種の平均応答時間とジョブ種単独の同時実行数との第2の対応関係とを生成し、3)前記ジョブ種毎に、対応する前記第1の対応関係および前記第2の対応関係のうち、該ジョブ種の平均応答時間との相関が高い対応関係を選択し、4)予め設定された時間毎に前記監視対象コンピュータで実行される各ジョブの応答時間を取得し、5)前記各ジョブの応答時間を、該ジョブのジョブ種に対応して選択された対応関係を用いて決定した閾値をもとにアラート対象とするかを判断する、処理を実行させるためのものである。 A response time monitoring program disclosed as one aspect of the present invention is provided for a computer to monitor the response time of a monitored computer. 1) The number of simultaneous executions of all jobs executed in a certain time on the monitored computer; For each job type, the number of simultaneous executions of the job type and the average response time of the job type are calculated. 2) For each job type, the average response time of the job type and the total number of simultaneous executions of all jobs Generating a first correspondence and a second correspondence between the average response time of the job type and the number of simultaneous executions of the job type alone, and 3) the first correspondence corresponding to each job type And a correspondence relationship having a high correlation with the average response time of the job type is selected from the second correspondence relationships, and 4) the response time of each job executed by the monitoring target computer every preset time. The And 5) to determine whether the response time of each job is to be alerted based on a threshold value determined using the correspondence selected corresponding to the job type of the job. Is for.
開示する応答時間監視プログラムによれば、監視対象の応答時間の増加が短期的な負荷集中による自然な応答時間増加であるか、問題の発生による異常な応答時間増加であるかを区別した監視を実現することができる。 According to the disclosed response time monitoring program, it is possible to monitor whether the increase in the response time of the monitoring target is a natural response time increase due to short-term load concentration or an abnormal response time increase due to the occurrence of a problem. Can be realized.
以下、本発明の一態様として開示する応答時間監視方法を実行する応答時間監視装置について説明する。 Hereinafter, a response time monitoring apparatus that executes the response time monitoring method disclosed as one aspect of the present invention will be described.
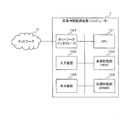
図1は、応答時間監視装置1の一実施例におけるハードウェア構成例を示す図である。
FIG. 1 is a diagram illustrating a hardware configuration example in one embodiment of the response
応答時間監視装置1は、CPU101、短期記憶部(DRAM)102、長期記憶部(HDD)103、ネットワークインタフェース104、入力装置(キーボード、マウス等)105、出力装置(ディスプレイ、プリンタ等)106が内部ネットワーク等で接続されたコンピュータとして実施することができる。
The response
応答時間監視装置1は、監視対象のコンピュータ、コンピュータシステム等の応答時間監視処理に必要な情報をファイルとして長期記憶部103に記憶し、入力装置105から実行プログラムを起動し、起動された実行プログラムが、短期記憶部102にロードされ、ネットワークインタフェース104で受信した監視対象がパケットデータをもとに処理を実行する。
The response
応答時間監視装置1は、必要に応じて情報を長期記憶部103から短期記憶部102に読み出しながら応答時間監視処理を進め、監視対象の応答時間が正常範囲を超えた場合に、ネットワークインタフェース104から予め設定された管理者の端末装置へアラート情報を送信する。また、応答時間監視装置1は、アラート情報を出力装置106へ出力することもできる。
The response
なお、応答時間監視処理の実行プログラムは、CD−ROM、CD−RW、DVD−R、DVD−RAM、DVD−RW等やフレキシブルディスク等の記録媒体だけでなく、通信回線の先に備えられた他の記憶装置やコンピュータのハードディスク等に記憶されるものであってもよい。 The execution program for the response time monitoring process is provided not only on a recording medium such as a CD-ROM, CD-RW, DVD-R, DVD-RAM, DVD-RW, or flexible disk, but also on the end of a communication line. It may be stored in another storage device or a hard disk of a computer.
応答時間監視装置1は、監視対象のコンピュータまたはコンピュータシステムの応答時間が正常であると許容できる範囲(正常範囲)を示す閾値(上限値または下限値またはその両方)を監視対象のコンピュータの負荷量に基づいて動的に変更する。
The response
応答時間監視装置1が監視する応答時間は、監視対象のコンピュータまたはコンピュータシステムにリクエストが到達した時点からレスポンスが出力する時点までの経過時間を意味する。
The response time monitored by the response
また、監視対象の負荷量として、一定の時間単位毎のジョブの同時実行数を用いる。 In addition, the simultaneous execution number of jobs for each fixed time unit is used as the load amount to be monitored.
コンピュータで同時期に実行されているジョブ数(同時実行数)の増加に応じて応答時間が増加し、ハードウェア資源が飽和すると応答時間はジョブの同時実行数の増加分を超えて増加する。 The response time increases as the number of jobs (simultaneous executions) executed on the computer at the same time increases. When hardware resources are saturated, the response time increases beyond the increase in the number of jobs executed simultaneously.
応答時間監視装置1は、監視対象のコンピュータ上で実行されるジョブ種毎の応答時間と共に、一定時間内に実行されているジョブ種毎(ジョブ種単独)の同時実行数と全てのジョブ(全ジョブ合計)の同時実行数とを計測する。
The response
そして、応答時間監視装置1は、学習フェーズとして、ジョブ種毎に、その応答時間と2つの種類の同時実行数それぞれとの対応関係を求め、全ジョブ合計とジョブ種単独とどちらの種類の同時実行数とより相関するかを評価し、より相関すると評価した同時実行数の種類と応答時間との対応関係の直線近似を求め、近似直線から統計上の信頼区間の上限および下限を応答時間の正常範囲として、その閾値(上限値、下限値)を示す応答時間モデルを求めて保持しておく。
Then, as a learning phase, the response
図2は、同時実行数と応答時間の関係の直線近似をもとに応答時間の正常範囲を設定する根拠を説明するための図である。 FIG. 2 is a diagram for explaining the basis for setting the normal range of the response time based on the linear approximation of the relationship between the number of simultaneous executions and the response time.
図2において(a)で示す同時実行数の分布は、個々のジョブが消費する資源(CPU等)の量のばらつきを示している。例えば、同じジョブ種であっても具体的なジョブ内容によって、処理に必要な資源量は異なる。また、同時実行数の増加に伴う応答時間の増加も理論値からのばらつきが生じる。図2において(b)で示す傾きは、競合している資源が単一であって他の資源の待ち時間が発生しない範囲では、ジョブの応答時間の理論値が同時実行数に比例して増加する傾向を示している。 The distribution of the number of simultaneous executions shown in FIG. 2A shows the variation in the amount of resources (such as CPU) consumed by individual jobs. For example, even for the same job type, the amount of resources required for processing varies depending on the specific job content. In addition, an increase in response time accompanying an increase in the number of simultaneous executions also causes a variation from the theoretical value. In FIG. 2, the slope indicated by (b) indicates that the theoretical value of the job response time increases in proportion to the number of concurrent executions in a range where there is a single competing resource and no waiting time for other resources occurs. It shows a tendency to.
図2において(c)で示す近似直線からの増分は、資源利用間の依存関係によって発生する他の競合資源の待ち時間を示しており、ジョブの同時実行数が多くなると発生しやすくなる。 In FIG. 2, the increment from the approximate straight line indicated by (c) indicates the waiting time of other competing resources generated due to the dependency between resource usage, and is likely to occur when the number of jobs executed simultaneously increases.
図2において(d)で示す部分は、ある資源が完全に飽和した場合には、それ以上の同時実行が処理しきれないことにより、ジョブの同時実行数の増加が待ち時間の増加にそのまま繋がり、生じた待ち時間によって応答時間が等比級数的に増加することを示している。したがって、(d)の部分のように、計測された応答時間が近似直線から信頼区間を超える場合は、資源が完全に飽和しているとみなすことができ、監視対象での問題発生による応答時間の増加として管理者へのアラートが必要となる。応答時間監視装置1は、図2の(a)〜(c)に該当する応答時間と(d)の部分に該当する応答時間とを区別して、(d)に該当する応答時間の増加をアラート対象とする。
In FIG. 2, the part indicated by (d) indicates that when a certain resource is completely saturated, further concurrent execution cannot be processed, so that the increase in the number of concurrent executions of jobs directly leads to an increase in waiting time. It shows that the response time increases geometrically due to the generated waiting time. Therefore, when the measured response time exceeds the confidence interval from the approximate line as in the part (d), it can be considered that the resource is completely saturated, and the response time due to the occurrence of a problem in the monitoring target As an increase in the number of alerts, alerts to administrators are required. The response
その後、応答時間監視装置1は、診断フェーズとして、一定時間毎に全ジョブの開始時刻および終了時刻を取得して、ジョブ種毎に、平均応答時間を計算し、学習結果である応答時間モデルで定められた種別の同時実行数と平均応答時間から正常範囲の閾値を決定し、計算した応答時間が閾値を超える場合にそのジョブ種をアラート対象(応答時間が正常範囲を超えたジョブ種)として出力する。
After that, the response
図3は、応答時間監視装置1が実施されるシステムの構成例を示す図である。
FIG. 3 is a diagram illustrating a configuration example of a system in which the response
応答時間監視装置1の監視対象は、ウェブ(Web)サーバ21、データベース(DB)サーバ22等を含むコンピュータシステム(以下、監視対象システムと呼ぶ)2である。監視対象システム2のWebサーバ21、DBサーバ22はネットワークスイッチ3に接続する。Webサーバ21は、さらにプロキシ(ファイアウォール)4を介してインターネット5に接続し、クライアント6のリクエストに対してレスポンスを返してサービスを提供する。
The monitoring target of the response
応答時間監視装置1は、監視対象システム2とプロキシ4との間に設けられたネットワークスイッチ3に接続する。また、応答時間監視装置1は、ネットワークスイッチ3に接続する性能監視サーバ7の内部機能として実施されてもよい。
The response
応答時間監視装置1は、ネットワークスイッチ3が持つポートミラーリング機能を用いて、監視対象システム2のWebサーバ21−DBサーバ22間、Webサーバ21−クライアント6間で送受信されるパケットデータ(IPパケット)を収集する。
The response
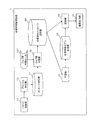
図4は、応答時間監視装置1の一実施例における機能ブロック構成例を示す図である。
FIG. 4 is a diagram showing a functional block configuration example in one embodiment of the response
応答時間監視装置1は、応答時間監視処理を実行するために、パケット収集部11、プロトコル解析部12、ジョブ種分類部13、学習部14、診断部15、結果出力部16を備え、さらに、データ保管場所として、メッセージ記憶部17、分類済みメッセージ記憶部18、応答時間モデル記憶部19を備える。
The response
パケット収集部11は、監視対象システム2のWebサーバ21−DBサーバ22間、Webサーバ21−クライアント6間で所定の時間内に送受信されたパケットデータ(IPパケット)のストリームをネットワークスイッチ3から収集し、各パケットデータに取得時刻を付加する。応答時間監視装置1が性能監視サーバ7の内部機能として実施される場合は、パケット収集部11は、性能監視サーバ7のタイムスタンプ機能によりタイムスタンプ(取得時刻)が付加されたパケットデータを収集する。
The
プロトコル解析部12は、パケット収集部11が収集したパケットデータのプロトコルを解析し、メッセージの種類(リクエスト(request)、レスポンス(response)等)、パケットデータの送信元および送信先のIPアドレス、ポート番号、セッション番号、コマンド名、CGIのパラメータ等を抽出し、抽出した情報と取得時刻とを含むプロトコルメッセージをメッセージ記憶部17に記憶する。
The
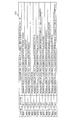
図5は、メッセージ記憶部17に記憶されているプロトコルメッセージの例を示す図である。
FIG. 5 is a diagram illustrating an example of protocol messages stored in the
各プロトコルメッセージは、パケットの取得時刻、セッション番号、送信元および送信先のIPアドレスおよびポート番号、コマンド名、メッセージの種類等を含む。例えば、図5に示す番号=1のプロトコルメッセージは、パケットの取得時刻「2009/09/07 12:12:04.787360」、セッション番号「132290-1」、メッセージの送信元のIPアドレス「194.185.39.24」とポート番号「51272」、送信先のIPアドレス「194.23.5.226」とポート番号「10443」、プロトコルの種類「Request HTTP」を含む。 Each protocol message includes a packet acquisition time, a session number, a source and destination IP address and port number, a command name, a message type, and the like. For example, the protocol message of number = 1 shown in FIG. 5 includes a packet acquisition time “2009/09/07 12: 12: 04.787360”, a session number “132290-1”, and a message source IP address “194.185.39.24”. ", Port number" 51272 ", destination IP address" 194.23.5.226 ", port number" 10443 ", and protocol type" Request HTTP ".
ジョブ種分類部13は、プロトコルメッセージをジョブ毎に分類してリクエストとレスポンスのメッセージを紐付け、ジョブ種分類ルール131に基づいてジョブ種に分類したプロトコルメッセージを分類済みメッセージ記憶部18に記憶する。
The job
図5に示すプロトコルメッセージの例では、番号=1、20のリクエストとレスポンスのプロトコルメッセージが同一ジョブとして紐付けられ、番号9、10のリクエストとレスポンスのプロトコルメッセージが同一ジョブとして紐付けられる。
In the example of the protocol message shown in FIG. 5, the request and response protocol messages with numbers = 1 and 20 are associated with the same job, and the request and response protocol messages with
ジョブ種分類ルール131は、プロトコルメッセージに含まれるジョブ内容からジョブ種を特定するための規則を示す情報である。
The job
Webサーバ21とクライアント6の間ではHTTPメッセージが送受信されている。HTTPメッセージは、「http://www.server.com/job/type.jsp?param1=foo¶m2=bar」のような識別子でリクエストされ、Webサーバ21(www.server.comというサーバ)ではリクエストに対して「/job/type.jsp」のようなアドレス表記で指定されるコンテンツをレスポンスとして返却する。
HTTP messages are transmitted and received between the Web server 21 and the
Webサーバ21とDBサーバ22の間ではSQLによる問い合わせとその問い合わせ結果が送受信されている。例えば「SELECT 従業員番号 FROM 従業員テーブル WHERE 従業員ID=00001」という問い合わせに対して、DBサーバ22は、「従業員テーブル」から「従業員ID=00001」という条件にあうデータを検索し、問い合わせ結果をWebサーバ21に返却する。
Between the Web server 21 and the
ジョブ種分類部13は、HTTPプロトコルのジョブ種では、ジョブ種分類ルール131に基づいて、アドレス毎に1種類、またはアドレスと一部のCGIパラメータとの組み合わせ(例えば、/job/type.jsp?param2=ba)からジョブ種を決める。
In the HTTP protocol job type, the job
図6は、HTTPプロトコルのジョブ種の分類ルールを示す図である。 FIG. 6 is a diagram showing classification rules for job types of the HTTP protocol.
HTTPプロトコルのジョブ種分類ルール131は、コマンド名、アドレス内のローカルアドレスの一部、CGIパラメータの一部を用いて各ジョブ種を特定することを表している。
A job
また、ジョブ種分類部13は、DBプロトコルのジョブ種では、ジョブ種分類ルール131に基づいてSQLを抽象化したもの、例えば「従業員テーブルにアクセスするSELECT文」のようにしたものを1つのジョブ種として決める。
Further, the job
図7は、DBプロトコルのジョブ種の分類ルールを示す図である。 FIG. 7 is a diagram illustrating a classification rule for a job type of the DB protocol.
DBプロトコルメッセージのジョブ種分類ルール131は、コマンド名、およびSQL文の内容を抽象化する変換ルールでジョブ種を特定することを表している。
The job
学習部14は、分類済みメッセージ記憶部18に記憶されたジョブ種で分類されたプロトコルメッセージを学習データとして入力し、ジョブ種毎に応答時間の正常範囲を示す閾値を示す応答時間モデル(モデル式)を求める。
The
診断部15は、予め設定された一定時間毎に、分類済みメッセージ記憶部18に記憶されたジョブ種で分類されたプロトコルメッセージのデータストリームを入力し、応答時間モデル記憶部19に記憶された応答時間モデルを用いて、計測された各ジョブ種の応答時間が正常範囲内であるかを判断する。
The
結果出力部16は、診断部15が、正常範囲を超えた応答時間と判断したジョブ種をアラートとして出力する。
The
メッセージ記憶部17は、収集した取得時刻付のプロトコルメッセージを記憶する。
The
分類済みメッセージ記憶部18は、ジョブ種で分類された取得時刻付のプロトコルメッセージを記憶する。
The classified
応答時間モデル記憶部19は、学習部14で得た各ジョブ種の応答時間の正常範囲を示す応答時間モデルを記憶する。
The response time
次に、応答時間監視装置1の学習部14の学習処理(学習フェーズ)をより詳しく説明する。
Next, the learning process (learning phase) of the
学習部14は、分類済みメッセージ記憶部18に記憶された一定の時間に収集されたプロトコルメッセージを学習データとし、以下の処理を行う。
The
(1)学習データを予め定めた一定の時間間隔に分割する。さらに、ジョブ毎に紐付けたリクエストのプロトコルメッセージの取得時刻を開始時刻、レスポンスのプロトコルメッセージの取得時刻を終了時刻として各ジョブの応答時間を計算する。 (1) The learning data is divided into predetermined time intervals. Further, the response time of each job is calculated with the acquisition time of the protocol message of the request associated with each job as the start time and the acquisition time of the response protocol message as the end time.
図8は、一定の時間間隔に分割した各細分化区間および各ジョブの応答時間の例を示す図である。 FIG. 8 is a diagram illustrating an example of each subdivision section divided into fixed time intervals and the response time of each job.
図8において、矩形は1つのジョブを示し、矩形の下の値は当該ジョブの応答時間(ミリ秒[ms])、矩形内のDn(nは1、2、…)は当該ジョブのジョブ種を表している。 In FIG. 8, the rectangle indicates one job, the value below the rectangle is the response time of the job (millisecond [ms]), and Dn (n is 1, 2,...) In the rectangle is the job type of the job. Represents.
(2)学習データを予め定めた時間間隔に分割し、分割した区間(細分化区間:100ms)内で、全ジョブ合計の平均同時実行数、ジョブ種単独の平均同時実行数、各ジョブ種の平均応答時間を、以下の式で計算する。 (2) The learning data is divided into predetermined time intervals, and within the divided section (subdivided section: 100 ms), the average number of simultaneous executions of all jobs, the average number of simultaneous executions of job types alone, The average response time is calculated with the following formula:
全ジョブ合計の平均同時実行数=全ジョブの応答時間の合計/細分化区間
ジョブ種単独の平均同時実行数=当該ジョブ種の応答時間/細分化区間
各ジョブ種の平均応答時間=当該ジョブ種の全応答時間/当該ジョブ種の平均同時実行数
なお、2つの細分化区間にまたがるジョブは、応答時間を各細分化区間で案分してそれぞれの応答時間とする。
Average number of simultaneous executions of all jobs = total of response times of all jobs / subdivision interval Average number of simultaneous executions of job type alone = response time of the job type / subdivision interval Average response time of each job type = job type Total response time / average number of concurrent executions of the job type Note that for a job that spans two subdivision sections, the response time is prorated for each subdivision section, and each response time is used.
図9は、同時実行数と応答時間の計算例を示す図である。 FIG. 9 is a diagram illustrating a calculation example of the simultaneous execution number and the response time.
学習データの各ジョブの応答時間が図7に示す状態である場合に、それぞれ以下の計算となる。例えば、
全ジョブ合計の平均同時実行数
=(12+11+58+11+15+30+38+9+7+10)/100
=2.01、
ジョブ種D1のジョブ種単独の平均同時実行数
=(11+15+9)/100=0.35、
ジョブ種D1の各ジョブ種の応答時間
=(11+15+9)/3=11.7
となる。
When the response time of each job of learning data is in the state shown in FIG. 7, the following calculations are performed. For example,
Average number of simultaneous executions of all jobs = (12 + 11 + 58 + 11 + 15 + 30 + 38 + 9 + 7 + 10) / 100
= 2.01,
Average number of simultaneous executions of job type D1 job type alone = (11 + 15 + 9) /100=0.35,
Response time of each job type of job type D1 = (11 + 15 + 9) /3=11.7
It becomes.
ジョブ種D2の場合は、3番目に実行されたジョブが2つの細分化区間T1、T2で案分されるため、
ジョブ種D2のジョブ種単独の平均同時実行数
=(30+38+10)/100=0.78、
ジョブ種D2の各ジョブ種の平均応答時間
=(30+38+10)/1+1+10/34=34.0
となる。
In the case of job type D2, the job executed third is prorated in two subdivision sections T1 and T2,
Average number of simultaneous executions of job type D2 job type alone = (30 + 38 + 10) /100=0.78,
Average response time for each job type of job type D2 = (30 + 38 + 10) /1+1+10/34=34.0
It becomes.
(3)上記(2)の計算結果から、細分化区間数分の「全ジョブ合計の平均同時実行数、当該ジョブ種の応答時間」の第1の組データと、「当該ジョブ種のジョブ種単独の同時実行数、当該ジョブ種の平均応答時間」の第2の組データとを生成する。 (3) From the calculation result of (2) above, the first set data of “average total number of simultaneous executions of all jobs, response time of the job type” for the number of subdivision sections, and “job type of the job type” The second set data of “the number of independent simultaneous executions and the average response time of the job type” is generated.
(4)各ジョブ種について、生成した2種の組データそれぞれに対応するグラフを用意し、各細分化区間での平均同時実行数と当該ジョブ種の平均応答時間との対応関係を各グラフ上にプロットする。 (4) For each job type, a graph corresponding to each of the two types of generated set data is prepared, and the correspondence between the average number of concurrent executions in each segment and the average response time of the job type is displayed on each graph. Plot to.
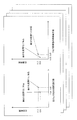
図10は、同時実行数と応答時間の対応関係のプロット例を示す図である。 FIG. 10 is a diagram illustrating a plot example of the correspondence relationship between the number of concurrent executions and the response time.
図10の左側に示すグラフは、全ジョブ合計の同時実行数を横軸に応答時間を縦軸とするグラフであり、ジョブ種D1の第1の組データに基づく各細分区間での平均同時実行数と平均応答時間との対応関係をプロットしたものである。 The graph shown on the left side of FIG. 10 is a graph with the horizontal axis representing the total number of simultaneous executions of all jobs and the vertical axis representing response time, and the average simultaneous execution in each subdivision section based on the first set data of job type D1. The correspondence between the number and the average response time is plotted.
図10の右側に示すグラフは、ジョブ種単独の同時実行数を横軸に応答時間を縦軸にとるグラフであり、ジョブ種D1の第2の組データに基づく各細分化区間での平均同時実行数と平均応答時間との対応関係をプロットしたものである。 The graph shown on the right side of FIG. 10 is a graph in which the horizontal axis represents the number of simultaneous executions of a job type alone and the vertical axis represents response time. The average simultaneous number in each subdivision section based on the second set data of the job type D1. The correspondence between the number of executions and the average response time is plotted.
図10に示す2種のグラフが各ジョブ種について生成される。 Two types of graphs shown in FIG. 10 are generated for each job type.
(5)上記(4)で生成した2つのグラフ上で、それぞれ、例えば最小二乗法で近似直線を得て、プロットされた各対応関係と近似直線との乖離の程度を求めて、直線近似の度合いがより高い方のグラフを選択する。最小二乗法は、残差(実測の応答時間−f(x))の二乗和が最小となるf(x)を求める計算方法である。 (5) On each of the two graphs generated in (4) above, an approximate straight line is obtained by, for example, the least square method, and the degree of deviation between each plotted correspondence and the approximate straight line is obtained. Select the graph with the higher degree. The least square method is a calculation method for obtaining f (x) that minimizes the sum of squares of the residual (measured response time−f (x)).
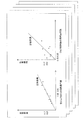
図11は、直線近似および同時実行数の選択を説明するための図である。 FIG. 11 is a diagram for explaining linear approximation and selection of the number of simultaneous executions.
図11に示すグラフによって、左側のグラフの方が直線近似の度合いが高いと判断されたとする。この場合に、左側のグラフが対応する第1の組データの同時実行数の種別が選択され、応答時間モデルとして「全ジョブ合計」の同時実行数が選択される。 Assume that it is determined from the graph shown in FIG. 11 that the left graph has a higher degree of linear approximation. In this case, the type of the number of simultaneous executions of the first set data corresponding to the left graph is selected, and the number of simultaneous executions of “total of all jobs” is selected as the response time model.
ジョブが、例えばCPUのように全ジョブ種共通で使用する資源に相関する場合は、左側のグラフ、すなわち全ジョブ合計の平均同時実行数による対応関係の近似の度合いが高くなる。一方、ジョブが、例えば、トランザクションの排他ロックのようにジョブ種固有で使用する資源に相関する場合は、右側のグラフ、すなわちジョブ種単独の同時実行数による対応関係のほうが近似の度合いが高くなる。 When a job correlates with a resource that is commonly used for all job types, such as a CPU, for example, the degree of approximation of the correspondence relationship by the graph on the left side, that is, the average number of simultaneous executions of all jobs is increased. On the other hand, when a job correlates with a resource that is unique to a job type, for example, an exclusive lock of a transaction, the degree of approximation is higher in the graph on the right side, that is, the correspondence relationship by the number of concurrent executions of the job type alone. .
(6)各ジョブ種について、選択したグラフにおいて、近似直線(平均値)からの応答時間の標準偏差を計算し、さらに、その信頼区間を計算し、信頼区間の上限および下限を計算して応答時間の正常範囲の上限/下限とする。 (6) For each job type, in the selected graph, calculate the standard deviation of the response time from the approximate line (average value), calculate its confidence interval, calculate the upper and lower limits of the confidence interval, and respond The upper limit / lower limit of the normal time range.
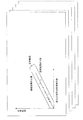
図12は、グラフ上での信頼区間による応答時間の正常範囲の設定例を示す図である。 FIG. 12 is a diagram illustrating an example of setting a normal range of response time based on a confidence interval on a graph.
選択した同時実行数によるグラフをもとに、標準偏差は、直線近似の際に求めた二乗和を、(標本数−1)で割って平方根をとったもので求め、信頼区間(99.99%)は、「近似直線(平均値)±信頼水準の定数(3.89)×標準偏差」で求める。信頼度の定数(3.89)は、99.99%の信頼水準における値であり、標準正規分布表より求めることができる。 Based on the graph based on the selected number of simultaneous executions, the standard deviation is obtained by dividing the sum of squares obtained in the linear approximation by (sample number-1) and taking the square root, and the confidence interval (99.99). %) Is obtained by “approximate straight line (average value) ± confidence level constant (3.89) × standard deviation”. The reliability constant (3.89) is a value at the 99.99% confidence level and can be obtained from the standard normal distribution table.
応答時間の正常範囲の上限値は「f(x)+3.89×標準偏差」で求め、下限値は「f(x)−3.89×標準偏差」で求める。 The upper limit value of the normal range of response time is obtained by “f (x) + 3.89 × standard deviation”, and the lower limit value is obtained by “f (x) −3.89 × standard deviation”.
(7)各ジョブ種の応答時間の正常範囲の上限/下限を示す応答時間モデルを応答時間モデル記憶部19に記憶する。
(7) A response time model indicating the upper limit / lower limit of the normal range of the response time of each job type is stored in the response time
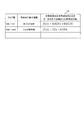
図13は、応答時間モデルの例を示す図である。 FIG. 13 is a diagram illustrating an example of a response time model.
応答時間モデルとして、ジョブ種毎に、同時実行数の種類および応答時間の正常範囲を求める式を記録する。「同時実行数の種類」は、上記(5)で選択された同時実行数の種類(全ジョブ合計、ジョブ種単独)を示す。正常範囲を求める式f(x)のxは、選択した同時実行数の種類で定義された同時実行数である。ここでは、応答時間の正常範囲を求める式として、正常範囲の上限値を求める式が記録されている。 As a response time model, for each job type, an equation for determining the type of the number of concurrent executions and the normal range of the response time is recorded. “Type of concurrent execution number” indicates the type of concurrent execution number selected in (5) above (total of all jobs, job type alone). X in the formula f (x) for obtaining the normal range is the number of concurrent executions defined by the type of the selected number of concurrent executions. Here, an equation for obtaining the upper limit value of the normal range is recorded as an equation for obtaining the normal range of the response time.
次に、応答時間監視装置1の診断部15の診断処理(診断フェーズ)をより詳しく説明する。
Next, the diagnosis process (diagnosis phase) of the
診断部15は、予め設定された一定時間毎に、分類済みメッセージ記憶部18に記憶された一定の時間に収集されたプロトコルメッセージのデータストリームを入力し、以下の処理を行う。
The
(1)ジョブ毎に分類したプロトコルメッセージから紐付けたリクエストのプロトコルメッセージの受信時刻を開始時刻、レスポンスのプロトコルメッセージの受信時刻を終了時刻として各ジョブの応答時間を計算する。 (1) The response time of each job is calculated with the reception time of the protocol message of the request linked from the protocol message classified for each job as the start time and the reception time of the response protocol message as the end time.
(2)全ジョブ合計の平均同時実行数と、ジョブ種毎に、ジョブ種単独の平均同時実行数および各ジョブ種の平均応答時間とを計算する。 (2) The average number of simultaneous executions of all jobs, the average number of simultaneous executions of each job type and the average response time of each job type are calculated for each job type.
(3)各ジョブ種について、応答時間モデル記憶部19に記憶された当該ジョブ種の応答時間モデルを参照し、「同時実行数の種類」に設定された種別(全ジョブ合計またはジョブ種単独)の平均同時実行数で「応答時間の正常範囲を求める式」を用いて当該ジョブ種の応答時間の閾値(上限値、下限値)を求める。
(3) For each job type, the response time model of the job type stored in the response time
(4)各ジョブ種について、計算した平均応答時間が、上記(3)で求めた閾値(上限値)を超えているかを判断する。 (4) For each job type, it is determined whether the calculated average response time exceeds the threshold value (upper limit value) obtained in (3) above.
(5)計算した平均応答時間が閾値を超えている場合に、そのジョブ種を、正常ではない応答時間(遅すぎる応答時間)を記録したジョブ種として出力する。 (5) When the calculated average response time exceeds the threshold, the job type is output as a job type in which an abnormal response time (response time too slow) is recorded.
上記(1)〜(5)の診断処理が一定時間毎に実行され、この間に遅い応答時間を記録したジョブ種のリストがアラートとして出力される。 The diagnosis processes (1) to (5) are executed at regular intervals, and a list of job types in which a slow response time is recorded is output as an alert.
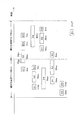
図14および図15は、一実施例における学習処理の処理フロー例を示す図である。 FIG. 14 and FIG. 15 are diagrams illustrating an example of a processing flow of learning processing in one embodiment.
学習部14は、分類済みメッセージ記憶部18から一定時間に収集されたデータを学習データとして入力し、入力データを細分化区間に分割する(ステップS10)。
The
学習部14は、細分化区間が残っている限りループ処理を行う(ステップS11、S17)。
The
学習部14は、その細分化区間における、全ジョブ合計の平均同時実行数を計算する(ステップS12)。
The
さらに、学習部14は、ジョブ種毎にループ処理を行う(ステップS13、S16)。
Further, the
学習部14は、その細分化区間における、選択されたジョブ種単独の平均同時実行数を計算し(ステップS14)、さらに、選択されたジョブ種の平均応答時間を計算する(ステップS15)。
The
さらに、学習部14は、ジョブ種毎にループ処理を行う(ステップS18、S24)。
Further, the
学習部14は、全ジョブ合計の同時実行数と選択されたジョブ種の平均応答時間との関係を直線近似し(ステップS19)、選択されたジョブ種単独の同時実行数とそのジョブ種の平均応答時間との関係を直線近似する(ステップS20)。
The
そして、学習部14は、2つの直線近似の内で近似の度合いが高い方で用いた同時実行数の種別(全ジョブ合計、ジョブ種単独)を選択する(ステップS21)。
Then, the
さらに、学習部14は、各細分化区間について、近似直線(平均値)からの応答時間の差を求め、そこから標準偏差を計算し(ステップS22)、統計上の信頼基準を用いて応答時間の信頼区間を計算し、その上限/下限(直線)を求める式を応答時間の正常範囲(上限/下限)を求める式として応答時間モデル記憶部19に記録し(ステップS23)、全てのジョブ種についてのループ処理終了後に処理を終了する。
Further, the
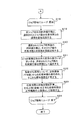
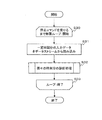
図16は、一実施例における応答時間の診断処理の処理フロー例を示す図である。 FIG. 16 is a diagram illustrating an example of a process flow of a response time diagnosis process according to an embodiment.
診断部15は、停止コマンドを受けるまで無限にループ処理を繰り返す(ステップS30、S33)。診断部15は、分類済みメッセージ記憶部18から一定時間分の入力データをデータストリームから読み込み(ステップS31)、個々の時間分の診断処理を行い(ステップS32)、停止コマンドにより処理を終了する。
The
図17は、一実施例におけるステップS32の診断処理のより詳細な処理フロー例を示す図である。 FIG. 17 is a diagram illustrating a more detailed processing flow example of the diagnostic processing in step S32 in the embodiment.
診断部15は、入力データの区間における、全ジョブ合計の平均同時実行数を計算し(ステップS320)、ジョブ種毎にループ処理を行う(ステップS321、S329)。
The
診断部15は、入力データの区分における、選択されたジョブ種の平均応答時間を計算し(ステップS322)、選択されたジョブ種について、学習部14で定められた同時実行数の種類が「ジョブ種単独」であるかを判定する(ステップS323)。同時実行数算出時の種類が「ジョブ種単独」であれば(ステップS323のY)、入力データの区間における、選択されたジョブ種単独の平均同時実行数を計算し(ステップS324)、同時実行数の種類が「ジョブ種単独」でなければ(ステップS323のN)、入力データの区間における、全ジョブ合計の平均同時実行数を計算し、同時実行数として利用する(ステップS325)。
The
診断部15は、求めた同時実行数に応じた応答時間の閾値(上限値)を応答時間モデルから算出し(ステップS326)、選択されたジョブ種の平均応答時間が閾値(上限値)を超えているかを判定する(ステップS327)。選択されたジョブ種の応答時間が閾値を超えていれば(ステップS327のY)、選択されたジョブ種を応答時間が異常に長いジョブ種として出力する(ステップS328)、選択されたジョブ種の応答時間が閾値を超えていなければ(ステップS327のN)、全てのジョブ種についてのループ処理終了後に処理を終了する。
The
以上説明したように、応答時間監視装置1によれば、学習フェーズにおいて、ジョブ種毎に応答時間が通常取り得る値(正常範囲)を反映した応答時間モデルを得ることによって、診断フェーズにおいて、ジョブ種に応じた応答時間の正常範囲を設定するため、応答時間の自然なばらつきの範囲であればアラートを出力しない。
As described above, according to the response
したがって、応答時間監視装置1がアラートを出力した場合は、応答時間が同時実行数の増加による自然な増加の範囲ではなく、何らかの問題が発生していることがわかる。
Therefore, when the response
また、応答時間監視装置1によれば、ジョブ種毎の同時実行数と応答時間の関係を直線近似することにより学習するため、正常な状態(同時実行数が少ない)時の学習データだけを使って応答時間をモデル化することが可能である。
Further, according to the response
本発明の一態様として開示した応答時間監視装置1によれば、次のような効果がある。
The response
・対処が不要な自然な応答時間の増加についてアラートしないため、無駄なアラートを減少させることができる。 -Since alerts are not issued for natural response time increases that do not need to be addressed, useless alerts can be reduced.
・アラートが本当に問題な状況によるものなのかを診断する手間を省くことができる。例えば、従来行っていたような、普段の応答時間と比較して異常であるかを調査したり、同時実行ジョブ数と突き合わせて、一時的なジョブの混雑なのかを調査したりする必要がなくなる。 ・ It is possible to save the trouble of diagnosing whether the alert is really caused by a problem. For example, there is no need to investigate whether there is an abnormality compared to the usual response time as in the past, or to investigate whether the job is temporarily congested against the number of concurrent jobs. .
・監視対象で資源が飽和した状況のデータが不要であり、通常負荷の場合のデータで学習し応答時間モデルを生成することができる。 -Data on the situation where resources are saturated in the monitoring target is unnecessary, and it is possible to learn from data in the case of normal load and generate a response time model.
これらの効果を奏することにより、応答時間監視装置1は、応答時間の監視をより精度良く行うことができ、コンピュータ上で提供されるサービスの性能安定化をはかることができる。
By exhibiting these effects, the response
開示する応答時間監視装置1を構成する要素は、任意の組合せで実現されてもよい。複数の構成要素が1つの部材として実現されてもよく、1つの構成要素が複数の部材から構成されてもよい。また、応答時間監視装置1は、上述した実施形態に限定されず、本発明の要旨を逸脱しない範囲において各種の改良および変更を行ってもよいことは当然である。
The elements constituting the disclosed response
1 応答時間監視装置
11 パケット収集部
12 プロトコル解析部
13 ジョブ種分類部
131 ジョブ種分類ルール
14 学習部
15 診断部
16 結果出力部
17 メッセージ記憶部
18 分類済みメッセージ記憶部
19 応答時間モデル記憶部
2 監視対象システム
21 Webサーバ
22 DBサーバ
3 ネットワークスイッチ
4 プロキシ
5 インターネット
6 クライアント
7 性能監視サーバ
DESCRIPTION OF
Claims (3)
監視対象コンピュータで一定時間に実行される全ジョブ合計の同時実行数と、各ジョブ種について、ジョブ種単独の同時実行数と該ジョブ種の平均応答時間とを計算し、
前記ジョブ種毎に、該ジョブ種の平均応答時間と全ジョブ合計の同時実行数との第1の対応関係と、該ジョブ種の平均応答時間とジョブ種単独の同時実行数との第2の対応関係とを生成し、
前記ジョブ種毎に、対応する前記第1の対応関係および前記第2の対応関係のうち、該ジョブ種の平均応答時間との相関が高い対応関係を選択し、
予め設定された時間毎に前記監視対象コンピュータで実行される各ジョブの応答時間を取得し、
前記各ジョブの応答時間を、該ジョブのジョブ種に対応して選択された対応関係を用いて決定した閾値をもとにアラート対象とするかを判断する、処理を実行させるための
応答時間監視プログラム。 To monitor the response time of the monitored computer,
Calculate the total number of simultaneous executions of all jobs executed in a certain time on the monitored computer, the number of simultaneous executions of the job type for each job type, and the average response time of the job type,
For each job type, a first correspondence between the average response time of the job type and the total number of simultaneous executions of all jobs, and a second correspondence between the average response time of the job type and the simultaneous execution number of the job type alone And create a correspondence
For each job type, select a correspondence having a high correlation with the average response time of the job type from the corresponding first correspondence and second correspondence.
Obtain the response time of each job executed on the monitored computer at a preset time,
Response time monitoring for executing the processing to determine whether the response time of each job is to be alerted based on the threshold value determined using the correspondence selected corresponding to the job type of the job program.
監視対象コンピュータで一定時間に実行される全ジョブ合計の同時実行数と、各ジョブ種について、ジョブ種単独の同時実行数と該ジョブ種の平均応答時間とを計算し、
前記ジョブ種毎に、該ジョブ種の平均応答時間と全ジョブ合計の同時実行数との第1の対応関係と、該ジョブ種の平均応答時間とジョブ種単独の同時実行数との第2の対応関係とを生成し、
前記ジョブ種毎に、対応する前記第1の対応関係および前記第2の対応関係のうち、該ジョブ種の平均応答時間との相関が高い対応関係を選択し、
予め設定された時間毎に前記監視対象コンピュータで実行される各ジョブの応答時間を取得し、
前記各ジョブの応答時間を、該ジョブのジョブ種に対応して選択された対応関係を用いて決定した閾値をもとにアラート対象とするかを判断する、処理を実行する
応答時間監視方法。 To monitor the response time of a monitored computer, the computer
Calculate the total number of simultaneous executions of all jobs executed in a certain time on the monitored computer, the number of simultaneous executions of the job type for each job type, and the average response time of the job type,
For each job type, a first correspondence between the average response time of the job type and the total number of simultaneous executions of all jobs, and a second correspondence between the average response time of the job type and the simultaneous execution number of the job type alone And create a correspondence
For each job type, select a correspondence having a high correlation with the average response time of the job type from the corresponding first correspondence and second correspondence.
Obtain the response time of each job executed on the monitored computer at a preset time,
A response time monitoring method that executes a process of determining whether the response time of each job is to be alerted based on a threshold value determined using a correspondence selected in correspondence with the job type of the job.
予め設定された時間毎に前記監視対象コンピュータで実行される各ジョブの応答時間を取得し、前記各ジョブの応答時間を、該ジョブのジョブ種に対応して選択された対応関係を用いて決定した閾値をもとにアラート対象とするかを判断する診断部とを備える
応答時間監視装置。
The total number of simultaneous executions of all jobs executed in a certain time on the monitored computer, and for each job type, calculate the number of simultaneous executions of the job type alone and the average response time of the job type, for each job type, Generating a first correspondence between the average response time of the job type and the total number of simultaneous executions of all jobs, and a second correspondence between the average response time of the job type and the number of simultaneous executions of the job type alone A learning unit that selects, for each job type, a correspondence having a high correlation with an average response time of the job type from among the corresponding first correspondence and the second correspondence;
The response time of each job executed on the monitored computer is acquired every preset time, and the response time of each job is determined using the correspondence selected corresponding to the job type of the job A response time monitoring apparatus comprising: a diagnosis unit that determines whether to be an alert target based on the threshold value.
Priority Applications (1)
| Application Number | Priority Date | Filing Date | Title |
|---|---|---|---|
| JP2013004728A JP5974905B2 (en) | 2013-01-15 | 2013-01-15 | Response time monitoring program, method, and response time monitoring apparatus |
Applications Claiming Priority (1)
| Application Number | Priority Date | Filing Date | Title |
|---|---|---|---|
| JP2013004728A JP5974905B2 (en) | 2013-01-15 | 2013-01-15 | Response time monitoring program, method, and response time monitoring apparatus |
Publications (2)
| Publication Number | Publication Date |
|---|---|
| JP2014137635A true JP2014137635A (en) | 2014-07-28 |
| JP5974905B2 JP5974905B2 (en) | 2016-08-23 |
Family
ID=51415115
Family Applications (1)
| Application Number | Title | Priority Date | Filing Date |
|---|---|---|---|
| JP2013004728A Active JP5974905B2 (en) | 2013-01-15 | 2013-01-15 | Response time monitoring program, method, and response time monitoring apparatus |
Country Status (1)
| Country | Link |
|---|---|
| JP (1) | JP5974905B2 (en) |
Cited By (2)
| Publication number | Priority date | Publication date | Assignee | Title |
|---|---|---|---|---|
| JP2020144741A (en) * | 2019-03-08 | 2020-09-10 | みずほ情報総研株式会社 | Job management system, job management method, and job management program |
| JP7522615B2 (en) | 2020-08-28 | 2024-07-25 | 株式会社日立製作所 | Event monitoring device and event monitoring method |
Families Citing this family (1)
| Publication number | Priority date | Publication date | Assignee | Title |
|---|---|---|---|---|
| JP7323776B2 (en) | 2019-06-17 | 2023-08-09 | 日本製鉄株式会社 | Belt conveyor transfer device |
Citations (3)
| Publication number | Priority date | Publication date | Assignee | Title |
|---|---|---|---|---|
| JP2000295312A (en) * | 1999-04-05 | 2000-10-20 | Nec Corp | Device and method for automatically monitoring and controlling terminal response |
| JP2004302547A (en) * | 2003-03-28 | 2004-10-28 | Nri & Ncc Co Ltd | Response monitoring method and device for server system |
| JP2007026303A (en) * | 2005-07-20 | 2007-02-01 | Fujitsu Ltd | System performance monitoring program and method thereof |
-
2013
- 2013-01-15 JP JP2013004728A patent/JP5974905B2/en active Active
Patent Citations (3)
| Publication number | Priority date | Publication date | Assignee | Title |
|---|---|---|---|---|
| JP2000295312A (en) * | 1999-04-05 | 2000-10-20 | Nec Corp | Device and method for automatically monitoring and controlling terminal response |
| JP2004302547A (en) * | 2003-03-28 | 2004-10-28 | Nri & Ncc Co Ltd | Response monitoring method and device for server system |
| JP2007026303A (en) * | 2005-07-20 | 2007-02-01 | Fujitsu Ltd | System performance monitoring program and method thereof |
Cited By (2)
| Publication number | Priority date | Publication date | Assignee | Title |
|---|---|---|---|---|
| JP2020144741A (en) * | 2019-03-08 | 2020-09-10 | みずほ情報総研株式会社 | Job management system, job management method, and job management program |
| JP7522615B2 (en) | 2020-08-28 | 2024-07-25 | 株式会社日立製作所 | Event monitoring device and event monitoring method |
Also Published As
| Publication number | Publication date |
|---|---|
| JP5974905B2 (en) | 2016-08-23 |
Similar Documents
| Publication | Publication Date | Title |
|---|---|---|
| US11442803B2 (en) | Detecting and analyzing performance anomalies of client-server based applications | |
| US7783744B2 (en) | Facilitating root cause analysis for abnormal behavior of systems in a networked environment | |
| US7953847B2 (en) | Monitoring and management of distributing information systems | |
| US10560311B2 (en) | Management apparatus, management method, and recording medium | |
| US8352589B2 (en) | System for monitoring computer systems and alerting users of faults | |
| US9251032B2 (en) | Method, computer program, and information processing apparatus for analyzing performance of computer system | |
| US9491247B2 (en) | Automatic capture of detailed analysis information based on remote server analysis | |
| US7624176B2 (en) | Method and system for programmatically generating synthetic transactions to monitor performance and availability of a web application | |
| US20100153431A1 (en) | Alert triggered statistics collections | |
| US20150120914A1 (en) | Service monitoring system and service monitoring method | |
| JP5471859B2 (en) | Analysis program, analysis method, and analysis apparatus | |
| US20160294603A1 (en) | Dynamic configuration of entity polling using network topology and entity status | |
| JP6160064B2 (en) | Application determination program, failure detection apparatus, and application determination method | |
| CN111597099B (en) | Non-invasive simulation method for monitoring running quality of application deployed on cloud platform | |
| JP2010231368A (en) | Monitoring method and monitoring program | |
| Xu et al. | Lightweight and adaptive service api performance monitoring in highly dynamic cloud environment | |
| US20180095819A1 (en) | Incident analysis program, incident analysis method, information processing device, service identification program, service identification method, and service identification device | |
| US20150012647A1 (en) | Router-based end-user performance monitoring | |
| JP5974905B2 (en) | Response time monitoring program, method, and response time monitoring apparatus | |
| US9645877B2 (en) | Monitoring apparatus, monitoring method, and recording medium | |
| JP2004348640A (en) | Method and system for managing network | |
| CN117370053A (en) | Information system service operation-oriented panoramic monitoring method and system | |
| US20200142746A1 (en) | Methods and system for throttling analytics processing | |
| JP2002099448A (en) | Performance monitoring apparatus and its method | |
| US11757736B2 (en) | Prescriptive analytics for network services |
Legal Events
| Date | Code | Title | Description |
|---|---|---|---|
| A621 | Written request for application examination |
Free format text: JAPANESE INTERMEDIATE CODE: A621 Effective date: 20150903 |
|
| A977 | Report on retrieval |
Free format text: JAPANESE INTERMEDIATE CODE: A971007 Effective date: 20160615 |
|
| TRDD | Decision of grant or rejection written | ||
| A01 | Written decision to grant a patent or to grant a registration (utility model) |
Free format text: JAPANESE INTERMEDIATE CODE: A01 Effective date: 20160621 |
|
| A61 | First payment of annual fees (during grant procedure) |
Free format text: JAPANESE INTERMEDIATE CODE: A61 Effective date: 20160704 |
|
| R150 | Certificate of patent or registration of utility model |
Ref document number: 5974905 Country of ref document: JP Free format text: JAPANESE INTERMEDIATE CODE: R150 |