JP2013520973A - Obesity diagnosis method - Google Patents
Obesity diagnosis method Download PDFInfo
- Publication number
- JP2013520973A JP2013520973A JP2012555405A JP2012555405A JP2013520973A JP 2013520973 A JP2013520973 A JP 2013520973A JP 2012555405 A JP2012555405 A JP 2012555405A JP 2012555405 A JP2012555405 A JP 2012555405A JP 2013520973 A JP2013520973 A JP 2013520973A
- Authority
- JP
- Japan
- Prior art keywords
- genes
- gene
- individual
- species
- microbiome
- Prior art date
- Legal status (The legal status is an assumption and is not a legal conclusion. Google has not performed a legal analysis and makes no representation as to the accuracy of the status listed.)
- Pending
Links
Images


Classifications
-
- C—CHEMISTRY; METALLURGY
- C12—BIOCHEMISTRY; BEER; SPIRITS; WINE; VINEGAR; MICROBIOLOGY; ENZYMOLOGY; MUTATION OR GENETIC ENGINEERING
- C12Q—MEASURING OR TESTING PROCESSES INVOLVING ENZYMES, NUCLEIC ACIDS OR MICROORGANISMS; COMPOSITIONS OR TEST PAPERS THEREFOR; PROCESSES OF PREPARING SUCH COMPOSITIONS; CONDITION-RESPONSIVE CONTROL IN MICROBIOLOGICAL OR ENZYMOLOGICAL PROCESSES
- C12Q1/00—Measuring or testing processes involving enzymes, nucleic acids or microorganisms; Compositions therefor; Processes of preparing such compositions
- C12Q1/68—Measuring or testing processes involving enzymes, nucleic acids or microorganisms; Compositions therefor; Processes of preparing such compositions involving nucleic acids
- C12Q1/6876—Nucleic acid products used in the analysis of nucleic acids, e.g. primers or probes
- C12Q1/6883—Nucleic acid products used in the analysis of nucleic acids, e.g. primers or probes for diseases caused by alterations of genetic material
-
- C—CHEMISTRY; METALLURGY
- C12—BIOCHEMISTRY; BEER; SPIRITS; WINE; VINEGAR; MICROBIOLOGY; ENZYMOLOGY; MUTATION OR GENETIC ENGINEERING
- C12Q—MEASURING OR TESTING PROCESSES INVOLVING ENZYMES, NUCLEIC ACIDS OR MICROORGANISMS; COMPOSITIONS OR TEST PAPERS THEREFOR; PROCESSES OF PREPARING SUCH COMPOSITIONS; CONDITION-RESPONSIVE CONTROL IN MICROBIOLOGICAL OR ENZYMOLOGICAL PROCESSES
- C12Q1/00—Measuring or testing processes involving enzymes, nucleic acids or microorganisms; Compositions therefor; Processes of preparing such compositions
- C12Q1/68—Measuring or testing processes involving enzymes, nucleic acids or microorganisms; Compositions therefor; Processes of preparing such compositions involving nucleic acids
- C12Q1/6876—Nucleic acid products used in the analysis of nucleic acids, e.g. primers or probes
- C12Q1/6888—Nucleic acid products used in the analysis of nucleic acids, e.g. primers or probes for detection or identification of organisms
- C12Q1/689—Nucleic acid products used in the analysis of nucleic acids, e.g. primers or probes for detection or identification of organisms for bacteria
-
- C—CHEMISTRY; METALLURGY
- C12—BIOCHEMISTRY; BEER; SPIRITS; WINE; VINEGAR; MICROBIOLOGY; ENZYMOLOGY; MUTATION OR GENETIC ENGINEERING
- C12Q—MEASURING OR TESTING PROCESSES INVOLVING ENZYMES, NUCLEIC ACIDS OR MICROORGANISMS; COMPOSITIONS OR TEST PAPERS THEREFOR; PROCESSES OF PREPARING SUCH COMPOSITIONS; CONDITION-RESPONSIVE CONTROL IN MICROBIOLOGICAL OR ENZYMOLOGICAL PROCESSES
- C12Q2600/00—Oligonucleotides characterized by their use
- C12Q2600/158—Expression markers
Abstract
本明細書では、ヒトの腸内ミクロビオームに少なくとも一つの遺伝子が不在であるという判定に基づく新規の肥満診断方法が記載されている。
【選択図】なしIn the present specification, a novel method for diagnosing obesity based on the determination that at least one gene is absent in human intestinal microbiome is described.
[Selection figure] None
Description
ヒト腸内微生物叢は、ヒトの健康および福利に対し影響を及ぼすものとして現在充分認知されている複雑な生態系を構成する。それはまさに、免疫系の成熟そして病原体によるコロニー形成に対する直接的障壁に寄与する。20世紀後半全体にわたり、感染症は劇的に減少してきており、主要な病原体は制御できるようになった。同じ時期に、多くの「免疫」疾患が、特に西欧社会において有病率を常に高めてきた。これに該当するのは、アレルギー、炎症性大腸炎、過敏性腸症候群、そして場合によっては代謝性障害や変性疾患、例えば肥満、メタボリック症候群、糖尿病および癌などである。ヒトゲノムの配列から、免疫疾患のリスクの増加と連関する遺伝子を観察することが可能となったが、これらの遺伝子における突然変異は、実際の症例のわずかな部分しか説明できない場合がほとんどであり、遺伝的素因が疾病を実際にひき起こすには環境的誘因が必要である。環境的要素のうち、近年、腸内微生物叢が中心的存在として大きく認知されてきている。 The human gut microbiota constitutes a complex ecosystem now well recognized as having an impact on human health and well-being. It indeed contributes to a direct barrier to immune system maturation and colonization by pathogens. Throughout the second half of the 20th century, infectious diseases have declined dramatically and major pathogens have become controllable. At the same time, many “immune” diseases have consistently increased the prevalence, especially in Western societies. This includes allergies, inflammatory bowel disease, irritable bowel syndrome, and in some cases metabolic disorders and degenerative diseases such as obesity, metabolic syndrome, diabetes and cancer. Although it has become possible to observe genes associated with an increased risk of immune disease from human genome sequences, mutations in these genes can often explain only a small part of actual cases, Environmental incentives are necessary for genetic predisposition to actually cause disease. Among environmental factors, in recent years, the intestinal microbiota has been widely recognized as a central existence.
健康なヒトにおける腸内微生物叢の分子組成の分析は、顕著な個体間変動を指摘しているが、このことは、食物繊維の嫌気的消化などの腸内微生物叢の主要な機能が高度に保存されていることを考慮すると、逆説的であると思われるかもしれない。近年の高性能かつ培養非依存型の分子観察により、種の観点からのみならず遺伝子のレベルでのヒト腸内微生物叢内のコア、すなわち、保存されている主要な機能性に関与する可能性のある保存された一連の要素の記述が可能となった。 Analysis of the molecular composition of the gut microbiota in healthy humans has pointed to significant interindividual variability, which indicates that the major functions of the gut microbiota, such as anaerobic digestion of dietary fiber, are highly It may seem paradoxical considering the preservation. Recent high-performance, culture-independent molecular observations may be involved in the core of the human gut microbiota, ie, the major preserved functionality, at the genetic level as well as from a species perspective It is now possible to describe a series of stored elements with
現在の知識では、ヒト腸内微生物叢の正常な状態、すなわちノルモバイオシス(normobiosis)を特定する基準を定義づけすることが可能になっている。これはさらに、免疫疾患、代謝性疾患または変性疾患における、ノルモバイオシスからの特異的なひずみ、すなわち腸内毒素症を同定することを可能にしている。腸内毒素症を調査することは、ホメオスタシスおよびノルモバイオシスを回復または維持することを目的とする戦略の策定のための重要な情報を提供する最初の段階とみなすことができる。さらに、厳密に定義され充分に表現型が確認された疾病情況において腸内毒素症を特定する基準は、診断モデルを策定するための貴重な要素である。 Current knowledge makes it possible to define criteria that identify the normal state of the human intestinal microflora, namely normobiosis. This further makes it possible to identify specific strains from normobiosis, ie enterotoxiosis, in immune, metabolic or degenerative diseases. Investigating enterotoxiosis can be considered the first step in providing important information for the development of strategies aimed at restoring or maintaining homeostasis and normobiosis. Furthermore, criteria for identifying enterotoxemia in a well-defined and well-identified disease situation are valuable elements for developing a diagnostic model.
これまでは微生物叢の組成および/または多様性に限定されてきたものの、複数の疾患について腸内毒素症が疑われてきており、例えば肥満などいくつかの症例において、すでに部分的に記載されている。実際、我々のミクロビオームおよび健康表現型を直接変調させる上で決定的役割を果たしているのは、栄養である。バランスの悪い食生活は、腸内ミクロビオームを、健康のパートナーから慢性疾患における「病原体」へと変えてしまう可能性がある。証拠を積み重ねることにより、食生活が崩壊させた腸内微生物叢によって誘発される低悪性度の全身性かつ慢性の炎症を原因として、肥満および関連する代謝性疾患が発現するという仮説が裏づけられる。したがって、肥満を一貫性ある形で診断できるようにする新規の信頼性の高い方法に対するニーズがなおも存在する。 Although previously limited to the composition and / or diversity of the microflora, enterotoxemia has been suspected for multiple diseases and has already been partially described in some cases, such as obesity. Yes. Indeed, nutrition plays a crucial role in directly modulating our microbiome and health phenotype. An unbalanced diet can change the intestinal microbiome from a healthy partner to a “pathogen” in chronic diseases. Accumulating evidence supports the hypothesis that obesity and related metabolic diseases develop due to low-grade systemic and chronic inflammation induced by gut microbiota that disrupted diet. Therefore, there is still a need for new and reliable methods that allow obesity to be diagnosed in a consistent manner.
大部分の腸内片利共生生物は、培養不能である。この制限を克服するためにゲノム戦略が開発されてきた(HamadyおよびKnight、Genome Res、19:1141−ll52、2009)。これらの戦略は、微生物叢のゲノムに含まれる遺伝子の集合体としてミクロビオームを定義づけすることを可能にした(Turnbaughら、Nature、449:804−8010、2007;HamadyおよびKnight、Genome Res.、19:1141−1152、2009)。ヒト腸内微生物叢の系統発生学上の核を構成する全ての個体が共有する少数の種の存在が、実証されている(Tapら、Environ Microbiol.、11(10):2574−2584、2009)。近年、メタゲノム解析は、576.7ギガベースの配列に対応するヒトの腸の330万個の非冗長微生物遺伝子の広範なカタログを同定するに至った(Qinら、Nature、2010、doi:10.1038/nature08821)。 Most intestinal commensals are not culturable. Genomic strategies have been developed to overcome this limitation (Hamady and Knight, Genome Res, 19: 1141-ll52, 2009). These strategies made it possible to define the microbiome as a collection of genes contained in the microbiota genome (Turnbaugh et al., Nature, 449: 804-8010, 2007; Hamady and Knight, Genome Res., 19 : 1141-1152, 2009). The existence of a small number of species shared by all individuals that make up the phylogenetic nucleus of the human gut microbiota has been demonstrated (Tap et al., Environ Microbiol., 11 (10): 2574-2584, 2009). ). In recent years, metagenomic analysis has led to the identification of an extensive catalog of 3.3 million non-redundant microbial genes in the human intestine corresponding to 576.7 gigabase sequences (Qin et al., Nature, 2010, doi: 10.1038). / Nature08882).
発明者らは、異なる個体におけるヒトの糞便由来のDNA断片の単離および配列決定に基づく方法を使用した。腸由来の微生物遺伝子の広範なカタログが現在入手可能であることから(Qinら、Nature、2010、doi:10.1038/nature08821)、特定の個体群(例えば肥満を患う患者群)における特定の配列のコピー数および頻度を計算することができる。こうして、特定の遺伝子の存在または不在と特定の病状の存在または不在との間の任意の相関関係を同定することが可能である。さらに、個体内の特定の遺伝子のコピー数を決定することが可能である。 The inventors used a method based on the isolation and sequencing of DNA fragments from human feces in different individuals. Because an extensive catalog of intestinal-derived microbial genes is now available (Qin et al., Nature, 2010, doi: 10.1038 / nature08882), specific sequences in specific populations (eg, patients with obesity) Copy number and frequency can be calculated. In this way, it is possible to identify any correlation between the presence or absence of a particular gene and the presence or absence of a particular disease state. Furthermore, it is possible to determine the copy number of a particular gene within an individual.
発明者らは、肥満患者群と痩せ型の健康な人の対照群との間で著しく異なっている遺伝子を同定することができた。これらの遺伝子は表1に列挙されている。前記遺伝子は、患者の場合よりも痩せ型の個体の場合の方が多い。この観察結果は、微生物遺伝子の総数が両方の個体群において異なるものでないため、統計学的に有意である。したがって、肥満を患う個体においては特定のヒト腸内微生物遺伝子の喪失が存在する。 The inventors were able to identify genes that were significantly different between the obese patient group and the lean healthy control group. These genes are listed in Table 1. The gene is more common in lean individuals than in patients. This observation is statistically significant because the total number of microbial genes is not different in both populations. Thus, there is a loss of certain human intestinal microbial genes in individuals suffering from obesity.
本発明の第1の態様は、少なくとも一つの遺伝子が個体の腸内ミクロビオームに不在であるか否かを判定するステップを含む、肥満診断方法である。「個体の腸内ミクロビオーム」とは、本明細書において、前記個体の微生物叢を構成する全ての遺伝子のことである。したがって、「個体の腸内ミクロビオーム」という用語は、前記個体の腸内に存在する全ての細菌の全ての遺伝子に対応する。 The first aspect of the present invention is a method for diagnosing obesity comprising the step of determining whether or not at least one gene is absent in an intestinal microbiome of an individual. The “intestinal microbiome” of the individual refers to all genes constituting the microflora of the individual in the present specification. Thus, the term “intestinal microbiome of an individual” corresponds to all genes of all bacteria present in the intestine of said individual.
遺伝子は、ミクロビオーム中のそのコピー数が一定の閾値よりも低い場合に、ミクロビオームに不在である。本発明によると、「閾値」とは、問題の遺伝子のコピー数が個体のミクロビオーム中のコピー数の高低に対応している試料の判別を可能にする値を意味するように意図されている。詳細には、コピー数が閾値以下である場合には、ミクロビオーム中のこの遺伝子のコピー数は低いとみなされ、一方コピー数が閾値を超える場合には、ミクロビオーム中のこの遺伝子のコピー数は高いとみなされる。低いコピー数とは、遺伝子がミクロビオームに不在であることを意味し、一方、高いコピー数は、遺伝子がミクロビオーム中に存在することを意味する。各々の遺伝子で、そして遺伝子のコピー数の測定に用いられる方法に応じて、最適な閾値は変動する場合がある。しかしながら、当業者であれば、コピー数(高低)がこの特定の遺伝子について公知である複数の個体のミクロビオームの解析に基づいて、かつ対照遺伝子のコピー数との比較に基づいて、それを容易に判定できる。 A gene is absent from a microbiome when its copy number in the microbiome is below a certain threshold. According to the present invention, a “threshold” is intended to mean a value that allows discrimination of samples whose copy number of the gene in question corresponds to the copy number in the individual's microbiome. Specifically, if the copy number is below the threshold, the copy number of this gene in the microbiome is considered low, whereas if the copy number exceeds the threshold, the copy number of this gene in the microbiome is high Is considered. Low copy number means that the gene is absent from the microbiome, while high copy number means that the gene is present in the microbiome. The optimal threshold may vary for each gene and depending on the method used to determine the copy number of the gene. However, one of ordinary skill in the art can easily do this based on analysis of the microbiome of multiple individuals whose copy number (high and low) is known for this particular gene and on comparison with the copy number of the control gene. Can be judged.
本発明の方法はこうして、当業者が個体の腸内ミクロビオーム由来の遺伝子の存在または不在のみに基づいて病状を診断できるようにする。特定の遺伝子のコピー数とこの遺伝子を有する細菌細胞の数との間には直接的相関関係が存在する。本発明の方法はこうして、当業者がミクロビオームの解析により、腸内毒素症、すなわち微生物の平衡失調を検出できるようにする。腸内の種は、大部分が培養不能であるため、その全てが同定されているわけではなく、また同定は困難である。さらに、所与の個体の腸内に発見される大部分の種は希有であり、そのため、それらの検出は困難になっている(HamadyおよびKnight、Genome Res.、19:1141−1152、2009)。本発明のこの第1の態様において、前記遺伝子が帰属する細菌種の事前の同定は全く必要とされない。したがって、本発明の診断方法は、公知の腸内細菌種の個体群における変化を判定することに制限されず、分類学的にまだ特徴づけされていない細菌をも包含する。 The method of the present invention thus allows one skilled in the art to diagnose a disease state based solely on the presence or absence of a gene derived from an individual's intestinal microbiome. There is a direct correlation between the copy number of a particular gene and the number of bacterial cells carrying this gene. The method of the present invention thus enables one skilled in the art to detect enterotoxemia, i.e., microbial imbalance, by microbiome analysis. Since most intestinal species are not culturable, not all of them have been identified and are difficult to identify. In addition, most species found in the gut of a given individual are rare, making them difficult to detect (Hamady and Knight, Genome Res., 19: 1141-1152, 2009). . In this first aspect of the invention, no prior identification of the bacterial species to which the gene belongs is required. Thus, the diagnostic methods of the present invention are not limited to determining changes in a population of known enteric bacterial species, but also include bacteria that have not yet been taxonomically characterized.
前記個体の腸内微生物DNAの試料を得るための方法はいくつか存在する(Sokolら、Inflamm.Bowel Dis.、14(6):858−867、2008)。例えば、結腸鏡検査によって得られる粘膜標本または生検材料を調製することが可能である。しかしながら、結腸鏡検査は、研究毎の採取手順が明確に定義されていない侵襲的処置である。同様にして、外科的処置を通して生検材料を得ることもまた可能である。しかしながら、結腸鏡検査よりもさらに増して、外科的処置は侵襲的処置であり、微生物個体群に対するその影響は未知である。好適であるのは、糞便分析であり、これは当該技術分野において信頼されて使用されてきた手順である(Bullockら、Curr Issues Intest Microbiol.;5(2):59−64、2004;Manichanhら、Gut、55:205−211、2006;Bakirら、Int J Syst Evol Microbiol、56(5):931−935、2006;Manichanhら、Nucl.Acids Res.、36(16):5180−5188、2008;Sokolら、Inflamm.Bowel Dis.、14(6):858−867、2008)。この手順の一例は、実験例の方法の節で記載されている。糞便は、1グラム(湿重量)あたり約1011個の細菌細胞を含み、細菌細胞は糞塊の約50%を構成する。糞便の微生物叢は、主に遠位大腸の微生物学を代表するものである。したがって、個体の糞便由来の微生物DNAを大量に単離し解析することは可能である。「微生物DNA」とは、本明細書において、ヒトの腸の常在細菌集団のいずれかに由来するDNAのことである。「微生物DNA」という用語は、コード配列と非コード配列の両方を包含する。詳細には、それは、完全な遺伝子に限定されず、コード配列のフラグメントをも含む。したがって、糞便の分析は非侵襲的処置であり、患者毎に直接比較可能で一貫性のある結果を提供する。 There are several methods for obtaining samples of intestinal microbial DNA of the individual (Sokol et al., Inflamm. Bowel Dis., 14 (6): 858-867, 2008). For example, it is possible to prepare mucosal specimens or biopsy materials obtained by colonoscopy. However, colonoscopy is an invasive procedure where the collection procedure for each study is not clearly defined. Similarly, it is also possible to obtain biopsy material through surgical procedures. However, even more than colonoscopy, surgical procedures are invasive procedures and their effects on microbial populations are unknown. Preferred is fecal analysis, which is a procedure that has been used reliably in the art (Bullock et al., Curr Issues Intest Microbiol .; 5 (2): 59-64, 2004; Manichanh et al. , Gut, 55: 205-211, 2006; Bakir et al., Int J Syst Evol Microbiol, 56 (5): 931-935, 2006; Manichanh et al., Nucl. Acids Res., 36 (16): 5180-5188, 2008. Sokol et al., Inflamm. Bowel Dis., 14 (6): 858-867, 2008). An example of this procedure is described in the Experimental Methods section. Feces contain about 10 11 bacterial cells per gram (wet weight), which make up about 50% of the fecal mass. The faecal microbiota is primarily representative of the microbiology of the distal colon. Therefore, it is possible to isolate and analyze a large amount of microbial DNA derived from feces of an individual. “Microbial DNA” as used herein refers to DNA derived from any of the resident bacterial populations of the human intestine. The term “microbial DNA” encompasses both coding and non-coding sequences. In particular, it is not limited to a complete gene, but also includes fragments of the coding sequence. Thus, fecal analysis is a non-invasive procedure that provides direct and comparable results from patient to patient.
したがって、好ましい実施形態においては、本発明の方法は、前記個体の糞便に由来する微生物DNAを得るステップを含む。さらに好ましい実施形態においては、前記個体由来の糞便が採取され、DNAが抽出され、個体の腸内ミクロビオームにおける少なくとも一つの遺伝子の存在または不在が判定される。遺伝子の存在または不在は、当業者にとって公知のあらゆる方法によって判定されてよい。例えば、前記個体のミクロビオーム全体の配列を決定し、前記遺伝子の存在または不在を、バイオインフォマティクスの手法を用いて検索してよい。このような戦略の一例は、実験例の方法の節で記載されている。代替的には、問題の遺伝子を、特異的プローブでのハイブリダイゼーション、例えばサザンハイブリダイゼーションによってミクロビオーム中で探してもよい。この特定の実施形態においてはサザンハイブリダイゼーションが完璧に適してはいるものの、それでもマイクロアレイを使用する方がさらに便利でかつ高感度であるということは、当業者には直ちに明らかである。さらに別の実施形態において、問題の遺伝子の存在は、増幅、詳細には定量的PCR(qPCR)によって検出されてよい。これらの技術(サザン、マイクロアレイ、qPCRなど)は現在、当業者が日常的に使用しているものであり、したがってここで詳述する必要はない。 Accordingly, in a preferred embodiment, the method of the present invention comprises obtaining microbial DNA derived from the stool of said individual. In a further preferred embodiment, feces from the individual are collected, DNA is extracted, and the presence or absence of at least one gene in the intestinal microbiome of the individual is determined. The presence or absence of a gene may be determined by any method known to those skilled in the art. For example, the sequence of the entire microbiome of the individual may be determined, and the presence or absence of the gene may be searched using bioinformatics techniques. An example of such a strategy is described in the Experimental Methods section. Alternatively, the gene of interest may be looked for in the microbiome by hybridization with a specific probe, such as Southern hybridization. Although Southern hybridization is perfectly suitable in this particular embodiment, it will be readily apparent to those skilled in the art that using a microarray is still more convenient and sensitive. In yet another embodiment, the presence of the gene of interest may be detected by amplification, in particular quantitative PCR (qPCR). These techniques (Southern, microarray, qPCR, etc.) are now routinely used by those skilled in the art and therefore need not be detailed here.
別の好ましい実施形態において、個体の腸内ミクロビオームでの不在または存在が判定される遺伝子は、表1に列挙されている遺伝子群から選択される。当業者であれば、テストされる遺伝子の数が多くなればなるほど結果の信頼度は高くなるということを難なく理解するであろう。別のさらなる好ましい実施形態によると、本発明の方法は、表1に列挙される遺伝子の少なくとも50%、より好ましくは表1の遺伝子の少なくとも75%、さらに一層好ましくは表1の遺伝子の少なくとも90%の存在または不在を決定するステップを含む。 In another preferred embodiment, the gene whose absence or presence in the intestinal microbiome of the individual is determined is selected from the group of genes listed in Table 1. One skilled in the art will readily understand that the greater the number of genes tested, the more reliable the results. According to another further preferred embodiment, the method of the invention comprises at least 50% of the genes listed in Table 1, more preferably at least 75% of the genes of Table 1, even more preferably at least 90 of the genes of Table 1. Determining the presence or absence of%.
微生物叢内に見出される多数の細菌種が同定されていないものの、大部分の細菌がBacteroides、Clostridium、Fusobacterium、Eubacterium、Ruminococcus、Peptococcus、PeptostreptococcusおよびBifidobacteriumの属に帰属することがわかっている。EscherichiaおよびLactobacillusなどの他の属は、より少ない程度で存在する。これらの属に帰属する個別の種の中には同定されているものもあり、これらの種の遺伝子の一部は公知である。330万個の非冗長微生物遺伝子の同定を導いた広範なメタゲノム研究から、大部分の新しい配列の割当ても同様に可能になった。所与の種に帰属する遺伝子は、前記種の他の全ての遺伝子と同じ頻度で一個体内に存在する。こうして、本発明の方法を通して同定された遺伝子の各々について、さまざまな個体内で特定の細菌種に属することが公知である一組の遺伝子の存在または不在と前記遺伝子の存在または不在との間に、相関関係が存在するか否かを判定することが可能である。このような相関関係は、未知の遺伝子が前記特定の細菌種に帰属することを表す。したがって、発明者らは、一部の細菌種が肥満と連関し、一方、他の細菌種は痩せ型の表現型と連関する、ということを示した。肥満の表現型は、前記種の線形組合せによって予測され得る。すなわち、一個体の腸内に肥満の表現型と連関する細菌種が多く存在すればするほど、また前記個体の腸内の痩せ型の表現型と連関する種が少なければ少ないほど、前記個体が肥満を患う確率が高くなる。例えば、ある人の腸内のBacteronides pectinophilus、Eubacterium siraeumおよびClostridium phyto fermentansの不在およびAnaerotruncus colihominisの存在は、この人が肥満を患っていることを表す。 Although many bacterial species found in the microflora have not been identified, it is known that most bacteria belong to the genera of Bacteroides, Clostridium, Fusobacterium, Eubacterium, Ruminococcus, Peptococcus, Peptostreptococcus and Bifidobacterium. Other genera such as Escherichia and Lactobacillus are present to a lesser extent. Some individual species belonging to these genera have been identified, and some of the genes of these species are known. The extensive metagenomic work that led to the identification of 3.3 million non-redundant microbial genes has made it possible to assign most new sequences as well. A gene belonging to a given species is present in an individual with the same frequency as all other genes of said species. Thus, for each of the genes identified through the method of the invention, between the presence or absence of a set of genes known to belong to a particular bacterial species in various individuals and the presence or absence of said genes It is possible to determine whether a correlation exists. Such a correlation represents that an unknown gene belongs to the specific bacterial species. Thus, the inventors have shown that some bacterial species are associated with obesity, while other bacterial species are associated with a lean phenotype. The obesity phenotype can be predicted by a linear combination of the species. That is, the more bacterial species associated with the obesity phenotype in the individual intestine, and the fewer species associated with the lean phenotype in the individual intestine, the more the individual The probability of suffering from obesity increases. For example, the absence of Bacteronides pectinophilus, Eubacterium siraeum and Clostridium phytofermentans in a person's intestines and the presence of Anaerotruncus colihominis indicate that the person is suffering from obesity.
当業者にとっては、本発明の遺伝子を、例えば肥満を患う患者の治療中に、バイオマーカーとして使用できるということは明白である。したがって、別の実施形態においては、本発明は、肥満治療の有効性をモニタリングするための方法を含む。治療が肥満に有効である場合、当初観察された腸内毒素症は漸進的に消失する。前記個体が肥満である場合、この個体の腸には一部の特異的遺伝子(例えば表1の遺伝子)が不在であるが、これらの遺伝子は治療中に再度出現する。したがって、この実施形態において、本発明の方法は、前記患者のミクロビオームに少なくとも一つの遺伝子が不在であるか否かをまず判定するステップと、治療を施すステップと、前記少なくとも一つの遺伝子が患者のミクロビオーム中に存在するか否かを判定するステップとを含んでいる。好ましい一実施形態において、本発明の方法は、治療の前と後に前記個体の糞便から微生物DNAを得るステップを含んでいる。さらに好ましい実施形態においては、前記個体由来の糞便は治療の前と後に採取され、DNAが抽出され、個体の腸内ミクロビオームにおける少なくとも一つの遺伝子の存在または不在が判定される。 It will be apparent to those skilled in the art that the genes of the present invention can be used as biomarkers, for example during the treatment of patients suffering from obesity. Accordingly, in another embodiment, the present invention includes a method for monitoring the effectiveness of an obesity treatment. When treatment is effective for obesity, the initially observed enterotoxemia gradually disappears. When the individual is obese, some specific genes (eg, the genes in Table 1) are absent in the intestine of the individual, but these genes reappear during treatment. Accordingly, in this embodiment, the method of the invention comprises first determining whether at least one gene is absent in the patient's microbiome, providing a treatment, and wherein the at least one gene is the patient's microbiome. Determining whether it is present in the microbiome. In a preferred embodiment, the method of the present invention comprises obtaining microbial DNA from the feces of the individual before and after treatment. In a further preferred embodiment, stool from said individual is collected before and after treatment, DNA is extracted and the presence or absence of at least one gene in the intestinal microbiome of the individual is determined.
別の好ましい実施形態において、個体の腸内ミクロビオームでの不在または存在が判定される遺伝子は、表1に列挙されている遺伝子群から選択される。特定の一実施形態において、本発明の方法は、表1に列挙されている遺伝子の少なくとも50%、より好ましくは表1の遺伝子の少なくとも75%、さらに一層好ましくは表1の遺伝子の少なくとも90%の存在または不在を判定するステップを含む。 In another preferred embodiment, the gene whose absence or presence in the intestinal microbiome of the individual is determined is selected from the group of genes listed in Table 1. In one particular embodiment, the method of the invention comprises at least 50% of the genes listed in Table 1, more preferably at least 75% of the genes of Table 1, even more preferably at least 90% of the genes of Table 1. Determining the presence or absence of.
本発明は同様に、肥満を患う患者の体内には不在であり痩せ型の健康な人の体内には存在する全ての遺伝子を含む、本発明の方法の実施に専用のキットをも含んでいる。詳細には、本発明は、肥満を患う患者の体内には不在であり痩せ型の人の体内には存在する全ての遺伝子に結合するプローブを含む、本発明に係る方法の実施に専用のマイクロアレイに関する。好ましい実施形態において、前記マイクロアレイは、核酸マイクロアレイである。本発明によると、「核マイクロアレイ」は、マイクロチップ、スライドガラスまたはミクロスフェアサイズのビーズであり得る基材に付着された異なる核酸プローブで構成されている。マイクロチップは、ポリマー、プラスチック、樹脂、多糖類、シリカもしくはシリカベースの材料、炭素、金属、無機ガラスまたはニトロセルロースで構成されていてよい。プローブは、核酸、例えばcDNA(「cDNAマイクロアレイ」)またはオリゴヌクレオチド(「オリゴヌクレオチドマイクロアレイ」、なおオリゴヌクレオチドの長さは約25〜約60塩基対以下である)であり得る。核酸技術の代替として、定量的PCRも使用してよく、したがって試験すべき遺伝子に特異的な増幅プライマーも本発明に係る方法を実施するために非常に有用である。したがって、本発明はさらに、肥満を患う患者の体内では不在であり健康な人の体内には存在する遺伝子に特異的な増幅プライマーまたは上述の通りの専用マイクロアレイを含む、患者の肥満診断専用キットに関する。これらのキットは、当業者が前記遺伝子の10%、25%、50%または75%を検出できるようにすることもあるが、前記遺伝子の90%、95%、97.5%さらには99%の検出を可能にする場合に最も有用である。したがって、本発明に係るマイクロアレイは、前記遺伝子の少なくとも10%、25%、50%または75%、好ましくは90%、95%、97.5%そしてさらに一層好ましくは少なくとも99%に結合するプローブを含む。同様にして、定量的PCR用のキットは、前記遺伝子の少なくとも10%、25%、50%または75%、好ましくは90%、95%、97.5%そしてさらに一層好ましくは少なくとも99%の増幅を可能にするプライマーを含むものである。好ましい実施形態において、肥満患者の体内には不在であり、痩せ型の人の体内には存在する遺伝子は、表1に列挙されている遺伝子である。 The invention also includes a kit dedicated to the practice of the method of the invention, including all genes that are absent in the body of a patient suffering from obesity and present in the body of a lean healthy person. . In particular, the invention relates to a microarray dedicated to the implementation of the method according to the invention, comprising probes that bind to all genes that are absent in the body of a patient suffering from obesity and present in the body of a lean person. About. In a preferred embodiment, the microarray is a nucleic acid microarray. According to the present invention, a “nuclear microarray” is composed of different nucleic acid probes attached to a substrate, which can be a microchip, glass slide or microsphere-sized beads. The microchip may be composed of polymer, plastic, resin, polysaccharide, silica or silica-based material, carbon, metal, inorganic glass or nitrocellulose. Probes can be nucleic acids, such as cDNA (“cDNA microarray”) or oligonucleotides (“oligonucleotide microarray”, where the length of the oligonucleotide is from about 25 to about 60 base pairs or less). As an alternative to nucleic acid technology, quantitative PCR may also be used, so amplification primers specific for the gene to be tested are also very useful for carrying out the method according to the invention. Therefore, the present invention further relates to a dedicated kit for diagnosis of obesity of a patient, comprising an amplification primer specific for a gene that is absent in the body of a patient suffering from obesity and present in the body of a healthy person, or a dedicated microarray as described above. . These kits may allow one skilled in the art to detect 10%, 25%, 50% or 75% of the gene, but 90%, 95%, 97.5% or even 99% of the gene. It is most useful when enabling detection of. Thus, the microarray according to the present invention comprises probes that bind to at least 10%, 25%, 50% or 75%, preferably 90%, 95%, 97.5% and even more preferably at least 99% of said genes. Including. Similarly, a kit for quantitative PCR can amplify at least 10%, 25%, 50% or 75%, preferably 90%, 95%, 97.5% and even more preferably at least 99% of the gene. It includes a primer that enables In a preferred embodiment, the genes that are absent in the body of an obese patient and present in the body of a lean person are those listed in Table 1.
方法
ヒト糞便試料の採取。デンマーク人の個体は、Inter−99コホート(Toftら、Prev.Med.、47:378−383、2008)由来であり、BMI(肥満度指数)および肥満/糖尿病への進行状況に応じて表現型が異なっていた。患者および健康な対照には、凍結させた排泄物試料の提供を求めた。新鮮な排泄物試料を自宅で採取し、試料を自宅の冷凍庫に保管することによって直ちに凍結させた。凍結した試料を、断熱発泡スチロールのコンテナを用いて病院まで運び、その後、分析まで−80℃で保管した。
Method Collection of human fecal samples. Danish individuals are derived from the Inter-99 cohort (Toft et al., Prev. Med., 47: 378-383, 2008), and phenotypes depending on BMI (body mass index) and progression to obesity / diabetes Was different. Patients and healthy controls were asked to provide frozen stool samples. Fresh stool samples were collected at home and immediately frozen by storing the samples in a home freezer. Frozen samples were transported to the hospital using insulated polystyrene foam containers and then stored at −80 ° C. until analysis.
DNA抽出。各糞便試料の凍結したアリコート(200mg)を、250μlのチオシアン酸グアニジン、0.1Mのトリス(pH7.5)および40μlの10%N−ラウロイルサルコシン中に懸濁させた。その後、先に記述された通りに(Manichanhら、Gut、55:205−211、2006)、DNA抽出を行った。DNA濃度およびその分子サイズを、ナノドロップ(Thermo Scientific)およびアガロースゲル電気泳動によって推定した。
DNA extraction. A frozen aliquot (200 mg) of each stool sample was suspended in 250 μl guanidine thiocyanate, 0.1 M Tris (pH 7.5) and 40
DNAライブラリーの構築および配列決定。DNAライブラリーを、メーカーの指示(Illumina)にしたがって調製した。クラスタ生成、鋳型ハイブリダイゼーション、等温増幅、線形化、遮断および変性、ならびに配列決定用プライマーのハイブリダイゼーションを実施するために、他の箇所で記載されたものと同じワークフローを使用した。蛍光原画像を処理し配列を呼び出すために、塩基呼び出しパイプライン(IlluminaPipeline−0.3バージョン)を使用した。実験再現性の検証のために、最初の15の試料の各々について一つのライブラリー(クローンインサートサイズ200bp)を構築し、そして残りの109の試料の各々について、異なるクローンインサートサイズ(135bpおよび400bp)を有する二つのライブラリーを構築した。新規配列の生成と配列決定深度との間の最適なリターンを推定するため、Short Oligonucleotide Alignment Program(SOAP)(Liら、Bioinformatics、25:1966−1967、2009)、および95%の配列同一性というマッチ要件を用いて、試料MH0006およびMH0012から得られたIllumina GAリードを、同じ二つの試料(それぞれ156.9および154.7Mb)から生成された合計311.7Mbの468,335Sangerリードに対してアラインした。約4GbのIllumina配列で、Sangerリードの94%および89%(それぞれMH0006およびMH0012について)がカバーされた。それぞれMH0006およびMH0012について12.6および16.6Gbまでのさらなる広範な配列決定は、約95%までの中程度のカバー率の増加しかもたらさなかった。Sangerリードの90%超が、非常に高く均一なレベルまで、Illumina配列によってカバーされたが、これは、Illumina GA配列にはほとんどまたは全く偏りが存在しないことを表している。予期した通り、Illumina配列の大部分(それぞれM0006およびM0012について57%と74%)は新規のものであり、Sangerリード上にマッピングできなかった。この割合は、4および12〜16Gbの配列決定レベルで類似しており、新規のものの大部分が4Gbですでに捕捉されていることを裏付けている。
DNA library construction and sequencing. A DNA library was prepared according to the manufacturer's instructions (Illumina). The same workflow as described elsewhere was used to perform cluster generation, template hybridization, isothermal amplification, linearization, blocking and denaturation, and hybridization of sequencing primers. A base calling pipeline (Illumina Pipeline-0.3 version) was used to process the original fluorescence image and recall sequences. For verification of experimental reproducibility, one library (clone
本発明者らは、残りの122の試料について、3540万〜9760万のリードを生成し、平均は6250万リードであった。15の試料の最初のバッチの配列決定リード長は44bpであり、第2のバッチは75bpであった。 We generated 35.4 million to 97.6 million reads for the remaining 122 samples, with an average of 62.5 million reads. The sequencing read length of the first batch of 15 samples was 44 bp and the second batch was 75 bp.
使用された公開データ。GenBankに寄託されていた配列決定済みの細菌ゲノム(合計806ゲノム)を、2009年1月10日にNCBIデータベース(http://www.ncbi.nlm.nih.gov/)からダウンロードした。公知のヒト腸内細菌ゲノム配列を、HMPデータベース(http://www.hmpdacc−resources.org/cgi−bin/hmp_catalog/main.cgi)、GenBank(67ゲノム)、セントルイスのワシントン大学(85ゲノム、2009年4月バージョン、http://genome.wustl.edu/pub/organism/Microbes/Human_Gut_Microbiome/)からダウンロードし、MetaHITプロジェクト(17ゲノム、2009年9月バージョン、http://www.sanger.ac.uk/pathogens/metahit/)によって配列決定した。このプロジェクトで使用された他の腸内メタゲノムデータには、以下のものが含まれる:(1)登録番号SRA002775でNCBIからダウンロードされた、米国人個体から配列決定されたヒト腸内メタゲノムデータ(Zhangら、Proc.Natl Acad.Sci.USA、106:2365−2370、2009);(2)EMBL(http://www.bork.embl.de)でP.Borkのグループからダウンロードされた、日本人個体に由来するヒト腸内メタゲノムデータ(Kurokawaら、DNA Res.14:169−181、2007)。本研究において本発明者らが構築した統合NRデータベースは、NCBI−NRデータベース(2009年4月バージョン)および公知のヒト腸内細菌ゲノムに由来する全ての遺伝子を含んでいた。 Public data used. The sequenced bacterial genome deposited at GenBank (total 806 genomes) was downloaded from the NCBI database (http://www.ncbi.nlm.nih.gov/) on January 10, 2009. Known human enterobacterial genomic sequences are available from the HMP database (http://www.hmpdacc-resources.org/cgi-bin/hmp_catalog/main.cgi), GenBank (67 genome), Washington University of St. Louis (85 genome, Downloaded from April 2009 version, http://genome.wustl.edu/pub/organism/Microbes/Human_Gut_Microbiome/), and the MetaHIT project (17 genome, September 2009 version, http: //www.sanger. .Uk / pathogens / metahit /). Other intestinal metagenomic data used in this project include: (1) human intestinal metagenomic data (Zhang) sequenced from an American individual downloaded from NCBI under accession number SRA002775 Proc. Natl Acad. Sci. USA, 106: 2365-2370, 2009); (2) EMBL (http://www.bork.embl.de). Human intestinal metagenomic data derived from Japanese individuals downloaded from the group of Bork (Kurokawa et al., DNA Res. 14: 169-181, 2007). The integrated NR database constructed by the inventors in this study included the NCBI-NR database (April 2009 version) and all genes derived from the known human intestinal bacterial genome.
Illumina GAショートリード・デノボアセンブリ。各DNA試料の高品質ショートリードを、SOAPデノボアセンブラ(Li.& Zhu、Genome Res.、20(2):265−272、2010)によりアセンブルした。要するに、本発明者らはまず17merの頻度にしたがってアセンブリから存在度の低い配列をフィルタリングした。5未満の深度の17merを、アセンブリの前にスクリーニングしたが、これは、これらの低頻度配列がアセンブルされる可能性がきわめて低く、一方、それらを除去することで所要メモリーが著しく削減され、アセンブリは通常のスーパーコンピュータ(我々の研究機関では512GBメモリー)で実現可能なものとなると考えられるからである。次に、配列を一つずつ処理し、de Bruijnグラフのデータフォーマットを用いて、配列間のオーバーラップ情報を記憶した。単一のリードにより裏付けされたオーバーラップパスは信頼性が低く、除去された。配列決定のエラーまたは微生物株間の遺伝的ばらつきを原因とする短い低深度チップおよびバブルは、それぞれトリムおよびマージされた。リードパスを用いて、ごく小さな反復を解決した。最終的に、反復境界において連結を破断し、明確な連結をもつ連続配列をコンティグとして出力した。メタゲノム特殊モデルを選択し、パラメータ「−K21」および「−K23」をそれぞれ44bpと75bpのリードについて使用して、求められる最小の配列オーバーラップを表示した。独立して各試料についてデノボアセンブリを行った後、アセンブルされていない全てのリードを一緒にマージし、それらについてアセンブリを実施して、データの使用を最大限にし、各リードセット内での頻度は低いものの全ての試料のデータを合わせることによるアセンブリには充分な配列深度を有する微生物ゲノムをアセンブルした。 Illumina GA short lead de novo assembly. High quality short reads of each DNA sample were assembled by a SOAP de novo assembler (Li. & Zhu, Genome Res., 20 (2): 265-272, 2010). In short, we first filtered low abundance sequences from the assembly according to a frequency of 17 mer. A 17mer with a depth of less than 5 was screened prior to assembly, which is very unlikely that these infrequent sequences will be assembled, while removing them significantly reduces the required memory, This is because it can be realized with a normal supercomputer (512 GB memory in our research institution). Next, the arrays were processed one by one, and the overlap information between the arrays was stored using the data format of the de Bruijn graph. Overlap paths backed by a single lead were unreliable and were eliminated. Short low-depth chips and bubbles due to sequencing errors or genetic variability between microbial strains were trimmed and merged, respectively. A very small iteration was solved using a lead path. Finally, the connection was broken at the repeated boundary, and a continuous sequence with a clear connection was output as a contig. A metagenome special model was selected and the parameters “−K21” and “−K23” were used for 44 bp and 75 bp reads, respectively, to display the minimum sequence overlap required. After performing a de novo assembly for each sample independently, merge all the unassembled leads together and perform the assembly on them to maximize data usage and the frequency within each lead set is A microbial genome with sufficient sequence depth was assembled for assembly by combining the data of all low but low samples.
Sangerリードを用いたIlluminaコンティグの検証。BLASTIN(WUBLAST2.0)を用いて、試料MH0006およびMH0012に由来するSangerリード(それぞれ156.9Mbおよび154.7Mb)を、同じ試料に由来するIlluminaコンティグ(長さが75bp超で同一性が95%超の単一の最良ヒット)に対してマッピングした。アライメントの片端においてアラインされていないまま残された少なくとも50個の塩基を両方の配列が有しているコリアリニティの崩壊について、各アライメントをスキャンした。このような崩壊は各々、コリアリニティが崩壊している場所におけるIlluminaコンティグ内のアセンブリエラーとみなされた。互いから30bp以内のエラーは、マージされた。エラーの両側の60bpについてのコンティグ構造と一致するSangerリードが存在する場合、エラーは廃棄された。比較のため、本発明者らは、MH0006由来の454のTitaniumリード(550Mbのリード)のNewbler2アセンブリに対してこれを反復した。本発明者らは、Illuminaアセンブリについてコンティグの1Mbあたり14.12個のエラーを推定しているが、これは、454のアセンブリのそれ(1Mbあたり20.73)に匹敵する。少なくとも一つのSangerリードをマッピングするIlluminaコンティグの98.7%は、マッピングされた領域の99.55%にわたりコリニアであったが、これは、このような454のコンティグの97.86%が、マッピングされた領域の99.48%にわたりコリニアであることに匹敵する。 Verification of Illumina contig using Sanger lead. Using BLASTIN (WUBLAST 2.0), Sanger leads from samples MH0006 and MH0012 (respectively 156.9 Mb and 154.7 Mb) were converted to Illumina contigs from the same sample (> 75 bp in length and 95% identity) Mapped to a single best hit). Each alignment was scanned for a collinity disruption in which both sequences had at least 50 bases left unaligned at one end of the alignment. Each such collapse was considered an assembly error within the Illumina contig where the collinity was collapsing. Errors within 30 bp from each other were merged. If there is a Sanger lead that matches the contig structure for 60 bp on either side of the error, the error was discarded. For comparison, we repeated this for the Newbler2 assembly of 454 Titanium leads from MH0006 (550 Mb leads). We have estimated 14.12 errors per Mb of contig for the Illumina assembly, which is comparable to that of 454 assemblies (20.73 per Mb). 98.7% of Illumina contigs that map at least one Sanger lead were collinear over 99.55% of the mapped region, which is 97.86% of such 454 contigs mapped Comparable to collinear over 99.48% of the area taken.
ヒト腸内ミクロビオームのカバー率の評価。最初の35bpの領域内の多くとも二つのミスマッチおよびリード配列全体にわたる90%の同一性を許容することにより、SOAPを用いて、アセンブルされたコンティグおよび公知の細菌ゲノムに対して、Illumina GAリードをアラインした。1×10⁻⁸、100bp超のアラインメント長、および最低90%の同一性カットオフでBLASTNを用いて、同じ基準に対して、Roche/454およびSanger配列決定リードをアラインした。SOAPにより、MH0006およびMH0012のGAリード、同じ試料からのSangerリードに対してアラインした場合、二つのミスマッチが許容され、同一性はリード配列全体にわたり95%に設定された。 Assessment of human intestinal microbiome coverage. Using Illumina GA reads against assembled contigs and known bacterial genomes using SOAP by allowing at most two mismatches within the first 35 bp region and 90% identity across the entire read sequence. Aligned. Roche / 454 and Sanger sequencing reads were aligned against the same criteria using BLASTN with an alignment length of 1 × 10 −8 , greater than 100 bp and an identity cutoff of at least 90%. When SOAP aligned to the MH0006 and MH0012 GA leads, the Sanger lead from the same sample, two mismatches were allowed and the identity was set to 95% throughout the lead sequence.
非冗長遺伝子セットの遺伝子予測および構築。所与の配列のGC含有量により推定されたジコドン頻度を使用し、かつ匿名ゲノム配列に基づきORFの全範囲を予測する、MetaGene(Noguchiら、Nucleic Acids Res.、34、5623−5630、2006)を用いて、124の試料各々のコンティグから、ならびにマージされたアセンブリのコンティグから、ORFを見出す。その後、予測されたORFをBLAT(Kentら、Genome Res.、12:656−664、2002)を用いて互いにアラインした。95%超の同一性、およびより短い遺伝子の90%にわたりカバーされたアライン長を有する遺伝子対を、グループにまとめた。次に遺伝子を共有するグループをマージし、マージされたグループの各々の中の最長のORFを用いてそのグループの代表とし、グループの他のメンバーを冗長性とした。したがって、本発明者らは、冗長性を排除することにより、予測された遺伝子の全てから非冗長遺伝子セットを組織した。最終的に、100bp未満の長さを有するORFがフィルタリングされた。NCBI遺伝子コード(Leyら、Nature Rev.Microbiol、.6:776−788、2008)を用いてORFをタンパク質配列に翻訳した。 Gene prediction and construction of non-redundant gene sets. MetaGene (Noguchi et al., Nucleic Acids Res., 34, 5623-5630, 2006) using dicodon frequency estimated by GC content of a given sequence and predicting the full range of ORFs based on anonymous genomic sequences To find the ORF from the contig of each of the 124 samples, as well as from the contig of the merged assembly. The predicted ORFs were then aligned with each other using BLAT (Kent et al., Genome Res., 12: 656-664, 2002). Gene pairs with> 95% identity and alignment length covered over 90% of shorter genes were grouped together. The groups sharing the gene were then merged and the longest ORF in each of the merged groups was used to represent that group and the other members of the group were made redundant. Therefore, we organized a non-redundant gene set from all of the predicted genes by eliminating redundancy. Finally, ORFs with a length of less than 100 bp were filtered. The ORF was translated into protein sequence using the NCBI gene code (Ley et al., Nature Rev. Microbiol, .6: 776-788, 2008).
遺伝子の同定。存在度の低い遺伝子を同定することと同定のエラー率を削減することとの間のバランスを保つため、本発明者らは、個別のミクロビオーム中の遺伝子を同定するために必要とされるリードカバー率について設定された閾値の影響を調査した。同定に必要とされるリードの数が2から6に増加した時点で、遺伝子数は約2分の1に減少し、その後はゆっくりと変化した。それでも、希少な遺伝子を解析に含み入れるために、本発明者らは、2回のリードの閾値を選択した。 Gene identification. In order to maintain a balance between identifying low abundance genes and reducing the error rate of identification, we have the lead cover needed to identify genes in individual microbiomes. The effect of the set threshold on the rate was investigated. When the number of reads required for identification increased from 2 to 6, the number of genes decreased by about a half and then changed slowly. Nevertheless, in order to include rare genes in the analysis, we selected a threshold for two reads.
遺伝子の分類学的割当て。予測された遺伝子の分類学的割当ては、統合NRデータベースに対するBLASTPアラインメントを用いて実施された。1×10⁻⁵より大きいe値でBLASTPアラインメントのヒットをフィルタリングし、各々の遺伝子について、e値≦10×トップヒットのe値により定義づけされた有意なマッチを、分類学的グループを区別するために保持した。その後、MEGAN(Husonら、Genome Res.、17:377−386、2007)で実行された最近共通祖先(LCA)ベースのアルゴリズムにより、各遺伝子の分類学的レベルを判定した。LCAベースのアルゴリズムは、割当てられた分類群の分類学的レベルが遺伝子の保存レベルを反映するような形で、遺伝子を分類群に割当てる。例えば、遺伝子が数多くの種に保存されていた場合、それは、種ではなくむしろLCAに割当てられた。 Taxonomic assignment of genes. Taxonomic assignment of predicted genes was performed using BLASTP alignment against the integrated NR database. Filter BLASTP alignment hits with e-values greater than 1 × 10 −5 and distinguish taxonomic groups for each gene, with significant matches defined by e-value ≦ 10 × top hit e-value Held for. Subsequently, the taxonomic level of each gene was determined by the recent common ancestry (LCA) based algorithm implemented in MEGAN (Huson et al., Genome Res., 17: 377-386, 2007). The LCA based algorithm assigns genes to taxon such that the taxonomic level of the assigned taxon reflects the conserved level of the gene. For example, if a gene was conserved in many species, it was assigned to an LCA rather than a species.
遺伝子の機能的分類。BLASTPを用いて、e値≦1×10⁻⁵で、eggNOGデータベース(Jensenら、Nucleic Acids Res.、36:D250−D254、2008)およびKEGGデータベース(Kanehisaら、Nucleic Acids Res.、32:D277−D280、2004)内で予測された遺伝子のタンパク質配列を検索した。最低のe値を有するNOGホモログまたはKEGGホモログに応じて、遺伝子に注釈付けした。eggNOGデータベースは、COGデータベースおよびKOGデータベースの統合である。COGで注釈付けされた遺伝子は、25のCOGカテゴリーに分類され、KEGGにより注釈付けされた遺伝子は、KEGGパスウェイ内に割当てられた。 Functional classification of genes. Using BLASTP, the egg NOG database (Jensen et al., Nucleic Acids Res., 36: D250-D254, 2008) and the KEGG database (Kanehisa et al., Nucleic Acids Res., 32: D277-) with an e value ≦ 1 × 10 −5 . D280, 2004) was searched for the protein sequence of the gene predicted. Genes were annotated according to the NOG or KEGG homolog with the lowest e value. The eggNOG database is an integration of the COG database and the KOG database. Genes annotated with COG were classified into 25 COG categories, and genes annotated with KEGG were assigned within the KEGG pathway.
最小腸内細菌ゲノムの決定。eggNOGクラスタに割当てられた非冗長遺伝子の数は、遺伝子の長さとクラスタコピー数で正規化された。クラスタを、正規化された遺伝子数によりランキングし、不可欠なBacillus subtilis遺伝子をコードするクラスタを含んでいた範囲を決定し、100個のクラスタの連続的グループ内のこれらのクラスタの割合を計算した。遺伝子クラスタの範囲の解析には、iPath画像以外に、KEGGの使用ならびにパスウェイの完全性およびそれらがコードするタンパク質機構の手動での確認を用いた。 Determination of the minimal intestinal bacterial genome. The number of non-redundant genes assigned to the eggNOG cluster was normalized by gene length and cluster copy number. Clusters were ranked by normalized gene number to determine the range that contained clusters encoding the essential Bacillus subtilis gene, and the percentage of these clusters within a continuous group of 100 clusters was calculated. In addition to iPath images, analysis of gene cluster coverage used the use of KEGG and manual confirmation of the integrity of pathways and the protein mechanisms they encode.
全機能的補体と最小メタゲノムの決定。本発明者らは、n個の個体(n=52〜124、1ビンあたり100の複製)のランダムな組合せ中に存在するオルソロググループおよび/または遺伝子ファミリーの合計数および共有数を計算した。この解析は、遺伝子クラスタの次の三つのグループについて実施された:(1)公知のeggNOGオルソロググループ(すなわち、[Uu]ncharacteri[sz]ed、[Uu]nknown、[Pp]redictedまたは[Pp]utativeという用語が存在するものを除く、機能的注釈付けを伴うグループ);(2)全てのeggNOGオルソロググループ;(3)以上の二つのカテゴリーに割当てされなかった残りの遺伝子から構築された遺伝子ファミリーを加えた、全てのオルソロググループ。ファミリーは、1.1の拡大要因と60のビットスコアカットオフでMCL(van Dongen、Ph.D.Thesis、Univ.Utrecht、2000)を用いて、総当たりBLASTPの結果からクラスタ化された。 Determination of total functional complement and minimal metagenome. We calculated the total and shared number of ortholog groups and / or gene families present in a random combination of n individuals (n = 52-124, 100 replications per bin). This analysis was performed on the following three groups of gene clusters: (1) Known eggNOG ortholog groups (ie, [Uu] ncharacteri [sz] ed, [Uu] nknown, [Pp] redicted or [Pp] groups with functional annotations, except where the term utative exists); (2) all eggNOG ortholog groups; (3) gene families constructed from the remaining genes not assigned to the two categories above All ortholog groups, plus Families were clustered from brute force BLASTP results using MCL (van Dongen, Ph. D. Thesis, Univ. Utrecht, 2000) with an expansion factor of 1.1 and a bit score cutoff of 60.
希薄度解析。メモリーによる制限のため100個の無作為にピックアップした試料について、EstimateSを用いて、全遺伝子豊富度の推定を行った。CV値は0.5超であったことから、Chao2豊富度推定量(従来のもの)およびICE豊富度推定量を計算し、二つのうちの大きい方の推定値(ICE)を使用した。この試料サイズについての推定値は、3,621,646個の遺伝子(ICE)であり、一方Sobs(Mao Tau)は3,090,575個の遺伝子、つまり85.3%であった。ICE推定量曲線は、完全な飽和状態にはならず、これは、最終的な決定的推定値を達成するためには、追加の試料を加える必要があることを示している。 Sparseness analysis. For 100 randomly picked samples due to memory limitations, estimation of total gene abundance was performed using EstimateS. Since the CV value was greater than 0.5, the Chao2 richness estimator (conventional) and the ICE richness estimator were calculated and the larger of the two (ICE) was used. The estimate for this sample size was 3,621,646 genes (ICE), while S obs (Mao Tau) was 3,090,575 genes, or 85.3%. The ICE estimator curve does not become fully saturated, indicating that additional samples need to be added to achieve the final deterministic estimate.
共通の細菌核。非常に類似した株の影響を除去し、コホートの個体中の公知の微生物種の存在を評価するために、本発明者らは基準セットとして650の配列決定された細菌ゲノムおよび古細菌ゲノムを使用した。このセットは、932個の公的に入手可能なゲノムで構成され、これらのゲノムは、90%の同一性カットオフと少なくとも80%の長さにわたる類似性とを用いて、類似性別にグループ分けされた。各グループから最大のゲノムのみが使用された。124の個体に由来するIlluminaリードを、種のプロファイリング解析のためにセットにマッピングし、同じ種に由来するゲノム(サイズを20%超異なるようにすることによる)を、手作業での検査によって、かつ配列が入手可能である場合には16Sベースのクラスタ化を用いることによって、キュレートした。 Common bacterial nucleus. In order to eliminate the effects of very similar strains and assess the presence of known microbial species in cohort individuals, we used 650 sequenced and archaeal genomes as a reference set did. The set consists of 932 publicly available genomes that are grouped by similarity using a 90% identity cut-off and a similarity span of at least 80% length. It was done. Only the largest genome from each group was used. Illumina reads from 124 individuals were mapped to sets for species profiling analysis, and genomes from the same species (by making the size more than 20% different) were manually examined, And when sequences were available, they were curated by using 16S based clustering.
個体間の微生物ゲノムの相対的存在度。本発明者らは、Illuminaリードを一意的にマッピングすることによりゲノムカバー率を計算し、それを1Gbの配列に正規化して、異なる個体における異なる配列決定レベルについて矯正した。カバー率を、各個体についての非冗長細菌ゲノムセットの全ての種にわたって合計し、この合計に対する各々の種の割合を計算した。 Relative abundance of microbial genomes between individuals. We calculated genome coverage by uniquely mapping Illumina reads, normalized it to a 1 Gb sequence, and corrected for different sequencing levels in different individuals. The coverage was summed across all species of the non-redundant bacterial genome set for each individual and the ratio of each species to this sum was calculated.
種の共存ネットワーク。少なくとも一つの個体内で1%以上のIlluminaリードによるゲノムカバー率を有していた155の種について、本発明者らは、124の個体のコホート全体を通した配列決定深度(存在度)間のペアワイズ種間ピアソン相関を計算した。結果として得た11,175の種間相関から、グラフ内のノードサイズとして各々の種の平均ゲノムカバー率を表示するCytoscape(Shannonら、Genome Res.13:2498−2504、2003)を用いて、グラフの形で、−0.4未満または0.4超(n=342)の相関を視覚化した。 Species coexistence network. For 155 species that had a genome coverage of Illumina reads of 1% or more within at least one individual, we found that between sequencing depths (abundances) throughout a cohort of 124 individuals The pairwise interspecies Pearson correlation was calculated. Using Cytoscape (Shannon et al., Genome Res. 13: 2498-2504, 2003), which displays the average genome coverage of each species as the node size in the graph, from the resulting interspecific correlation of 11,175, In the form of a graph, correlations less than -0.4 or greater than 0.4 (n = 342) were visualized.
結果
使用されたコホートおよび方法の要約説明。合計177名のデンマーク人個体が研究対象となった。これらの個体は、BMIが27.5未満の人67名(痩せ型で健康な対照)およびBMIが27.5超の110名の個体(肥満患者)を含んでいた。遺伝子330万個の遺伝子カタログ全体を、二つのグループ間で有意に異なっているものについて、順位和検索によって検索した。遺伝子サイズ(より大きな遺伝子はより大きい標的であり、より頻繁に見られる)および異なる個体についての配列決定範囲の差によって、遺伝子頻度を正規化した。有意に異なる遺伝子の数は、閾値およびグループ分割により影響される。手短かに言うと、p<10−4で1327の「BMI関連遺伝子」(本明細書中、BMI遺伝子とも呼ばれている)が発見された。
Results A brief description of the cohorts and methods used. A total of 177 Danish individuals were studied. These individuals included 67 people with a BMI of less than 27.5 (lean and healthy controls) and 110 individuals with a BMI greater than 27.5 (obese patients). The entire gene catalog of 3.3 million genes was searched by rank sum search for those significantly different between the two groups. Gene frequency was normalized by gene size (larger genes are larger targets and more frequently seen) and differences in sequencing ranges for different individuals. The number of significantly different genes is affected by threshold and group division. Briefly, 1327 “BMI-related genes” (also referred to herein as BMI genes) were discovered at p <10 −4 .
BMI遺伝子の包括的解析。個体別に、有意に異なる遺伝子、すなわちBMI関連遺伝子をプロットした(図1A)。健康な個体におけるBMI遺伝子数の中央値は476であり、肥満患者においてはわずか179であった。遺伝子数の中央値は、二つのグループ間で非常に有意に異なっている(p<10−17、片側t検定)。遺伝子数で遺伝子をランキングし20のグループでビニングした場合、67のうち50の個体が最初の三つのビン内にあり、痩せ型の個体が分布の最上部にあることを示した(図1B)。 Comprehensive analysis of the BMI gene. Significantly different genes, ie BMI-related genes, were plotted for each individual (FIG. 1A). The median number of BMI genes in healthy individuals was 476 and only 179 in obese patients. The median number of genes is very significantly different between the two groups (p <10 −17 , one-sided t-test). Gene ranking by number of genes and binning in 20 groups showed that 50 out of 67 individuals were in the first three bins and the lean individuals were at the top of the distribution (FIG. 1B) .
全ての遺伝子およびBMI遺伝子の分布比較。ミクロビオームの全ての遺伝子およびBMI遺伝子の分布を比較した。BMI遺伝子に比べて、二つのグループの間で全遺伝子の数および頻度の差ははるかに小さいものである。BMI遺伝子の分布は、全遺伝子分布を単純には反映していない。したがって、肥満患者における遺伝子の喪失は、有意である。 Comparison of distribution of all genes and BMI genes. The distribution of all microbiome genes and the BMI gene were compared. Compared to the BMI gene, the difference in the number and frequency of all genes between the two groups is much smaller. The distribution of the BMI gene does not simply reflect the total gene distribution. Thus, gene loss in obese patients is significant.
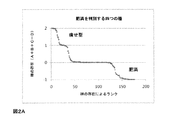
BMI関連種。330万からなるカタログ中の遺伝子に帰属する分類学的割当てを用いて、BMI遺伝子を種に割当てた(Qinら、Nature、2010、in press、doi:10.1038/nature08821)。BMI遺伝子の59.8%、ただし全遺伝子のわずか32.8%だけが、Firmicutes由来であることが発見された。一方で、Bacteroidetesの頻度は、BMI遺伝子について8.1%、ミクロビオームの全遺伝子については18.4%であった。したがって、肥満はFirmicutesの変化と連関する。種は、まず、BMI遺伝子のうちでそれらの種に割当てられた遺伝子の数によって同定された。その後、同じ種に由来する他の遺伝子をカタログから引き出し、異なる個体内で各々の種についての50の代表的遺伝子の存在を査定した(これは、種を同定するために現在行われている単一の16S遺伝子の使用と比較して全く遜色がなかった)。種は、マーカー遺伝子の少なくとも半分が一個体中に発見された場合に、存在するものとみなされた。健康な人と患者との間の分布の有意性は、カイ二乗検定を用いて、全コホート分布(67名対110名)と比較することによって推定された。Bacteronides pectinophilus、Eubacterium siraeumおよびClostridium phyto fermentansは、健康な個体群と連関した(それぞれ、p=2.1×10⁻³、p=3.5×10⁻⁴、およびp=6.1×10⁻⁴)。すなわちこれらは、肥満患者には不在である傾向にあった。一方で、Anaerotruncus colihominisは、患者コホートと連関した(p=1.4×10−2)。種の同定に基づいて、これら4つの種の線形組合せが、肥満の表現型を完全に予測することが実証された(図2A)。健康な個体および患者は、それぞれ青色および赤色の点として示されている。種の存在(縦座標)は、遺伝子の合計、すなわち(肥満と逆連関した)「優良種」の遺伝子から(肥満と連関した)「不良種」の遺伝子を差し引いたものに対応する。個体は、種の存在によってランキングされる(横座標)。個体は、「優良種」の遺伝子が上回っている場合、ランクの最上部にあり、健康である傾向をもち、一方、「不良種」の遺伝子が上回っている場合、その個体は右側にあり、病気を患う傾向をもつ。このことは、図2Bでも示されており、ここで個体のグループは、優良種の遺伝子の少なくとも半分を、不良種を上回って有するか、または不良種の遺伝子の半分を、優良種を上回って有する(それぞれ、カットオフ>0.5および<−0.5)。個体の分布は赤色および青色のバーで表され、分布の確率(カイ二乗)は、有意に異なる二つのグループの上に示されている。コホートの組成が、比較のために示されている。判別精度は、正しく分類された個体対誤って分類された個体として計算されている(正64、誤15)。 BMI related species. A BMI gene was assigned to a species using a taxonomic assignment attributed to a gene in the catalog of 3.3 million (Qin et al., Nature, 2010, in press, doi: 10.1038 / nature08882). It was discovered that 59.8% of the BMI genes, but only 32.8% of all genes, were from Firmicutes. On the other hand, the frequency of Bacteroidetes was 8.1% for the BMI gene and 18.4% for all microbiome genes. Thus obesity is associated with changes in Firmicutes. Species were first identified by the number of genes among the BMI genes assigned to them. Subsequently, other genes from the same species were pulled from the catalog and assessed for the presence of 50 representative genes for each species in different individuals (this is currently done to identify the species). Compared to the use of one 16S gene). A species was considered to be present if at least half of the marker gene was found in one individual. The significance of the distribution between healthy people and patients was estimated by comparing to the total cohort distribution (67 vs. 110) using the chi-square test. Bacteronides pectinophilus, Eubacterium siraeum and Clostridium phyto fermentans were associated with healthy populations (p = 2.1 × 10 −3 , p = 3.5 × 10 −4 , and p = 6.1 × 10 −, respectively). 4 ). That is, they tended to be absent from obese patients. On the other hand, Anaerotruncus colihominis was associated with a patient cohort (p = 1.4 × 10 −2 ). Based on species identification, it was demonstrated that the linear combination of these four species fully predicts the obesity phenotype (FIG. 2A). Healthy individuals and patients are shown as blue and red dots, respectively. The presence of the species (ordinate) corresponds to the sum of the genes, ie the “excellent species” gene (reversely linked to obesity) minus the “bad species” gene (linked to obesity). Individuals are ranked by the presence of species (abscissa). An individual is at the top of the rank if the gene for “excellent species” is above, and has a tendency to be healthy, whereas if the gene for “bad species” is above, the individual is on the right side, Have a tendency to suffer from illness. This is also shown in FIG. 2B, where the group of individuals has at least half of the good species genes above the bad species, or half the bad species genes above the good species. (Cutoff> 0.5 and <−0.5, respectively). The distribution of individuals is represented by red and blue bars, and the probability of distribution (chi-square) is shown above two significantly different groups. The composition of the cohort is shown for comparison. The discrimination accuracy is calculated as a correctly classified individual vs. an incorrectly classified individual (correct 64, incorrect 15).

Claims (8)
Applications Claiming Priority (3)
| Application Number | Priority Date | Filing Date | Title |
|---|---|---|---|
| US30933310P | 2010-03-01 | 2010-03-01 | |
| US61/309,333 | 2010-03-01 | ||
| PCT/EP2011/053041 WO2011107482A2 (en) | 2010-03-01 | 2011-03-01 | Method of diagnostic of obesity |
Publications (1)
| Publication Number | Publication Date |
|---|---|
| JP2013520973A true JP2013520973A (en) | 2013-06-10 |
Family
ID=44010069
Family Applications (1)
| Application Number | Title | Priority Date | Filing Date |
|---|---|---|---|
| JP2012555405A Pending JP2013520973A (en) | 2010-03-01 | 2011-03-01 | Obesity diagnosis method |
Country Status (8)
| Country | Link |
|---|---|
| US (1) | US20130005586A1 (en) |
| EP (1) | EP2542695A2 (en) |
| JP (1) | JP2013520973A (en) |
| CN (1) | CN102939392A (en) |
| AU (1) | AU2011223002B2 (en) |
| CA (1) | CA2791464A1 (en) |
| NZ (1) | NZ602473A (en) |
| WO (1) | WO2011107482A2 (en) |
Cited By (1)
| Publication number | Priority date | Publication date | Assignee | Title |
|---|---|---|---|---|
| JP2019176754A (en) * | 2018-03-30 | 2019-10-17 | 森永乳業株式会社 | Inspection method for ovulation disorders |
Families Citing this family (28)
| Publication number | Priority date | Publication date | Assignee | Title |
|---|---|---|---|---|
| US9463169B2 (en) | 2011-08-17 | 2016-10-11 | Microbiome Therapeutics, Llc | Human gastrointestinal microbiome modulating food supplement for improving blood glucose regulation |
| JP6072819B2 (en) | 2011-12-08 | 2017-02-01 | ファイヴ3 ゲノミクス,エルエルシー | Double microchromosome containing MDM2 and method thereof |
| US9682093B2 (en) | 2012-03-30 | 2017-06-20 | Charles R. Drew University Of Medicine And Science | Compositions and methods for treating or preventing metabolic syndrome disorders |
| DK2909336T3 (en) * | 2012-10-17 | 2018-08-20 | Agronomique Inst Nat Rech | DETERMINATION OF REDUCED GAS BACTERIA DIVERSITY |
| US20150275275A1 (en) * | 2012-10-17 | 2015-10-01 | Institut National De La Recherche Agronomique | Prognostic of diet impact on obesity-related co-morbidities |
| US8906668B2 (en) | 2012-11-23 | 2014-12-09 | Seres Health, Inc. | Synergistic bacterial compositions and methods of production and use thereof |
| CA2899925A1 (en) | 2013-02-04 | 2014-08-07 | Seres Therapeutics, Inc. | Compositions and methods for inhibition of pathogenic bacterial growth |
| WO2014121304A1 (en) | 2013-02-04 | 2014-08-07 | Seres Health, Inc. | Compositions and methods |
| WO2014145958A2 (en) | 2013-03-15 | 2014-09-18 | Seres Health, Inc. | Network-based microbial compositions and methods |
| GB201312713D0 (en) * | 2013-03-22 | 2013-08-28 | Weaver Connie M | Uses of soluble corn fibre for increasing colonic bacteria populations and increasing mineral absorption |
| US9782445B2 (en) | 2013-06-05 | 2017-10-10 | Rebiotix, Inc. | Microbiota restoration therapy (MRT), compositions and methods of manufacture |
| US9694039B2 (en) | 2013-06-05 | 2017-07-04 | Rebiotix, Inc. | Microbiota restoration therapy (MRT), compositions and methods of manufacture |
| US10383901B2 (en) | 2013-06-05 | 2019-08-20 | Rebiotix, Inc. | Microbiota restoration therapy (MRT), compositions and methods of manufacture |
| MX367109B (en) | 2013-11-25 | 2019-08-05 | Seres Therapeutics Inc | Synergistic bacterial compositions and methods of production and use thereof. |
| EP3082431A4 (en) | 2013-12-16 | 2017-11-15 | Seres Therapeutics, Inc. | Bacterial compositions and methods of use thereof for treatment of immune system disorders |
| KR101445243B1 (en) * | 2014-03-28 | 2014-09-29 | 서울대학교산학협력단 | Early diagnosis of obesity-related diseases using changes in the gut microbial community structure and function |
| WO2016049917A1 (en) * | 2014-09-30 | 2016-04-07 | Bgi Shenzhen Co., Limited | Biomarkers for obesity related diseases |
| WO2016049932A1 (en) * | 2014-09-30 | 2016-04-07 | Bgi Shenzhen Co., Limited | Biomarkers for obesity related diseases |
| CN108064132A (en) | 2014-10-31 | 2018-05-22 | 霍勒拜欧姆公司 | The method and composition related with the antimicrobial treatments of illness and diagnosis |
| EP3283087A4 (en) * | 2015-04-14 | 2019-03-13 | Ubiome Inc. | Method and system for microbiome-derived diagnostics and therapeutics for endocrine system conditions |
| KR102066242B1 (en) | 2015-06-09 | 2020-01-14 | 리바이오틱스, 인코퍼레이티드 | Microbial Restoration Therapy (MRT) Compositions and Methods of Preparation |
| US10905726B2 (en) | 2015-06-09 | 2021-02-02 | Rebiotix, Inc. | Microbiota restoration therapy (MRT) compositions and methods of manufacture |
| US10799539B2 (en) | 2015-06-09 | 2020-10-13 | Rebiotix, Inc. | Microbiota restoration therapy (MRT) compositions and methods of manufacture |
| US10828340B2 (en) | 2015-06-09 | 2020-11-10 | Rebiotix, Inc. | Microbiota restoration therapy (MRT) compositions and methods of manufacture |
| CN106974939B (en) * | 2016-01-15 | 2020-08-25 | 深圳华大生命科学研究院 | Application of probiotics of scleritis in treating and preventing obesity and related diseases |
| US20180030403A1 (en) | 2016-07-28 | 2018-02-01 | Bobban Subhadra | Devices, systems and methods for the production of humanized gut commensal microbiota |
| KR20200040277A (en) | 2017-08-14 | 2020-04-17 | 세레스 테라퓨틱스, 인코포레이티드 | Composition and method for treatment of cholestatic disease |
| CA3073838A1 (en) | 2017-08-30 | 2019-03-07 | Pendulum Therapeutics, Inc. | Methods and compositions for treatment of microbiome-associated disorders |
Family Cites Families (2)
| Publication number | Priority date | Publication date | Assignee | Title |
|---|---|---|---|---|
| US6582908B2 (en) * | 1990-12-06 | 2003-06-24 | Affymetrix, Inc. | Oligonucleotides |
| WO2008076696A2 (en) * | 2006-12-18 | 2008-06-26 | Washington University In St. Louis | The gut microbiome as a biomarker and therapeutic target for treating obesity or an obesity related disorder |
-
2011
- 2011-03-01 CA CA2791464A patent/CA2791464A1/en not_active Abandoned
- 2011-03-01 AU AU2011223002A patent/AU2011223002B2/en not_active Ceased
- 2011-03-01 US US13/582,375 patent/US20130005586A1/en not_active Abandoned
- 2011-03-01 WO PCT/EP2011/053041 patent/WO2011107482A2/en active Application Filing
- 2011-03-01 CN CN2011800194779A patent/CN102939392A/en active Pending
- 2011-03-01 EP EP11714496A patent/EP2542695A2/en not_active Withdrawn
- 2011-03-01 NZ NZ602473A patent/NZ602473A/en not_active IP Right Cessation
- 2011-03-01 JP JP2012555405A patent/JP2013520973A/en active Pending
Non-Patent Citations (4)
| Title |
|---|
| JPN5013010196; TURNBAUGH PETER J: 'AN OBESITY-ASSOCIATED GUT MICROBIOME WITH INCREASED CAPACITY FOR ENERGY HARVEST' NATURE V444 N7122, 20061221, P1027-1031, NATURE PUBLISHING GROUP * |
| JPN6014052007; Turnbaugh et al.: Nature Vol.457, No.7228, p.480-484(2009) * |
| JPN6015043194; Mirjana Rajilic-Stojanovic: 'Diversity of the human gastrointestinal microbiota, Novel perspectives from high throughout analyses' 博士論文 , 2007 * |
| JPN6015043195; DNA Research Vol.14, No.4, 20070831, p.169-181 * |
Cited By (1)
| Publication number | Priority date | Publication date | Assignee | Title |
|---|---|---|---|---|
| JP2019176754A (en) * | 2018-03-30 | 2019-10-17 | 森永乳業株式会社 | Inspection method for ovulation disorders |
Also Published As
| Publication number | Publication date |
|---|---|
| WO2011107482A2 (en) | 2011-09-09 |
| AU2011223002B2 (en) | 2015-07-02 |
| WO2011107482A9 (en) | 2012-01-12 |
| CN102939392A (en) | 2013-02-20 |
| AU2011223002A1 (en) | 2012-10-11 |
| CA2791464A1 (en) | 2011-09-09 |
| US20130005586A1 (en) | 2013-01-03 |
| NZ602473A (en) | 2015-01-30 |
| WO2011107482A3 (en) | 2012-03-01 |
| EP2542695A2 (en) | 2013-01-09 |
Similar Documents
| Publication | Publication Date | Title |
|---|---|---|
| JP2013520973A (en) | Obesity diagnosis method | |
| JP2013520972A (en) | Diagnosis method of inflammatory bowel disease | |
| US20190367995A1 (en) | Biomarkers for colorectal cancer | |
| Ackerman et al. | The mycobiome of the human urinary tract: potential roles for fungi in urology | |
| Dicksved et al. | Molecular analysis of the gut microbiota of identical twins with Crohn's disease | |
| Kennedy et al. | The impact of NOD2 variants on fecal microbiota in Crohn’s disease and controls without gastrointestinal disease | |
| CN113227468A (en) | Detection and prediction of infectious diseases | |
| US20150211053A1 (en) | Biomarkers for diabetes and usages thereof | |
| CN107208141B (en) | Biomarkers for colorectal cancer-related diseases | |
| CN107075446B (en) | Biomarkers for obesity related diseases | |
| Ricanek et al. | Gut bacterial profile in patients newly diagnosed with treatment-naïve Crohn’s disease | |
| WO2014019267A1 (en) | Method and system to determine biomarkers related to abnormal condition | |
| CN107002021B (en) | Biomarker for rheumatoid arthritis and application thereof | |
| WO2018210201A1 (en) | Molecular marker, kit and application for use in early diagnosis and prediction of sepsis as complication of acute kidney injury | |
| WO2013012332A1 (en) | Identification of subjects at risk of developing irritable bowel syndrome | |
| JP2019517783A (en) | Use of microbiome profiles to detect liver disease | |
| WO2016008954A1 (en) | Gut bacterial species in hepatic diseases | |
| EP3250710A1 (en) | Host dna as a biomarker of crohn's disease | |
| CN106795479B (en) | Biomarker for rheumatoid arthritis and application thereof | |
| WO2022206895A1 (en) | Use of microbiome for assessment and treatment of obesity and type 2 diabetes | |
| JP2017189166A (en) | Method for diagnosing chronic pyoderma and diagnostic kit for chronic pyoderma | |
| CN108064273A (en) | The biomarker of colorectal cancer relevant disease | |
| Shumway et al. | Aberrant miR-29 is a predictive feature of severe phenotypes in pediatric Crohn’s disease | |
| Gòdia et al. | Urinary microRNAome in healthy cats and cats with pyelonephritis or other urological conditions | |
| KR20210157235A (en) | Predicting or Diagnosing Composition for Risk of Renal Diseases Using Human Intestinal Microbiome, Diagnosing Kit, Method For Providing Information, And Screening Method For Drugs For Preventing Or Treating Renal Diseases Using The Same |
Legal Events
| Date | Code | Title | Description |
|---|---|---|---|
| RD01 | Notification of change of attorney |
Free format text: JAPANESE INTERMEDIATE CODE: A7426 Effective date: 20130822 |
|
| A521 | Request for written amendment filed |
Free format text: JAPANESE INTERMEDIATE CODE: A821 Effective date: 20130822 |
|
| A621 | Written request for application examination |
Free format text: JAPANESE INTERMEDIATE CODE: A621 Effective date: 20130911 |
|
| A131 | Notification of reasons for refusal |
Free format text: JAPANESE INTERMEDIATE CODE: A131 Effective date: 20141216 |
|
| A521 | Request for written amendment filed |
Free format text: JAPANESE INTERMEDIATE CODE: A523 Effective date: 20150310 |
|
| A131 | Notification of reasons for refusal |
Free format text: JAPANESE INTERMEDIATE CODE: A131 Effective date: 20150407 |
|
| A521 | Request for written amendment filed |
Free format text: JAPANESE INTERMEDIATE CODE: A523 Effective date: 20150519 |
|
| A131 | Notification of reasons for refusal |
Free format text: JAPANESE INTERMEDIATE CODE: A131 Effective date: 20151110 |
|
| A02 | Decision of refusal |
Free format text: JAPANESE INTERMEDIATE CODE: A02 Effective date: 20160412 |