JP2011123743A - Information map creating apparatus, information map creating method and program - Google Patents
Information map creating apparatus, information map creating method and program Download PDFInfo
- Publication number
- JP2011123743A JP2011123743A JP2009281894A JP2009281894A JP2011123743A JP 2011123743 A JP2011123743 A JP 2011123743A JP 2009281894 A JP2009281894 A JP 2009281894A JP 2009281894 A JP2009281894 A JP 2009281894A JP 2011123743 A JP2011123743 A JP 2011123743A
- Authority
- JP
- Japan
- Prior art keywords
- upper limit
- information
- relation
- limit value
- information element
- Prior art date
- Legal status (The legal status is an assumption and is not a legal conclusion. Google has not performed a legal analysis and makes no representation as to the accuracy of the status listed.)
- Granted
Links
Images

Landscapes
- Information Retrieval, Db Structures And Fs Structures Therefor (AREA)
- Management, Administration, Business Operations System, And Electronic Commerce (AREA)
Abstract
【課題】特定のノードへの関係線の集中と重要な情報の欠落とが適切に回避された情報マップを作成すること。
【解決手段】情報マップ作成装置は、情報要素ごとに接続可能な関係線の上限値を設定する上限値設定手段と、前記情報要素間の関連ごとに該関連の強度を記憶した関連情報記憶手段に基づいて、前記強度の大きい順に、前記上限値の範囲内で前記関係線として表示させる前記関連を選択する関連選択手段と、前記上限値の範囲を超えるため表示対象として選択されなかった前記関連の数を、前記情報要素ごとに上限超過回数記憶手段に記録する記録手段と、前記上限超過回数記憶手段に記録された数が最大である前記情報要素の前記上限値を所定数増加させる上限値更新手段とを有し、前記関連選択手段は、更新された前記上限値の範囲内で前記関連の選択を再実行する。
【選択図】図5To create an information map in which the concentration of relation lines to a specific node and the loss of important information are appropriately avoided.
An information map creation device includes upper limit value setting means for setting an upper limit value of a relational line connectable for each information element, and related information storage means for storing the strength of the relation for each relation between the information elements. Based on the above, in the descending order of the strength, the relation selection means for selecting the relation to be displayed as the relation line within the range of the upper limit value, and the relation that has not been selected as a display target because it exceeds the upper limit value range For each information element, and an upper limit value for increasing the upper limit value of the information element for which the number recorded in the upper limit excess number storage means is the maximum. Updating means, and the relation selection means re-executes the relation selection within the range of the updated upper limit value.
[Selection] Figure 5
Description
本発明は、情報要素間を接続する関係線によって情報要素間の関連性を表現する情報マップを作成する情報マップ作成装置、情報マップ作成方法、及びプログラムに関する。 The present invention relates to an information map creating apparatus, an information map creating method, and a program for creating an information map that expresses a relationship between information elements by a relationship line connecting the information elements.
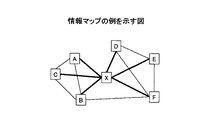
テキストマイニング製品や特許分析システム等には、検索や分析を支援するための情報マップ作成・表示機能が実装されている。情報マップでは、検索された情報又は分析対象とされた情報に含まれている単語やデータ項目(特許や文献の書誌情報等)の関係が図1に示されるようなネットワーク図として図解化される。情報マップ上の単語やデータ項目(以下、「情報要素」という。)の配置位置や情報要素間の関係線(エッジ)は、情報要素間の共起情報(同一文書に一緒に出現する度合いを示す情報)等を用いて決定又は作成される。情報マップとして、単語のマップを作成すれば文書群の主要トピックを知ることができる。情報マップとしてIPC(国際特許分類)のマップを作成すれば特許文書群の技術分野の依存関係を知ることができる。情報マップとして発明者のマップを作成すれば共同出願による人脈を知ることができる。このように、情報マップによって大量文書群の概要情報を容易に把握することが可能となる。 Text mining products, patent analysis systems, etc. are equipped with information map creation and display functions to support search and analysis. In the information map, the relationship between words and data items (patents and bibliographic information of patents) included in searched information or information to be analyzed is illustrated as a network diagram as shown in FIG. . The placement position of words and data items on the information map (hereinafter referred to as “information elements”) and the relationship lines (edges) between the information elements indicate the co-occurrence information between the information elements (the degree of appearance together in the same document). Information) or the like. If a word map is created as an information map, the main topics of the document group can be known. If an IPC (International Patent Classification) map is created as an information map, it is possible to know the dependency relationship of patent documents in the technical field. If an inventor's map is created as an information map, the network by joint application can be known. As described above, it is possible to easily grasp the summary information of the large-volume document group by the information map.
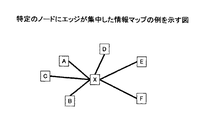
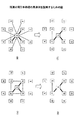
情報マップでは、図の可読性を高めるために、図を簡略化することが重要である。図の簡略化のためにエッジの間引きを行う技術が開発されている。エッジの間引きでは、関連の弱いエッジから順番に削除していく方式が一般的である。しかし、単純な間引き方式では特定のノードにエッジが集中してしまう可能性があった。その結果、ネットワーク図として意味の無い(情報量の無い)情報マップになってしまうことがあった。例えば、図2は、特定のノードにエッジが集中した情報マップの例を示す図である。図2のような情報マップでは、情報要素Xが他の情報要素と関係を有していることしか示されていない。 In the information map, it is important to simplify the diagram in order to improve the readability of the diagram. In order to simplify the drawing, a technique for performing edge thinning has been developed. In thinning out edges, a method of deleting in order from weakly related edges is common. However, there is a possibility that edges are concentrated on a specific node in the simple thinning method. As a result, the information map may be meaningless (no information amount) as a network diagram. For example, FIG. 2 is a diagram illustrating an example of an information map in which edges are concentrated on a specific node. The information map as shown in FIG. 2 only shows that the information element X has a relationship with other information elements.
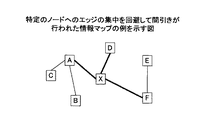
そこで、エッジの間引き方式を工夫(例えば、各ノードへの最大エッジ数を制限)することにより、特定ノードへのエッジ集中を回避するための技術が提案されている(例えば、特許文献1)。特許文献1に記載された技術によれば、図3に示されるように、エッジが特定のノードにノードが集中することを回避することができる。
Therefore, a technique for avoiding edge concentration on a specific node by devising the edge thinning method (for example, limiting the maximum number of edges to each node) has been proposed (for example, Patent Document 1). According to the technique described in
特許文献1の場合、特定のノードへのエッジの集中の回避のためには相対的に強いエッジが削除されてもやむを得ないという考え方に基づいている。具体的には、ノードの統計情報に基づいて事前に計算された最大エッジ数の制限により、相対的に強い関連に係るエッジよりも弱い関連に係るエッジが優先されて表示対象とされる可能性が有る。
In the case of
しかし、情報マップの表示状態としてどのようなものが最適であるかについては、情報マップの利用目的に応じて異なる。特定ノードへのエッジの集中を回避ことと、強い関連に係るエッジを表示対象として優先させることのバランスにおいて、後者により重きが置かれた情報マップが必要とされる場合もある。 However, the optimum display state of the information map varies depending on the purpose of use of the information map. In order to balance the concentration of edges on a specific node and prioritizing edges related to strong associations as display targets, an information map that is emphasized by the latter may be required.
本発明は、上記の点に鑑みてなされたものであって、特定のノードへの関係線の集中と重要な情報の欠落とが適切に回避された情報マップを作成することのできる情報マップ作成装置、情報マップ作成方法、及びプログラムの提供を目的とする。 The present invention has been made in view of the above points, and is an information map creation that can create an information map that appropriately avoids the concentration of relation lines to specific nodes and the loss of important information. An object is to provide an apparatus, an information map creation method, and a program.
そこで上記課題を解決するため、情報マップ作成装置は、情報要素ごとに接続可能な関係線の上限値を設定する上限値設定手段と、前記情報要素間の関連ごとに該関連の強度を記憶した関連情報記憶手段に基づいて、前記強度の大きい順に、前記上限値の範囲内で前記関係線として表示させる前記関連を選択する関連選択手段と、前記上限値の範囲を超えるため表示対象として選択されなかった前記関連の数を、前記情報要素ごとに上限超過回数記憶手段に記録する記録手段と、前記上限超過回数記憶手段に記録された数が最大である前記情報要素の前記上限値を所定数増加させる上限値更新手段とを有し、前記関連選択手段は、更新された前記上限値の範囲内で前記関連の選択を再実行する。 Therefore, in order to solve the above-described problem, the information map creation device stores an upper limit value setting unit that sets an upper limit value of a relation line that can be connected for each information element, and stores the strength of the relation for each relation between the information elements. Based on the relation information storage means, the relation selection means for selecting the relation to be displayed as the relation line within the range of the upper limit value in descending order of the strength, and the selection target to be displayed because it exceeds the range of the upper limit value. A recording unit that records the number of associations that did not exist in the upper limit excess number storage unit for each information element; and a predetermined number of the upper limit value of the information element that has the maximum number recorded in the upper limit excess number storage unit An upper limit updating means for increasing the relation, and the relation selection means re-executes the selection within the range of the updated upper limit value.
開示された技術によれば、特定のノードへの関係線の集中と重要な情報の欠落とが適切に回避された情報マップを作成することができる。 According to the disclosed technique, it is possible to create an information map in which the concentration of relation lines to a specific node and the lack of important information are appropriately avoided.
以下、図面に基づいて本発明の実施の形態を説明する。図4は、本発明の実施の形態における情報マップ作成装置のハードウェア構成例を示す図である。図4の情報マップ作成装置10は、それぞれバスBで相互に接続されているドライブ装置100と、補助記憶装置102と、メモリ装置103と、CPU104と、表示装置105と、入力装置106とを有する。
Hereinafter, embodiments of the present invention will be described with reference to the drawings. FIG. 4 is a diagram illustrating a hardware configuration example of the information map creation device according to the embodiment of the present invention. 4 includes a
情報マップ作成装置10での処理を実現するプログラムは、CD−ROM等の記録媒体101によって提供される。プログラムを記録した記録媒体101がドライブ装置100にセットされると、プログラムが記録媒体101からドライブ装置100を介して補助記憶装置102にインストールされる。但し、プログラムのインストールは必ずしも記録媒体101より行う必要はなく、ネットワークを介して他のコンピュータよりダウンロードするようにしてもよい。補助記憶装置102は、インストールされたプログラムを格納すると共に、必要なファイルやデータ等を格納する。
A program that realizes processing in the information
メモリ装置103は、プログラムの起動指示があった場合に、補助記憶装置102からプログラムを読み出して格納する。CPU104は、メモリ装置103に格納されたプログラムに従って情報マップ作成装置10に係る機能を実現する。表示装置105はプログラムによるGUI(Graphical User Interface)等を表示する。入力装置106はキーボード及びマウス等であり、様々な操作指示を入力させるために用いられる。
The
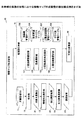
図5は、本発明の実施の形態における情報マップ作成装置の機能構成例を示す図である。同図において、情報マップ作成装置10は、文書管理DB11、検索部12、情報抽出集計部13、出力要素選定部14、拡張間引き部15、及び可視化処理部16等を有する。これら各部は、情報マップ作成装置10にインストールされたプログラムがCPU104に実行させる処理によって実現されるソフトウェアである。
FIG. 5 is a diagram illustrating a functional configuration example of the information map creation device according to the embodiment of the present invention. In the figure, an information
文書管理DB11は、補助記憶装置102を利用して文書(文書データ)を体系的に管理するデータベースである。本実施の形態において、文書の内容は問わない。特許文献、論文、書籍、又は業務上の資料等、多種多様な文書が対象となりうる。
The
検索部12は、入力される検索条件に合致した文書データを文書管理DB11より検索し、検索された文書の集合を対象文書集合21として出力する。すなわち、対象文書集合21には、各文書の内容(書誌情報及び文章等)が含まれる。本実施の形態では、対象文書集合21が情報マップの作成対象としての情報セットとなる。なお、対象文書集合21は、情報マップ作成装置10の外部より与えられてもよい。具体的には、ネットワーク又は可搬性の有る記録媒体等を介して対象文書集合21が情報マップ作成装置10に入力されてもよい。したがって、情報マップ作成装置10は、文書管理DB11及び検索部12を必ずしも有していなくてもよい。
The
情報抽出集計部13は、一般的な(周知又は公知の)情報解析処理を実行し、対象文書集合21からの情報要素の抽出、情報要素に関する統計情報の出力、情報要素間の関連の解析等を行う。情報抽出集計部13の処理結果は、抽出集計結果22として出力される。したがって、抽出集計結果22には、抽出された情報要素、統計情報、及び関連に関する情報(関連連情報)等が含まれる。なお、一般的な情報解析技術とは、文章を単語に分割する形態素解析処理、主語、述語、目的語、修飾関係等を抽出する係り受け解析処理、単語の出現頻度や重要度等を判定する統計処理、二つの単語が同時に出現する回数を集計する共起関係集計処理等を含む。また、情報要素とは、情報マップの作成対象の情報セットより抽出される単語、文書内の書誌情報の各項目の値等の情報セットの構成要素をいい、情報マップにおいてノードとなりうるものをいう。本実施の形態において、情報要素は文書より抽出される要素(すなわち、文書の構成要素)であるため文書要素ということもできる。文書内の書誌情報とは、特許文献を例とすると、願書における各項目や、明細書における発明の名称等である。
The information extraction /
出力要素選定部14は、抽出集計結果22に含まれる情報要素の中から、情報マップ上にノードとして表示対象とする情報要素を選定(選択)する。選定された情報要素、当該情報要素に関する統計情報及び関連情報等は、選定結果23として出力される。
The output
拡張間引き部15は、情報要素間の関連を間引くための処理を実行する。関連は、情報マップ上において関係線(エッジ)として表現される情報である。したがって、関連を間引くとは関係線を間引くこと(表示対象から除外すること)と実質的に同義である。前者は、コンピュータの処理内容の観点に基づく表現であり、後者は情報マップの視覚的な観点に基づく表現である。同様に、情報要素とノードとは実質的に同義である。
The extended thinning
拡張間引き部15は、上限接続数設定部151、関連選択部152、上限超過回数記録部153、上限接続数更新部154、接続数管理テーブル155、有効関連マトリクステーブル156、上限超過回数管理テーブル157、及びクラス値管理テーブル158等を含む。
The extended thinning
上限接続数設定部151は、選定結果23に含まれている各情報要素に対して、関係線の接続数の最大値(上限接続数)を設定する。設定結果は、接続数管理テーブル155に記録される。接続数管理テーブル155は、情報要素ごとに、上限接続数と、接続された関係線の数とを記録するためのテーブルである。
The upper limit connection
関連選択部152は、選定結果23に含まれている関連情報によって示される関連の中から、関係線として表示させる関連を選択する。関係線として表示可能な関連は、各情報要素に設定された上限接続数によって制限される。すなわち、同一の情報要素に対して、当該情報要素の上限接続数を超えて関連が存在する場合、関係線として表示可能な関連の数は、当該上限接続数に限定される。関係線として表示させる関連の選択結果は、有効関連マトリクステーブル156に記録される。有効関連マトリクステーブル156は、表示対象として有効な(すなわち、関係線の表示に用いられる)関連を記録するためのテーブルである。また、関係線の表示対象として選択された関連に基づいて、情報要素ごとに接続される関係線の数が接続数管理テーブル155に記録される。
The
上限超過回数記録部153は、情報要素ごとに、上限接続数の制限によって関係線の表示対象とされなかった関連の数(以下「上限超過回数」という。)を上限超過回数管理テーブル157に記録する。
The upper limit excess
上限接続数更新部154は、上限超回数に基づいて、一部の情報要素の上限接続数を更新する。上限接続数の更新後、関連選択部152等による処理が再実行される。
The upper limit connection
クラス値管理テーブル158は、情報要素ごとにクラス値が記録されるテーブルである。クラス値とは、関係線の表示対象として選択された関連による情報要素間の接続関係を識別するための識別子である。具体的には、当初、クラス値は、各情報要素に一意な値が割り当てられる。その後、関係線として表示される関連が選択されると、当該関連に係る情報要素のクラス値は、同じ値とされる。したがって、同じクラス値を有する情報要素は、直接的又は間接的に関係線によって接続されることを示す。間接的に接続されるとは、他の1以上の情報要素を介して二つの情報要素が接続されることをいう。 The class value management table 158 is a table in which class values are recorded for each information element. The class value is an identifier for identifying the connection relationship between information elements based on the relationship selected as the display target of the relationship line. Specifically, initially, a unique value is assigned to each information element as the class value. Thereafter, when an association displayed as a relation line is selected, the class values of the information elements related to the association are set to the same value. Thus, information elements having the same class value indicate that they are connected directly or indirectly by a relationship line. Indirect connection means that two information elements are connected via one or more other information elements.
なお、接続数管理テーブル155、有効関連マトリクステーブル156、上限超過回数管理テーブル157、及びクラス値管理テーブル158等の各テーブルは、メモリ装置103又は補助記憶装置102を用いて実現される。
Each table such as the connection number management table 155, the valid association matrix table 156, the upper limit excess number management table 157, and the class value management table 158 is realized using the
可視化処理部16は、拡張間引き部15による間引き処理の結果に基づいて情報マップを可視化させる。
The visualization processing unit 16 visualizes the information map based on the result of the thinning process by the extended thinning
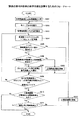
以下、情報マップ作成装置10の処理手順について説明する。図6は、情報マップ作成装置の処理手順を説明するためのフローチャートである。
Hereinafter, the processing procedure of the information
例えば、ユーザによる検索条件の入力に応じ、検索部12は当該検索条件に合致する文書の集合を文書管理DB11より検索し、検索された対象文書集合21をメモリ装置103又は補助記憶装置102(以下、「記憶手段」という。)に記録する(S101)。なお、検索条件によっては、対象文書集合21には一つの文書のみが含まれている場合もある。続いて、情報抽出集計部13は、対象文書集合21を解析し、情報要素の統計情報及び関連情報等を含む抽出集計結果22を記憶手段に出力する(S102)。
For example, in response to input of a search condition by the user, the
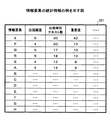
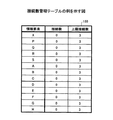
図7は、情報要素の統計情報の例を示す図である。同図において、統計情報221は、対象文書集合21より抽出された情報要素ごとに、出現頻度、出現単位テキスト数、及び重要度等を含む。すなわち、同図におけるアルファベット(X、P〜Q、及びA〜H等)は、情報要素を抽象的に表現したものであり、以下の説明においても同様である。出現頻度は、情報要素の全ての単位テキストにおける出現頻度の総和である。単位テキストは、「単語の連想関係によるテキストマイニング(情報処理学会第55回 情報学基礎研究会資料(1999)、渡部 勇、三木 和男)」(以下、「参考文献1」という。)にも記載されているように、一つの段落や一つの記事等の意味のある文の集合をいう。出現単位テキスト数は、情報要素が出現した単位テキストの総数である。重要度は、単位テキストの集合における情報要素の重要度をいい、単位テキストにおける情報要素の重要度の総和として求められる。単位テキストにおける情報要素の重要度は、情報要素の狭義の統計情報の関数として決定される。狭義の統計情報とは、単位テキストにおける情報要素の出現確率と全単位テキストの集合における情報要素の出現確率、又は単位テキストにおける情報要素の出現頻度と情報要素の出現単位テキスト数等である。なお、重要度についても参考文献1に詳しい。
FIG. 7 is a diagram illustrating an example of statistical information of information elements. In the figure, the
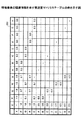
また、図8は、情報要素の関連情報を示す関連度マトリクステーブルの例を示す図である。同図において、関連度マトリクステーブル222は、関連を有する情報要素の組み合わせごとに(すなわち、情報要素間の関連ごとに)関連度が記録されたテーブルである。関連度は、例えば、同一単位テキスト内での重要度の積の総和であり、参考文献1に詳しい。但し、本実施の形態では、当該総和に対して重み付けを適用している。
FIG. 8 is a diagram illustrating an example of a relevance matrix table indicating related information of information elements. In the drawing, the relevance matrix table 222 is a table in which the relevance is recorded for each combination of information elements having a relevance (that is, for each relevance between information elements). The relevance is, for example, the sum of products of importance in the same unit text, and is detailed in
情報抽出集計部13は、更に、関連度マトリクステーブル222に関連度が記録された関連を、当該関連度に基づいて降順にソートし、ソート結果を関連度ソートテーブル223に記録する。
The information extraction /
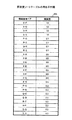
図9は、関連度ソートテーブルの例を示す図である。同図に示されるように、関連度ソートテーブル223には、関連度の降順に関連が記録されている。関連は、当該関連に係る(当該関連の両端の)情報要素の組み合わせ(情報要素ペア)によって表現されている。具体的には、二つの情報要素を示す符号(アルファベット)が「−(ハイフン)」によって接続されて表現されている。 FIG. 9 is a diagram illustrating an example of the relevance sort table. As shown in the figure, associations are recorded in the association degree sort table 223 in descending order of association degree. The association is expressed by a combination (information element pair) of information elements related to the association (at both ends of the association). Specifically, a code (alphabet) indicating two information elements is represented by being connected by “-(hyphen)”.
なお関連度に加えて、又は関連度の代わりに共起回数が算出されてもよい。共起回数は、例えば、単位テキスト内に同時に出現する(共起する)回数である。共起回数も、関連度と同様、関連の強度を示す指標値又は統計値である。 Note that the number of co-occurrence may be calculated in addition to the degree of association or instead of the degree of association. The number of times of co-occurrence is, for example, the number of times of appearing simultaneously (co-occurring) in the unit text. Similar to the degree of association, the number of co-occurrence is also an index value or statistical value indicating the strength of association.
続いて、出力要素選定部14は、統計情報221に基づいて情報マップの表示対象とする情報要素を選定(抽出)し、選定結果23を記憶手段に記録する(S103)。例えば、出現頻度の上位50番目までの情報要素が情報マップの構成要素として抽出される。抽出されなかったノードは、関連度マトリクステーブル222から除去される。したがって、抽出されなかったノードを含む情報要素ペアは、関連度ソートテーブル223から除去される。なお、出現単位テキスト数又は重要度等、統計情報221に含まれる他の指標に基づいて情報要素が選定されてもよい。
Subsequently, the output
続いて、拡張間引き部15は、関連の間引き処理を実行する(S104)。関連の間引き処理の詳細については後述する。続いて、可視化処理部16は、拡張間引き部15によって生成された情報に基づいて情報マップを可視化する(S105)。例えば、可視化処理部16は、表示装置106に情報マップを表示させる。又は、非図示のプリンタに情報マップを印刷させてもよい。なお、情報マップにおいて、各ノードの配置位置は、ノード間を結ぶ関係線の関連度の大きさによって決まる。すなわち、各関係線をスプリングとみなし、そのスプリングの長さや強さをそれぞれの関係線の関連度に応じで決める。各ノードに斥力が働くようにすることにより、スプリングと化した関係線の張力及び初期長とノード間の斥力との関係が安定した位置に各ノードの配置位置が決まる。ノードの配置位置の決定方法については、「テキストマイニングのための連想関係の可視化技術(情報処理学会第55回 情報学基礎研究会資料(1999)、三末 和男、渡部 勇)」に詳しい。
Subsequently, the extended thinning
続いて、ステップS104の詳細について説明する。図10は、関連の間引き処理の処理手順を説明するためのフローチャートである。 Next, details of step S104 will be described. FIG. 10 is a flowchart for explaining the processing procedure of the related thinning-out processing.
ステップS201において、上限接続数設定部151は、選定結果23に含まれている各情報要素に上限接続数を設定し、設定結果を接続数管理テーブル155に記録する。
In step S <b> 201, the upper limit connection
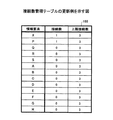
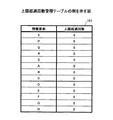
図11は、接続数管理テーブルの例を示す図である。同図に示されるように、接続数管理テーブル155には、情報要素ごとに、接続数及び上限接続数が記録される。上限接続数は、上記した通りであり、その値はステップS201において記録される。接続数は、後段の処理において関係線として表示される関連が選択された際に、当該関連に係る情報要素に対して値が加算される。すなわち、接続数は、情報要素に接続される関係線の数である。 FIG. 11 is a diagram illustrating an example of the connection number management table. As shown in the figure, the connection number management table 155 records the number of connections and the maximum number of connections for each information element. The upper limit number of connections is as described above, and the value is recorded in step S201. When the relation displayed as the relation line in the subsequent process is selected, a value is added to the information element related to the relation. That is, the number of connections is the number of relation lines connected to the information element.
同図に示されている上限接続数(「3」)は、例示に過ぎない。情報マップの見易さに関して妥当な範囲内で他の値が上限接続数とされてもよい。また、全ての情報要素に対する上限接続数は同じ値でなくてもよい。例えば、特許第4167855号公報に記載されている方法のように、統計情報221等に基づいて各情報要素の上限接続数が個別に決定されてもよい。
The upper limit number of connections (“3”) shown in the figure is merely an example. Other values may be used as the upper limit number of connections within a reasonable range for the visibility of the information map. Further, the upper limit number of connections for all information elements may not be the same value. For example, like the method described in Japanese Patent No. 4167855, the upper limit number of connections of each information element may be individually determined based on the
なお、同図では、便宜上、図7に示されている全ての情報要素が対象とされている。すなわち、図7に示されている全ての情報要素が選定結果23に含まれている例が示されている。以下の説明においては、図11に示されている情報要素が処理対象とされる。
In the figure, for convenience, all information elements shown in FIG. 7 are targeted. That is, an example in which all the information elements shown in FIG. 7 are included in the
続いて、関連選択部152は、有効関連マトリクステーブル156、接続数管理テーブル155、及び上限超過回数管理テーブル157を初期化する(S202)。初期化とは、テーブルの記録内容を空にすることをいう。
Subsequently, the
続いて、関連選択部152は、各情報要素にクラス値を設定し(割り当て)、設定結果をクラス値管理テーブル158に記録する(S203)。
Subsequently, the
図12は、クラス値管理テーブルの例を示す図である。同図では、各情報要素に1から順に番号が設定された例が示されている。クラス値の設定方法は、情報要素間で重複が生じない限り所定のものに限定されない、例えば、起点は1でなくてもよいし、ランダムな値が設定されてもよい。また、順序関係が明確であれば、数値に限定されあない。例えば、アルファベットがクラス値として用いられてもよい。 FIG. 12 is a diagram illustrating an example of a class value management table. In the figure, an example is shown in which numbers are set in order from 1 to each information element. The method of setting the class value is not limited to a predetermined one as long as there is no overlap between information elements. For example, the starting point may not be 1 or a random value may be set. Moreover, if the order relationship is clear, it is not limited to numerical values. For example, alphabets may be used as class values.
続いて、関連選択部152は、関連度ソートテーブル223の上位から順に一つのレコードを処理対象とする(S204)。すなわち、関連度が大きい(関連の強度が大きい)レコードら順に処理対象とされる。以下、処理対象とされた関連を「カレントレコード」という。
Subsequently, the
続いて、関連選択部152は、カレントレコードに係る二つの情報要素のクラス値を比較する(S205)。すなわち、二つの情報要素が直接的又は間接的に既に関係線によって接続されているか否かが判定される。各情報要素のクラス値はクラス値管理テーブル158より取得される。
Subsequently, the
二つの情報要素のクラス値が異なる場合(すなわち、両者は直接的又は間接的に関係線によって接続されていない場合)(S205でYes)、関連選択部152は、二つの情報要素の接続数はそれぞれ上限接続数未満であるか否かを接続数管理テーブル155を参照して判定する(S206)。二つの情報要素の接続数がそれぞれ上限接続数未満である場合(S206でYes)、関連選択部152は、カレントレコードに係る関連を表示対象として選択する(S207)。具体的には、関連選択部152は、有効関連マトリクステーブル156を更新する。
When the class values of the two information elements are different (that is, when the two information elements are not directly or indirectly connected by the relationship line) (Yes in S205), the
図13は、有効関連マトリクステーブルの例を示す図である。同図に示されるように、有効関連マトリクステーブル156は、情報要素の組み合わせごとに、関係線として表示される関連の有無の記録が可能とされている。具体的には、関係線として表示される関連が有る組み合わせに係るセルに対しては「1」が記録される。同図では、関連度ソートテーブル223において最上位のレコード(X−P)に係る関連が表示対象として有効化された例が示されている。情報要素Xと情報要素Pとが交差するセルは二つ有る。したがって、二つのセルに対して「1」が記録されている。 FIG. 13 is a diagram illustrating an example of an effective association matrix table. As shown in the figure, the valid association matrix table 156 can record the presence / absence of association displayed as a relation line for each combination of information elements. Specifically, “1” is recorded for a cell related to a combination having a relation displayed as a relation line. In the same figure, an example is shown in which the relation relating to the highest level record (X-P) in the relation degree sort table 223 is validated as a display target. There are two cells where the information element X and the information element P intersect. Therefore, “1” is recorded for two cells.
なお、関連が表示対象とされることは、当該関連を示す関係線が当該関連に係る二つの情報要素に接続されることを意味する。したがって、関連選択部152は、当該二つの情報要素について、接続数管理テーブル155における接続数を1ずつ増加する。
Note that the relation being a display target means that a relation line indicating the relation is connected to two information elements related to the relation. Therefore, the
図14は、接続数管理テーブルの更新例を示す図である。同図では、情報要素X及び情報要素Pのそれぞれの接続数に1が加算されている。 FIG. 14 is a diagram illustrating an example of updating the connection number management table. In the figure, 1 is added to the number of connections of each of the information element X and the information element P.
更に、当該二つの情報要素が関係線によって接続されていることを示すために、関連選択部152は、当該二つの情報要素のいずれか一方のクラス値を他方の値によって更新する。本実施の形態では、小さい方のクラス値によって大きい方のクラス値が更新されることとする。
Further, in order to indicate that the two information elements are connected by a relationship line, the
図15は、クラス値管理テーブルの更新例を示す図である。同図では、情報要素Pのクラス値が、情報要素Xのクラス値「1」によって更新されている。なお、更新される側のクラス値と同じクラス値を有する他の情報要素が存在する場合、当該他の情報要素についてもクラス値の更新が行われる。すなわち、クラス値の更新は、同一のクラス値を有する情報要素に伝搬する。それにより、間接的に接続された情報要素間におけるクラス値の共通性が確保される。 FIG. 15 is a diagram illustrating an update example of the class value management table. In the figure, the class value of the information element P is updated with the class value “1” of the information element X. If there is another information element having the same class value as the updated class value, the class value is also updated for the other information element. That is, the update of the class value is propagated to information elements having the same class value. Thereby, the commonality of the class value between the indirectly connected information elements is ensured.
このように、一つの関連が表示対象として選択されることにより、有効関連マトリクステーブル156、接続数管理テーブル155、及びクラス値管理テーブル158が更新される。 As described above, when one association is selected as a display target, the effective association matrix table 156, the connection number management table 155, and the class value management table 158 are updated.
一方、カレントレコードに係る二つの情報要素のクラス値が同じである場合(S205でNo)、又は二つの情報要素の少なくともいずれか一方の接続数が上限接続数に達している場合(S206でNo)、関連選択部152は、カレントレコードに係る関連は表示対象としない。二つの情報要素のクラス値が同じである場合に当該関連が表示対象とされないのは、情報マップの複雑化及び複雑化に伴う可読性の劣化を防止するためである。すなわち、クラス値が共通する二つの情報要素は、少なくとも間接的に関係線によって接続されている。そうすると、当該二つの情報要素の直接的な関連を表示対象としなくても、当該二つの情報要素が関連していることは情報マップ上において表現可能である。したがって、当該関連を表示させて表示要素を増加させるよりも、当該関連を非表示として表示要素を削減する方が、情報マップの情報量と見易さとのバランスにおいて好ましい結果を得られる可能性が高いからである。
On the other hand, when the class values of the two information elements related to the current record are the same (No in S205), or when the number of connections of at least one of the two information elements has reached the upper limit number of connections (No in S206). ), The
また、いずれか一方の接続数が上限接続数に達している場合に当該関連が表示対象とされないのは、接続数が上限接続数に達している情報要素に対する関係線の集中を回避するためのである。 In addition, when either number of connections has reached the upper limit number of connections, the relation is not displayed. This is in order to avoid the concentration of relation lines for information elements whose number of connections has reached the upper limit number of connections. is there.
一方、関連が表示対象として選択されない理由が、二つの情報要素の少なくともいずれか一方の接続数が上限接続数に達していいないことである場合(S206でNo)、上限超過回数記録部153は、上限超過回数管理テーブル157を更新する(S208)。
On the other hand, when the reason why the relationship is not selected as a display target is that the number of connections of at least one of the two information elements has not reached the upper limit connection number (No in S206), the upper limit excess
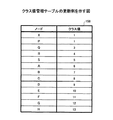
図16は、上限超過回数管理テーブルの例を示す図である。同図に示されるように、上限超過回数管理テーブル157は、情報要素ごとに上限超過回数を記録するためのテーブルである。ステップS208において、上限超過回数記録部153は、カレントレコードに係る情報要素のうち接続数が上限接続数に達している情報要素の上限超過回数に1を加算する。
FIG. 16 is a diagram illustrating an example of the upper limit excess count management table. As shown in the figure, the upper limit excess count management table 157 is a table for recording the upper limit excess count for each information element. In step S208, the upper limit excess
ステップS207、S208、又はS205でNoの場合に続いて、関連選択部152は、全ての情報要素に少なくとも1つの関係線が接続されたか(条件a)、又はカレントレコードが最後のレコードであるか(条件b)を判定する(S209)。全ての情報要素に少なくとも1つの関係線が接続されたか否かは、接続数管理テーブル155の接続数に基づいて判定される。すなわち、全ての情報要素に対する接続数が1以上であれば、全ての情報要素に少なくとも一つの関係線が接続されたと判定される。条件a及び条件bの双方が満たされていない場合(S209でNo)、ステップS204以降が繰り返し実行される。すなわち、関連度ソートテーブル223において次に関連度の大きいレコードがカレントレコードとされる。
Subsequent to No in step S207, S208, or S205, the
条件a又は条件bのいずれか一方が満たされる場合(S209でYes)、上限接続数更新部154は、上限超過回数管理テーブル157を参照して上限接続数を更新すべき情報要素の有無を判定する(S211)。具体的には、上限超過回数が最大である情報要素が上限接続数の更新対象として選択される。または、上限超過回数に係る関連の関連度の総和が最大である情報要素が更新対象として選択されてもよい。この場合、ステップS208において、上限超過回数の代わりに、カレントレコードに係る関連の関連度を加算するようにすればよい。また、複数の情報要素が選択された場合、そのうちの一部(例えば、一つ)が更新対象として選択されてもよいし、全てが選択されてもよい。なお、上限超過回数管理テーブル157において、全ての情報要素に対する上限超過回数が「0」の場合、上限接続数を増加させる情報要素は無いと判定される。
When either one of the condition a or the condition b is satisfied (Yes in S209), the upper limit connection
上限接続数を増加させる情報要素が無い場合(S210でNo)、図10の処理は終了する。上限接続数を増加させる情報要素が有る場合(S210でYes)、上限接続数更新部154は、更新対象として選択された情報要素は、前回更新対象とされた情報要素と同じであるか否かを判定する(S211)。すなわち、同じ情報要素の上限接続数が2回連続で更新対象とされたか否かを判定する。同じ情報要素の上限接続数が2回連続で更新対象とされた場合(S211でYes)、図10の処理は終了する。当該情報要素に対する関係線の集中を回避するためである。但し、上限接続数の更新対象として選択された情報要素が複数有る場合、前回更新対象として選択された情報要素と異なる情報要素が含まれていれば、当該異なる情報要素を更新対象として処理を継続してもよい。
If there is no information element for increasing the upper limit number of connections (No in S210), the process in FIG. 10 ends. When there is an information element that increases the upper limit connection number (Yes in S210), the upper limit connection
一方、前回更新対象として選択された情報要素と今回更新対象として選択された情報要素とが異なる場合(S211でNo)、上限接続数更新部154は、今回更新対象として選択された情報要素の上限接続数を更新する(S212)。具体的には、接続数管理テーブル155において、当該情報要素の上限接続数が増加される。増加分は1であってもよいし、2以上の所定値であってもよい。また、上限接続数更新部154は、更新対象とされた情報要素の履歴をメモリ装置103に記録しておく。次回実行されるステップS210における比較対象とするためである。続いて、ステップS202以降が繰り返し実行される。但し、ステップS202において、接続数管理テーブル155の上限接続数は初期化の対象とされない。
On the other hand, when the information element selected as the last update target and the information element selected as the current update target are different (No in S211), the upper limit connection
なお、ステップS211における終了条件は、2回連続で同じ情報要素が選択されたことに限定されない。一つの情報要素(ノード)に関係線が集中する可能性が高いことが判定できれば他の条件であってもよい。例えば、3回以上の所定回数で同じ情報要素が選択されたことが条件とされてもよい。または、N回中M回以上(ここで、N≧M)同じ情報要素が選択されたことが条件とされてもよい。当該条件の場合、必ずしも同じ情報要素が連続して更新対象とされなくても、処理は終了しうる。N=Mの場合は、N回連続で同じ情報要素が選択されたことを意味する。 Note that the end condition in step S211 is not limited to the same information element being selected twice in succession. Other conditions may be used as long as it is possible to determine that there is a high possibility that the relationship lines are concentrated on one information element (node). For example, the condition may be that the same information element is selected at a predetermined number of times of three or more. Alternatively, the condition may be that the same information element is selected M times or more (N ≧ M) in N times. In the case of this condition, the processing can be terminated even if the same information elements are not necessarily continuously updated. When N = M, it means that the same information element has been selected N times consecutively.
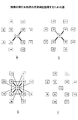
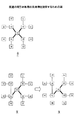
続いて、図10において説明した処理内容を具体例に当てはめて説明する。図17、図18、及び図19は、関連の間引き処理の具体例を説明するための図である。各図では、情報要素及び関連が情報マップの形式によって表現されている。当該具体例において、各情報要素の上限接続数は、図11に示されるとおり「3」であるとする。また、当該具体例では、図9に示される関連度ソートテーブル223を処理対象とする。 Subsequently, the processing content described in FIG. 10 will be described by applying a specific example. 17, FIG. 18, and FIG. 19 are diagrams for explaining a specific example of the related thinning process. In each figure, information elements and relationships are expressed in the form of an information map. In this specific example, it is assumed that the upper limit number of connections of each information element is “3” as shown in FIG. In this specific example, the relevance sort table 223 shown in FIG.
図17において(0)は、関連度マトリクステーブル222又は関連度ソートテーブル223に示されている全ての関連が有効化された(関係線として表示された)状態を示す。すなわち、関連の間引きが行われていない状態である。 In FIG. 17, (0) indicates a state in which all the associations shown in the association degree matrix table 222 or the association degree sort table 223 are activated (displayed as a relation line). That is, the related thinning is not performed.
(1)は、図10のステップS202の実行後の状態を示す。すなわち、全ての関連がクリアされた状態である。 (1) shows the state after execution of step S202 in FIG. That is, all the relations are cleared.
(2)は、関連度ソートテーブル223の上位3つのレコードが処理された状態を示す。まず、X−Pについて処理が行われる。この段階で、情報要素X(以下、単に「X」という。他の情報要素についても同じ。)とPとは、クラス値は異なる(S205でYes)。また、X及びPのそれぞれの接続数は「0」であり「3」未満である(S206でYes)。したがって、X−Pは表示対象として選択される(S207)。この段階では、全ての情報要素に対して関係線は接続されていない。また、X−Pは最後のレコードでもない(S209でNo)。したがって、続いてX−Qが処理対象とされる。X−Q及びX−Qに続いて処理されるX−RについてもX−Pと同様に処理され、各関連は表示対象として選択される。その結果、(2)の状態において、有効関連マトリクステーブル156、クラス値管理テーブル158、及び接続数管理テーブル155は、以下に示される通りになる。 (2) shows a state in which the top three records of the relevance sort table 223 have been processed. First, processing is performed for XP. At this stage, the information element X (hereinafter simply referred to as “X”; the same applies to other information elements) and P have different class values (Yes in S205). The number of connections of X and P is “0” and less than “3” (Yes in S206). Therefore, XP is selected as a display target (S207). At this stage, the relationship lines are not connected to all information elements. Further, XP is not the last record (No in S209). Accordingly, XQ is subsequently processed. X-R processed subsequent to X-Q and X-Q is also processed in the same manner as XP, and each association is selected as a display target. As a result, in the state (2), the valid association matrix table 156, the class value management table 158, and the connection number management table 155 are as shown below.
図20は、状態(2)における有効関連マトリクステーブルの例を示す図である。同図では、X−P、X−Q、又はX−Rに係る各セルに「1」が記録されている。 FIG. 20 is a diagram illustrating an example of an effective association matrix table in the state (2). In the figure, “1” is recorded in each cell related to XP, XQ, or XR.
また、図21は、状態(2)におけるクラス値管理テーブルの例を示す図である。同図では、X、P、Q、及びRのクラス値に「1」が記録されている。X−P、X−Q、及びX−Rが表示対象とされたことによりXのクラス値がP、Q、及びRに与えられた結果である。なお、図17(2)より明らかなように、これらの情報要素は直接的又は間接的に関係線によって接続されている。 FIG. 21 is a diagram illustrating an example of the class value management table in the state (2). In the figure, “1” is recorded in the class values of X, P, Q, and R. This is a result in which the class value of X is given to P, Q, and R because XP, XQ, and XR are the display targets. As is clear from FIG. 17 (2), these information elements are directly or indirectly connected by a relationship line.
また、図22は、状態(2)における接続数管理テーブルの例を示す図である。X−P、X−Q、及びX−Rの関連が表示対象とされたことにより、X、P、Q、Rのそれぞれの接続数として「3」、「1」、「1」、「1」が記録されている。 FIG. 22 is a diagram illustrating an example of the connection number management table in the state (2). Since the relation between XP, XQ, and XR is the display target, the number of connections of X, P, Q, and R is “3”, “1”, “1”, “1”. Is recorded.
続いて、(3)は、X−Sが処理された状態を示す。図22より明らかなように、Xの接続数は既に上限接続数に達している(S206でNo)。したがって、X−Sについては表示対象とされない。但し、X−Sが表示対象とされない理由がXの接続数が上限接続数に達していることであるため(S206でNo)、Xの上限超過回数に1が加算される。 Subsequently, (3) shows a state where XS has been processed. As is apparent from FIG. 22, the number of X connections has already reached the upper limit number of connections (No in S206). Therefore, XS is not a display target. However, since the reason why XS is not displayed is that the number of X connections has reached the upper limit number of connections (No in S206), 1 is added to the upper limit number of times of X.
図23は、状態(3)における上限超過回数管理テーブルの例を示す図である。同図では、Xに対する上限超過回数が「0」から「1」に更新されている。 FIG. 23 is a diagram illustrating an example of the upper limit excess count management table in the state (3). In the figure, the upper limit excess number for X is updated from “0” to “1”.
なお、(3)において、X−Sは点線によって示されている。点線は、当該破線に係る関連が表示対象として選択されなかったことを示す。以降の図においても同様である。 In (3), XS is indicated by a dotted line. The dotted line indicates that the relation related to the broken line has not been selected as a display target. The same applies to the subsequent drawings.
続いて、図18(4)は、P−Q、P−S、Q−R、及びR−Sが順番に処理された状態を示す。P−Qについて、P及びQは、クラス値が同じである(S205でNo)。したがって、P−Qは表示対象とされない。P−Sについて、PとSとはクラス値は異なる(S205でYes)。また、P及びSのそれぞれの接続数は「1」、「0」であり「3」未満である(S206でYes)。したがって、P−Sは、表示対象として選択される(S207)。Q−Rについて、Q及びRはクラス値が同じである(S205でNo)。したがって、Q−Rは表示対象とされない。R−Sについて、R及びSはクラス値が同じである(S205でNo)。したがって、R−Sは表示対象とされない。その結果、(5)に示される状態となる。(5)の状態において、有効関連マトリクステーブル156、クラス値管理テーブル158、及び接続数管理テーブル155は、以下に示される通りになる。 Subsequently, FIG. 18 (4) shows a state where PQ, PS, QR, and RS are processed in order. For PQ, P and Q have the same class value (No in S205). Therefore, PQ is not displayed. For PS, P and S have different class values (Yes in S205). Further, the numbers of connections of P and S are “1” and “0”, respectively, and less than “3” (Yes in S206). Therefore, PS is selected as a display target (S207). For QR, Q and R have the same class value (No in S205). Therefore, QR is not a display target. For RS, R and S have the same class value (No in S205). Therefore, RS is not a display target. As a result, the state shown in (5) is obtained. In the state (5), the valid association matrix table 156, the class value management table 158, and the connection number management table 155 are as shown below.
図24は、状態(5)における有効関連マトリクステーブルの例を示す図である。同図では、更に、P−Sに係る各セルに「1」が記録されている。 FIG. 24 is a diagram illustrating an example of an effective association matrix table in the state (5). In the drawing, “1” is further recorded in each cell related to PS.
また、図25は、状態(5)におけるクラス値管理テーブルの例を示す図である。P−Sが表示対象とされたことにより、Pのクラス値「1」がSに与えられている。 FIG. 25 is a diagram illustrating an example of the class value management table in the state (5). The class value “1” of P is given to S because PS is the display target.
また、図26は、状態(5)における接続数管理テーブルの例を示す図である。P−Sが表示対象とされたことにより、P及びSのそれぞれの接続数に1が加算されている。 FIG. 26 is a diagram illustrating an example of the connection number management table in the state (5). Since PS is displayed, 1 is added to the number of connections of P and S.
なお、(4)及び(5)において、上限超過回数管理テーブル157は更新されない。 In (4) and (5), the upper limit excess count management table 157 is not updated.
続いて、(6)は、X−A、X−B、X−C、X−D、X−E、X−F、X−G、及びX−Hが処理された状態を示す。図26より明らかなように、Xの接続数は既に上限接続数に達している(S207でNo)。したがって、これらの関連は、いずれも表示対象とされない。その結果、(7)に示される状態となる。すなわち、(5)と同じ状態が維持される。但し、各関連が表示対象とならない理由がXの接続数が上限接続数に達していることであるため(S207でNo)、Xの上限超過回数が更新される。 Subsequently, (6) shows a state in which X-A, X-B, X-C, X-D, X-E, X-F, X-G, and X-H are processed. As is apparent from FIG. 26, the number of X connections has already reached the upper limit number of connections (No in S207). Accordingly, none of these associations are displayed. As a result, the state shown in (7) is obtained. That is, the same state as (5) is maintained. However, the reason why each relation is not displayed is that the number of connections of X has reached the upper limit number of connections (No in S207), and therefore the upper limit number of times of X is updated.
図27は、状態(7)における上限超過回数管理テーブルの例を示す図である。同図では、Xの上限超過回数が「9」に更新されている。すなわち、図23の状態と比較して、「8」が加算されている。「8」は、(6)において、Xの接続数が原因で表示対象とされなかった関連の数である。 FIG. 27 is a diagram illustrating an example of the upper limit excess count management table in the state (7). In the figure, the upper limit number of times of X is updated to “9”. That is, “8” is added as compared with the state of FIG. “8” is the number of associations that are not targeted for display in (6) due to the number of X connections.
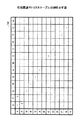
続いて、図19(8)は、P−A、P−B、Q−C、Q−D、R−E、R−F、S−G、及びS−Hが処理された状態を示す。P−Aについて、PとAとは、クラス値は異なる(S205でYes)。また、P及びAのそれぞれの接続数は「2」、「0」であり、いずれも「3」未満である(S206でYes)。したがって、P−Aは表示対象として選択される(S207)。P−Bについて、PとBとのクラス値は異なるが、P−Aが表示対象とされたことによりPの接続数が上限接続数に達している(S206でNo)。したがって、P−Bは表示対象とされない。但し、Pに対する上限超過回数に1が加算される。Q−Cについて、QとCとは、クラス値は異なる(S205でYes)。また、Q及びCのそれぞれの接続数は「1」、「0」であり、いずれも「3」未満である(S206でYes)。したがって、Q−Cは表示対象として選択される(S207)。以降、Q−D、R−E、R−F、S−G、及びS−Hについても表示対象として選択される。その結果、(9)に示される状態になる。(9)の状態において、有効関連マトリクステーブル156、クラス値管理テーブル158、接続数管理テーブル155、及び上限超過回数管理テーブル157は、以下に示される通りになる。 Subsequently, FIG. 19 (8) shows a state where PA, PB, QC, QD, RE, RF, SG, and SH are processed. Regarding PA, P and A have different class values (Yes in S205). Further, the numbers of connections of P and A are “2” and “0”, respectively, and both are less than “3” (Yes in S206). Therefore, PA is selected as a display target (S207). Regarding P-B, although the class values of P and B are different, the number of connections of P has reached the upper limit number of connections due to the display target of P-A (No in S206). Therefore, P-B is not a display target. However, 1 is added to the upper limit excess count for P. Regarding Q-C, Q and C have different class values (Yes in S205). The numbers of connections of Q and C are “1” and “0”, respectively, and both are less than “3” (Yes in S206). Therefore, QC is selected as a display target (S207). Thereafter, Q-D, R-E, R-F, S-G, and S-H are also selected as display targets. As a result, the state shown in (9) is obtained. In the state of (9), the valid association matrix table 156, the class value management table 158, the connection number management table 155, and the upper limit excess number management table 157 are as shown below.
図28は、状態(9)における有効関連マトリクステーブルの例を示す図である。同図では、P−A、Q−C、Q−D、R−E、R−F、S−G、及びS−Hに係る各セルに「1」が記録されている。 FIG. 28 is a diagram illustrating an example of an effective association matrix table in the state (9). In the figure, “1” is recorded in each cell related to PA, QC, QD, RE, RF, SG, and SH.
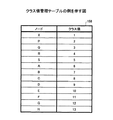
また、図29は、状態(9)におけるクラス値管理テーブルの例を示す図である。同図では、P−Aが表示対象とされたことにより、Pのクラス値「1」がAに与えられている。また、Q−C及びQ−Dが表示対象とされたことにより、Qのクラス値「1」がC及びDに与えられている。また、R−E及びR−Fが表示対象とされたことにより、Rのクラス値「1」がE及びFに与えられている。更に、S−G及びS−Hが表示対象とされたことにより、Sのクラス値「1」がG及びHに与えられている。 FIG. 29 is a diagram showing an example of the class value management table in the state (9). In the figure, the class value “1” of P is given to A because PA is a display target. Further, Q class value “1” is given to C and D because QC and QD are displayed. Further, the class value “1” of R is given to E and F by making R-E and R-F display targets. Furthermore, the class value “1” of S is given to G and H because S-G and S-H are the display targets.
また、図30は、状態(9)における接続数管理テーブルの例を示す図である。図26との比較において、同図では、P−Aが表示対象とされたことにより、P及びAのそれぞれの接続数に「1」が加算されている。また、Q−C及びQ−Dが表示対象とされたことにより、Qの接続数に「2」が加算され、C及びDのそれぞれの接続数に「1」が加算されている。また、R−E及びR−Fが表示対象とされたことにより、Rの接続数に「2」が加算され、E及びFのそれぞれの接続数に「1」が加算されている。更に、S−G及びS−Hが表示対象とされたことにより、Sの接続数に「2」が加算され、G及びHのそれぞれの接続数に「1」が加算されている。 FIG. 30 is a diagram illustrating an example of the connection number management table in the state (9). In comparison with FIG. 26, in FIG. 26, “1” is added to the number of connections of P and A because PA is a display target. Further, since QC and Q-D are displayed, “2” is added to the number of connections of Q, and “1” is added to the number of connections of C and D. Further, since R-E and R-F are displayed, “2” is added to the number of connections of R, and “1” is added to the number of connections of E and F. Furthermore, since S-G and S-H are displayed, “2” is added to the number of connections of S, and “1” is added to the number of connections of G and H.
更に、図31は、状態(9)における上限超過回数管理テーブルの例を示す図である。同図では、Pの接続数が上限接続数に達していることによりP−Sが表示対象として選択されなかったことに基づいて、Pの上限超過回数に「1」が加算されている。 Further, FIG. 31 is a diagram showing an example of the upper limit excess count management table in the state (9). In the figure, “1” is added to the upper limit number of Ps based on the fact that PS is not selected as a display target because the number of connections of P has reached the upper limit number of connections.
状態(9)において、関連度ソートテーブル223の全レコードが処理されたため(S209でYes)、上限接続数を増加させる情報要素の有無が判定される(S210)。図31より、上限超過回数が最大であるのは、Xである。したがって、Xの上限接続数は「3」から「4」に更新される(S212)。なお、図31の例では、上限超過回数に係る関連度の総和によって比較した場合もXの上限接続数が更新される。その結果、次のループ処理(S202以降の処理)では、図32に示される接続数管理テーブル155に基づいて、表示対象とする関連の選択、すなわち、関連の間引きが行われる。 In the state (9), since all records of the relevance sort table 223 have been processed (Yes in S209), the presence / absence of an information element that increases the upper limit number of connections is determined (S210). From FIG. 31, it is X that has the maximum number of times of exceeding the upper limit. Therefore, the upper limit number of connections of X is updated from “3” to “4” (S212). In the example of FIG. 31, the upper limit number of connections of X is also updated when compared by the sum of relevance levels related to the upper limit excess count. As a result, in the next loop process (the process after S202), the selection of the relation to be displayed, that is, the relation thinning out, is performed based on the connection number management table 155 shown in FIG.
図32は、上限接続数更新後の接続数管理テーブルの例を示す図である。同図では、Xの上限接続数が「3」から「4」に更新されている。なお、同図は、各情報要素の接続数は初期化された後の状態を示している。 FIG. 32 is a diagram illustrating an example of the connection number management table after the upper limit connection number is updated. In the figure, the upper limit number of connections of X is updated from “3” to “4”. The figure shows a state after the number of connections of each information element is initialized.
更新後の接続数管理テーブル155に基づく間引き処理では、Xに対する上限接続数が増加されているため、前回表示対象とされたかったX−Sが表示対象として選択される。X−Sが選択されることにより、P−Sは表示対象とされなくなる。P−Sの処理時において、PとSとのクラス値は同じ値になっている(すなわち、PとSとはXを介して間接的に接続されている)からである。P−Sが表示対象とされないことにより、P−Bが表示対象として選択される。P−Bの処理時において、Pの接続数は「2」であり、上限接続数未満だからである。その結果、(10)に示されるような状態となる。(10)の状態において、上限超過回数管理テーブル157は、以下に示される通りになる。 In the thinning process based on the connection number management table 155 after the update, since the upper limit number of connections for X has been increased, XS that was to be displayed last time is selected as the display target. When XS is selected, PS is not displayed. This is because the class values of P and S are the same during processing of PS (that is, P and S are indirectly connected via X). Since PS is not a display target, P-B is selected as a display target. This is because the number of P connections is “2” during the P-B process, which is less than the upper limit number of connections. As a result, the state shown in (10) is obtained. In the state of (10), the upper limit excess count management table 157 is as shown below.
図33は、状態(10)における上限超過回数管理テーブルの例を示す図である。同図において、上限超過回数が最大なのはXである。したがって、Xが上限接続数の更新対象として選択される。しかし、Xは前回も上限接続数の更新対象として選択されている。したがって、同一の情報要素が2回連続で上限接続数の更新対象として選択されることが終了条件である場合、(10)の情報マップが当該具体例の最終形となる。したがって、(10)の状態における有効関連マトリクステーブル156等に基づいて、可視化処理部16によって情報マップの可視化が実行される。 FIG. 33 is a diagram illustrating an example of the upper limit excess count management table in the state (10). In the figure, X is the largest number of times of exceeding the upper limit. Therefore, X is selected as an update target for the upper limit number of connections. However, X is selected as the update target of the upper limit connection number in the previous time as well. Accordingly, when the end condition is that the same information element is selected twice as an update target of the upper limit number of connections, the information map of (10) is the final form of the specific example. Therefore, the visualization processing unit 16 visualizes the information map based on the validity relation matrix table 156 and the like in the state of (10).
上限接続数が固定化されている(9)と、上限接続数が動的に変更された(10)とを比較すると、(10)では相対的に関連度の大きいX−SがP−Sに対して優先されて表示対象とされている。したがって、相対的に重要な関連の欠落が適切に回避されている。 Comparing (9) where the upper limit number of connections is fixed and (10) where the upper limit number of connections is dynamically changed, in (10), X-S having a relatively high relevance is PS. Is given priority for display. Therefore, the lack of relatively important associations is properly avoided.
また、情報要素に上限接続数が設定されていない(0)と、上限接続数が設定されている(10)とを比較すると、(10)ではXへの関係線の集中が回避されている。 Further, when comparing (0) in which the upper limit number of connections is not set in the information element with (10) in which the upper limit number of connections is set, in (10), the concentration of the relationship line to X is avoided. .
上述したように、本実施の形態における情報マップ作成装置10は、各情報要素に対する上限接続数を関連の間引き処理(表示対象とする関連の選択処理)の過程において動的に更新する。具体的には、関連の間引き処理の過程において、関係線が集中する可能性の高い情報要素に対する上限接続数が増加される。したがって、上限接続数が固定的な場合に比べて、相対的に関連度の大きい関連が表示対象として選択される可能性を高めることができる。
As described above, the information
また、動的に変更される上限接続数の範囲内で各情報要素への関係線の接続数は制限されるため、一つの情報要素への関係線の過度な集中を適切に回避することもできる。その結果、総合的に情報マップの可読性を向上させることができる。 In addition, since the number of connections of relation lines to each information element is limited within the range of the upper limit connection number that is dynamically changed, it is possible to appropriately avoid excessive concentration of relation lines to one information element. it can. As a result, the readability of the information map can be improved comprehensively.
以上、本発明の実施例について詳述したが、本発明は斯かる特定の実施形態に限定されるものではなく、特許請求の範囲に記載された本発明の要旨の範囲内において、種々の変形・変更が可能である。 As mentioned above, although the Example of this invention was explained in full detail, this invention is not limited to such specific embodiment, In the range of the summary of this invention described in the claim, various deformation | transformation・ Change is possible.
以上の説明に関し、更に以下の項を開示する。
(付記1)
情報要素に対応したノードを関係線によって接続することにより該情報要素間の関連を表現する情報マップを作成する情報マップ作成装置であって、
前記情報要素ごとに接続可能な前記関係線の上限値を設定する上限値設定手段と、
前記関連ごとに該関連の強度を記憶した関連情報記憶手段に基づいて、前記強度の大きい順に、前記上限値の範囲内で前記関係線として表示させる前記関連を選択する関連選択手段と、
前記上限値の範囲を超えるため表示対象として選択されなかった前記関連の数を、前記情報要素ごとに上限超過回数記憶手段に記録する記録手段と、
前記上限超過回数記憶手段に記録された数が最大である前記情報要素の前記上限値を所定数増加させる上限値更新手段とを有し、
前記関連選択手段は、更新された前記上限値の範囲内で前記関連の選択を再実行する情報マップ作成装置。
(付記2)
前記上限値更新手段は、前記上限値の更新対象とされた前記情報要素の履歴を履歴記憶手段に記録し、
前記関連選択手段は、第一の所定回数分の前記履歴に基づいて第二の所定回数以上同一の前記情報要素が前記更新対象とされると判定される場合は、前記関連の選択を再実行しない付記1記載の情報マップ作成装置。
(付記3)
前記関連選択手段は、前記履歴に基づいて同一の前記情報要素が連続して前記更新対象とされると判定される場合は、前記関連の選択を再実行しない付記2記載の情報マップ作成装置。
(付記4)
前記関連選択手段は、それぞれの前記情報要素に一意な識別子を割り当て、表示対象として選択された前記関連に係る一方の前記情報要素の識別子を他方の前記情報要素の前記識別子によって更新し、前記識別子が一致している前記情報要素間の前記関連は表示対象として選択しない付記1乃至3いずれか一項記載の情報マップ作成装置。
(付記5)
情報要素に対応したノードを関係線によって接続することにより該情報要素間の関連を表現する情報マップを作成するコンピュータが、
前記情報要素ごとに接続可能な前記関係線の上限値を設定する上限値設定手順と、
前記関連ごとに該関連の強度を記憶した関連情報記憶手段に基づいて、前記強度の大きい順に、前記上限値の範囲内で前記関係線として表示させる前記関連を選択する関連選択手順と、
前記上限値の範囲を超えるため表示対象として選択されなかった前記関連の数を、前記情報要素ごとに上限超過回数記憶手段に記録する記録手順と、
前記上限超過回数記憶手段に記録された数が最大である前記情報要素の前記上限値を所定数増加させる上限値更新手順とを実行し、
更新された前記上限値に基づいて前記関連選択手順を再実行する情報マップ作成方法。
(付記6)
前記上限値更新手順は、前記上限値の更新対象とされた前記情報要素の履歴を履歴記憶手段に記録し、
第一の所定回数分の前記履歴に基づいて第二の所定回数以上同一の前記情報要素が前記更新対象とされると判定される場合は、前記関連選択手順を再実行しない付記5記載の情報マップ作成方法。
(付記7)
前記履歴に基づいて同一の前記情報要素が連続して前記更新対象とされると判定される場合は、前記関連選択手順を再実行しない付記6記載の情報マップ作成方法。
(付記8)
前記関連選択手順は、それぞれの前記情報要素に一意な識別子を割り当て、表示対象として選択された前記関連に係る一方の前記情報要素の識別子を他方の前記情報要素の前記識別子によって更新し、前記識別子が一致している前記情報要素間の前記関連は表示対象として選択しない付記5乃至7いずれか一項記載の情報マップ作成方法。
(付記9)
情報要素に対応したノードを関係線によって接続することにより該情報要素間の関連を表現する情報マップを作成するコンピュータに、
前記情報要素ごとに接続可能な前記関係線の上限値を設定する上限値設定手順と、
前記関連ごとに該関連の強度を記憶した関連情報記憶手段に基づいて、前記強度の大きい順に、前記上限値の範囲内で前記関係線として表示させる前記関連を選択する関連選択手順と、
前記上限値の範囲を超えるため表示対象として選択されなかった前記関連の数を、前記情報要素ごとに上限超過回数記憶手段に記録する記録手順と、
前記上限超過回数記憶手段に記録された数が最大である前記情報要素の前記上限値を所定数増加させる上限値更新手順とを実行させ、
更新された前記上限値に基づいて前記関連選択手順を再実行させるプログラム。
(付記10)
前記上限値更新手順は、前記上限値の更新対象とされた前記情報要素の履歴を履歴記憶手段に記録し、
第一の所定回数分の前記履歴に基づいて第二の所定回数以上同一の前記情報要素が前記更新対象とされると判定される場合は、前記関連選択手順を再実行させない付記9記載のプログラム。
(付記11)
前記履歴に基づいて同一の前記情報要素が連続して前記更新対象とされると判定される場合は、前記関連選択手順を再実行させない付記10記載のプログラム。
(付記12)
前記関連選択手順は、それぞれの前記情報要素に一意な識別子を割り当て、表示対象として選択された前記関連に係る一方の前記情報要素の識別子を他方の前記情報要素の前記識別子によって更新し、前記識別子が一致している前記情報要素間の前記関連は表示対象として選択しない付記9乃至11いずれか一項記載のプログラム。
Regarding the above description, the following items are further disclosed.
(Appendix 1)
An information map creation device that creates an information map that expresses a relationship between information elements by connecting nodes corresponding to the information elements by relationship lines,
An upper limit setting means for setting an upper limit value of the relation line connectable for each information element;
A relation selection means for selecting the relation to be displayed as the relation line within the range of the upper limit value in descending order of the strength based on the relation information storage means storing the strength of the relation for each relation;
Recording means for recording the number of associations not selected as a display target because it exceeds the range of the upper limit value in the upper limit excess number storage unit for each information element;
An upper limit update means for increasing the upper limit value of the information element whose number recorded in the upper limit excess number storage means is the maximum, by a predetermined number;
The association selection unit is an information map creation device that re-executes the association selection within the range of the updated upper limit value.
(Appendix 2)
The upper limit value update means records the history of the information element that is the update target of the upper limit value in a history storage means,
The relation selection unit re-executes the selection of the relation when it is determined that the same information element is equal to or more than the second predetermined number of times based on the history for the first predetermined number of times. The information map creation device according to
(Appendix 3)
The information map creating apparatus according to
(Appendix 4)
The association selection unit assigns a unique identifier to each of the information elements, updates the identifier of one of the information elements related to the association selected as a display target with the identifier of the other information element, and The information map creation device according to any one of
(Appendix 5)
A computer that creates an information map that expresses a relationship between information elements by connecting nodes corresponding to the information elements by relationship lines,
An upper limit value setting procedure for setting an upper limit value of the relation line connectable for each information element;
A relation selection procedure for selecting the relation to be displayed as the relation line within the range of the upper limit value in descending order of the strength based on the relation information storage means storing the strength of the relation for each relation;
A recording procedure for recording the number of associations not selected as a display target because it exceeds the range of the upper limit value in the upper limit excess number storage unit for each information element;
An upper limit update procedure for increasing the upper limit value of the information element whose number recorded in the upper limit excess number storage means is a maximum by a predetermined number;
An information map creation method for re-executing the related selection procedure based on the updated upper limit value.
(Appendix 6)
The upper limit update procedure records a history of the information element that is an update target of the upper limit in a history storage unit,
The information according to
(Appendix 7)
The information map creation method according to
(Appendix 8)
The association selection procedure assigns a unique identifier to each of the information elements, updates an identifier of one of the information elements related to the association selected as a display target with the identifier of the other information element, and The information map creation method according to any one of
(Appendix 9)
A computer that creates an information map that expresses a relationship between information elements by connecting nodes corresponding to the information elements by relationship lines;
An upper limit value setting procedure for setting an upper limit value of the relation line connectable for each information element;
A relation selection procedure for selecting the relation to be displayed as the relation line within the range of the upper limit value in descending order of the strength based on the relation information storage means storing the strength of the relation for each relation;
A recording procedure for recording the number of associations not selected as a display target because it exceeds the range of the upper limit value in the upper limit excess number storage unit for each information element;
An upper limit update procedure for increasing the upper limit value of the information element whose number recorded in the upper limit excess number storage means is a maximum by a predetermined number;
A program for re-executing the related selection procedure based on the updated upper limit value.
(Appendix 10)
The upper limit update procedure records a history of the information element that is an update target of the upper limit in a history storage unit,
The program according to
(Appendix 11)
The program according to
(Appendix 12)
The association selection procedure assigns a unique identifier to each of the information elements, updates an identifier of one of the information elements related to the association selected as a display target with the identifier of the other information element, and The program according to any one of
10 情報マップ作成装置
11 文書管理DB
12 検索部
13 情報抽出集計部
14 出力要素選定部
15 拡張間引き部
16 可視化処理部
100 ドライブ装置
101 記録媒体
102 補助記憶装置
103 メモリ装置
104 CPU
105 表示装置
106 入力装置
151 上限接続数設定部
152 関連選択部
153 上限超過回数記録部
154 上限接続数更新部
155 接続数管理テーブル
156 有効関連マトリクステーブル
157 上限超過回数管理テーブル
158 クラス値管理テーブル
B バス
10 Information
DESCRIPTION OF
105
Claims (6)
前記情報要素ごとに接続可能な前記関係線の上限値を設定する上限値設定手段と、
前記関連ごとに該関連の強度を記憶した関連情報記憶手段に基づいて、前記強度の大きい順に、前記上限値の範囲内で前記関係線として表示させる前記関連を選択する関連選択手段と、
前記上限値の範囲を超えるため表示対象として選択されなかった前記関連の数を、前記情報要素ごとに上限超過回数記憶手段に記録する記録手段と、
前記上限超過回数記憶手段に記録された数が最大である前記情報要素の前記上限値を所定数増加させる上限値更新手段とを有し、
前記関連選択手段は、更新された前記上限値の範囲内で前記関連の選択を再実行する情報マップ作成装置。 An information map creation device that creates an information map that expresses a relationship between information elements by connecting nodes corresponding to the information elements by relationship lines,
An upper limit setting means for setting an upper limit value of the relation line connectable for each information element;
A relation selection means for selecting the relation to be displayed as the relation line within the range of the upper limit value in descending order of the strength based on the relation information storage means storing the strength of the relation for each relation;
Recording means for recording the number of associations not selected as a display target because it exceeds the range of the upper limit value in the upper limit excess number storage unit for each information element;
An upper limit update means for increasing the upper limit value of the information element whose number recorded in the upper limit excess number storage means is the maximum, by a predetermined number;
The association selection unit is an information map creation device that re-executes the association selection within the updated upper limit range.
前記関連選択手段は、第一の所定回数分の前記履歴に基づいて第二の所定回数以上同一の前記情報要素が前記更新対象とされると判定される場合は、前記関連の選択を再実行しない請求項1記載の情報マップ作成装置。 The upper limit value update means records the history of the information element that is the update target of the upper limit value in a history storage means,
The relation selection unit re-executes the selection of the relation when it is determined that the same information element is equal to or more than the second predetermined number of times based on the history for the first predetermined number of times. The information map creating apparatus according to claim 1, wherein:
前記情報要素ごとに接続可能な前記関係線の上限値を設定する上限値設定手順と、
前記関連ごとに該関連の強度を記憶した関連情報記憶手段に基づいて、前記強度の大きい順に、前記上限値の範囲内で前記関係線として表示させる前記関連を選択する関連選択手順と、
前記上限値の範囲を超えるため表示対象として選択されなかった前記関連の数を、前記情報要素ごとに上限超過回数記憶手段に記録する記録手順と、
前記上限超過回数記憶手段に記録された数が最大である前記情報要素の前記上限値を所定数増加させる上限値更新手順とを実行し、
更新された前記上限値に基づいて前記関連選択手順を再実行する情報マップ作成方法。 A computer that creates an information map that expresses a relationship between information elements by connecting nodes corresponding to the information elements by relationship lines,
An upper limit value setting procedure for setting an upper limit value of the relation line connectable for each information element;
A relation selection procedure for selecting the relation to be displayed as the relation line within the range of the upper limit value in descending order of the strength based on the relation information storage means storing the strength of the relation for each relation;
A recording procedure for recording the number of associations not selected as a display target because it exceeds the range of the upper limit value in the upper limit excess number storage unit for each information element;
An upper limit update procedure for increasing the upper limit value of the information element whose number recorded in the upper limit excess number storage means is a maximum by a predetermined number;
An information map creation method for re-executing the related selection procedure based on the updated upper limit value.
前記情報要素ごとに接続可能な前記関係線の上限値を設定する上限値設定手順と、
前記関連ごとに該関連の強度を記憶した関連情報記憶手段に基づいて、前記強度の大きい順に、前記上限値の範囲内で前記関係線として表示させる前記関連を選択する関連選択手順と、
前記上限値の範囲を超えるため表示対象として選択されなかった前記関連の数を、前記情報要素ごとに上限超過回数記憶手段に記録する記録手順と、
前記上限超過回数記憶手段に記録された数が最大である前記情報要素の前記上限値を所定数増加させる上限値更新手順とを実行させ、
更新された前記上限値に基づいて前記関連選択手順を再実行させるプログラム。 A computer that creates an information map that expresses a relationship between information elements by connecting nodes corresponding to the information elements by relationship lines;
An upper limit value setting procedure for setting an upper limit value of the relation line connectable for each information element;
A relation selection procedure for selecting the relation to be displayed as the relation line within the range of the upper limit value in descending order of the strength based on the relation information storage means storing the strength of the relation for each relation;
A recording procedure for recording the number of associations not selected as a display target because it exceeds the range of the upper limit value in the upper limit excess number storage unit for each information element;
An upper limit update procedure for increasing the upper limit value of the information element whose number recorded in the upper limit excess number storage means is a maximum by a predetermined number;
A program for re-executing the related selection procedure based on the updated upper limit value.
Priority Applications (1)
| Application Number | Priority Date | Filing Date | Title |
|---|---|---|---|
| JP2009281894A JP5434551B2 (en) | 2009-12-11 | 2009-12-11 | Information map creation device, information map creation method, and program |
Applications Claiming Priority (1)
| Application Number | Priority Date | Filing Date | Title |
|---|---|---|---|
| JP2009281894A JP5434551B2 (en) | 2009-12-11 | 2009-12-11 | Information map creation device, information map creation method, and program |
Publications (2)
| Publication Number | Publication Date |
|---|---|
| JP2011123743A true JP2011123743A (en) | 2011-06-23 |
| JP5434551B2 JP5434551B2 (en) | 2014-03-05 |
Family
ID=44287562
Family Applications (1)
| Application Number | Title | Priority Date | Filing Date |
|---|---|---|---|
| JP2009281894A Expired - Fee Related JP5434551B2 (en) | 2009-12-11 | 2009-12-11 | Information map creation device, information map creation method, and program |
Country Status (1)
| Country | Link |
|---|---|
| JP (1) | JP5434551B2 (en) |
Cited By (1)
| Publication number | Priority date | Publication date | Assignee | Title |
|---|---|---|---|---|
| JP2015115066A (en) * | 2013-12-06 | 2015-06-22 | パロ・アルト・リサーチ・センター・インコーポレーテッドPalo Alto Research Center Incorporated | Efficient detection of information of interest using mode-based graph clustering |
Citations (4)
| Publication number | Priority date | Publication date | Assignee | Title |
|---|---|---|---|---|
| JP2005122295A (en) * | 2003-10-14 | 2005-05-12 | Fujitsu Ltd | Relationship diagram creation program, relationship diagram creation method, and relationship diagram creation device |
| JP4167855B2 (en) * | 2002-06-20 | 2008-10-22 | 富士通株式会社 | Information map creation method |
| JP2009075881A (en) * | 2007-09-20 | 2009-04-09 | Fujitsu Ltd | Text analysis program, text analysis method, and text analysis apparatus |
| JP2009205517A (en) * | 2008-02-28 | 2009-09-10 | Toshiba Corp | Information processor and information processing method |
-
2009
- 2009-12-11 JP JP2009281894A patent/JP5434551B2/en not_active Expired - Fee Related
Patent Citations (4)
| Publication number | Priority date | Publication date | Assignee | Title |
|---|---|---|---|---|
| JP4167855B2 (en) * | 2002-06-20 | 2008-10-22 | 富士通株式会社 | Information map creation method |
| JP2005122295A (en) * | 2003-10-14 | 2005-05-12 | Fujitsu Ltd | Relationship diagram creation program, relationship diagram creation method, and relationship diagram creation device |
| JP2009075881A (en) * | 2007-09-20 | 2009-04-09 | Fujitsu Ltd | Text analysis program, text analysis method, and text analysis apparatus |
| JP2009205517A (en) * | 2008-02-28 | 2009-09-10 | Toshiba Corp | Information processor and information processing method |
Cited By (1)
| Publication number | Priority date | Publication date | Assignee | Title |
|---|---|---|---|---|
| JP2015115066A (en) * | 2013-12-06 | 2015-06-22 | パロ・アルト・リサーチ・センター・インコーポレーテッドPalo Alto Research Center Incorporated | Efficient detection of information of interest using mode-based graph clustering |
Also Published As
| Publication number | Publication date |
|---|---|
| JP5434551B2 (en) | 2014-03-05 |
Similar Documents
| Publication | Publication Date | Title |
|---|---|---|
| JP4848317B2 (en) | Database indexing system, method and program | |
| CN102893239B (en) | Text input system and text input method for electronic equipment | |
| US9390086B2 (en) | Classification system with methodology for efficient verification | |
| US20250139360A1 (en) | Technologies for relating terms and ontology concepts | |
| US9996742B2 (en) | System and method for global identification in a collection of documents | |
| CN111368130A (en) | Quality inspection method, device and equipment for customer service recording and storage medium | |
| US20170068866A1 (en) | Method and system for data extraction from images of semi-structured documents | |
| US8386238B2 (en) | Systems and methods for evaluating a sequence of characters | |
| WO2012096388A1 (en) | Unexpectedness determination system, unexpectedness determination method, and program | |
| WO2022134824A1 (en) | Tuning query generation patterns | |
| Chi et al. | Developing base domain ontology from a reference collection to aid information retrieval | |
| US20240403556A1 (en) | Technologies for relating terms and ontology concepts | |
| JP5347878B2 (en) | Inter-literature relationship analysis apparatus, program, and method | |
| CN112487787B (en) | A method and device for determining target information based on knowledge graph | |
| US10698978B1 (en) | System of english language sentences and words stored in spreadsheet cells that read those cells and use selected sentences that analyze columns of text and compare cell values to read other cells in one or more spreadsheets | |
| JP2012181605A (en) | Data analysis support device and program | |
| JP5434551B2 (en) | Information map creation device, information map creation method, and program | |
| JP2009075881A (en) | Text analysis program, text analysis method, and text analysis apparatus | |
| JP5252596B2 (en) | Character recognition device, character recognition method and program | |
| CN109062898A (en) | Characteristic word duplication eliminating method, device and equipment and storage medium thereof | |
| US20210357867A1 (en) | Method, system and computer-readable medium for information retrieval | |
| Topaz | NimbleMiner: A novel multi-lingual text mining application | |
| JP2000293537A (en) | Data analysis support method and apparatus | |
| US10984168B1 (en) | System and method for generating a multi-modal abstract | |
| JP5381299B2 (en) | Information map creation device, information map creation method, and program |
Legal Events
| Date | Code | Title | Description |
|---|---|---|---|
| A621 | Written request for application examination |
Free format text: JAPANESE INTERMEDIATE CODE: A621 Effective date: 20120815 |
|
| TRDD | Decision of grant or rejection written | ||
| A01 | Written decision to grant a patent or to grant a registration (utility model) |
Free format text: JAPANESE INTERMEDIATE CODE: A01 Effective date: 20131112 |
|
| A61 | First payment of annual fees (during grant procedure) |
Free format text: JAPANESE INTERMEDIATE CODE: A61 Effective date: 20131125 |
|
| R150 | Certificate of patent or registration of utility model |
Ref document number: 5434551 Country of ref document: JP Free format text: JAPANESE INTERMEDIATE CODE: R150 Free format text: JAPANESE INTERMEDIATE CODE: R150 |
|
| LAPS | Cancellation because of no payment of annual fees |