JP2010509609A - Estimating the color of the colorant on the substrate - Google Patents
Estimating the color of the colorant on the substrate Download PDFInfo
- Publication number
- JP2010509609A JP2010509609A JP2009537148A JP2009537148A JP2010509609A JP 2010509609 A JP2010509609 A JP 2010509609A JP 2009537148 A JP2009537148 A JP 2009537148A JP 2009537148 A JP2009537148 A JP 2009537148A JP 2010509609 A JP2010509609 A JP 2010509609A
- Authority
- JP
- Japan
- Prior art keywords
- colorant
- information
- color
- color value
- computer
- Prior art date
- Legal status (The legal status is an assumption and is not a legal conclusion. Google has not performed a legal analysis and makes no representation as to the accuracy of the status listed.)
- Ceased
Links
Images


Classifications
-
- H—ELECTRICITY
- H04—ELECTRIC COMMUNICATION TECHNIQUE
- H04N—PICTORIAL COMMUNICATION, e.g. TELEVISION
- H04N1/00—Scanning, transmission or reproduction of documents or the like, e.g. facsimile transmission; Details thereof
- H04N1/46—Colour picture communication systems
- H04N1/56—Processing of colour picture signals
- H04N1/60—Colour correction or control
- H04N1/6016—Conversion to subtractive colour signals
Abstract
被印刷物上の色の印刷後の外観を正確に推定するシステム及び方法が提供される。さらに、被印刷物上で混合された幾つかの色の混合後の外観を正確に推定するシステム及び方法が提供される。Systems and methods are provided for accurately estimating the post-print appearance of colors on a substrate. In addition, systems and methods are provided for accurately estimating the combined appearance of several colors mixed on a substrate.
Description
本発明は、Nカラー印刷システムの出力の測色値の推定に関する。 The present invention relates to estimation of a colorimetric value of an output of an N color printing system.
A.個々のスポットカラー(ソリッド及び淡い色(Solids and Tints)
当該技術分野で知られている、PrinergyTM/Evo、VerisTM、及びInSiteTMのようなワークフロー及び校正システムは、スポットカラー、すなわちノーマルなシアン、マゼンダ、イエロー及びブラック(CMYK)のプロセスカラーを超える余分の印刷インクをサポートする手段を典型的に提供する。(Prinergy及びVerisは、ニューヨーク州ロチェスターにあるイーストマン・コダック社の登録商標である。)PantoneTMライブラリのような色の名前とそれらの立体のL*a*b*測定の標準のリストは、スポットカラーを識別するやり方として提供されている。(Pantoneは、Pantone社、590 Commerce Boulevard, Carlstadt, New Jersey 07072-3098に位置するDelawareの企業の登録商標である。)標準のリストに含まれない色は、CIELAB又は係る色のスペクトル測定を提供可能なユーザにより識別することができる。RainbowTMDesktop Proofing Systemのような従来の歴史的な校正システムは、ソリッドなスポットカラーだけでなく、淡い色(すなわち100%以下の濃度)のスポットカラーのCIELAB測定を加える能力をユーザに提供する。(Rainbowは、Kodak Polychrome Graphics、401 Merritt#7 Norwald, Connecticut 06851に位置するDelawareのLLCの登録商標である)これらの従来の校正システムは、係る淡い色のスポットカラーの印刷された外観をシミュレートするため、シンプルなスプラインの補間を実行する。
A. Individual spot colors (Solids and Tints)
Known in the art, Prinergy TM / Evo, workflow and calibration system such as Veris TM, and InSite TM is greater than the spot color, i.e. a normal cyan, magenta, process color of yellow and black (CMYK) A means of supporting excess printing ink is typically provided. (Prinergy and Veris are registered trademarks of Eastman Kodak Company in Rochester, NY.) List of color names such as Pantone TM libraries and standards for L * a * b * measurements of those solids are: It is provided as a way to identify spot colors. (Pantone is a registered trademark of the Delaware company located in Pantone, 590 Commerce Boulevard, Carlstadt, New Jersey 07072-3098.) Colors not included in the standard list provide spectral measurements of CIELAB or such colors Can be identified by possible users. Traditional historical proofing systems such as Rainbow ™ Desktop Proofing System provide the user with the ability to apply CIELAB measurements not only for solid spot colors, but also for spot colors that are light (ie, less than 100% density). (Rainbow is a registered trademark of Delaware LLC located at Kodak Polychrome Graphics, 401 Merritt # 7 Norwald, Connecticut 06851) These conventional proofing systems simulate the printed appearance of such pale spot colors To do simple spline interpolation.
スポットカラー処理は、スポットカラーを含むベクトルオブジェクトと同様に、赤−緑−青(RGB)又はCMYK画像を含む当該技術分野で知られるEPS又はPDFファイルをラスタ画像処理することで典型的に実行される。目的がCMYKインクのみによるプレス機である場合、ベクトルオブジェクトは、CMYK近似に変換され、スポットカラーの名前を持つファイルにしばしば埋め込まれる。目的のプレスが要求されるスポットカラーのインクを実際にサポートする場合、ファイルは、それぞれの目的のスポットカラーの個別のビットマッププレーンと同様に、C,M,Y及びKの個別のビットマッププレーンにRIPされる。 Spot color processing is typically performed by raster image processing EPS or PDF files known in the art including red-green-blue (RGB) or CMYK images as well as vector objects containing spot colors. The If the purpose is a press with only CMYK inks, vector objects are converted to CMYK approximations and are often embedded in files with spot color names. If the target press actually supports spot color inks that are required, the file will contain C, M, Y and K individual bitmap planes as well as individual bitmap planes for each target spot color. RIP.
しかし、これらの従来のワークフロー及び校正システムは、スポットカラーが使用されるときに制限を有する。1つの問題は、良好なカラーマネージメントのインフラストラクチャがCMYKを扱うために存在するが、同じことがスポットカラーについても当てはまらないことである。たとえば、標準のSWOPのために用意されたファイルが新聞印刷用紙上の印刷のために変換を必要とする場合、CMYK画像は、特定のソース及びデスティネーションプロファイルを使用して変換することができる。しかし、スポットカラーを適切に変換することが困難である。これは、係る変換は、ソース及びデスティネーションの両者について、それぞれのスポットカラーの固有のプロファイルの等価なものを必要とするからである。 However, these conventional workflow and proofing systems have limitations when spot colors are used. One problem is that a good color management infrastructure exists to handle CMYK, but the same is not true for spot colors. For example, if a file prepared for standard SWOP requires conversion for printing on newsprint, CMYK images can be converted using a specific source and destination profile. However, it is difficult to properly convert spot colors. This is because such conversion requires an equivalent of the unique profile of each spot color for both the source and destination.
別の問題は、従来のワークフロー及び校正システムでは、印刷後にスポットカラーの外観を正確に校正及び推定することは、要求されるインフラストラクチャ及び測定の両者の観点で困難となっている。特に、推定に関わる計算の数及び計算のために必要とされるルックアップテーブル(LUT)のサイズは、混合に加えられるそれぞれの付加的な色と共に指数関数的に増加する。たとえば、C,M,Y,Kの4色が印刷される場合、計算の数及びLUTのサイズは、4の指数に上昇される数から導出され、C,M,Y,Kに1のスポットカラーを加えた5色が印刷された場合、計算の数及びLUTのサイズは、5の指数に上昇される数から導出される。この問題点は、ドットゲイン、被印刷物の色等において異なる多数の異なる印刷条件での使用のためにスポットカラー値からなる1つのデータベースを使用するときに悪化される。 Another problem is that in conventional workflows and proofing systems, it is difficult to accurately calibrate and estimate the appearance of spot colors after printing, both in terms of required infrastructure and measurement. In particular, the number of calculations involved in the estimation and the size of the lookup table (LUT) required for the calculations increases exponentially with each additional color added to the blend. For example, if four colors C, M, Y, and K are printed, the number of calculations and the size of the LUT are derived from numbers that are raised to an index of 4 and one spot in C, M, Y, and K If 5 colors plus colors are printed, the number of calculations and the size of the LUT is derived from the number raised to an index of 5. This problem is exacerbated when using a single database of spot color values for use in a number of different printing conditions that differ in dot gain, substrate color, etc.
更に別の問題は、あるプレス機での実際の印刷ジョブと比較して、鮮鋭な良好に定義されたドットを印刷することができない点であり、非常にソフトなエッジのドットが得られることがあり、これは、実際に不鮮明なドットを示す場合があり、それらのインク膜の厚さを低減する場合があり、ドットに隣接する画像形成されない領域をも着色する場合がある。(したがって、「不鮮明“smearing”」及び「着色“staining”」効果は、本明細書において交換可能に示される。)拡大鏡の下で係る印刷ジョブを見ることで、ドットの濃度がソリッドなドットよりも幾分低いことが検出されることがある。 Yet another problem is that sharp, well-defined dots cannot be printed compared to an actual print job on a certain press, resulting in very soft edge dots. Yes, this may actually show smeared dots, which may reduce the thickness of those ink films, and may also color non-imaged areas adjacent to the dots. (Thus, the “smearing” and “staining” effects are shown interchangeably herein.) By looking at such a print job under a magnifying glass, the dot density is solid. May be detected to be somewhat lower.
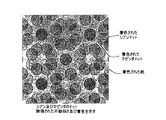
図5及び図6に例示されるように、中間調のスクリーンの「ホール」(すなわち着色剤のドット間で被印刷物が目に見える領域)がドットを印刷するために使用されるインクにより着色されることも検出される。したがって、インクの着色により、ドットの最大濃度Dmaxが低減され、隣接する被印刷物のホール最小濃度Dminが増加される。これらは、共にドット又はインクの不鮮明さの現象によるものである。視覚的に、この現象は、中間調の校正に比較してプレス機からの印刷ジョブで色相において潜在的にシフトされるのと同様に、潜在的に「クリア」(すなわち所与のC*について高いL*)なスポットカラーの淡い色となる。 As illustrated in FIGS. 5 and 6, the “holes” in the halftone screen (ie, the area where the substrate is visible between the dots of the colorant) are colored by the ink used to print the dots. It is also detected. Therefore, the maximum dot density Dmax is reduced by coloring the ink, and the minimum hole density Dmin of the adjacent substrate is increased. Both of these are due to the phenomenon of blurring of dots or ink. Visually, this phenomenon is potentially “clear” (ie, for a given C *) as it is potentially shifted in hue in a print job from a press compared to halftone calibration. A high L *) spot color becomes light.
したがって、当該技術分野において、スポットカラーの使用に関する改善されたカラーマネージメント及び校正技術が必要とされる。 Therefore, there is a need in the art for improved color management and proofing techniques for the use of spot colors.
B.色の混合
長年にわたり、塗料、染料等を混合するのと同様に、中間調のドットを印刷及び混合する結果を推定するアルゴリズム及びアプリケーションが存在する。一般に、これらの計算は、スペクトルに基づいており、結果的に得られる色を形成するために着色剤と被印刷物をどのように互いに加えるかを推定するため、着色剤と被印刷物の両者に関して(3刺激データ(tristimulous data)とは対照的に)フルスペクトル情報が必要とされることを意味する。
B. Color mixing Over the years, there are algorithms and applications that estimate the result of printing and mixing halftone dots, as well as mixing paints, dyes, and the like. In general, these calculations are based on spectra and for both the colorant and the substrate to estimate how to add the colorant and the substrate to each other to form the resulting color ( It means that full spectrum information is required (as opposed to tristimulous data).
これらの方法は、インクのセットが固定されるNカラー印刷システムの特性を形成するために使用されている。CMYK又はN=4システムについて、非常に正確な特性及び対応するICCプロファイルは、1617パッチを有するIT8.7/4:2005のような標準的な4色チャートを使用して、Kodak Profile Wizard and Gretag ProfileMakerのような多くの製品により生成される。7色のインクシステムのような大きなNの値について、カスタムチャートを使用して7色のICCプロファイルを形成するための製品を入手可能である。係る特性による課題は、7つの色空間のサンプリングが高い次元で極端に僅かであり、ICCプロファイルの多次元のグリッドのサンプリングもまた非常に僅かであることである(典型的に、17ではなく次元当たり3又は4のグリッドサンプリング)。この特徴データ及び対応するプロファイルの両者の僅かなサンプリングは、校正及び色変換の両者における不正確さにつながる可能性がある。 These methods have been used to create the characteristics of an N-color printing system where a set of ink is fixed. For CMYK or N = 4 systems, very accurate characteristics and corresponding ICC profiles are obtained using a standard 4-color chart such as IT8.7 / 4: 2005 with 1617 patches, Kodak Profile Wizard and Gretag Generated by many products like ProfileMaker. For large N values, such as a 7-color ink system, products are available to create a 7-color ICC profile using a custom chart. The problem with such characteristics is that the sampling of the seven color spaces is extremely small in the high dimension, and the sampling of the multi-dimensional grid of the ICC profile is also very small (typically dimension 17 rather than 17). 3 or 4 grid samplings per). A slight sampling of both this feature data and the corresponding profile can lead to inaccuracies in both proofing and color conversion.
色のセットが固定されていないNカラー印刷システムについて、スポットカラーのユーザが直面する既存の課題は、遥かに多く複雑にされる。スポットカラーのデータベースにおいて数百又は数千のスポットカラーが存在する場合がある。CMYKチャートから構築されるICCプロファイルに匹敵する品質を達成するため、天文学的な数の色の組み合わせ及び測定が行われる必要がある。 For N color printing systems where the color set is not fixed, the existing challenges facing spot color users are much more complicated. There may be hundreds or thousands of spot colors in a spot color database. In order to achieve a quality comparable to an ICC profile built from CMYK charts, an astronomical number of color combinations and measurements need to be made.
Nカラー印刷システムをモデル化する1つの従来のスキームは、“Modeling the Color of Multi-Color Halftones”, TAGA Proceedings, p.44-62, Technical Association of the Graphic Arts, 1990の研究により1990年にVigiannoにより導入される。この研究は、スペクトルノイゲバウア(spectral Neugebauer)を結合する、新たなスペクトルノイゲバウアの式を定義する。 One conventional scheme for modeling an N-color printing system is Vigianno in 1990, according to a study by “Modeling the Color of Multi-Color Halftones”, TAGA Proceedings, p.44-62, Technical Association of the Graphic Arts, 1990. Introduced by This study defines a new spectral Neugebauer equation that combines spectral Neugebauer.

変化する厚さからなる混合されたソリッドなインクの結果として得られる外観を推定することは、“Modeling Ink-Jet Printing: Does Kubelka-Munk Theory Apply ?”, L. Yang Proc. IS&T NIP18 Conf. 482-485, Sep.29-Oct. 4, 2002, San Diego, California, USAにおけるKubelka-Munkにより対処されている。Kubelka-Munkの式は、被印刷物の多数の着色剤の反射率を定義し、この場合、着色剤は、波長λの関数として吸収係数(k)及び散乱係数(s)の両者を有する。 Estimating the resulting appearance of mixed solid inks of varying thickness is “Modeling Ink-Jet Printing: Does Kubelka-Munk Theory Apply?”, L. Yang Proc. IS & T NIP18 Conf. 482 -485, Sep. 29-Oct. 4, 2002, San Diego, California, USA, addressed by Kubelka-Munk. The Kubelka-Munk equation defines the reflectance of a number of colorants in a substrate, where the colorant has both an absorption coefficient (k) and a scattering coefficient (s) as a function of wavelength λ.
上述された従来の計算は、フルスペクトルデータが混合されている色のそれぞれについて既知であって、k(λ)及びs(λ)を特徴付ける情報を有する場合に有効である。しかし、(本質的にL*a*b*中心である)ICCワークフローにおいて特にフルスペクトルデータを有さないことがある。しばしば、測定されたCIELABデータのような混合されている色の1つの被印刷物のストックに印刷される測定されたカラーデータの一般的なセットのみを有する。したがって、当該技術分野において、係る様々な被印刷物のストックで混合される色のそれぞれの外観を物理的に測定する必要なしに、様々な被印刷物のストックの個々のスポットカラーの結果的に得られる外観又は色を推定する正確な方法が必要とされる。同様に、先の一般的なデータのみが利用可能なときでさえ、スポットカラーのソリッドな刷り重ねの合理的な推定値を推定することが必要とされる。 The conventional calculations described above are useful when the full spectrum data is known for each color mixed and has information characterizing k (λ) and s (λ). However, the ICC workflow (which is essentially L * a * b * -centric) may not have full spectrum data in particular. Often, it has only a general set of measured color data printed on one substrate stock of mixed colors, such as measured CIELAB data. Thus, in the art, the individual spot colors of the various substrate stocks are obtained as a result without having to physically measure the appearance of each of the colors mixed in the various substrate stocks. An accurate method for estimating appearance or color is needed. Similarly, it is necessary to estimate a reasonable estimate of the spot color solid overprint even when only the previous general data is available.
さらに、それぞれ個々の着色剤についてスペクトルデータを有する場合でさえ、典型的に、k(λ)及びs(λ)の定義を有さない。従来の方法は、ホワイトと同様に(少なくとも)ブラックのバックグランドに対してそれぞれの着色剤を印刷することを典型的に含んでおり、これらλの関数を推測するため、それぞれのスペクトルを測定する。確かに、係るデータが利用可能である場合、先の表現を推測することは、比較的容易である。しかし、係る測定を取得することは実用的ではない。 Furthermore, even with spectral data for each individual colorant, typically there is no definition of k (λ) and s (λ). Conventional methods typically include printing each colorant against a black background (at least) as well as white, and measuring each spectrum to infer these λ functions. . Certainly, if such data is available, it is relatively easy to guess the previous representation. However, obtaining such measurements is not practical.
スポットカラーをプロファイルする既存の方法が品質において制限され、また、実現するのが不当に複雑であるかに関する理由は、使用されている印刷プロセスを記述する良好な基本モデルがなかったためである。真に有効なモデルを構築することができた場合、典型的に、それぞれが特徴付けされているシステムへの関連される物理的な相関を有する非常に少数のパラメータを使用して、あるプロセスの振舞いを推定することができる。所定の特性がある波長の関数で特徴付けされる必要がある場合(たとえばk(λ)及びs(λ)について結合された作用、又は屈折率n(λ)に依存する着色剤のレイヤ間の内部反射のような他の波長の作用)、正確な物理モデルを使用して実際のデータへの最小二乗フィットを介してこの情報を確認することができる。 The reason why existing methods of profiling spot colors are limited in quality and are unreasonably complex to implement is that there was no good basic model describing the printing process used. If a truly effective model can be built, typically a very small number of parameters with an associated physical correlation to the system being characterized can be used for a process. The behavior can be estimated. If a given property needs to be characterized as a function of wavelength (eg, combined action for k (λ) and s (λ), or between layers of colorants depending on refractive index n (λ) The effect of other wavelengths such as internal reflection), this information can be verified via a least squares fit to the actual data using an accurate physical model.
係るモデルは価値がある。それは、静的なNカラーのプロファイル(固定された着色剤のプロファイル)が最大の精度による測定を使用することなしに効果的に形成されるためである。提案されるモデルにより刷り重ねのみが不完全に推定される場合でさえ、高い正確さの度合いを達成するため、チャネル間の相関ファクタを使用して経験的に容易に補正することができる。これは、ノイゲバウアプライマリ(すなわち様々な可能性のあるソリッドな着色剤の組み合わせ)が良好に定義され、テストチャートの形式で測定のために利用可能であることによる。 Such a model is valuable. This is because a static N-color profile (fixed colorant profile) is effectively formed without using measurements with maximum accuracy. Even if only the overprint is estimated incompletely by the proposed model, it can be easily corrected empirically using the correlation factor between channels in order to achieve a high degree of accuracy. This is because the Neugebauer primary (i.e. the combination of various possible solid colorants) is well defined and available for measurement in the form of a test chart.
したがって、使用されている印刷プロセスを記述する良好な基本モデル及び実現が必要される。 Therefore, a good basic model and implementation describing the printing process being used is needed.
上述された問題が対処され、本発明の様々な実施の形態に従って、(a)被印刷物(substrate)に付着されたときに着色剤(colorants)の結果として得られる色の値、及び(b)被印刷物で混合されたときに複数の着色剤の結果として得られる色の値、を推定するシステム及び方法により、技術的な解決策が達成される。(用語「混合“mix”、“mixed”又は“mixing”」は、被印刷物上での色の混合、被印刷物上の色のオーバラップを含むことが意図される)
本発明の実施の形態は、コンピュータを利用したシステム、コンピュータにより実現される方法を含み、これらシステム及び方法は、印刷システムの物理的過程に基づいた数学的モデルにより特徴付けされるとき、それぞれのチャネルの鍵となる特性を定量化するチャネルに独立した情報を使用するものである。
In accordance with various embodiments of the present invention in which the problems described above have been addressed, (a) color values resulting from colorants when applied to a substrate, and (b) A technical solution is achieved by a system and method for estimating the resulting color values of a plurality of colorants when mixed in a substrate. (The terms “mixed”, “mixed” or “mixing” are intended to include color mixing on the substrate, color overlap on the substrate)
Embodiments of the present invention include computer-based systems, computer-implemented methods, each of which, when characterized by a mathematical model based on the physical processes of the printing system, Channel independent information is used to quantify the key characteristics of the channel.
このモデルは、個々の着色剤が印刷されるとき、個々の着色剤の振る舞いを特徴付けることができるだけでなく、混合されるとき、着色剤とそれらの互いの影響との間の相互作用を特徴付けることができ、印刷される着色剤のセットについてデバイスコードの値の組み合わせ(たとえばCMYK又はCMYK+スポット値)について最終的に測定される結果を正確に推定する。完全に測定されたデータセットが特定のNカラーのセットについて利用可能である場合、そのデータセットに特有のチャネル間又は着色剤間の補正は、特にN>=5である特定のNカラーのセットのケースである、幾分僅かにデータセットがサンプリングされる場合でさえ、最適な精度を達成するために先のシステム及び方法で適用することができる。 This model not only characterizes the behavior of individual colorants when they are printed, but also characterizes the interaction between colorants and their mutual influence when mixed. And accurately estimate the final measured result for a combination of device code values (eg, CMYK or CMYK + spot value) for the set of colorants to be printed. If a fully measured data set is available for a particular N color set, the channel-to-channel or colorant-specific corrections specific to that data set are in particular a particular N color set where N> = 5. Even if the data set is sampled somewhat slightly, it can be applied with the previous system and method to achieve optimal accuracy.
本発明の実施の形態に係る、(他の着色剤との混合なしに)被印刷物に付着される、スポットの着色剤(spot colorants)であるか又はスポットの着色剤ではない場合である単一の着色剤の場合、被印刷物上に付着されるとき、着色剤の結果として得られる色の値を推定するコンピュータを利用したシステム及びコンピュータにより実現される方法が提供される。本発明の実施の形態によれば、結果として得られる色の値の推定は、着色剤と被印刷物に関連する色情報と同様に、着色剤に関連される不鮮明の情報に少なくとも基づく。不鮮明の情報は、本発明の実施の形態によれば、着色剤の印刷されたドットの広がりの量のような、着色剤に関連される不鮮明の特性を記述する。色情報は、着色剤の色の値及び被印刷物の色の値を記述する。色の値は、CIELABの色値のようなデバイスに依存する色の値又はデバイスに独立な色の値である。この点に関して、推定される結果として得られる色の値は、デバイスに依存する又はデバイスに独立な形式である場合がある。 A single that is a spot colorant or not a spot colorant attached to a substrate (without mixing with other colorants), according to an embodiment of the present invention In the case of the present colorant, a computer-based system and a computer-implemented method for estimating the color value resulting from the colorant when deposited on the substrate are provided. According to embodiments of the present invention, the resulting color value estimation is based at least on blur information associated with the colorant, as well as color information associated with the colorant and the substrate. The blur information describes the blur characteristics associated with the colorant, such as the amount of spread of the printed dot of the colorant, according to an embodiment of the invention. The color information describes the color value of the colorant and the color value of the substrate. The color value is a device-dependent color value, such as a CIELAB color value, or a device-independent color value. In this regard, the estimated resulting color value may be in a device dependent or device independent form.
本発明の実施の形態によれば、付加的に被印刷物上に付着される着色剤の結果として得られる色の値の推定は、着色剤に関連されるドットサイズの増加情報に少なくとも基づいている。本発明の実施の形態によれば、ドットサイズの増加情報は、着色剤の印刷されたドットの成長の量を記述する。 According to an embodiment of the present invention, the estimation of the color value resulting from the colorant additionally deposited on the substrate is based at least on dot size increase information associated with the colorant. . According to an embodiment of the present invention, the dot size increase information describes the amount of growth of printed dots of colorant.
本発明の実施の形態によれば、被印刷物上に付着されたとき、着色剤の淡い色合いが付加的に考慮される場合がある。着色剤の淡い色合いは、被印刷物上の着色剤の印刷されたカバレッジの量を示し、この場合、たとえば、フルの淡い色合いは、100%のカバレッジ(すなわち被印刷物の領域上のソリッドなやり方での着色剤の印刷)を示し、淡い色合いなしは、0%のカバレッジ(すなわち、被印刷物の領域上の着色剤の印刷なし)、及びハーフの淡い色合いは、50%のカバレッジ(すなわち、50%のチェックボードのパターンのような、係る領域の50%をカバーするやり方で、被印刷物の領域上の着色剤の印刷)を示す。この場合、被印刷物上に付着される着色剤の結果的に得られる色の値の推定は、着色剤の淡い色合いの量を記述する色合い情報に少なくとも基づいている。本発明の実施の形態によれば、推定の一部として考慮されるものから着色剤の淡い色合いにおける変化を記述する色合い(又は濃度)調整情報が利用され、係る色合い調整情報に少なくとも基づいて推定が変更される。 According to an embodiment of the present invention, a light colorant tint may be additionally considered when deposited on a substrate. The pale shade of colorant indicates the amount of printed coverage of the colorant on the substrate, in which case, for example, the full pale shade is 100% coverage (ie in a solid manner over the area of the substrate). Colorant printing), 0% coverage (i.e. no colorant printing on the substrate area), and half light shades, 50% coverage (i.e. 50%). Colorant printing on areas of the substrate in a manner that covers 50% of such areas, such as a checkboard pattern. In this case, the estimation of the resulting color value of the colorant deposited on the substrate is based at least on shade information describing the amount of light shade of the colorant. According to an embodiment of the present invention, hue (or density) adjustment information that describes a change in the light shade of the colorant from what is considered as part of the estimation is utilized and is estimated based at least on the hue adjustment information. Is changed.
(混合することなしに)被印刷物上に付着される単一の着色剤に関する本発明の実施の形態によれば、被印刷物に付着される着色剤の結果的に得られる色の値の推定は、先のファクタの全てに基づく。本発明の他の実施の形態によれば、推定において、これらのファクタのサブセットの考慮が利用される。 According to embodiments of the present invention for a single colorant deposited on a substrate (without mixing), the resulting color value estimate for the colorant deposited on the substrate is , Based on all of the previous factors. According to another embodiment of the present invention, consideration of a subset of these factors is utilized in the estimation.
本発明の1つの実施の形態によれば、被印刷物に付着されるとき、着色剤の結果として得られる色の値の推定の一部として、可視スペクトルの赤、緑及び青の領域に関する3次元におけるBier’sの法則の非連続のバージョンが使用される。 According to one embodiment of the present invention, as attached to the substrate, as a part of the estimation of the color value resulting from the colorant, the three-dimensional for the red, green and blue regions of the visible spectrum A discontinuous version of Bier's law in is used.
さらに、被印刷物に付着される単一の着色剤に関して、本発明の実施の形態によれば、スポットの着色剤の付着の色測定を表す測定情報が使用され、測定情報に少なくとも基づいて、再現されるべき着色剤の色の値、不鮮明の情報又はその両者が更新される。 Furthermore, with respect to a single colorant attached to the substrate, according to an embodiment of the invention, measurement information representing the color measurement of the spot colorant attachment is used and reproduced based at least on the measurement information. The color value of the colorant to be done, blur information or both are updated.
混合又は着色剤を混合する場合、本発明の実施の形態によれば、トラップ及び任意に不透明性を考慮した物理モデルを利用した1以上のコンピュータにより、正確な推定が得られる。本発明の実施の形態によれば、このモデルは、Kubelka-Munkモデルに少なくとも基づいている場合がある。さらに、物理モデルは、本発明の実施の形態によれば、Kubelka-Munkモデルのような主として連続階調システムの画像形成特性と、Neugebauerモデルのような主要な中間調システムの特性とを組み合わせる。本発明の実施の形態によれば、このモデルは、インクジェット及びグラビアシステムのような近似的に50%〜70%の連続階調及び近似的に30%〜50%の中間調であるシステム、並びに、オフセット印刷システムのような10%〜20%の連続階調及び80%〜90%の中間調であるシステムを記述する。 When mixing or mixing colorants, according to embodiments of the present invention, an accurate estimate is obtained by one or more computers utilizing a physical model that takes into account traps and optionally opacity. According to embodiments of the present invention, this model may be based at least on the Kubelka-Munk model. Furthermore, the physical model, according to an embodiment of the present invention, combines the image forming characteristics of a primarily continuous tone system, such as the Kubelka-Munk model, with the characteristics of a major halftone system, such as the Neugebauer model. According to embodiments of the present invention, this model is a system that is approximately 50% to 70% continuous tone and approximately 30% to 50% halftone, such as inkjet and gravure systems, and Describe a system that is 10% -20% continuous tone and 80% -90% halftone, such as an offset printing system.
この点に関して、本発明の実施の形態によれば、コンピュータを利用したシステム及びコンピュータにより実現される方法は、被印刷物で混合されたとき、複数の着色剤の結果として得られる色の値を推定する。本発明の実施の形態によれば、結果として得られる色の値の推定は、トラップ情報、色情報及びレイダウンシーケンス情報に少なくとも基づく。トラップ情報は、本発明の実施の形態によれば、複数の着色剤のそれぞれに関連される、接着性のようなトラップ特性を記述する。本発明の実施の形態によれば、結果として得られる色の値の推定は、複数の着色剤により示される接着性の最小量を記述するトラップパラメータを計算して利用することを含む。色情報は、本発明の実施の形態によれば、複数の着色剤のそれぞれの色値と被印刷物の色の値を少なくとも記述する。色の値は、デバイスに依存する色の値又はデバイスに独立な色の値である場合がある。この点に関して、推定される結果として得られる色の値は、デバイスに依存した形式か、デバイスに独立な形式である場合がある。レイダウンシーケンス情報は、本発明の実施の形態によれば、複数の着色剤の混合の順序(mixing sequence)を記述する。複数の着色剤は、本発明の実施の形態によれば、シアン、マゼンダ、イエロー、及びブラックの着色剤を含み、1以上のスポットの着色剤を含む場合もある。 In this regard, according to an embodiment of the present invention, a computer-based system and a computer-implemented method estimate color values resulting from multiple colorants when mixed on a substrate. To do. According to an embodiment of the present invention, the resulting color value estimation is based at least on trap information, color information and laydown sequence information. The trap information describes the trap characteristics, such as adhesion, associated with each of the plurality of colorants, according to an embodiment of the present invention. According to an embodiment of the present invention, the estimation of the resulting color value includes calculating and utilizing a trap parameter that describes the minimum amount of adhesion exhibited by the plurality of colorants. According to the embodiment of the present invention, the color information describes at least the color value of each of the plurality of colorants and the color value of the substrate. The color value may be a device-dependent color value or a device-independent color value. In this regard, the estimated resulting color value may be in a device dependent format or a device independent format. The laydown sequence information describes a mixing sequence of a plurality of colorants according to an embodiment of the present invention. The plurality of colorants includes, according to embodiments of the present invention, cyan, magenta, yellow, and black colorants, and may include one or more spot colorants.
また、着色剤を混合する場合、本発明の実施の形態によれば、付加的に結果として得られる色の値の推定は、複数の着色剤のそれぞれと関連される不透明性の特性を記述する不透明の情報に少なくとも基づく。本発明の実施の形態によれば、不透明性の情報は、複数の着色剤のそれぞれを通過する光の量を記述する。 Also, when mixing colorants, according to embodiments of the present invention, the resulting color value estimation additionally describes the opacity characteristics associated with each of the plurality of colorants. Based at least on opaque information. According to an embodiment of the present invention, the opacity information describes the amount of light that passes through each of the plurality of colorants.
さらに、着色剤を混合する場合、本発明の実施の形態によれば、被印刷物上に付着されたとき、着色剤の淡い色合いが更に考慮される場合がある。この点に関して、結果として得られる色の値の推定は、少なくとも1つの着色剤の色合いの量を表す色合い情報に少なくとも基づいている。本発明の実施の形態によれば、推定の一部として考慮されるものから少なくとも1つの着色剤の淡い色合いにおける変化を表す色合い(又は濃度)調整情報は、係る色合い調整情報に基づいて推定を変更するために利用される。 Furthermore, when mixing the colorant, according to an embodiment of the present invention, the lighter shade of the colorant may be further considered when deposited on the substrate. In this regard, the resulting color value estimate is based at least on shade information representing the amount of shade of at least one colorant. According to an embodiment of the present invention, the hue (or density) adjustment information representing a change in the light hue of at least one colorant from what is considered as part of the estimation is estimated based on the hue adjustment information. Used to change.
被印刷物上での着色剤の混合に関する本発明の実施の形態によれば、被印刷物上に付着された着色剤が被印刷物で混合されるとき、複数の着色剤の結果として得られる色の値の推定は、先のファクタの全てに基づいている。本発明の他の実施の形態によれば、推定において、これらのファクタのサブセットの考慮が利用される。 According to an embodiment of the invention relating to the mixing of colorants on a substrate, the color values obtained as a result of a plurality of colorants when the colorant deposited on the substrate is mixed with the substrate Is estimated based on all of the previous factors. According to another embodiment of the present invention, consideration of a subset of these factors is utilized in the estimation.
本発明の実施の形態によれば、Kubelka-Munkモデルは、被印刷物で混合されるとき、着色剤の結果として得られる色の値の推定の一部として使用される。 According to an embodiment of the invention, the Kubelka-Munk model is used as part of the estimation of the color value resulting from the colorant when mixed on the substrate.
さらに、被印刷物上での着色剤の混合に関して、本発明の実施の形態によれば、複数の着色剤の混合の色測定を表す測定情報は、測定情報に少なくとも基づいて、(a)複数の着色剤の1以上について色の値、(b)トラップ情報、(c)不透明度の情報、又は(a),(b),(c)の組み合わせ、を更新するために使用される。 Furthermore, regarding the mixing of the colorants on the substrate, according to the embodiment of the present invention, the measurement information representing the color measurement of the mixture of the plurality of colorants is based on at least the measurement information: Used to update the color value, (b) trap information, (c) opacity information, or a combination of (a), (b), (c) for one or more of the colorants.
上述された実施の形態に加えて、更なる実施の形態は、図面を参照して、以下の詳細な説明を読むことで明らかになるであろう。 In addition to the embodiments described above, further embodiments will become apparent by reading the following detailed description with reference to the drawings.
本発明は、添付図面と共に考慮される以下に提供される例示的な実施の形態の詳細な説明から容易に理解されるであろう。添付図面は、本発明の概念を例示することを目的としており、スケーリングされない場合があることを理解されたい。
本発明は、Nカラー印刷システムの結果として得られる測色の値の推定に関する。係るシステムは、シアン、マゼンダ、イエロー及びブラック(CMYK)に加えて、スポットカラーとして一般に知られている(N−4)の特殊インクといった4つのプロセスカラーからなる。本発明の実施の形態によれば、推定は、Nの着色剤と、Nの着色剤が印刷される被印刷物のオリジナルカラー測定値のような色情報に基づく。結果として得られる測色の値の推定は、被印刷物の測定データにおける変化、及び共に個々に印刷され、刷り重ねされるソリッドな着色剤の相対的な濃度における変化の関数として行われる。また、推定は、淡い色合いの値としても知られる、ソリッドな入力デバイス値及びソリッドではない入力デバイス値の両者の関数として行われる場合がある。本発明の実施の形態によれば、これらの推定は、トラップ効率の推定される関数のようなトラップ情報、不透明度について推定される関数のような不透明度の情報、ドットの成長について推定される関数のようなドット成長情報、ドットの不鮮明度について推定される関数のような不鮮明度の情報、及び、混合(たとえば刷り重ね)の場合における色、レイダウンシーケンス、のうちの少なくとも1つに基づく場合がある。 The present invention relates to the estimation of colorimetric values obtained as a result of an N color printing system. Such a system consists of four process colors such as (N-4) special ink, commonly known as spot color, in addition to cyan, magenta, yellow and black (CMYK). According to an embodiment of the present invention, the estimation is based on color information such as N colorants and original color measurements of the substrate on which the N colorants are printed. The resulting colorimetric value estimate is made as a function of the change in the measured data of the substrate and the change in the relative density of the solid colorants that are individually printed and overprinted together. The estimation may also be performed as a function of both solid and non-solid input device values, also known as light shade values. According to embodiments of the present invention, these estimates are estimated for trap information such as an estimated function of trap efficiency, opacity information such as a function estimated for opacity, and dot growth. Based on at least one of dot growth information such as function, blur information such as a function estimated for dot blur, and color in the case of blending (eg, overprinting), laydown sequence There is.
スポットカラーの選択を頻繁に変更するNの着色剤のシステムの場合、他の着色剤又は特定のNの着色剤のセットに依存しない個々の着色剤の情報に基づいて、正確な推定が行われる場合がある。固定されたNの着色剤のセットの場合、それぞれの着色剤間の相互作用を考慮して補正を加えることで、更に大きな精度が達成される。先の推定の精度は、本発明の実施の形態によれば、トラップ及び不透明度の両者を考慮してKubelka-Munkの方程式を変更すること、及び、ハイブリッド画像形成モデルを形成するため、Neugebauerに基づく方程式とKubelka-Munkの方程式を組み合わせることで達成される。このハイブリッド画像形成モデルは、画像形成システムの中間調及び連続階調の特性の大部分を考慮し、中間調校正システム及び高品質オフセット印刷プレス機のようなほぼ完全な中間調画像形成システムと同様に、インクジェット及びグラビアシステムとの使用のために変更することができる。 For systems of N colorants that frequently change the choice of spot color, an accurate estimate is made based on individual colorant information independent of other colorants or a specific set of N colorants. There is a case. In the case of a fixed set of N colorants, greater accuracy is achieved by making corrections taking into account the interaction between the respective colorants. The accuracy of the previous estimation is in accordance with the embodiment of the present invention in order to change the Kubelka-Munk equation to account for both traps and opacity, and to make Neuugebauer to form a hybrid imaging model. This is achieved by combining the equation based on Kubelka-Munk equation. This hybrid imaging model takes into account most of the halftone and continuous tone characteristics of the imaging system and is similar to almost perfect halftone imaging systems such as halftone calibration systems and high quality offset printing presses. Can be modified for use with inkjet and gravure systems.
本発明の利点は、多次元グリッドに頼るのではなく、Nカラー印刷システムの正確な数学モデルを利用することによる高速な浮動小数点計算を実行することで、正確なプロファイリングと同様に、高精度の特性の両者を達成可能なことである。数学モデルは、印刷システムの実際の物理に基づいているので、最少の数のパラメータ及び特徴情報が使用され、N色の入力色の値の所与のセットについてL*a*b*又はスペクトルの推定が実行される。これにより、最小の数の測定に基づいた正確な物理モデルの構築を可能にし、このことは、既存の僅かにサンプリングされたカラーチャートのデータが印刷システムの正確な予測モデルを構築するために適切であることを意味する。 The advantage of the present invention is that it performs high-speed floating point calculations by utilizing the exact mathematical model of the N-color printing system, rather than relying on multidimensional grids, as well as accurate profiling, Both characteristics can be achieved. Since the mathematical model is based on the actual physics of the printing system, a minimal number of parameters and feature information is used, and for a given set of N input color values, L * a * b * or spectral Estimation is performed. This allows the construction of an accurate physical model based on the smallest number of measurements, which is appropriate for the existing slightly sampled color chart data to build an accurate predictive model of the printing system. It means that.
本発明の別の利点は、結果的に得られる混合された色の外観を推定するとき、トラップを考慮することである。トラップは、典型的に、0%〜100%の間のパーセンテージ又はフラクションとして特徴付けされる。トラップ(trap)は、ある着色剤が、先に印刷されている下の着色剤に(被印刷物上の印刷に対して)どの位多くかぶるかを示す。したがって、着色剤B上で印刷する着色剤Aの66%のトラップは、着色剤Aのオリジナルの濃度の厚さが被印刷物上で1.5の印刷である場合、B上で印刷するときに濃度が1.0に低減されることを意味する。したがって、ある着色剤をブラックのインク又はブラックの被印刷物に印刷する場合でさえ、インクの厚さが、ある被印刷物上の印刷のそれと同じである保証がない。 Another advantage of the present invention is that it considers traps when estimating the resulting mixed color appearance. Traps are typically characterized as a percentage or fraction between 0% and 100%. Traps indicate how much of a certain colorant will cover the previously printed lower colorant (relative to printing on the substrate). Thus, 66% of the trap of colorant A printed on colorant B is when printing on B if the original density thickness of colorant A is 1.5 prints on the substrate. It means that the concentration is reduced to 1.0. Thus, even when printing certain colorants on black ink or black substrate, there is no guarantee that the ink thickness is the same as that of printing on a substrate.
本明細書で記載される、本発明の様々な実施の形態は、たとえば図1に示されるコンピュータシステム101により実行される本発明のデータ処理システム技術を含む。コンピュータシステム101は、通信可能に接続される1以上のコンピュータを含む場合がある。以下に記載されるデータ処理技術を実行するために必要とされるデータは、コンピュータシステム101に通信可能に接続される入力源102からコンピュータに供給される場合がある。当業者であれば、本発明が特定の入力源102に限定されるものではなく、係る入力源は、キーボード、マウス等のような1以上のユーザインタフェース、他のコンピュータ、又は、データを記憶するコンピュータアクセス可能なメモリを含む場合がある。
The various embodiments of the present invention described herein include the data processing system techniques of the present invention performed by, for example, the
本明細書で記載されるデータ処理技術を実行するのを容易にするため、コンピュータシステム101は、該システムに通信可能に接続されるデータストレージシステム104を有する。データストレージシステム104は、1以上のコンピュータアクセス可能なメモリを含む場合がある。以下に記載されるデータ処理技術を実行する結果として、コンピュータシステム101により生成される出力は、コンピュータシステム101に通信可能に接続される出力源103に送信される場合がある。当業者であれば、本発明は特定の出力源103に限定されないことを理解するが、係る出力源103は、1以上の表示装置、他のコンピュータ、又は、データを記憶するコンピュータアクセス可能なメモリを含む場合がある。
To facilitate performing the data processing techniques described herein,
データストレージシステム104は、複数のコンピュータ及び/又は装置を介して通信可能に接続される多数のコンピュータアクセス可能なメモリを含む分散データストレージシステムである場合がある。他方で、データストレージシステム104は、分散データストレージシステムである必要はなく、結果的に、単一のコンピュータ又は装置内に位置される1以上のコンピュータアクセス可能なメモリを含む。
フレーズ「コンピュータアクセス可能なメモリ」は、揮発性又は不揮発性、電子的、磁気的、光学的、或いは、限定されるものではないがフロプティカルディスク、ハードディスク、コンパクトディスク、DVD、フラッシュメモリ、ROM、及びRAMを含むその他に関わらず、コンピュータによりアクセス可能なデータストレージメモリを含むことが意図される。 The phrase “computer-accessible memory” can be volatile or non-volatile, electronic, magnetic, optical or, but not limited to, floppy disk, hard disk, compact disk, DVD, flash memory, ROM , And others, including RAM, are intended to include computer-accessible data storage memory.
フレーズ「コンピュータによりアクセス可能なメモリシステム」は、通信可能に接続される1以上のコンピュータによりアクセス可能なメモリを含むことが意図される。 The phrase “computer-accessible memory system” is intended to include memory accessible by one or more computers communicatively connected.
用語「コンピュータ」は、電気的及び/又は磁気的及び/又は光学的及び/又は生体学的なコンポーネント、及び/又はその他で実現されるかに関わらず、デスクトップコンピュータ、ラップトップコンピュータ、メインフレームコンピュータ、パーソナルデジタルアシスタント、ブラックベリー、及び/又は、データの処理、及びデータの管理、及び/又はデータの操作用の他の装置、のようなデータ処理装置を含むことが意図される。 The term “computer”, whether implemented with electrical and / or magnetic and / or optical and / or biological components, and / or otherwise, desktop computers, laptop computers, mainframe computers It is intended to include data processing devices, such as personal digital assistants, BlackBerrys, and / or other devices for data processing and data management and / or data manipulation.
フレーズ「通信可能に接続される」は、装置間で、及び/又はコンピュータ間で、及び/又はデータが通信されるプログラム間で、有線、無線、又はその両者であるかに関わらず、任意のタイプの接続を含むことが意図される。さらに、フレーズ「通信可能に接続される」は、単一のコンピュータ内の装置及び/又はプログラム間の接続、異なるコンピュータで位置される装置及び/又はプログラム間の接続、及び、コンピュータに全く位置されない装置間の接続を含むことが意図される。この点に関して、データストレージシステム104は、コンピュータシステム101から個別に示されているが、当業者であれば、データストレージシステム104はコンピュータシステム101内に完全に又は部分的に記憶される場合があることを理解されるであろう。
The phrase “communicatively connected” may be any device, whether wired, wireless, or both, between devices and / or between computers and / or programs with which data is communicated. It is intended to include types of connections. Furthermore, the phrase “communicatively connected” is a connection between devices and / or programs within a single computer, a connection between devices and / or programs located on different computers, and not at all located on a computer It is intended to include connections between devices. In this regard, although the
以下、本発明の様々な実施の形態に係る、データ処理技術が記載される。 Hereinafter, data processing techniques according to various embodiments of the present invention will be described.
1.被印刷物に付着されたときに着色剤の結果として得られる色の値の推定:
本発明の幾つかの実施の形態は、ある被印刷物に印刷されるとき、スポットカラーであるか否かであるかに関わらず、ある着色剤の色の値を正確に推定することを含む。特に、本発明のこれらの実施の形態は、少なくとも、色情報、不鮮明の情報、及び、任意に、ドットサイズ増加情報及び/又は淡い色合いの情報に基づいて、結果として得られる色の値を推定することを含む。色情報は、着色剤の色の値と被印刷物の色の値を記述する。色の値は、CIELABの色の値のようなデバイスに依存する色の値又は装置に独立な色の値である場合がある。この点に関して、推定される結果として得られる色の値は、デバイスに依存する形式であるか、又はデバイスに独立な形式である場合がある。不鮮明の情報は、本発明の実施の形態によれば、着色剤の印刷されたドットの広がりの量のような、着色剤に関連する不鮮明の特性を表す。ドットサイズの増加情報は、本発明の実施の形態によれば、着色剤に関連され、着色剤の印刷されたドットの成長の量を表す。淡い色合いの情報は、本発明の実施の形態によれば、着色剤の淡い色の量を表す。任意に、被印刷物の値は、シミュレート又はプロファイルされる特定の印刷条件の被印刷物に整合するように変更され、着色剤の相対的な濃度が調節される。
1. Estimating the color values that result from the colorant when applied to the substrate:
Some embodiments of the present invention include accurately estimating the color value of a colorant when printed on a substrate, whether or not it is a spot color. In particular, these embodiments of the present invention estimate the resulting color values based at least on color information, blur information, and optionally dot size increase information and / or light tint information. Including doing. The color information describes the color value of the colorant and the color value of the substrate. The color value may be a device-dependent color value, such as a CIELAB color value, or a device-independent color value. In this regard, the estimated resulting color value may be in a device dependent format or a device independent format. The blur information, according to an embodiment of the present invention, represents a blur characteristic associated with the colorant, such as the amount of spread of the printed dot of the colorant. The dot size increase information, according to embodiments of the present invention, is associated with the colorant and represents the amount of growth of the printed dot of the colorant. The light shade information represents the amount of light color of the colorant, according to an embodiment of the present invention. Optionally, the substrate value is changed to match the substrate for the particular printing condition being simulated or profiled, and the relative concentration of the colorant is adjusted.
本発明の実施の形態によれば、結果として得られる色値の推定は、Kubelka-Munk方程式(先の式4)の簡略化されたバージョンを利用することを含み、ここで散乱は、ゼロに近づくことが想定される。この想定は、一次近似について、着色剤が光を吸収するのみであることを含み、完全に透明であることを意味する(すなわち、不透明ではない)。この想定は、散乱に対する吸収の割合k(λ)/s(λ)が殆ど無限であることを含み、(Bier’sの法則としても知られる)以下の表現が得られる。 According to an embodiment of the present invention, the resulting color value estimation includes utilizing a simplified version of the Kubelka-Munk equation (formula 4 above), where scattering is zero. It is expected to approach. This assumption includes, for the first order approximation, that the colorant only absorbs light and means it is completely transparent (ie not opaque). This assumption includes that the ratio of absorption to scattering, k (λ) / s (λ), is almost infinite, resulting in the following expression (also known as Bier's law):
![]()
〔外1〕
![]()
[Outside 1]
上記RGBの反射値は、マトリクス変換を介して、被印刷物の測定されたXYZの値、着色剤+被印刷物の測定されたXYZの値から直接に計算することができる。なお、カラーデータを評価するため、本発明の結果を実際の測定された結果と比較するため、CIELABのような一般に使用される一様なデバイスに独立なカラーメトリクスが使用されることが好ましい。CIELAB(L*a*b*)の測定された値は、XYZ→L*a*b*及びL*a*b*→XYZについて公知の方程式を使用してCIEXYZに変換され、CIEXYZから変換される。測定CIELABデータがXYZに既に変換されているとすると、RGBへの変換及びRGBからの変換は、当該技術分野で公知であるマトリクスを介して実行される場合がある。 The RGB reflection values can be directly calculated from the measured XYZ values of the printing material and the colorant + measured XYZ values of the printing material through matrix conversion. It should be noted that independent color metrics are preferably used in a commonly used uniform device such as CIELAB to evaluate the color data and to compare the results of the present invention with the actual measured results. The measured value of CIELAB (L * a * b *) is converted to CIEXYZ using the well-known equations for XYZ → L * a * b * and L * a * b * → XYZ, and then converted from CIEXYZ The If the measured CIELAB data has already been converted to XYZ, conversion to RGB and conversion from RGB may be performed via a matrix known in the art.
〔外2〕
〔外3〕
このモデルを測定されたデータと比較する前に、シンプルな境界の考慮を使用して、不鮮明のパラメータδがドットサイズg(x,Δg)につれてどのように変動するかに関する適度な推定が提案される。定義により、最大のドット値g(x,Δg)→1.0では、スポットの着色剤が測定される場合であるので、不鮮明さが存在しない。したがって、δ(x)=δ(1.0)=0である。小さな色合いの値g(x,Δg)→0で、最大の量δ0により低減されるインク膜の厚さにもかかわらず、ドットは明らかに目に見ることができる。したがって、g(x,Δg)が1.0→0に変動するとき、0→δ0の範囲に及ぶ線形の低減が一次近似として想定される場合、δ(x)は以下の通りである。 Before comparing this model with the measured data, a reasonable estimate of how the blur parameter δ varies with dot size g (x, Δ g ) using simple boundary considerations is proposed Is done. By definition, at the maximum dot value g (x, Δ g ) → 1.0, since the spot colorant is measured, there is no blur. Therefore, δ (x) = δ (1.0) = 0. With small tint values g (x, Δ g ) → 0, the dots are clearly visible despite the ink film thickness being reduced by the maximum amount δ 0 . Accordingly, when g (x, Δ g ) varies from 1.0 to 0, and δ (x) is assumed to be a linear approximation over the range of 0 → δ 0 as a first order approximation. .
最後に、濃度に対する調節ΔDは、相対的な濃度変化ΔD/D0を含むことで、上記方程式に反映することができ、ΔDは、濃度における変化であり、D0は、着色剤のオリジナルの濃度である。 Finally, the adjustment for concentration ΔD can be reflected in the above equation by including a relative concentration change ΔD / D 0 , where ΔD is the change in concentration and D 0 is the original colorant Concentration.
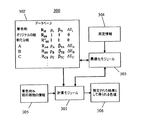
図2は、被印刷物に印刷されるとき、スポットの着色剤であるか否かに関わらず、着色剤の色値を推定するため、先の方程式20を実行するコンピュータを利用したシステム200を例示する。特に、図2は、被印刷物に印刷される場合がある複数の着色剤の初期情報を記憶するデータベース202を例示する。データベース202は、図1におけるデータストレージシステム104に含まれる場合がある。様々な被印刷物の初期情報は、データベース202に記憶される場合がある。初期情報は、着色剤及び被印刷物のそれぞれについて色情報を含む場合がある。色情報は、着色剤及び被印刷物のそれぞれについて、反射率R0=(R,G,B)の値のような、色値を含む場合がある。また、初期情報は、ドットの不鮮明のファクタδのような不鮮明の情報、ドットの成長のファクタΔgのようなドット成長情報を含む場合がある。また、淡い色合いの情報は、着色剤のそれぞれについて、データベース202における初期情報に記憶される場合がある。初期情報は、入力源102から受信される場合がある。
FIG. 2 illustrates a computer-based
R0=(R,G,B)の値は、上記式9に記載されるXYZ→RGBのマトリクスを介してRGBに変換される被印刷物及び着色剤のそれぞれの反射率のXYZの測定から直接に計算される場合ある。ファクタδ及びΔgの初期値は、予め計算された多数の着色剤の平均に基づくか、又は、スポットの着色剤の場合、CMYKの計算されたパラメータに基づくことができ、この場合、初期の推定値は、初期化されるスポットの着色剤に最も類似するCMYK着色剤に基づく。関連するCMYKパラメータの平均値を使用することができる。代替的に、関連するパラメータは、(一般に15又は20よりも少ないサイズのセット)少数の基礎のインク、及び他の着色剤を生成するために使用されるそれぞれの基礎のインクのパーセンテージに比例してこれらパラメータの相対的な重みにより生成される推定値を使用して測定される。 The value of R 0 = (R, G, B) is directly obtained from the XYZ measurement of the reflectance of each of the printing material and the colorant converted into RGB through the XYZ → RGB matrix described in Equation 9 above. May be calculated. The initial value of the factor δ and delta g is either based on an average of the previously calculated number of colorants, or in the case of spot colorants, can be based on the CMYK calculated parameters, in this case, initial The estimate is based on the CMYK colorant that most closely resembles the spot colorant being initialized. The average value of the relevant CMYK parameters can be used. Alternatively, the relevant parameters are proportional to the percentage of each base ink used to produce a small number of base inks (typically a set of less than 15 or 20) and other colorants. Are measured using estimates generated by the relative weights of these parameters.
計算モジュール201は、被印刷物に付着されるべき特定の着色剤205について、色情報、不鮮明さの情報、及び任意に、淡い色合いの情報及び/又はドットサイズの情報のようなデータベース202に記憶される情報を受ける。また、計算モジュール201は、データベース202から使用されている被印刷物の色情報を受ける。データベース202から受信された情報に少なくとも基づいて、計算モジュールは、被印刷物に付着されるとき、着色剤の結果として得られる色値206を推定する。
The
以下のセクションII及びIIIで記載される更に複雑なデータベースと同様に、先のデータベース202によれば、基本的な仮定が行われる。基本的な仮定は、(たとえばスポットの着色剤のPantoneセットについて)特定の被印刷物に印刷されるソリッドなスポットの着色剤について一般的なL*a*b*のセット及び/又はスペクトル測定値が存在することである。また、CMYKの着色剤を印刷するとき、印刷システムを記述する特徴データ及び/又はICCプロファイルが存在することが仮定される。これら2つの仮定が正しい場合、CMYK印刷システムに関する広範なデータが使用されて、スポットの着色剤のそれぞれの特性について初期の推定値が生成され、本発明の1実施の形態では、それぞれの着色剤についてδ及びΔの値が生成される。
Similar to the more complex database described in Sections II and III below, according to the
最適化モジュール203は、図1におけるコンピュータシステム101の一部である場合もあり、被印刷物上の着色剤の付着の色測定値を記述する測定情報204を、推定される結果として得られる色値206に比較する。測定情報204は、図1に示される入力源102から最適化モジュール203により受けられる。次いで、最適化モジュール203は、着色剤及び被印刷物のR0=(R,G,B)の値のような色情報、着色剤のファクタδのような不鮮明の情報、及び任意に、測定情報204に少なくとも基づく着色剤のドットサイズの増加ファクタΔを更新する。たとえば、最適化モジュール203は、最小自乗フィットを利用して、推定値206と測定値204との間の誤差を低減又は最小にするため、δ及びΔの改善された値を決定する。データベース202は、より正確な着色剤/被印刷物のパラメータの値が計算されるときに更新される場合がある。データベース202が更新され、改善されるとき、RGBの推定値及びしたがってXYZは、対応するスポットの着色剤の淡い色合いの入力値の関数として同様に改善される。この実施の形態によれば、推定される結果的に得られる色の値206と測定情報204からの測定される色の値との間の誤差を記述する誤差情報は、測定情報204からの測定データにおけるノイズによる期待される誤差と同じ大きさ又は実質的に同じ大きさのエラーを記録する。(なお、特定の印刷システムのオリジナルの被印刷物のRGB値と新たな被印刷物のRGB値は、先の式20で示されたベクトルに対応するため、RGBベクトルRg及びRg’として示される。)
先のデータベース202は、以下のセクションII及びIIIで記載されるより複雑な後続のデータベースと同様に、ファクタ/パラメータの状態を追跡するために使用される。特定の着色剤の特性の現在の推定値がその着色剤の直接的な測定に基づかない場合、データベースは、その旨をユーザに示す場合がある。このインジケータは、期待される誤差(たとえば5ΔE又は10ΔE)の形式であるか、又は警告フラグの形式とすることができる。着色剤の特性が実際の測定(先のデータベースの場合、印刷プロセスのために使用される実際の被印刷物上のスポット着色剤のたとえば淡い色合いの値の測定)に基づく場合、期待されるエラーは更に低くなる。個々のソリッド及び着色された着色剤の推定値の場合、これは約1ΔEである。(後のセクションで記載される)ソリッド及び淡い色合いの両者である混合された着色剤又は混合されたスポットの着色剤のような、推定値がより複雑になるとき、推定について期待されるエラーは、個々のスポットの着色剤のシンプルなケースのエラーよりも大きいが、本発明における物理的な数学的モデルの使用なしに、推定を行おうとするよりも非常に低い。スポットの着色剤のインクのグループ又はサブグループが前に印刷され測定されたことをデータベースが識別する固有なケースでは、この開示で記載されるモデルは、典型的に1ΔEである、測定データ自身のノイズに非常に近い、ジョブにおける使用のために最も高い精度を達成するために経験的に補正される。この推定されたΔEのエラーは、それぞれのスポットの着色剤についてデータベースにおける特定のフィールドである。他の実施の形態は、スポットの着色剤のパラメータのそれぞれに不確かさの+/−の値を割り当てる。
The
The
XYZとRGBとの間を変換するために使用されるマトリクスに関して(式8及び9)、着色剤のギャマットを含む合理的なRGB作業空間が使用され、CMYKインクについて、たとえばD50イルミネーションに設定されるホワイトポイントをもつAdobeRGBが使用される。D50でのAdobeRGB(a.k.a SMPTE_240_D50)の行列及び逆行列は、以下に示される。
For the matrix used to convert between XYZ and RGB (
結果及び分析:
式8,9及び20を使用した先の計算を示す研究が行われ、この場合、CMYKチャネルについてドットの不鮮明/着色の1つの値δ0=0.09が手動的に決定され、SWOP TR001データ(www.SWOP.orgを通して入手可能)の個々のCMYKチャネルについて測定されたL*a*b*と推定されたL*a*b*のプロットの良好なアライメント(1ΔE)が取得される。以下のドットゲイン又はドット成長“Δ”の値と結合される不鮮明/着色の値は、平均の全体のエラー1.1ΔE及びデータと推定との間の最大のエラー2.5ΔEが得られる。
Results and analysis:
A study showing the previous
ユーザにより濃度計で測定されたときの典型的に測定されたドットゲインと先に定義されたドットゲインとの間の良好な相関を得るため、新たなパラメータ「トータルドットゲイン」が定義され、これは、ドットサイズに対する増加(Δ)と不鮮明さにより増加された有効なドットサイズ(δ0)の両者を結合する。 In order to obtain a good correlation between the typically measured dot gain as measured by the densitometer and the previously defined dot gain, a new parameter “Total Dot Gain” has been defined and this Combines both an increase in dot size (Δ) and an effective dot size increased by blurring (δ 0 ).
本発明の幾つかの実施の形態は、被印刷物にソリッドに印刷及び混合されたとき、複数の着色剤の結果として得られる色の値を正確に推定することを含む。(高い精度での着色剤k=0,...,n-1の任意の淡い色合いの値xkの混合は、以下のセクションIIIで記載される。)本発明のこれらの実施の形態は、色情報、レイダウンシーケンス情報、トラップ情報、及び任意に、不透明な情報に少なくとも基づいて、結果として得られる色の値を推定することを含む。色情報は、本発明の実施の形態によれば、複数の着色剤のそれぞれの色の値、被印刷物の色の値を少なくとも表す。色の値は、CIELABの色の値のようなデバイスに依存する色の値又はデバイスに依存しない色の値である場合がある。この点に関して、推定される結果として得られる色の値は、デバイスに依存する形式又はデバイスに依存しない形式である場合がある。レイダウンシーケンス情報は、本発明の実施の形態によれば、複数の着色剤の混合シーケンスを記述する。トラップ情報は、本発明の実施の形態によれば、複数の着色剤のそれぞれに関連する、接着性のようなトラップ特性を記述する。本発明の実施の形態によれば、結果として得られる色の値の推定は、複数の着色剤により示される接着性の最小量を表すトラップパラメータを計算及び利用することを含む。本発明の実施の形態によれば、不透明の情報は、複数の着色剤のそれぞれに関連される不透明の特性を記述する。本発明の実施の形態によれば、不透明の情報は、複数の着色剤のそれぞれを通過する光の量を記述する。複数の着色剤は、本発明の実施の形態によれば、シアン、マゼンダ、イエロー及びブラックの着色剤を含み、1以上のスポットの着色剤を含む場合もある。
本発明の実施の形態によれば、一般にデータベースからの、スポットの着色剤である場合があるソリッドに印刷された着色剤が混合された場合、現在の着色剤の目標の異なる被印刷物を使用した結果として得られるRGBの推定値206は、以下に示される。
In accordance with an embodiment of the present invention, when a colorant printed on a solid, which is typically a spot colorant, from a database was mixed, a substrate with a different target for the current colorant was used. The resulting
本発明の実施の形態によれば、Kubelka-Munkの式(Eq4)が簡略化される。この式は、当該技術分野で知られている、ICCのような3つの刺激値のノンスペクトルのカラーマネージメントのワークフローにおけるような、広範にサンプルされるスペクトルデータとの使用のために変更される。次元N=3は、フルスペクトルの計算がシミュレートされる場合にN=32又はN=32よりも高く拡張される。しかし、迅速な計算と結合される合理的な精度は、N=3でさえ取得することができる。当業者であれば、本発明は、Nが3以上である限り、特定のNの値に限定されないことを理解されるであろう。 According to the embodiment of the present invention, the Kubelka-Munk equation (Eq4) is simplified. This equation is modified for use with widely sampled spectral data, such as in a three-stimulus non-spectral color management workflow, such as ICC, known in the art. The dimension N = 3 is extended higher than N = 32 or N = 32 when a full spectrum calculation is simulated. However, reasonable accuracy combined with rapid computation can be obtained even with N = 3. One skilled in the art will appreciate that the present invention is not limited to any particular value of N as long as N is 3 or greater.
特に、インクzの厚さについて目に見えるスペクトル(j=0,1,2)の赤、緑及び青の部分に基づいた反射率の推定を考える。本発明の実施の形態は、正規化されたzの値をz’=z/z0であるように定義し、この場合、z0は、被印刷物上に印刷されるソリッドなインクの厚さである。これは、z’=1.0が被印刷物上の着色剤のオリジナルの厚さであり、z’=75がオリジナルの厚さの75%であり(たとえば75%に等しいトラップの値をもつ別のインクで印刷するとき)、及びz’=1.1は、オリジナルの厚さの110%である(たとえば前に印刷された着色剤のレイヤの接着特性が被印刷物よりも高く、後続する着色剤の表面に着色する更に厚いインクのレイヤが得られる場合)。反射の表現は、以下のように書かれる。 In particular, consider reflectance estimation based on the red, green, and blue portions of the visible spectrum (j = 0, 1, 2) for the thickness of ink z. Embodiments of the present invention define the normalized z value to be z ′ = z / z 0 , where z 0 is the thickness of the solid ink printed on the substrate It is. This is because z ′ = 1.0 is the original thickness of the colorant on the substrate and z ′ = 75 is 75% of the original thickness (for example, another with a trap value equal to 75%). And z ′ = 1.1 is 110% of the original thickness (eg, the adhesion properties of the previously printed colorant layer is higher than the substrate and the subsequent coloration) A thicker layer of ink is obtained that colors the surface of the agent). The expression of reflection is written as follows:
次に、シンプルなRj∞の推定が行われる。Rj∞は、“Rjmin”、すなわち被印刷物に重ねられるインク膜の厚さに関係なく、インクの最小の反射(又は最大の吸収)として考えられる。合理的かつ直感的な最初のRj∞の推測は、着色剤についてオリジナルの測定された値と類似の特性を有するが、不透明なファクタρ∞によりスケーリングされることを想定することである。したがって、以下に示される。 Next, a simple estimation of R j∞ is performed. R j∞ is considered as “R jmin ”, that is, the minimum reflection (or maximum absorption) of the ink, regardless of the thickness of the ink film superimposed on the substrate. Rational and intuitive guess of the initial R J∞ may have similar characteristics as the original values measured for the colorant, it is to assume to be scaled by an opaque factor [rho ∞. Therefore, it is shown below.
この不透明さの開始ポイントの推定がデータにより良好な一致とならない場合、不透明の特性ρ∞は、λの関数として(スペクトルデータが使用される場合)、又はサイズnsの値の離散的なベクトルとして実現され、この場合、nsは、スペクトルのサンプルサイズであり、典型的な分光光度計からの離散的なスペクトルデータについて、先のRGBの3つの刺激のアプローチのケースにおいてns=3であり、(たとえば)ns=32までである。 Discrete vector value in this case the opacity of the starting point of the estimation is not a good match with the data, the opaque characteristics [rho ∞, as a function of lambda (if spectral data is used), or the size n s Where n s is the spectral sample size, and for discrete spectral data from a typical spectrophotometer, in the case of the previous three RGB stimulus approach, n s = 3 Yes, up to (for example) n s = 32.
トラップパラメータβTは、被印刷物又は表面上に印刷される先行する着色剤のレイヤをもつ被印刷物に着色剤が印刷される表面の特性であることが観察される。定義により、着色物が被印刷物に印刷される場合、被印刷物のトラップパラメータの値は、βT=1.0であるように正規化される。経験的な証拠は、ある着色剤が多数の混合された着色剤に印刷されたとき、トラップパラメータの値βTは、基礎となる印刷物の最悪のケースのトラップ効率により与えられる。たとえば、SWOP TR001データセットを調べるとき、CMYの着色剤のトラップ効率が約75%であるのに対して、Kの効率は約45%であるように見える。3つの着色剤(CMY)が互いに印刷されるとき、有効なトラップは、約75%のままとなるように見える。しかし、1つ、2つ又は3つのCMYの着色剤がKの上に印刷されるとき、効果的なトラップは、45%となるように一貫して見え、すなわち「粘性」又は接着特性は、基礎となるKレイヤにより支配される。 It is observed that the trap parameter β T is a property of the surface on which the colorant is printed on the substrate or the substrate having a preceding colorant layer printed on the surface. By definition, when a colored object is printed on a substrate, the value of the substrate trap parameter is normalized so that β T = 1.0. Empirical evidence indicates that when a colorant is printed on multiple mixed colorants, the trap parameter value β T is given by the worst case trap efficiency of the underlying print. For example, when examining the SWOP TR001 data set, the CMY colorant trapping efficiency appears to be about 75%, whereas the K efficiency appears to be about 45%. When three colorants (CMY) are printed on each other, the effective trap appears to remain about 75%. However, when one, two or three CMY colorants are printed on K, the effective trap appears consistently to be 45%, ie “viscous” or adhesive properties are Dominated by the underlying K layer.
要するに、(TR001データセットのCIELABデータで記されるSWOP印刷のような)多くの印刷条件では、印刷されている着色剤に先行する混合された着色剤のトラップ効率は、混合された着色剤の最も低いトラップ効率により与えられる。したがって、1つのトラップ値βTは、先行する着色剤のグループについて決定される。この値は、混合された着色剤の最小の効率のβT(最低のβT)に等しく、印刷される次の着色の相対的な厚さを計算するために使用される。なお、この仮定は、この観察が全てのシステムについて当てはまらない場合にグループの最小値によるのではなく、前に印刷された着色剤のレイヤの特性のトラップ値によりトラップの値が決定されるように、変更することができる。 In short, for many printing conditions (such as SWOP printing as described in the CIELAB data in the TR001 data set), the trapping efficiency of the mixed colorant preceding the printed colorant is the same as that of the mixed colorant. Given by the lowest trap efficiency. Thus, one trap value β T is determined for the preceding group of colorants. This value is equal to the beta T minimum efficiency of mixed colorant (lowest beta T), it is used to calculate the relative thickness of the next colored printed. Note that this assumption does not depend on the group minimum if this observation is not true for all systems, but the trap value is determined by the trap value of the previously printed colorant layer properties. Can be changed.
次に、先のK−M表現は、多数の着色剤Nに被印刷物を加えたものについて更新される。インデックス“i”は、被印刷物(i=0)で開始し、第一の着色剤のレイヤ(i=1)等で進行する着色剤の番号を示す。したがって、インデックス“i”は、i=0からi=Nの範囲に及ぶ。 Next, the previous KM representation is updated for a number of colorants N plus the substrate. The index “i” indicates the number of the colorant that starts with the substrate (i = 0) and proceeds in the first colorant layer (i = 1) or the like. Therefore, the index “i” ranges from i = 0 to i = N.
![]()
![]()
図3の実施の形態は、係る混合された着色剤がソリッドに被印刷物に印刷されたとき、すなわち最大又は近似的に最大の色合いを有するとき(これは、互いに印刷された全ての着色剤についてz=1であり、印刷されない着色剤についてz=0であることを意味する)、結果として得られる混合された着色剤の色の値、スポット又はその他を推定するため、先の式33,34及び35を実行するコンピュータを利用したシステム300を例示する。ドットサイズのゲイン、ドットの不鮮明さ及びドットの着色のような淡い色合いの(ソリッドではない)着色剤に関連される作用は、セクションIIIで以下に記載される。
The embodiment of FIG. 3 shows that when such a mixed colorant is printed on a substrate in solid form, i.e. has a maximum or approximately maximum hue (this is true for all colorants printed on each other). z = 1, meaning z = 0 for non-printed colorants), to estimate the color value, spot or others of the resulting mixed colorant, the previous equations 33,34 3 illustrates a
特に、図3の実施の形態は、被印刷物に印刷される複数の着色剤の初期情報を記憶するデータベース302を例示する。このデータベース302は、図1におけるデータストレージシステム104に含まれる場合がある。また、様々な被印刷物の初期情報は、データベース202に記憶される。初期情報は、着色剤及び被印刷物のそれぞれの色情報を含む場合がある。色情報は、着色剤及び被印刷物のそれぞれについて反射率R0=(R,G,B)の値のような色値を含む。また、初期情報は、着色剤のそれぞれについてトラップファクタβTのようなトラップ情報、及び、着色剤のそれぞれについて、不透明のファクタρのような不透明の情報を含む場合がある。初期情報は、入力源102から受信される。
In particular, the embodiment of FIG. 3 illustrates a
R0=(R,G,B)の値は、先の式9で記載されたXYZ→RGBマトリクスを介してRGBに変換される被印刷物及び着色剤のそれぞれの反射率のXYZ測定値から直接に計算される場合がある。ファクタβT及びρの初期値は、前に計算された多くの着色剤の平均に基づくか、又はスポットの着色剤のケースでは、CMYKの計算されたパラメータに基づいており、この場合、最初の推定値は、初期化されるスポットの着色剤に最も類似するCMYKの着色剤に基づく。関連するCMYKパラメータの平均値を使用することもできる。代替的に、関連するパラメータは、少数の基礎となるインクのセット(一般に15又は20以下のサイズのセット)、及び他の着色剤を生成するために使用されるそれぞれの基礎となるインクのパーセンテージに比例してこれらパラメータの相対的な重み付けにより生成される推定値を使用して測定される。 The value of R 0 = (R, G, B) is directly obtained from the XYZ measurement values of the respective reflectances of the printing material and the colorant that are converted into RGB through the XYZ → RGB matrix described in Equation 9 above. May be calculated. The initial values of the factors β T and ρ are based on the average of many colorants calculated previously, or in the case of spot colorants, based on the calculated parameters of CMYK, in this case the first The estimate is based on the colorant of CMYK that is most similar to the colorant of the spot being initialized. The average value of the relevant CMYK parameters can also be used. Alternatively, the relevant parameters are a small number of underlying ink sets (generally 15 or 20 sized sets), and the percentage of each underlying ink used to produce other colorants. Is estimated using an estimate generated by the relative weighting of these parameters.
計算モジュール301は、色情報、トラップ情報、及び任意に、被印刷物で混合される着色剤のセット305に特定の不透明の情報のような、データベース302に記憶される情報を受ける。計算モジュール301は、データベース302から使用されている被印刷物の色情報を受ける。データベース302から受信される情報に少なくとも基づいて、計算モジュールは、被印刷物で混合されるとき、結果として得られる着色剤の色値306を推定する。
The
最適化モジュール303は、図1のコンピュータシステム101の一部でもあり、被印刷物上の着色剤の混合の色測定を記述する測定情報304を、推定された結果として得られる色値206に比較する。測定情報304は、図1に示される入力源102から最適化モジュール303により受信される。次いで、最適化モジュール303は、1以上の着色剤及び被印刷物についてR0=(R,G,B)の値のような色情報、1以上の着色剤についてファクタβTのようなトラップ情報、及び任意に、測定情報204に少なくとも基づいて1以上の着色剤についてファクタρのような不透明の情報を更新する。
The
たとえば、最適化モジュール303は、推定値306と測定値304との間の誤差を最小にするため、最小自乗フィットを利用して、βT及びρの改善された値を判定する。データベース302は、着色剤/被印刷物の更に正確な値が計算されるときに更新される場合がある。データベース302が更新及び改善されるとき、RGBしたがってXYZの推定も同様に改善される。
For example, the
典型的に、最適化モジュールにより多数の例示的な測定値が受信される場合、期待される誤差の良好な推定が行われる。たとえば、着色剤Bに印刷する着色剤A及び着色剤Bに印刷する着色剤Cについてデータが存在する場合、トラップパラメータの合理的な推定値が着色剤Bについて決定される。しばしば、トラップ予測により、B上に印刷するAとB上に印刷するCとの間の推定と測定との間の誤差が得られる。この誤差は、あるインクのセットにおける着色剤BによるL*a*b*を計算する評価可能な精度の推定として使用される。あるジョブがスポットの着色剤A,B及びCを実際に含む場合、実際の歴史の刷り重ねのデータは、そのジョブについてL*a*b*の正確な推定を保証するために直接に使用される。データは、A,B及びCについて、トラップ、不透明さ等の推定された値を使用して、Kublka-Munkモデルの刷り重ねの結果に対する経験的な補正を実行することで使用される。なお、データベースは、それぞれのスポットの着色剤について期待されるΔEを追跡する。実施の形態によれば、推定された結果として得られる色値306と測定情報304からの測定された色値との間の誤差を記述するエラー情報は、測定情報304からの測定データにおけるノイズによる期待されるエラーと同じ大きさ又は実質的に同じ大きさのエラーを示す。
Typically, if a large number of exemplary measurements are received by the optimization module, a good estimate of the expected error is made. For example, if data exists for colorant A printing on colorant B and colorant C printing on colorant B, a reasonable estimate of the trap parameter is determined for colorant B. Often, trap prediction provides an error between the estimation and measurement between A printing on B and C printing on B. This error is used as an estimate of the evaluable accuracy for calculating L * a * b * due to Colorant B in a certain ink set. If a job actually contains spot colorants A, B, and C, the actual historical reprint data is used directly to ensure an accurate estimate of L * a * b * for that job. The The data is used for A, B and C by performing empirical corrections to the results of the Kublka-Munk model overprinting using estimated values such as traps, opacity, etc. Note that the database tracks the expected ΔE for each spot colorant. According to the embodiment, the error information describing the error between the estimated
トラップファクタβTのようなトラップ情報、及び任意に不透明さのファクタρのような不透明さの情報は、実際の測定されたデータ304に基づいて、それぞれの着色剤A,B,C等について計算され、測定データ304に含まれない着色剤A,B,C等の新たな組み合わせは、式33,34及び35に基づいて、並びに、それぞれの着色剤の更新されたRの値、トラップβT、及び不透明さρに基づいて推定される。たとえば、最適化モジュール303は、着色剤A,B,C及びDの組み合わせを含む第一の測定データのセットを使用して、A,B,C及びDのそれぞれについてR、トラップβT、及び不透明さρを計算する。次いで、最適化モジュール303は、着色剤E,F,G及びHを含む第二のデータセットについてR、トラップβT、及び不透明さρを計算し、データベース302を更新する。この最初の初期化を実行して、計算モジュール301は、A及びE,又はB及びF、又はA,D,E及びGのような、データベース302からそれぞれの着色剤のL*a*b*の値、トラップβT、及び不透明さρを利用して、前に測定されていない他の組み合わせのR’の値(及び後続してXYZ及びL*a*b*)を正確に推定する。「組み合わせ“combination”」は、着色剤E上に着色剤Aを刷り重ねることを意味する。
Trap information such as trap factor β T and optionally opacity information such as opacity factor ρ are calculated for each colorant A, B, C, etc. based on actual measured
業界における一般的な実施は、赤、緑及び青フィルタを使用して実際の濃度の測定値に対して期待される濃度の測定値を比較することで、着色剤のペアの「トラップ」を定義及び測定することである。2つの着色剤を加える期待される結果は、個々の濃度の測定値の合計である。実際の結果は、個々の測定値の合計よりも一般に低い。実際の結果は、個々の測定値の合計よりも一般に低い。この「トラップ」の特徴は、その着色剤のペアに特化しており、任意の順序で任意の着色剤のペアを組み合わせする評価可能な方法に組み込まれない。同様に、「不透明さ」は、ブラック上に印刷するある着色剤の期待される濃度に対して測定された濃度を比較することで示され、ブラック上に印刷される透明な着色剤の濃度値は、黒の測定された濃度よりも高いのではなく、低い濃度の測定値となる。 A common practice in the industry is to define a “trap” for a pair of colorants by using red, green and blue filters to compare the expected density measurement against the actual density measurement. And to measure. The expected result of adding two colorants is the sum of the individual density measurements. Actual results are generally lower than the sum of the individual measurements. Actual results are generally lower than the sum of the individual measurements. This “trap” feature is specific to that pair of colorants and is not incorporated into an evaluable method of combining any pair of colorants in any order. Similarly, “opacity” is indicated by comparing the measured density against the expected density of one colorant printing on black, and the concentration value of a transparent colorant printed on black. Is not higher than the measured density of black, but is a measured value of lower density.
上述の内容とは対照的に、本発明の実施の形態は、最小自乗フィットを介して、閉じた形式の数学表現で明示的に定義されるトラップ及び不透明さの値を決定し、且つ、当該技術分野で知られているIT8.3/7のような従来の測定チャートデータを利用して、これらの値を推定することができる。この実施の形態は、全ての刷り重ねチャートデータを使用することができ、不透明さを測定するため、ブラック上に印刷される着色剤に限定されない。同様に、この実施の形態は、その着色剤と他の着色剤との全ての組み合わせに適用されるそれぞれの着色剤の一般的なトラップパラメータを定義する。最適化モジュールは、301は、それぞれの着色剤のトラップの最適値を決定するため、互いに印刷された着色剤の全ての異なる組み合わせを利用する場合がある。このアプローチは、ブラック上に印刷する上述された典型的な手順よりも効率的であり、ブラック上に印刷するとき、不透明さの影響及びトラップの影響を分離することが困難である。全ての利用可能な刷り重ねデータの最小自乗の分析を実行することで、トラップ、不透明さ、又は他の着色剤の重要な特性の信頼性の高い推定を確実にすることができる。
In contrast to what has been described above, embodiments of the present invention determine trap and opacity values explicitly defined in a closed form mathematical expression via a least squares fit, and These values can be estimated using conventional measurement chart data such as IT 8.3 / 7 known in the technical field. This embodiment can use all overprint chart data and is not limited to colorants printed on black to measure opacity. Similarly, this embodiment defines a general trap parameter for each colorant that applies to all combinations of that colorant and other colorants. The
III.着色剤がソリッドなやり方で印刷されたか又は淡い色合いのやり方で印刷されたかに関わらず、被印刷物上で混合された複数の着色剤の結果として得られる色の値の推定
本発明のこれらの実施の形態によれば、ドットサイズの増加及び着色剤の不鮮明さの影響は、ソリッドに印刷された着色剤及びソリッドに印刷されていない(淡い色合いの)着色剤の両者について考慮するため、式33に組み込まれえる。通常、ノイゲバウアの式は、ノイゲバウアプライマリが着色剤のそれぞれについて淡い色合いの値とは独立であることを本質的に想定している。顕微鏡を使用した視覚的な評価と同様に、RGBフィルタを使用するミクロデンシトメトリ(microdensitometry)は、被印刷物上に実際のドットの印刷に関して2つの現実を明らかに示す。ドットの濃度は、ソリッドの濃度とは異なる場合があること、ドットを囲んでいる被印刷物の最小の濃度Dminは、ドットをもたない被印刷物の最小の濃度Dminと同様に低くないこと(すなわち着色現象が生じている可能性がある)、及びこの着色は、隣接する被印刷物の領域にのみ影響を及ぼすだけではなく、他の着色剤の隣接するドットにも影響を及ぼす。したがって、これは、ノイゲバウアプライマリが、それぞれの着色剤のそれぞれのドット値の関数であることを意味する。この着色は、図5及び図6に示されるように、PhotoShopにより大きな中間調を形成することでシミュレートされ、RGBに変換され、次いで、これら2つの影響をシミュレートするために調節される。
III. Estimating the resulting color values of multiple colorants mixed on a substrate, regardless of whether the colorant was printed in a solid manner or printed in a light tint manner. According to this form, the effect of dot size increase and colorant smearing is considered for both solid printed colorants and non-solid printed (light shades) colorants. Can be incorporated into. Normally, Neugebauer's equation essentially assumes that Neugebauer primary is independent of the light shade value for each of the colorants. Similar to visual evaluation using a microscope, microdensitometry using RGB filters clearly shows two realities for printing actual dots on a substrate. The density of the dots may differ from the density of the solid, and the minimum density Dmin of the substrate surrounding the dots should not be as low as the minimum density Dmin of the substrate without dots (Ie, a coloring phenomenon may have occurred), and this coloring not only affects the area of the adjacent substrate, but also affects adjacent dots of other colorants. This therefore means that Neugebauer primary is a function of the respective dot value of the respective colorant. This coloring is simulated by creating a large halftone with PhotoShop, converted to RGB, and then adjusted to simulate these two effects, as shown in FIGS.
ここで、相対的なインク膜の厚さδiにおける変化は、K−M反射の方程式33に組み込まれる場合がある。 Here, the change in relative ink film thickness δ i may be incorporated into the KM reflection equation 33.
このドットサイズが減少するときにドットの不鮮明さの大きさが線形に増加することに関する上記後者の想定は、ドットの相対的な領域がロウであるときに不鮮明さの確率が高く、ドットの相対的な領域がハイであるときに不鮮明さの確率が低いためになされる場合がある。これらの関係は、被印刷物により囲まれる小さなドットの場合にインクが移動することができる空の空間が存在するために有効である。インクがほぼ100%の色合いであるときにインクが移動することができる空の空間は存在しない。同様に、周囲の領域への着色の影響は、ドットが小さい場合に低い。これは、着色が生じるインクの容器が小さいためである。ほぼ100%のインクの場合に、ホールを囲んでいるインクのかなりの容器が存在するとき、着色の影響は高い。したがって、一次近似は、ドットサイズにつれて線形に変化するために着色及び不鮮明さを可能にすることであり、数学モデルの測定データへのフィットの結果に基づいた適切な開始ポイントであるように見える。他の可能性のある機能は、ドットエリアの周辺に対する割合を含み、この割合は、ドットサイズの平方根として変化する。しかし、当業者であれば、本発明は着色/不鮮明の現象のための特定の近似関数、又は更に広義に、特定のシステムの連続階調の特性のために近似関数に限定されないことを理解されるであろう。 The latter assumption regarding the linear increase in dot blurring when this dot size decreases is that the probability of blurring is high when the relative area of the dot is low and the relative dot This may be done because the probability of blurring is low when the typical region is high. These relationships are effective because there is an empty space in which ink can move in the case of small dots surrounded by the substrate. There is no empty space in which the ink can move when the ink is nearly 100% shade. Similarly, the effect of coloring on the surrounding area is low when the dots are small. This is because the ink container in which coloring occurs is small. In the case of nearly 100% ink, the effect of coloring is high when there is a significant container of ink surrounding the hole. Thus, the first order approximation is to allow coloring and smearing to change linearly with dot size and appears to be a good starting point based on the result of fitting a mathematical model to the measured data. Other possible functions include a percentage of the periphery of the dot area, which varies as the square root of the dot size. However, those skilled in the art will appreciate that the present invention is not limited to a specific approximation function for the phenomenon of coloring / blurring, or more broadly, due to the continuous tone characteristics of a particular system. It will be.
δiとドットサイズとの線形の関係を想定して、ノイゲバウアプライマリを計算する先の表現は、zi’=1及びzi'=0であるzi’の2つの可能性のある値を有する。ドットから周囲の領域へのインクの移動を考慮するための補正δiは、本発明の実施の形態によれば、zi’=1であるときにドットの不鮮明さについて、zi’=0であるときに周囲の領域のドットの着色について、2つの表現を有する。 assuming a linear relationship between [delta] i and the dot size, the foregoing expressions to calculate the Neugebauer primaries, with two possibilities z i '= 1 and z i' = a 0 z i ' Has a value. Correction [delta] i to account for movement of the ink to the surrounding area from the dot, according to the embodiment of the present invention, 'the unsharpness of the dots when a = 1, z i' z i = 0 Have two representations for the coloration of the dots in the surrounding area.
なお、着色剤“i”についてδi=0(不鮮明さなし)の場合、zi’=0、従ってRij=R(i-1)jのとき、反射の表現に関する着色剤“i”からの影響はない。また、δi(x,Δi)は入力ドット値“x”の関数であるので、それぞれのノイゲバウアプライマリの反射は、「ドットの不鮮明さ」又は「ドットの着色」の補正δi(x,Δi)のために入力ドット値“x”の関数である。 In the case of δ i = 0 (no blurring) for the colorant “i”, when z i ′ = 0, and therefore R ij = R (i−1) j , from the colorant “i” regarding the expression of reflection. There is no influence. Also, since δ i (x, Δ i ) is a function of the input dot value “x”, the reflection of each Neugebauer primary is a correction of δ i (dot blurring) or “dot coloring” δ i ( x, Δ i ) is a function of the input dot value “x”.
Rの先の表現は、パーミュテーションナンバー(permutation number)について入力パラメータpを定義することで制限されていない分離の数について反復的に識別及び計算することができる。言及されるパーミュテーションとは、互いに組み合わせて印刷されているか又は印刷されていないソリッドな着色剤の可能性のある組み合わせであり、すなわちNの色分離のためのノイゲバウアプライマリのパーミュテーションである。着色剤のないノイゲバウアプライマリ(被印刷物)から全てのノイゲバウアプライマリ(N=Nsについて、ソリッドなN色のブラック)に及ぶ分離の数Nsのための順列の数Npは、以下により与えられる。 The previous representation of R can be iteratively identified and calculated for an unlimited number of separations by defining the input parameter p for the permutation number. The permutation mentioned is a possible combination of solid colorants printed or not printed in combination with each other, ie Neugebauer primary permutation for N color separations It is. (For N = N s, black solid N color) All Neugebauer primary from a non-colorant Neugebauer primary (the substrate) the number N p of permutations for the number N s of separation spanning the Is given by:
したがって、順列の数pは、0からNp−1までの値をとる。しかし、Kubelka-Munkの表現は常に“on”である“0番目”の分離すなわち被印刷物で開始するので、順列の数は、Nsの値を1だけ増加することで増加される。しかし、被印刷物(s=0)は常に“on”であるので、実際の順列の数は、2(Ns+1)ではなく2Nsにより実際に与えられる。この明らかな相違は、順列の数として2(Ns+1)の値を使用して、第一の順列p=0が決して生じない被印刷物“off”を含むので第一の順列p=0を棄て、被印刷物の分離が常に“on”のままであることを保証するため、1ではなく2だけpの値を常にインクリメントすることで解決される。したがって、第一の順列(再び例としてCMYKを使用して)は“00001”であり、これは全ての分離が“off”であることを含み、最も大きなpの値は“11111”であり、これは全ての分離が“on”であることを含む。順列は、系列“00001, 00011, 00101, 00111, …, 11101, 11111”に従ってインクリメントされる。 Therefore, the number p of permutations takes values from 0 to N p −1. However, since the Kubelka-Munk representation always starts with the “0th” separation, ie the substrate, which is “on”, the number of permutations is increased by increasing the value of N s by one. However, since the substrate (s = 0) is always "on", the actual number of permutations are actually given by 2 (Ns + 1) rather than 2 Ns. The obvious difference is that the value of 2 (Ns + 1) is used as the number of permutations and includes the substrate “off” where the first permutation p = 0 never occurs, so the first permutation p = 0 The solution is to always increment the value of p by 2 instead of 1 to ensure that the separation of the substrate is always “on”. Thus, the first permutation (again using CMYK as an example) is “00001”, which includes that all separations are “off”, and the largest p value is “11111” This includes that all separations are “on”. The permutation is incremented according to the sequence “00001, 00011, 00101, 00111,..., 11101, 11111”.
したがって、順列の数pは、2のインクリメントにおいて1からNpまでの値に及ぶ。ノイゲバウアで使用される(たとえばVigianno 1990で定義される)個々のDemichalファクタは、順列の数pにより示される特定のノイゲバウアプライマリについて、sにより示されるソリッドな色分離が“on”である場合にxをリターンし、ソリッドな色が“off”である場合に(1-x)をリターンする関数により定義される。 Therefore, the number of permutations p ranges from 1 to N p in increments of 2. The individual Demichal factor used in Neugebauer (eg, as defined by Vigianno 1990) is that the solid color separation indicated by s is “on” for the particular Neugebauer primary indicated by the number of permutations p Defined by a function that returns x and returns (1-x) if the solid color is “off”.
また、現実の印刷の振る舞いをパラメータ形式で完全に捕捉する先の方法は、コンベンショナルなCMYKのプロファイリングのために価値がある。これは、あるプロファイルを構築及び/又は更新するために比較的少ない測定が必要とされるためである。また、被印刷物の色値又は着色剤の濃度を変更するときの推定の精度のために価値がある。 Also, previous methods that fully capture the actual printing behavior in parameter form are valuable for conventional CMYK profiling. This is because relatively few measurements are required to build and / or update a profile. It is also valuable for the accuracy of estimation when changing the color value of the substrate or the concentration of the colorant.
さらに、先に印刷されたジョブパラメータからの濃度における変化ΔDs/Dsは、以下に記載されるデータベース402に追加され、自動的に計算されるか、又は手動で変更される場合がある。このパラメータは、式20と同様なやり方で、(1.0+ΔDs/Ds)により式42による指数を乗算することで使用される。このコンテクストで、ΔDs/Dsは、分離の数“s”について濃度における相対的な変化である。
Further, the change ΔD s / D s in density from previously printed job parameters is added to the
ひとたび、最小自乗フィットを介して測定されたデータから好適又は最適の全てのパラメータ値が決定されると、R()の将来の評価は、0である淡い色合いのベクトルxの淡い色合いの値xiをディスカウントすることで加速することができる。これは、パーミュテーションNpの数の計算を介して実行することができる。 Once all preferred or optimal parameter values have been determined from data measured via a least squares fit, future evaluations of R () are determined to be 0 for the pale shade vector x of the pale shade vector x. i a can be accelerated by discount. This can be done via calculation of the number of permutations N p .
0.0001の粒状度(すなわち10,000のインクリメント)でexp(x)について浮動小数点LUTを事前に計算することで、L*a*b*の推定に対する認識できる品質の低下がないことがわかる。 By pre-calculating the floating point LUT for exp (x) with a granularity of 0.0001 (ie 10,000 increments), it can be seen that there is no discernible quality degradation for L * a * b * estimation.
セクションIで記載されたように、L*a*b*からXYZに変換するためにCIELABの標準的な式及びXYZからRGBへの標準的なマトリクス変換を使用して、L*a*b*の値は、XYZに変換され、XYZから、RGB及びブラックに変換される。なお、RGBに変換し、XYZから変換するために使用されるマトリクスは、RGBの色度xy及び基準照度(たとえばD50)のホワイトポイントの色度の観点で都合よく特徴付けすることができる。 L * a * b * using standard CIELAB formulas to convert from L * a * b * to XYZ and standard matrix conversion from XYZ to RGB as described in Section I Are converted to XYZ, and from XYZ to RGB and black. Note that the matrix used to convert to RGB and from XYZ can be conveniently characterized in terms of RGB chromaticity xy and white point chromaticity of the reference illuminance (eg, D50).
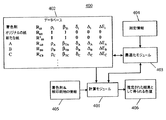
図4に示される本発明の実施の形態によれば、先の式43は、混合された着色剤がソリッドなやり方で被印刷物に印刷されるか、又は淡い色合いのやり方で被印刷物に印刷されるとき、混合された着色剤、スポット又はその他の結果的に得られる色の値を推定するため、コンピュータを利用したシステム400の一部として使用される。
According to the embodiment of the present invention shown in FIG. 4, the previous equation 43 is printed on the substrate in a solid manner or with the mixed colorant printed on the substrate in a light shade manner. When used as part of a computer-based
図4の実施の形態は、図1におけるコンピュータシステム101により実現される場合がある計算モジュール401を含み、この計算モジュールは、被印刷物に印刷される所与の着色剤405 A,B,C等の組み合わせについて反射率の値RGBを計算する。着色剤405又はそれらの属性を識別する情報は、図1に示される入力源102を介して計算モジュール401に入力される。被印刷物を含むそれぞれの着色剤のレイヤは、本発明の実施の形態によれば、L*a*b*の値、トラップファクタβTのような初期のトラップ情報、並びに、任意に(a)不鮮明さのファクタδのような不鮮明さの情報、(b)ドットの成長Δのようなドット成長情報、及び(c)データベース402に記憶される不透明さのファクタρのような不透明さの情報、のような初期の色情報を有する。データベース402は、図1に示されるデータストレージシステム104に含まれる場合がある。L*a*b*の代替として、本発明の実施の形態によれば、αRGBの値は、上述されたXYZ→RGBマトリクスを介してRGBに変換される被印刷物及びそれぞれの着色剤の反射率XYZの測定値から直接に計算され、記憶される。なお、αRGBの値は、XYZ→RGBマトリクスの選択に高く依存する。したがって、オリジナルのCIELAB又は類似のデータから動的にαRGBの値を計算することが好ましい。先のセクションで記載されるように、他のパラメータの初期値は、前に計算された多数の着色剤の平均に基づくか、又はCMYKの計算されたパラメータに基づくことができ、この場合、最初の推定値は、初期化されている着色剤に最も類似したCMYKの着色剤に基づく。
The embodiment of FIG. 4 includes a
本発明の実施の形態によれば、最適化モジュール403は、測定情報404のセットを計算モジュール401から推定された結果として得られる色値に比較する。測定情報404は、図1に示される入力源102を介して最適化モジュール403に入力される。さらに、測定情報404は、着色剤405 A,B,C等の様々な組み合わせを含む場合がある。最適化401は、本発明の実施の形態に従って、それぞれの着色剤405についてドットの不鮮明さδ、ドットの成長Δ、トラップβT及び不透明さρの好適又は更新された値を決定する。最適化モジュール403は、本発明の実施の形態によれば、推定と測定との間の誤差を最小にするため、それぞれの着色剤405についてドットの不鮮明さδ、ドットの成長Δ、トラップβT及び不透明さρの更新された値を決定するため、最小自乗フィットを利用する。データベース402は、着色剤のパラメータの更に正確な値が計算されたときに更新される場合がある。また、最適化モジュール403は、ΔEiについて新たな推定値を生成する場合がある。
According to an embodiment of the present invention, the
結果及び分析
図4を参照して上述された計算を示す研究は、SWOP TR001データを使用して実行される。SWOP TR001データセットのチャネルCMYKについて、独立なチャネルパラメータである、ドットの不鮮明さのファクタ、ドットの成長のファクタ、トラップ、不透明さ、及びRGB作業空間の色度(xr,yr,xg,yg,xb,yb)に関して最小自乗フィットが同時に実行される。TR001セットの最初の200の値は、トレイニングデータとして使用され、テスト検証データとして全体のセットが使用される。以下のパラメータのセットによれば、推定と理論との間の平均のエラーは、1.6ΔE、最大4.7ΔEである。
Results and Analysis A study showing the calculations described above with reference to FIG. 4 is performed using SWOP TR001 data. For channel CMYK in the SWOP TR001 data set, the independent channel parameters are dot blurring factor, dot growth factor, trapping, opacity, and RGB workspace chromaticity (x r , yr , x g , Y g , x b , y b ), the least squares fit is performed simultaneously. The first 200 values of the TR001 set are used as training data and the entire set is used as test verification data. According to the following set of parameters, the average error between estimation and theory is 1.6 ΔE, maximum 4.7 ΔE.
サンプルのデータセットが異なるインクについて成長するとき、最適なRGB作業空間xy’の値が調節され、これにより着色剤のトラップの推定される値に影響を及ぼす。ひとたび、サンプルセットが適切なサイズに到達すると、RGBの色度の値は、標準として凍結され、全てのインクのそれぞれについてドットサイズの増加、不鮮明さのファクタ、トラップ及び不透明さの値に関して、最小自乗フィットが実行される。 As the sample data set grows for different inks, the optimal RGB workspace xy 'values are adjusted, thereby affecting the estimated colorant trap values. Once the sample set has reached an appropriate size, the RGB chromaticity values are frozen as standard, and are minimal with respect to dot size increase, blurring factor, trapping and opacity values for each of all inks. A square fit is performed.
また、RGBの値はそれぞれの着色剤について全体のスペクトルのブロードバンドな推定値として考えられるので、N>3をもつNチャネルは、フルセットのスペクトルの測定N=32(たとえば)まで、より高い精度のために使用される。最小自乗フィットの最適化は、それぞれの着色剤のNチャネルの最適な相関及び着色剤のソリッド(colorant solid)についてXYZの値を決定するために実行される。代替的なアプローチは、Nチャネルに対応するためにそれぞれの着色剤のスペクトルのサンプリングを広げ、次いで、NチャネルのXYZ及びブラックへの良好なマッピングを達成するため、必要に応じて結果を調節することである。 Also, since RGB values can be considered as broadband estimates of the overall spectrum for each colorant, an N channel with N> 3 has a higher accuracy up to a full set of spectrum measurements N = 32 (for example). Used for. The least squares fit optimization is performed to determine the optimal correlation of the N channel of each colorant and the value of XYZ for the colorant solid. An alternative approach broadens the sampling of each colorant's spectrum to accommodate the N channel and then adjusts the results as needed to achieve a good mapping of the N channel to XYZ and black That is.
さらに、上で引用した誤差は、最大でもノイゲバウアプライマリである。これは、それぞれの混合の組み合わせについて屈折率の値の推定に対する経験的な補正を実行する試みが行われないためであり、すなわち、先の計算は、それぞれの個別のチャネル又は着色剤のみの特徴を使用して実行される。実際の測定された刷り重ねのCIELAB又はスペクトルデータのセットが与えられると、モデルとデータとの間の正確な整合を保証するため、ノイゲバウアプライマリの推定値を経験的に補正することができることは、当業者にとって明らかである。これが実行された場合、結果として得られるモデルの精度は、測定されたデータのノイズに非常に近くなり、すなわち理論と、0.5ΔE、最大1ΔE又は2ΔEの測定との間の平均誤差に非常に近くなる。 In addition, the error quoted above is Neugebauer primary at most. This is because no attempt is made to perform an empirical correction to the estimation of the refractive index value for each blend combination, i.e., the previous calculation is a feature of each individual channel or colorant only. It is executed using Given an actual measured overprint CIELAB or a set of spectral data, the Neugebauer primary estimate can be empirically corrected to ensure an accurate match between the model and the data. Will be apparent to those skilled in the art. If this is done, the accuracy of the resulting model will be very close to the noise of the measured data, i.e. the average error between the theory and the measurement of 0.5ΔE, maximum 1ΔE or 2ΔE. Get closer.
[レイダウンシーケンス(laydown sequence)の決定]
測定されたデータの後続する研究では、プレプレスデジタル校正の形成の間又は印刷実行の間の何れかに文書化されたレイダウンシーケンスが正しくない場合があることが分かっている。実際に、CMYKが余分のスポット着色剤と共に互いに印刷されることは常に想定されない。この可能性は、事後に、レイダウンシーケンスの自動化された判定の必要を指示する。これは、着色剤のペアに最小自乗フィットを実行することで上手く実行される。「バブルアルゴリズム」が使用され、これにより、(典型的に、CGATSのような測定データファイルは、たとえばCMYK_C, CMYK_M, RED, VIOLET等でラベル付けされるデバイスコード値が列に示す)測定データファイルで示されるシーケンスであるように、デフォルトダウンシーケンスが想定される。シーケンスABC…における着色剤を想定して、着色剤の組み合わせA+B、次いでB+Aのトラップ及び不透明のパラメータに関して最小自乗フィットが最初に実行される。誤差がオリジナルの順序、A+Bについて最小である場合、AとBとの間の相対的な順序は同じままであり、さもなければ、順序はBACに変化される。次のペアは、同様に、同じままであるか、又はレイダウンシーケンスに関してスワップされる。
[Determining the laydown sequence]
Subsequent studies of measured data have found that documented laydown sequences may be incorrect either during the formation of a prepress digital proof or during a print run. In fact, it is not always assumed that CMYK will print with each other along with the extra spot colorant. This possibility dictates the need for automated determination of the laydown sequence after the fact. This is done well by performing a least squares fit on the colorant pair. A “bubble algorithm” is used, which allows measurement data files (typically measurement data files such as CGATS to have device code values labeled in columns, eg CMYK_C, CMYK_M, RED, VIOLET etc.) A default down sequence is assumed as shown in FIG. Given the colorants in the sequence ABC..., A least squares fit is first performed on the colorant combinations A + B, then B + A traps and opaque parameters. If the error is minimal for the original order, A + B, the relative order between A and B remains the same, otherwise the order is changed to BAC. The next pair likewise remains the same or is swapped with respect to the laydown sequence.
それぞれのペアがこのやり方で処理された後、先の処理が最初に開始される。少なくとも1つのスワップが必要とされる場合、全体のプロセスが繰り返される。スワップが生じない場合、レイダウンの最適化プロセスが行われる。ひとたび、最適なレイダウンシーケンスが決定されると、全てのパラメータについて先のセクションで記載される全体のパラメータの最適化が実行される。 After each pair is processed in this manner, the previous process is started first. If at least one swap is required, the entire process is repeated. If no swap occurs, a laydown optimization process is performed. Once the optimal laydown sequence is determined, the overall parameter optimization described in the previous section is performed for all parameters.
[スポットとCMYKの混合]
先に示されたように、本発明の実施の形態は、SWOP TR001データセットで捕捉されたCMYK印刷プロセスの合理的な記述を形成するために使用される。正確なチャネルパラメータが決定される程度まで、互いにスポットの着色剤のソリッドと淡い色合いの混合の結果として得られる外観を推定するために本発明が使用される場合があることを、当業者であれば理解されるであろう。さらに、本発明の実施の形態は、スポットの着色剤のCMYK着色剤との混合の結果として得られる外観を推定するものであり、これは、現在ではよくあるケースであるが、CMYKプロセスがCMYK ICCプロファイル又はその等価なものの形式で既に慎重に捕捉されている場合に困難である可能性がある。
[Mixed spot and CMYK]
As indicated above, embodiments of the present invention are used to form a reasonable description of the CMYK printing process captured in the SWOP TR001 data set. Those skilled in the art will appreciate that the present invention may be used to estimate the resulting appearance of a mixture of spot colorant solids and light shades to each other to the extent that accurate channel parameters are determined. Will be understood. Furthermore, embodiments of the present invention estimate the appearance that results from mixing a spot colorant with a CMYK colorant, which is often the case now, but the CMYK process is a CMYK process. This can be difficult if it has already been carefully captured in the form of an ICC profile or equivalent.
詳しく説明するため、校正を含む多くのワークフローでは、CMYKプロファイルを最適化するために著しい努力が行われている。プロファイルを形成するために使用されるアルゴリズムにおける欠陥と同様に、ICCプロファイルを構築するために使用されるCMYK測定においてノイズがしばしば存在するので、許容可能な校正(たとえばインクジェットシミュレーション)又は許容可能な変換(たとえばSWOPからGraCol又はSNAP)を達成するため、CMYKプロファイルを変更又は編集することは、ユーザにとって一般的なやり方である。 To elaborate, many workflows, including calibration, make significant efforts to optimize the CMYK profile. Similar to defects in the algorithm used to form the profile, as there is often noise in the CMYK measurement used to build the ICC profile, acceptable calibration (eg inkjet simulation) or acceptable transformation Changing or editing a CMYK profile to achieve (eg, SWCol to GraCol or SNAP) is a common practice for users.
したがって、上述された全ての一般的な状況に照らして、既存のCMYKシミュレーションを変更されないままにし、同時に、これら既存のCMYK着色剤と混合するスポットの着色剤のL*a*b*の正確な推定を計算することが望まれる。本発明の実施の形態によれば、両方の要件を達成する直接的なソリューションが提供される。特に、
〔外4〕
〔外5〕
[Outside 4]
[Outside 5]
〔外6〕
[Outside 6]
101:コンピュータシステム
102:入力源
103:出力源
104:データストレージシステム
200:コンピュータを利用したシステム
201:計算モジュール
202:データベース
203:最適化モジュール
204:測定情報
205:着色剤
206:推定される結果として得られる色値
300:コンピュータを利用したシステム
301:計算モジュール
302:データベース
303:最適化モジュール
304:測定情報
306:色値
400:コンピュータを利用したシステム
401:計算モジュール
402:データベース
403:最適化モジュール
404:測定情報
405:着色剤
101: Computer system 102: Input source 103: Output source 104: Data storage system 200: Computer-based system 201: Calculation module 202: Database 203: Optimization module 204: Measurement information 205: Colorant 206: Estimated
Claims (25)
当該方法は、
少なくとも着色剤の色の値と被印刷物の色の値とを表す色情報を受けるステップと、
着色剤に関連する不鮮明さの特性を表す不鮮明情報を受けるステップと、
少なくとも前記色情報と前記不鮮明情報とに基づいて結果として得られる色値を推定するステップと、
を含むことを特徴とするコンピュータにより実現される方法。 A computer-implemented method for estimating a color value of a resulting colorant when attached to a substrate,
The method is
Receiving color information representing at least the color value of the colorant and the color value of the substrate;
Receiving blur information representative of the blur characteristics associated with the colorant;
Estimating a resulting color value based at least on the color information and the blur information;
A computer-implemented method comprising:
請求項1記載のコンピュータにより実現される方法。 The color value of the colorant is a device-dependent color value or a device-independent color value.
A computer-implemented method according to claim 1.
請求項1記載のコンピュータにより実現される方法。 The color value of the substrate is a device-dependent color value or a device-independent color value.
A computer-implemented method according to claim 1.
請求項1記載のコンピュータにより実現される方法。 The resulting color value is a device-dependent color value or a device-independent color value,
A computer-implemented method according to claim 1.
請求項1記載のコンピュータにより実現される方法。 The blur information defines characteristics relating to dot spread of the printed colorant,
A computer-implemented method according to claim 1.
請求項1記載のコンピュータにより実現される方法。 The colorant is a spot colorant other than regular cyan, magenta, yellow and black colorants.
A computer-implemented method according to claim 1.
前記推定するステップは、少なくとも、前記色情報、前記不鮮明情報、及び前記色合い情報に基づいて前記結果として得られる色値を推定する、
請求項1記載のコンピュータにより実現される方法。 Further comprising receiving shade information representative of the amount of pale shade of the colorant;
The estimating step estimates the color value obtained as a result based on at least the color information, the unclear information, and the hue information;
A computer-implemented method according to claim 1.
前記推定するステップは、少なくとも、前記色情報、前記不鮮明情報、及び前記ドットサイズ増加情報に基づいて前記結果として得られる色値を推定する、
請求項1記載のコンピュータにより実現される方法。 Receiving dot size increase information describing a dot size increase characteristic associated with the colorant;
The estimating step estimates the color value obtained as a result based on at least the color information, the unclear information, and the dot size increase information.
A computer-implemented method according to claim 1.
前記推定するステップは、少なくとも、前記色情報、前記不鮮明情報、前記色合い情報、及び前記ドットサイズ増加情報に基づいて前記結果として得られる色値を推定する、
請求項7記載のコンピュータにより実現される方法。 Further comprising receiving dot size increase information representative of dot size increase characteristics associated with the colorant;
The estimating step estimates the color value obtained as a result based on at least the color information, the unclear information, the hue information, and the dot size increase information.
8. A computer-implemented method according to claim 7.
請求項9記載のコンピュータにより実現される方法。 The dot size increase information indicates the amount of colorant dot growth printed.
A computer-implemented method according to claim 9.
請求項7記載のコンピュータにより実現される方法。 The estimating step utilizes a model characterizing the behavior of halftones;
8. A computer-implemented method according to claim 7.
請求項7記載のコンピュータにより実現される方法。 The estimating step utilizes a model characterizing both halftone and continuous tone behaviors;
8. A computer-implemented method according to claim 7.
請求項12記載のコンピュータにより実現される方法。 The model uses a combination of Neugebauer model and Kubelka-Munk model,
13. A computer-implemented method according to claim 12.
請求項13記載のコンピュータにより実現される方法。 The Kubelka-Munk model is simplified to Bier's law,
14. A computer-implemented method according to claim 13.
請求項1記載のコンピュータにより実現される方法。 Further comprising adjusting the amount of colorant deposited based on at least the blur information, the estimated resulting color value, or both,
A computer-implemented method according to claim 1.
少なくとも前記測定情報に基づいて、前記着色剤の色値、前記不鮮明情報、又はそれらの両者を更新するステップと、
を更に含む請求項1記載のコンピュータにより実現される方法。 Receiving measurement information representing a color measurement of adhesion of the colorant;
Updating the color value of the colorant, the blur information, or both based on at least the measurement information;
The computer-implemented method of claim 1 further comprising:
少なくとも前記測定情報に基づいて、前記着色剤の色値、前記不鮮明情報、又はそれらの両者を更新するステップと、
を更に含む請求項7記載のコンピュータにより実現される方法。 Receiving measurement information representing a color measurement of adhesion of the colorant;
Updating the color value of the colorant, the blur information, or both based on at least the measurement information;
The computer-implemented method of claim 7 further comprising:
少なくとも前記測定情報に基づいて、再現される前記着色剤の色値、前記不鮮明情報、前記ドットサイズの増加情報、又はこれらの組み合わせを更新するステップと、
を更に含む請求項8記載のコンピュータにより実現される方法。 Receiving measurement information representing a color measurement of adhesion of the colorant;
Updating the color value of the colorant to be reproduced, the blur information, the dot size increase information, or a combination thereof, based on at least the measurement information;
The computer-implemented method of claim 8 further comprising:
前記誤差情報は、前記測定からの測定データにおけるノイズによる期待される誤差と同じ大きさの誤差を示す、
請求項1記載のコンピュータにより実現される方法。 Further comprising receiving error information representative of an error between the estimated resulting color value and the measured color value, wherein the measured color value is obtained from the deposition of the colorant Derived from the value,
The error information indicates an error of the same magnitude as expected error due to noise in the measurement data from the measurement;
A computer-implemented method according to claim 1.
当該方法は、
少なくともスポットの着色剤の色の値と被印刷物の色の値とを表す色情報を受けるステップと、
スポットの着色剤に関連する不鮮明さの特性を表す不鮮明情報を受けるステップと、
少なくとも前記色情報と前記不鮮明情報とに基づいて結果的に得られる色値を推定するステップと、
を含むことを特徴とするコンピュータによりアクセス可能なメモリシステム。 Holds computer instructions that, when executed or installed and executed, cause one or more computers to perform a method of estimating the resulting colorant color value when applied to a substrate. A memory system accessible by a computer,
The method is
Receiving color information representing at least the color value of the spot colorant and the color value of the substrate;
Receiving blur information representative of blur characteristics associated with the spot colorant;
Estimating a color value obtained as a result based at least on the color information and the blur information;
A computer-accessible memory system.
前記推定するステップは、少なくとも、前記色情報、前記不鮮明情報、及び前記色合い情報に基づいて前記スポットの着色剤の前記結果として得られる色値を推定する、
請求項20記載のコンピュータによりアクセス可能なメモリシステム。 Receiving tint information representative of the amount of light tint of the spot colorant;
The estimating step estimates the color value obtained as a result of the colorant of the spot based on at least the color information, the blur information, and the hue information.
21. A memory system accessible by a computer according to claim 20.
前記推定するステップは、少なくとも、前記色情報、前記不鮮明情報、前記色合い情報、及び前記ドットサイズ増加情報に基づいて前記スポットの着色剤の前記結果として得られる色値を推定する、
請求項20記載のコンピュータによりアクセス可能なメモリシステム。 Further comprising receiving dot size increase information representative of dot size increase characteristics associated with the spot colorant;
The estimating step estimates the color value obtained as a result of the colorant of the spot based on at least the color information, the blur information, the hue information, and the dot size increase information;
21. A memory system accessible by a computer according to claim 20.
請求項7記載のコンピュータにより実現される方法。 The estimating step utilizes a model characterizing both halftone and continuous tone behaviors;
8. A computer-implemented method according to claim 7.
少なくとも前記測定情報に基づいて、再現される前記着色剤の色値、前記不鮮明情報、又はそれらの両者を更新するステップと、
を更に含む請求項22記載のコンピュータによりアクセス可能なメモリシステム。 Receiving measurement information representing a color measurement of the spot colorant adhesion;
Updating the color value of the colorant to be reproduced, the blur information, or both based on at least the measurement information;
The computer-accessible memory system of claim 22 further comprising:
前記誤差情報は、前記測定からの測定データにおけるノイズによる期待される誤差と同じ大きさの誤差を示す、
請求項20記載のコンピュータによりアクセス可能なメモリシステム。 Further comprising receiving error information representative of an error between the estimated resulting color value and the measured color value, wherein the measured color value is obtained from a colorant deposit on the spot. Obtained from
The error information indicates an error of the same magnitude as expected error due to noise in the measurement data from the measurement;
21. A memory system accessible by a computer according to claim 20.
Applications Claiming Priority (2)
| Application Number | Priority Date | Filing Date | Title |
|---|---|---|---|
| US11/560,142 US7738142B2 (en) | 2006-11-15 | 2006-11-15 | Estimating color of a colorant deposited on a substrate |
| PCT/US2007/023241 WO2008060402A1 (en) | 2006-11-15 | 2007-11-02 | Estimating color of colorant on substrate |
Publications (2)
| Publication Number | Publication Date |
|---|---|
| JP2010509609A true JP2010509609A (en) | 2010-03-25 |
| JP2010509609A5 JP2010509609A5 (en) | 2011-12-15 |
Family
ID=39111941
Family Applications (1)
| Application Number | Title | Priority Date | Filing Date |
|---|---|---|---|
| JP2009537148A Ceased JP2010509609A (en) | 2006-11-15 | 2007-11-02 | Estimating the color of the colorant on the substrate |
Country Status (4)
| Country | Link |
|---|---|
| US (1) | US7738142B2 (en) |
| EP (1) | EP2082567A1 (en) |
| JP (1) | JP2010509609A (en) |
| WO (1) | WO2008060402A1 (en) |
Cited By (1)
| Publication number | Priority date | Publication date | Assignee | Title |
|---|---|---|---|---|
| JP2022538937A (en) * | 2019-08-21 | 2022-09-06 | サン ケミカル コーポレイション | Metal Deco digital proof process |
Families Citing this family (17)
| Publication number | Priority date | Publication date | Assignee | Title |
|---|---|---|---|---|
| US7856116B2 (en) | 2004-11-09 | 2010-12-21 | Digimarc Corporation | Authenticating identification and security documents |
| US20080232884A1 (en) * | 2007-03-22 | 2008-09-25 | Cadlink Technology Corporation | Method for printing onto coloured substrates |
| WO2010024944A1 (en) * | 2008-08-27 | 2010-03-04 | Sun Chemical Corporation | Automated ink color matching of solids and tones |
| US8390882B2 (en) * | 2009-08-07 | 2013-03-05 | Xerox Corporation | Systems and methods for estimating the color of coated prints |
| US8824005B2 (en) | 2011-06-21 | 2014-09-02 | Eastman Kodak Company | Method of designing a color chart |
| US8570599B2 (en) * | 2011-06-21 | 2013-10-29 | Eastman Kodak Company | Method of characterizing an imaging system |
| US9185266B2 (en) | 2011-06-21 | 2015-11-10 | Eastman Kodak Company | Method of creating an ICC profile for a printing system |
| EP2701377A3 (en) | 2012-04-27 | 2014-12-10 | Esko Software Bvba | Calculating the spectral characteristics of the color resulting from overlaying colorants |
| EP3138277B1 (en) * | 2014-04-28 | 2019-03-20 | Hewlett-Packard Development Company L.P. | To process information to use at least one opaque ink as a process colorant |
| DE102014221207B3 (en) * | 2014-10-20 | 2015-09-24 | Heidelberger Druckmaschinen Ag | Method for calculating a spot color database |
| EP3593317B1 (en) | 2017-03-10 | 2023-11-08 | Digimarc Corporation | Predicting detectability and grading prior to printing |
| US10986245B2 (en) | 2017-06-16 | 2021-04-20 | Digimarc Corporation | Encoded signal systems and methods to ensure minimal robustness |
| US10506128B1 (en) | 2017-06-16 | 2019-12-10 | Digimarc Corporation | Encoded signal systems and methods to ensure minimal robustness |
| WO2019172918A1 (en) * | 2018-03-08 | 2019-09-12 | Hewlett-Packard Development Company, L.P. | Processing of spot colors in a printing system |
| US10880451B2 (en) | 2018-06-08 | 2020-12-29 | Digimarc Corporation | Aggregating detectability metrics to determine signal robustness |
| JP7299048B2 (en) | 2019-03-26 | 2023-06-27 | 株式会社Screenホールディングス | Color prediction method and color prediction program |
| EP3790267A1 (en) * | 2019-09-06 | 2021-03-10 | GMG GmbH & Co. KG | Method for the automated production of color cards |
Citations (3)
| Publication number | Priority date | Publication date | Assignee | Title |
|---|---|---|---|---|
| JPH08160704A (en) * | 1994-12-02 | 1996-06-21 | Hitachi Ltd | Color correction method for color image forming device and color image forming device |
| JP2003326749A (en) * | 2002-05-10 | 2003-11-19 | Canon Inc | Reproduction color estimating apparatus and method |
| WO2006118833A2 (en) * | 2005-05-03 | 2006-11-09 | Eastman Kodak Company | Predicting colorimetric measurements of mixed subtractive colors |
Family Cites Families (5)
| Publication number | Priority date | Publication date | Assignee | Title |
|---|---|---|---|---|
| US3848856A (en) * | 1973-10-01 | 1974-11-19 | Hazeltine Corp | Local correction apparatus for a color previewer |
| US6046118A (en) * | 1996-08-02 | 2000-04-04 | E. I. Du Pont De Nemours And Company | Composite sheet material |
| US5933578A (en) * | 1997-04-08 | 1999-08-03 | Barco Graphics, N.V. | Method and device for determining the color appearance of color overprints |
| US6654143B1 (en) * | 1999-10-28 | 2003-11-25 | Xerox Corporation | Printer characterization adjustment for different papers |
| AU2003224459A1 (en) | 2002-05-10 | 2003-11-11 | Canon Kabushiki Kaisha | Reproduction color prediction apparatus and method |
-
2006
- 2006-11-15 US US11/560,142 patent/US7738142B2/en active Active
-
2007
- 2007-11-02 EP EP07839930A patent/EP2082567A1/en not_active Withdrawn
- 2007-11-02 WO PCT/US2007/023241 patent/WO2008060402A1/en active Application Filing
- 2007-11-02 JP JP2009537148A patent/JP2010509609A/en not_active Ceased
Patent Citations (3)
| Publication number | Priority date | Publication date | Assignee | Title |
|---|---|---|---|---|
| JPH08160704A (en) * | 1994-12-02 | 1996-06-21 | Hitachi Ltd | Color correction method for color image forming device and color image forming device |
| JP2003326749A (en) * | 2002-05-10 | 2003-11-19 | Canon Inc | Reproduction color estimating apparatus and method |
| WO2006118833A2 (en) * | 2005-05-03 | 2006-11-09 | Eastman Kodak Company | Predicting colorimetric measurements of mixed subtractive colors |
Cited By (3)
| Publication number | Priority date | Publication date | Assignee | Title |
|---|---|---|---|---|
| JP2022538937A (en) * | 2019-08-21 | 2022-09-06 | サン ケミカル コーポレイション | Metal Deco digital proof process |
| JP7189391B2 (en) | 2019-08-21 | 2022-12-13 | サン ケミカル コーポレイション | Metal Deco digital proof process |
| US11567710B2 (en) | 2019-08-21 | 2023-01-31 | Sun Chemical Corporation | Metal deco digital proofing process |
Also Published As
| Publication number | Publication date |
|---|---|
| US20080111997A1 (en) | 2008-05-15 |
| EP2082567A1 (en) | 2009-07-29 |
| US7738142B2 (en) | 2010-06-15 |
| WO2008060402A1 (en) | 2008-05-22 |
Similar Documents
| Publication | Publication Date | Title |
|---|---|---|
| JP2010509886A (en) | Estimating the color of the colorant mixed on the substrate | |
| JP2010509609A (en) | Estimating the color of the colorant on the substrate | |
| EP0613062B1 (en) | Method for characterization of photosensitive color proofing systems | |
| EP1649409B1 (en) | Prediction model for color separation, calibration and control of printers | |
| US6575095B1 (en) | Method and apparatus for calibration | |
| EP1083739B1 (en) | Method and apparatus for calibrating a printing device | |
| US20060139668A1 (en) | Image processing apparatus and method thereof | |
| US7535596B2 (en) | Colorant control values for color printing devices | |
| JPH07505511A (en) | Color correction using 4-dimensional index table | |
| JP6073446B2 (en) | Method for calculating the spot color database | |
| CN106464775A (en) | Color model | |
| Milder et al. | Ink-jet printer’s characterization by 3D gradation trajectories on an equidistant color difference basis | |
| US7595910B2 (en) | Method for making a dot for dot proof | |
| US20230231964A1 (en) | Printer calibration using error-corrected color profile generation | |
| Deshpande | N-colour separation methods for accurate reproduction of spot colours | |
| EP1596576A2 (en) | Method for closed loop characterization | |
| Abebe et al. | Kubelka-Munk theory for efficient spectral printer modeling | |
| Spiridonov et al. | Study the effect of gray component replacement level on reflectance spectra and color reproduction accuracy | |
| JP4010756B2 (en) | Calibration method and apparatus | |
| US20060290953A1 (en) | Method for closed loop characterization | |
| US11659131B2 (en) | Method and computer program product for predicting spectral characteristics of ink applied to a base material | |
| WO2015120896A1 (en) | A printer remodelling method | |
| Dharavath | Colorimetric analysis of scanned continuous-tone color images in a Color Managed Digital Photo Printing Workflow (CMDPPW) | |
| JP2005030902A (en) | Method of predicting color reproduction | |
| Pohnerkar | Generating ICC Output Profiles for Different Substrates: Application too a Shinohara Offset Press & Several Printers |
Legal Events
| Date | Code | Title | Description |
|---|---|---|---|
| A521 | Written amendment |
Free format text: JAPANESE INTERMEDIATE CODE: A523 Effective date: 20101026 |
|
| A621 | Written request for application examination |
Free format text: JAPANESE INTERMEDIATE CODE: A621 Effective date: 20101026 |
|
| A521 | Written amendment |
Free format text: JAPANESE INTERMEDIATE CODE: A523 Effective date: 20111024 |
|
| A977 | Report on retrieval |
Free format text: JAPANESE INTERMEDIATE CODE: A971007 Effective date: 20120615 |
|
| A131 | Notification of reasons for refusal |
Free format text: JAPANESE INTERMEDIATE CODE: A131 Effective date: 20120626 |
|
| A521 | Written amendment |
Free format text: JAPANESE INTERMEDIATE CODE: A523 Effective date: 20120926 |
|
| A01 | Written decision to grant a patent or to grant a registration (utility model) |
Free format text: JAPANESE INTERMEDIATE CODE: A01 Effective date: 20130326 |
|
| A045 | Written measure of dismissal of application [lapsed due to lack of payment] |
Free format text: JAPANESE INTERMEDIATE CODE: A045 Effective date: 20130730 |