JP2006528499A - Online wavefront measurement and display - Google Patents
Online wavefront measurement and display Download PDFInfo
- Publication number
- JP2006528499A JP2006528499A JP2006520794A JP2006520794A JP2006528499A JP 2006528499 A JP2006528499 A JP 2006528499A JP 2006520794 A JP2006520794 A JP 2006520794A JP 2006520794 A JP2006520794 A JP 2006520794A JP 2006528499 A JP2006528499 A JP 2006528499A
- Authority
- JP
- Japan
- Prior art keywords
- image
- centroid
- algorithm
- wavefront
- row
- Prior art date
- Legal status (The legal status is an assumption and is not a legal conclusion. Google has not performed a legal analysis and makes no representation as to the accuracy of the status listed.)
- Pending
Links
Images


Classifications
-
- G—PHYSICS
- G06—COMPUTING; CALCULATING OR COUNTING
- G06T—IMAGE DATA PROCESSING OR GENERATION, IN GENERAL
- G06T7/00—Image analysis
- G06T7/0002—Inspection of images, e.g. flaw detection
- G06T7/0012—Biomedical image inspection
-
- A—HUMAN NECESSITIES
- A61—MEDICAL OR VETERINARY SCIENCE; HYGIENE
- A61B—DIAGNOSIS; SURGERY; IDENTIFICATION
- A61B3/00—Apparatus for testing the eyes; Instruments for examining the eyes
- A61B3/10—Objective types, i.e. instruments for examining the eyes independent of the patients' perceptions or reactions
-
- A—HUMAN NECESSITIES
- A61—MEDICAL OR VETERINARY SCIENCE; HYGIENE
- A61B—DIAGNOSIS; SURGERY; IDENTIFICATION
- A61B3/00—Apparatus for testing the eyes; Instruments for examining the eyes
- A61B3/0016—Operational features thereof
- A61B3/0025—Operational features thereof characterised by electronic signal processing, e.g. eye models
-
- G—PHYSICS
- G06—COMPUTING; CALCULATING OR COUNTING
- G06T—IMAGE DATA PROCESSING OR GENERATION, IN GENERAL
- G06T7/00—Image analysis
- G06T7/60—Analysis of geometric attributes
- G06T7/66—Analysis of geometric attributes of image moments or centre of gravity
-
- G—PHYSICS
- G06—COMPUTING; CALCULATING OR COUNTING
- G06T—IMAGE DATA PROCESSING OR GENERATION, IN GENERAL
- G06T2207/00—Indexing scheme for image analysis or image enhancement
- G06T2207/30—Subject of image; Context of image processing
- G06T2207/30004—Biomedical image processing
- G06T2207/30041—Eye; Retina; Ophthalmic
Landscapes
- Engineering & Computer Science (AREA)
- Health & Medical Sciences (AREA)
- Life Sciences & Earth Sciences (AREA)
- Physics & Mathematics (AREA)
- General Health & Medical Sciences (AREA)
- Medical Informatics (AREA)
- Theoretical Computer Science (AREA)
- General Physics & Mathematics (AREA)
- Computer Vision & Pattern Recognition (AREA)
- Heart & Thoracic Surgery (AREA)
- Surgery (AREA)
- Animal Behavior & Ethology (AREA)
- Molecular Biology (AREA)
- Public Health (AREA)
- Veterinary Medicine (AREA)
- Biophysics (AREA)
- Ophthalmology & Optometry (AREA)
- Biomedical Technology (AREA)
- Quality & Reliability (AREA)
- Radiology & Medical Imaging (AREA)
- Nuclear Medicine, Radiotherapy & Molecular Imaging (AREA)
- Signal Processing (AREA)
- Geometry (AREA)
- Image Analysis (AREA)
- Eye Examination Apparatus (AREA)
- Testing Of Optical Devices Or Fibers (AREA)
- Image Processing (AREA)
- Length Measuring Devices By Optical Means (AREA)
Abstract
オンライン収差測定法と称される、実質的に同時に波面重点画像を獲得すること、分析すること、および表示することを可能にする高速アルゴリズムを提供する。方法の実施形態は、選択した時間間隔、例えば、20秒にわたって平均の、または、最も頻繁に起こる波面収差を決定することを含む。オンライン瞳孔直径測定は、瞳孔の大きさを変更する関数として波面収差の分析を可能にする。オンライン収差測定法を支援する波面測定装置を開示する。It provides a fast algorithm that allows acquiring, analyzing and displaying wavefront weighted images at substantially the same time, referred to as on-line aberration measurement. Method embodiments include determining an average or most frequently occurring wavefront aberration over a selected time interval, eg, 20 seconds. Online pupil diameter measurement allows analysis of wavefront aberrations as a function of changing pupil size. Disclosed is a wavefront measuring apparatus that supports on-line aberration measurement.
Description
本発明の実施形態は、概して、画像処理の分野に関し、特に、ここでは「オンライン」収差測定法と称し、眼球波面情報の測定、分析及び表示を同時に行う方法及び装置に関する。 Embodiments of the present invention generally relate to the field of image processing, and more particularly to a method and apparatus for simultaneously measuring, analyzing, and displaying ocular wavefront information, referred to herein as an “on-line” aberration measurement method.
画像処理学により取り上げられていなかった幾つかの科学技術がある。ほとんどの分野で開発を進めることは、カメラ画像内で構造を瞬時に且つ正確に検出する能力がますます重要になるプロセスオートメーションへと典型的につながる。本明細書で以下に述べる技術は、画像内の構造の検出に関してはるかに広い用途を検出するが、本発明の実施形態が目標とする1つの領域は、人間の目の波面収差測定である。 There are several technologies that have not been addressed by image processing. Progress in most areas typically leads to process automation where the ability to detect structures quickly and accurately in camera images becomes increasingly important. Although the techniques described herein below detect a much broader application for the detection of structures in an image, one area targeted by embodiments of the present invention is wavefront aberration measurement in the human eye.
屈折矯正手術、または、目の上あるいは目の中でのコンタクトレンズの利用による視力矯正に関連する眼科学の分野は、収差計の比較的最近の進歩を体験してきた。これらの装置により、実践者は視覚特性の意義を探求でき、それが単に視力だけに限られたものではないことを理解できる。波面センサを組み込んだ収差計は、矯正の際、理論上の限界で視力を達成できるだけでなく、視覚の改善も行うことができ、場合によっては、見る条件の下でカスタマイズされた視覚でさえも改善できる視覚異常についての情報を与えることができる。 The field of ophthalmology related to refractive surgery or vision correction through the use of contact lenses on or in the eye has experienced relatively recent advances in aberrometers. With these devices, practitioners can explore the significance of visual characteristics and understand that it is not limited to visual acuity. An aberrometer incorporating a wavefront sensor can not only achieve visual acuity at the theoretical limit when correcting, but also improve vision, and even in some cases even customized vision under viewing conditions Information about visual abnormalities that can be improved can be given.
眼球波面センシングのほとんどの従来の良好に開発された形態の1つは、ハルトマンシャック原理に依存する。ハルトマンシャック波面センサは、目からCCD検出器/カメラ上へ出射する歪んだ波面の様々な部分を結像するマイクロレンズアレイを典型的に含む。マイクロレンズアレイにより生成された画像は、常軌を外れない波面からの光点画像の基準位置からわずかにずれた光の小さい点の配列を有する。常軌を外れた点の位置ずれは、目の瞳孔から出射する波面の局部的な勾配に関連する。これら位置ずれからゼルニケ多項式(または、その他の数式)を派生でき、これらを次に、目のすべての収差を実質的に特徴付けるのに用いる。正確な波面計算を行う能力は、波面画像の各点の中心位置の正しい決定に非常に依存する。波面分析処理のこの態様は、重心検出として既知である。 One of the most well-developed forms of most eyeball wavefront sensing relies on the Hartmann Shack principle. A Hartmann Shack wavefront sensor typically includes a microlens array that images various portions of the distorted wavefront exiting from the eye onto a CCD detector / camera. The image generated by the microlens array has an array of small spots of light that are slightly displaced from the reference position of the light spot image from a wavefront that does not deviate from normal. The misregistration of a point out of the normal path is related to the local gradient of the wavefront emerging from the pupil of the eye. From these misregistrations, Zernike polynomials (or other mathematical formulas) can be derived, which are then used to characterize substantially all the aberrations of the eye. The ability to perform accurate wavefront calculations is highly dependent on the correct determination of the center position of each point in the wavefront image. This aspect of the wavefront analysis process is known as centroid detection.
例えば、ハルトマンシャック波面センサ、並びに、チェルニングのようなその他の周知の種類は、短い時間間隔にわたって、重心の単一画像あるいは、良くても、ごくわずかな数の画像を典型的に測定する。しかし、目は、波面変化を急速に変える動的組織である。重心検出に必要とされる時間は、1秒当たり数画像よりも大きい繰り返し率を伴って実時間測定を妨げる主な原因であった。WASCAとして波面技術で既知のシステムは、波面の30秒レコードにつき約7Hzの繰り返し率を実演している。しかし、波面画像を最初に記録し、保存し、その後、評価しなければならない。1つの波面画像は、コンピュータメモリの約400kbを必要とする。その上、収差測定(例えば、球面、シリンダー/軸及び高次収差)をオンラインで、すなわち、波面測定及び計算とほぼ同時に表示を行うことができない。瞳孔画像及び重心画像をほぼ同時に獲得及び保存するのは不可能であり、このことは、波面の変化時に目の動きの影響を評価するのを実質的に不可能にする。これらの実例は、本発明の実施形態が扱う眼球波面測定の分野での例示的な開発の問題点の幾つかを表す。 For example, Hartmann Shack wavefront sensors, as well as other well-known types such as Cherning, typically measure a single image of the centroid or, at best, a very small number of images over a short time interval. However, the eye is a dynamic organization that changes wavefront changes rapidly. The time required for center-of-gravity detection was the main cause that hindered real-time measurement with a repetition rate greater than a few images per second. A system known in the wavefront technology as WASCA demonstrates a repetition rate of about 7 Hz per 30 second record of the wavefront. However, the wavefront image must first be recorded and saved and then evaluated. One wavefront image requires about 400 kb of computer memory. In addition, aberration measurements (eg, spherical, cylinder / axis and higher order aberrations) cannot be displayed online, ie almost simultaneously with wavefront measurements and calculations. It is impossible to acquire and store pupil images and centroid images almost simultaneously, which makes it virtually impossible to evaluate the effects of eye movements when the wavefront changes. These examples represent some of the exemplary development issues in the field of ocular wavefront measurement addressed by embodiments of the present invention.
本発明の一実施形態は、CCD画像での明暗の構造の検出を行うアルゴリズムに関する。この画像は、単に説明の目的上、重心を波面画像内に、または、特定された印をコンタクトレンズの表面上に有することができる。図3には、シミュレートしたハルトマンシャック波面画像内に黒色点として重心画像の配列32を示す。
One embodiment of the present invention relates to an algorithm for detecting light and dark structures in a CCD image. This image can have the center of gravity in the wavefront image or the identified indicia on the surface of the contact lens for illustrative purposes only. FIG. 3 shows an
この実施形態の特徴は、(800MHzのPentium(登録商標)(インテル社)プロセッサ、または、これと等価なものを用いて、)CCD画像での重心32のような構造の位置を、例えば、約5msで検出し、分類でき、ゼルニケ係数を計算でき、波面画像情報を約13ms以下で表示できる。1.6GHzのプロセッサは、約50Hzまで率を増大させることにより約2分の1だけ総使用時間を減少させる。従って、アルゴリズムは、本明細書中、約25Hzまでの率でほぼ同時に波面情報を検出し、測定し、そして、表示することを意味する波面情報の「オンライン」分析と称するものを表現する。
A feature of this embodiment is that the position of the structure, such as the center of
以下に詳細に説明する実施形態を、ハルトマンシャック波面測定及び分析に関して説明するが、これら実施形態を、その他の波面方法論、例えば、チェルニング原理に基づくもの、並びに、当該技術分野で既知のその他のものまで広範に適用できる。しかし、上述したように、具体化した本発明を、より一般的に、CCD型画像での構造を分析するための画像処理に適用できる。 The embodiments described in detail below will be described with respect to Hartmann Shack wavefront measurement and analysis, but these embodiments may be used in other wavefront methodologies, such as those based on the chelning principle, as well as other known in the art. It can be applied to a wide range of things. However, as described above, the embodied present invention can be applied to image processing for analyzing the structure of a CCD type image more generally.
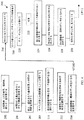
本実施形態に従って波面画像の重心を検出する方法を、図1のフローチャート図100に示す。図示した実施形態では、25Hzの率で要求通りに一連の複数の画像を獲得し、分析し、そして、表示するが、単純化のため、以下に述べるアルゴリズムステップが1つの波面画像に適用し、所望の連なりの波面画像ごとに繰り返されることを最初に言及しておく。 A method of detecting the center of gravity of a wavefront image according to this embodiment is shown in the flowchart diagram 100 of FIG. In the illustrated embodiment, a series of multiple images are acquired, analyzed, and displayed as required at a rate of 25 Hz, but for simplicity, the algorithm steps described below are applied to one wavefront image, It is first mentioned that it is repeated for each desired series of wavefront images.
図1では、ステップ102において、図2で一例として画像22が示すようにX×Y画素サイズ波面画像を獲得する。図示のように、可変画素信号強度により光点画像を表す。CCDカメラから撮られた画像は、通常、画素のアレイから成り、このアレイでは、画素に集められた電荷量に比例する数があらゆる画素に割り当てられる。この数を画素の信号と称する。次に続く図示の説明では、暗画像内の正方形格子の輝点を詳細に説明する。
In FIG. 1, in
i)画像圧縮
ステップ102において画像を獲得した後、ステップ104において、X×Y画素サイズからX/n×Y/m画素までに画像を圧縮する。例えば、画像の左上隅部から開始し、画像を通して走査して原画像のn×m画素方形の画素ごとの信号を平均化することにより、この圧縮を行うことができる。圧縮した画像の左上隅部の信号を次に、第1の方形の平均値に設定し、次の画素の信号を次の(第2の)方形の平均値に設定し、最終的に、X/n×Y/mの画素サイズの画像を生じさせる。n及びmを整数とし、X/n×Y/mも整数値とする。例示的な一実施形態では、n=m=8である。
i) Image Compression After acquiring the image in
ii)バックグランド除去
ステップ106において、圧縮した画像を次に、(上記の(i)での画素方形と混同しないように)方形領域またはタイルに分割する。その他のサイズを用いることができるが、例示的な実施形態では、1つのタイルは64×64画素平方である。典型的に、1つのタイルは、3〜5個の重心を含む場合がある。平均信号を、この場合も、タイルごとに計算する。次に、タイルの平均値を線形に外挿して、画像内のいずれかの位置に対してバックグランド値を生じさせる。次に、低い信号を生じる画像からこのバックグランドを重心の外側に除去する。図示の実施形態では、バックグランド除去により、2の信号対雑音比を10の信号対雑音比まで改善した。
ii) Background Removal In
iii)粗い構造検出
ステップ108において、概算の、または、粗い構造点(重心)を識別する。まず、最大値を、圧縮した画像の最大信号と定義する。画像を通して走査することにより最大値を決定し、この点の信号値が最大値のある百分率、例えば、30%(その他の値を使用者により選択できる)よりも大きい場合のみ、あらゆる画素のX位置、Y位置及び信号値を表に記録する。例示的な実施形態では、このことは、約400個のエントリの表(表I)を生じる。図示のように信号を降順にすることにより、この表を分類する。このことを達成するのに様々な高速分類ルーチンのいずれかを利用できる。
iii) Coarse

iv)構造の検出の絞込み
構造のあらゆる点を検出した信頼水準を増大させるため、ブロック110で示すようにステップ108を繰り返すことができる。ブロック110では、最初の繰り返しの最小値のある百分率に、新たな最小値を設定する。次の繰り返しは、信号が弱すぎて最初の繰り返しで検出できなかった点を検出する。最初の繰り返しで検出した粗い構造点に占めるので、それらが再び検出されない(すなわち、それらが、検出された点から事前設定距離よりも遠いという条件に従わない)。
iv) Refinement of
v)最終的な構造検出
ステップ112において、最終的な重心位置を決定する。画像をステップ104において早期に圧縮したので、画像に元々含まれた情報の多くを無視した。正確な重心位置を決定するため、この情報を今や用いることができる。元の圧縮されていない画像を用いて、あらゆる粗い点を囲むように一連の、例えば、15×15画素を生成する。一般に、各方形が1つだけの重点を含むことを確実にするため、各方形は2×最小距離よりも小さく、重点自体よりも大きい。例示的な実施形態では、この値は、5〜30画素の範囲内にある。次に、方形内部の信号分布に対して信号の質量中心を決定して、重心のほぼ正確な位置を生じさせる。
v) Final structure detection In
この実施形態の一態様では、更なる正確な結果を決定するため、例えば、1,2,3...n回、ステップ112を繰り返すことができる。前のステップで計算された質量中心をその次に用いる。また、ステップ112において、画素を囲む方形が使用者設定の距離だけ進んで移動されていれば、質量中心の位置がどれくらい変化したかに応じて品質係数を各構造点に割り当てることができる。例示的な一実施形態では、この距離は5画素である。最も少ない変化をした位置を有する点に、最も高い品質係数を割り当てる。このように、低い品質係数を割り当てられた誤りの点または雑音を、それらが偽の構造点に相当する可能性があるので削減できる。
In one aspect of this embodiment, for example, 1, 2, 3,. . . Step 112 can be repeated n times. The center of mass calculated in the previous step is used next. In
ハルトマンシャック波面センシングに関する図示の実施形態では、重心と、マイクロレンズアレイの対応の画像形成小型レンズとを相互に関連付けできるのが望ましい。従って、図4に示すような実施形態の態様200は、検出した重心を分類して、これら重心を、正方形格子パターンに割り当てる処理に関する。アルゴリズムを、例えば、環状体上の点、または、点の何らかの直線のようなその他の構造または形状に容易に適用できることは、当業者に認識されるであろう。
In the illustrated embodiment for Hartmann Shack wavefront sensing, it is desirable to be able to correlate the center of gravity and the corresponding imaging lenslet of the microlens array. Therefore, the
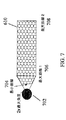
ステップ202において、所望の分類形状を選択する。例示的な実施形態では、この形状は、マイクロレンズアレイの幾何学的形状に基づく方形格子である。ステップ204に示すように、前に検出された重心点iを含み、1の勾配(45°)を有する直線の公式を重心点iごとに計算する。画像の左上隅部または右下隅部の開始位置に対して、0.1〜0.9の範囲内の勾配値を用いることができる。同様に、開始位置が画像の右上隅部または左下隅部であれば、−0.1から−0.9までの勾配値を選択できる。ステップ206において、図示の実施形態では、線514と、画像510の左上隅部506との間の、図5に示すような距離502(ni)を計算する。次に、最も小さいni値を有する重心から開始するステップ208において、すべての重心iをniにより分類する。ステップ210において、最も小さいni値を有する重心を行1に割り当て、行1の最後の重点としてメモリ内に記憶する。この実施形態の一態様では、ステップ210中、既存の行の最後の重心をメモリ内に記憶する。ステップ212において、例示的な一実施形態では、次の重心に対する検索領域610を示す図6に表すように、小型レンズアレイのパラメータにより制御及び変更できる大きさを有し、選択した格子形状を検出するのに適した形状を有する範囲を所定の行の最後の重心605の右に有する領域610を規定する。その他の格子形状を検出するのに適するいずれかの形状も可能である。小型レンズアレイのパラメータの例には、図7に示すように最大角度702、最小距離704、最大距離1(706)及び最大距離2(708)が含まれる。次に、ステップ214において、次に高いni値を選択し、すべての既存の行に関して、重心が規定の領域に存在するかどうか、重心を検査する。存在すれば、次に、ステップ216において、重心を、この行の最後の重心として割り当てる。存在しなければ、重心を、新たな行の最後の重心として割り当てる。すべての重心について、これからステップ214〜216を繰り返す。このように、左から右へ構築するように行が出発する。ステップ220において、各行に対する平均y位置を計算し、これら行を平均y位置に従って分類する。このステップは、一番上の行を行1とし、次の行を行2とするなどの印付けを容易にする。
In
列を分類するステップを説明する前に、図8に示すような線802,804に沿って位置するかすかに見える点で示すような状態が生じる場合があること、すなわち、重点の劣った品質のため、行の中央で幾つかの重点812,814が検出されず、左右の重点が、異なる行に割り当てられたことを指摘することは有益である。この事象では、選択的なステップ222は、これら行を統合することを含む。このことを、下記のサブステップにより達成する。すなわち、(行1と行2との間の距離を生じる)yrow1−yrow2、(行2と行3との間の距離を生じる)yrow2−yrow3などの減算を行い、次に、獲得した距離の平均値をとることにより、ステップ214からの各行の平均y位置から行間の平均距離を計算する。例示的な実施形態では、行j及びkを統合する基準は、yj−yk<f×a、且つ、Pk,first>Pj,lastまたはPk,last<Pj,firstであるかであり、ここで、fは、使用者により設定される約0.1〜0.7の範囲内にある可変パラメータである。例示的な実施形態では、0.3〜0.5の範囲内にある値を用いる。aは、行間の平均距離であり(上記を参照)、Pk,firstはk行の最初の(一番左の)重心のx値であり、Pk,lastはk行の最後の(一番右の)重心のx値である。言い換えれば、行が、y位置で通常よりもずっと近ければ、そして、行が重複しなければ、すなわち、行jが行kの完全に右にあるか、あるいは、完全に左にあれば、行を統合する。
Before describing the step of classifying the columns, there may be a situation as shown by the faintly visible points located along
ステップ224において、列を分類する処理が始まる。ここでは、ステップ208からの距離値により分類した重心のリストを再び用いる。最も小さいniの重心を列1に割り当て、列1の最後の重心としてメモリ内に記憶する。例示的な一態様では、ステップ224中、既存の列の最後の重心を常に、メモリ内に記憶する。ステップ226において、例示的な実施形態では、上記で記載したように小型レンズアレイの同一パラメータにより制御及び変更される大きさ及び形状を有する範囲を所定の列の最後の重心よりも下位に有する領域を規定する。このことは、図6の線図を90度だけ下方へ傾けることにより図解される。ステップ228において、次に高いni値を選択し、すべての既存の列に関して、重心が規定の領域に存在するかどうか、重心を検査する。存在すれば、ステップ230において、重心を、この列の最後の重心として割り当てる。存在しなければ、重心を、新たな列の最後の重心として割り当てる。すべての重心について、これからステップ228〜230を繰り返す。このように、上から下へ構築するように列が出発する。ステップ234において、各列に対する平均x位置を計算し、これら列をそれらの平均x位置に従って分類する。このステップは、一番左の列を列1とし、次の列を列2とするなどの印付けを容易にする。
In
重点の劣った品質のため、列の中央で幾つかの重点が検出されず、従って、上下の重点が、異なる列に割り当てられた図8に関連して上述したような状態が生じる場合がある。この事象では、選択的なステップ236は、これら列を統合することを含む。このことを、下記のサブステップにより達成する。すなわち、(列1と列2との間の距離を生じる)xcolumn1−xcolumn2、(列2と列3との間の距離を生じる)xcolumn2−xcolumn3などの減算を行い、次に、獲得した距離の平均値をとることにより、ステップ228からの各列の平均x位置から列間の平均距離を計算する。例示的な実施形態では、列j及びkを統合する基準は、xj−xk<f×a、且つ、Pk,first>Pj,lastまたはPk,last<Pj,firstであるかであり、ここで、fは、使用者により設定される約0.1〜0.7の範囲内にある可変パラメータである。例示的な実施形態では、0.3〜0.5の範囲内にある値を用いる。aは、列間の平均距離であり、Pk,firstはk列の最初の(一番上の)重心のy値であり、Pk,lastはk列の最後の(一番下の)重心のy値である。言い換えれば、列が、x位置で通常よりもずっと近ければ、そして、列が重複しなければ、すなわち、列jが列kの完全に下にあるか、あるいは、完全に上にあれば、列を統合する。
Due to inferior quality, some emphasis is not detected in the middle of the column, so the situation as described above in connection with FIG. 8 may occur where the upper and lower emphasis are assigned to different columns. . In this event,
分類した重心位置からゼルニケ計算を行って波面収差を決定できる。図示の実施形態によれば、1つの画像を獲得し、波面収差情報を表示するのに800MHzのPentium(登録商標)(ペンティアム(登録商標))プロセッサを用いる処理を、対応の処理時間と共に以下で一覧表にする。 Wavefront aberration can be determined by performing Zernike calculation from the classified barycentric position. According to the illustrated embodiment, a process using an 800 MHz Pentium® (Pentium®) processor to acquire one image and display wavefront aberration information, along with the corresponding processing time, is described below. Make a list.
重心の検出及び分類: 〜5ms
ゼルニケ計算の実行: 〜5ms
結像動作: 〜8ms
画像表示: 〜8ms
瞳孔座標位置(任意): 〜6−8ms
コンタクトレンズ位置(任意): 〜5ms
実施形態の図示の一態様では、測定周期中、ゼルニケ計算処理を2度、すなわち、2次項に対して1度、そして、高次項に対して1度実行する。1つの画像当たりの総使用時間は、25Hzの繰り返し率で約40msまたはそれよりもわずかに少ない。これと対照的に、(オンラインに対立するものとして)従来の実時間波面分析は、一連の画像を記憶し、その後、波面情報について画像を分析することから成る。これら技術はコンピュータ記憶要件により制限されている。例えば、2つの画像を25Hzで30秒間記憶することは、1回の測定当たり約400MBを必要とする。一方、図示の実施形態によれば、これら画像に含まれる情報が、重心及び瞳孔位置を検出することにより既に取り出されているので、画像の記憶は必要ない。瞳孔及び重心位置データのみを記憶することは、25Hzでの20秒測定について、約700kbだけのメモリのデータ記憶要件につながり、このことは、500個の画像を生じる。
Center of gravity detection and classification: ~ 5ms
Perform Zernike calculation: ~ 5ms
Imaging operation: ~ 8ms
Image display: ~ 8ms
Pupil coordinate position (arbitrary): ~ 6-8ms
Contact lens position (optional): ~ 5ms
In one aspect of the illustrated embodiment, the Zernike calculation process is performed twice during the measurement period, that is, once for the second order term and once for the higher order term. The total usage time per image is about 40 ms or slightly less at a repetition rate of 25 Hz. In contrast, conventional real-time wavefront analysis (as opposed to online) consists of storing a series of images and then analyzing the images for wavefront information. These techniques are limited by computer storage requirements. For example, storing two images at 25 Hz for 30 seconds requires about 400 MB per measurement. On the other hand, according to the illustrated embodiment, since the information included in these images has already been extracted by detecting the center of gravity and the pupil position, it is not necessary to store the images. Storing only pupil and centroid position data leads to a data storage requirement of only about 700 kb for a 20 second measurement at 25 Hz, which results in 500 images.
本発明のもう1つの実施形態は、上述したアルゴリズムを遂行する実行可能な命令が記憶された装置可読媒体に関する。適切な媒体は周知であり、制限なく、CD、DVD、ディスケット、ハードドライブ、搬送波及びその他を含む。 Another embodiment of the invention relates to a device readable medium having stored thereon executable instructions for performing the algorithm described above. Suitable media are well known and include, without limitation, CDs, DVDs, diskettes, hard drives, carrier waves and others.
本発明のもう1つの実施形態は、波面を分析する方法に関する。この方法を図9のブロック図に記述する。この方法は、ステップ902において、目の瞳孔から出射した光の複数の波面画像を獲得することを有する。ここでは、各画像は、位置がずれた重心を含み、この重心は目の波面測定情報を示す。ステップ904において、選択した収差次数に対する波面測定情報をオンラインで計算し、表示する。上記で、説明を通じて使用したように、「オンライン」とは、ほぼ同時に波面測定情報を測定し、分析し、そして、表示することを意味する。前の実施形態で記述した例示的な高速アルゴリズムは、オンライン処理を容易にするほんの一方法である。当業者は、その他のアルゴリズムを開発でき、または、今や利用できること、また、オンライン技術を容易にすることを理解するであろう。
Another embodiment of the invention relates to a method for analyzing a wavefront. This method is described in the block diagram of FIG. The method includes obtaining a plurality of wavefront images of light emitted from the pupil of the eye at
この実施形態の一態様では、10Hzに等しいか、あるいは、それよりも大きい率で画像を獲得する。例示的な一態様では、画像を25Hzの率で獲得する。しかし、コンピュータプロセッサ速度は、画像獲得率における限定要因である。もう1つの態様では、少なくとも50個の一連の画像を獲得する。もう1つの態様では、選択した収差次数に対する波面測定情報をオンラインで計算し、表示するステップ906を、選択した瞳孔の直径について実行する。言い換えれば、測定前に瞳孔の直径値を選択しなければ、表示を2次収差(球面、または、球面と等価なもの、並びに、シリンダー/軸)に限定する。その理由は、2次収差が瞳孔の直径に独立するためである。しかし、得られた波面情報を、ほぼ一定の瞳孔の直径について、または、瞳孔の直径で制御される偏差について解釈することを確実にしてもよい。一方、オンラインで表示すべき所定の直径に対して、いかなるゼルニケ次数(例えば、コマ収差、球面収差、高次収差)をも可能にするため、測定前に瞳孔の直径値を選択できる。瞳孔の直径の例示的な範囲は、約2mm〜10mmの範囲内である。
In one aspect of this embodiment, images are acquired at a rate equal to or greater than 10 Hz. In one exemplary aspect, images are acquired at a rate of 25 Hz. However, computer processor speed is a limiting factor in the image acquisition rate. In another aspect, a series of at least 50 images are acquired. In another aspect, the
例示的な一実施形態では、20秒の時間間隔にわたって25Hzの繰り返し率で、500個の画像を獲得できる(従って、500回測定を行うことができる)。瞳孔の直径D<Dminについて最初の125個の画像を獲得し、Dmin≦D≦Dmaxについて次の250個の画像を獲得し、Dmax<Dについて残りの125個の画像を獲得できる。ステップ908において記述するように、一連の250個の画像を用いて、Z2xx〜Z10xxに対するゼルニケ振幅を計算できる。所望に応じて、ステップ910において、選択したゼルニケ次数の平均値を計算し、オンラインで表示できる。平均値を計算したならば、ステップ912において、周知の統計技術を用いて、標準偏差を決定でき、平均波面測定値に対する誤差帯域を発生する。この実施形態の一態様では、異常な波面情報を含むブリンキング期間を決定し、これらブリンキング期間中の情報を廃棄できる。同様に、コンタクトレンズ位置を測定したならば、例えば、レンズ定着が短時間で起こる時、ブリンキング期間中の測定を削減するのに有利である。瞳孔の直径に基づく特定の収差次数について最も頻繁に起こる波面振幅の値を知ることにより、実践者は、患者にとって最適な視覚をもたらす治療または視力矯正を定めることができる。
In one exemplary embodiment, 500 images can be acquired at a repetition rate of 25 Hz over a 20 second time interval (and thus 500 measurements can be taken). The first 125 images can be acquired for pupil diameter D <D min , the next 250 images can be acquired for D min ≦ D ≦ D max , and the remaining 125 images can be acquired for D max <D. . As described in step 908, a series of 250 images can be used to calculate Zernike amplitudes for Z 2xx to Z 10xx . If desired, at
この実施形態による関連の一態様では、ステップ914において、波面画像に対応する一連の瞳孔画像をも獲得できる。これら画像を同時に保存できるので、波面の変化時に目の運動の影響を評価できる。
In a related aspect according to this embodiment, in
本発明のもう1つの実施形態は、図10でブロック図により示す波面測定装置1000に関する。この装置は、小さな光点を目1020の網膜上に供給する照明部品1010と、網膜から散乱され、目の瞳孔から出射した照明光の重点画像を形成する撮像部品1030と、重心画像を獲得するのに適合された検出器1040と、重心の位置ずれ計算を実行して波面測定情報を決定するように検出器と協働するプロセッサ1050と、選択した波面測定情報を表示するため、プロセッサに動作可能に接続された表示部品1060と、選択した波面測定情報のオンライン計算及び表示を指示する手段1070とを含む。選択的な瞳孔カメラ1080及び瞳孔計1090をも示す。ここでは、部品1015は、ビームスプリッタ、または、これと光学上等価なものである。
Another embodiment of the present invention relates to the
Claims (37)
b)選択した収差次数に対する該波面測定情報をオンラインで計算し、表示することと
を包含する、波面分析の方法。 a) acquiring a plurality of wavefront images of light emitted from the pupil of each eye, each image including a misaligned center of gravity indicating the wavefront measurement information of the eye;
b) calculating and displaying the wavefront measurement information for the selected aberration order online and displaying the method.
各瞳孔画像の瞳孔の位置データと、寸法データと、形状データと、幾何学的特徴付けデータとの少なくとも1つを決定することと、
該瞳孔画像と、対応の瞳孔画像データとのうちの少なくとも1つをオンラインで表示することと
を包含する、請求項1〜9のいずれか一項に記載の方法。 Acquiring eye pupil images corresponding to each wavefront image;
Determining at least one of pupil position data, dimension data, shape data, and geometric characterization data for each pupil image;
10. A method according to any one of the preceding claims comprising displaying at least one of the pupil image and corresponding pupil image data online.
a)可変画素信号強度により表されたX×Yサイズ画像を取得することと、
b)該X×Yサイズ画像をX/n×Y/mサイズ画像に圧縮することであって、n、mは、任意の整数に等しく、X/n,Y/mが整数値である、ことと、
c)該圧縮した画像の任意の位置に対するバックグランド強度を決定し、該圧縮した画像から該バックグランドを除去することと、
d)該バックグランドを除去した圧縮画像における近似的に位置付けられた複数の重心を検出することと、
e)所望の複数の重心の近似位置を検出するまで、ステップ(d)を繰り返すことと、
f)該所望の複数の重心の近似位置を該X×Yサイズ画像における正確な位置に変換することと
を包含し、該画像における全ての重心位置が識別される、アルゴリズム。 An algorithm for detecting the center of gravity of an image,
a) obtaining an X × Y size image represented by variable pixel signal strength;
b) compressing the X × Y size image into an X / n × Y / m size image, where n and m are equal to arbitrary integers, and X / n and Y / m are integer values; And
c) determining a background intensity for an arbitrary position of the compressed image and removing the background from the compressed image;
d) detecting a plurality of approximately positioned centroids in the compressed image with the background removed;
e) repeating step (d) until an approximate position of the desired plurality of centroids is detected;
f) converting the approximate positions of the desired plurality of centroids to exact positions in the X × Y size image, wherein all centroid positions in the image are identified.
a)原画像の第1の所定領域から出発し、該画像を通して走査し、n×m方形の各画素に対する信号を平均化し、該圧縮した画像における対応の第1の所定領域の信号レベルを該第1の所定領域の平均値に設定することと、
b)X/n×Y/m画像サイズが得られるまで、第2およびその後の所定領域に対してステップ(a)を繰り返すことと
を包含する、請求項15〜23のいずれか一項に記載のアルゴリズム。 Compressing the X × Y size image into an X / n × Y / m size image,
a) Starting from the first predetermined area of the original image, scanning through the image, averaging the signal for each pixel of the n × m square, and calculating the signal level of the corresponding first predetermined area in the compressed image Setting an average value of the first predetermined area;
b) repeating step (a) for the second and subsequent predetermined regions until an X / n × Y / m image size is obtained. Algorithm.
前記圧縮した画像を、各々が複数の重心を含む複数の画像セグメントに分割することと、各画像セグメントに対して平均信号値を決定することと、各画像セグメントに対する平均値を外挿することによって前記バックグランド強度レベルを決定することとを包含する、アルゴリズム請求項15〜26のいずれか一項に記載のアルゴリズム。 Step (c)
Dividing the compressed image into a plurality of image segments each including a plurality of centroids, determining an average signal value for each image segment, and extrapolating the average value for each image segment 27. An algorithm according to any one of claims 15 to 26, comprising determining the background intensity level.
a)前記画像の最大信号値を決定することと、
b)しきい値を最大値の所定百分率として設定することと、
c)該しきい値よりも大きい信号強度を有する各画素のX位置と、Y位置と、信号強度とを決定することと、
d)ステップ(c)からの値を信号強度の降順に分類することと、
e)最大信号強度を、第1の近似的に位置付けられた重点として割り当てることと、
f)事前設定の条件に従う全分類した値を、近似的に位置付けられた重心として規定するために、該事前設定の条件を選択することと
を包含する、請求項15〜29のいずれか一項に記載のアルゴリズム。 Step (d) is
a) determining a maximum signal value of the image;
b) setting the threshold as a predetermined percentage of the maximum value;
c) determining the X position, Y position, and signal strength of each pixel having a signal strength greater than the threshold;
d) classifying the values from step (c) in descending order of signal strength;
e) assigning the maximum signal strength as the first approximately positioned emphasis;
f) selecting the preset condition to define all classified values according to the preset condition as approximately positioned centroids, 30. Algorithm described in.
原画像の前記所望の複数の重心の全ての近似位置を囲む境界構造を規定することと、
該境界内部の信号分布に対して信号の質量中心を決定することと
を包含する、請求項15〜32のいずれか一項に記載のアルゴリズム。 Step (f)
Defining a boundary structure surrounding all approximate positions of the desired plurality of centroids of the original image;
33. An algorithm according to any one of claims 15 to 32, comprising determining a center of mass of a signal for a signal distribution within the boundary.
b)該線と前記画像の基準位置との間の距離niを計算することと、
c)最も小さいni値からniを開始することによって全重点inを分類することと、
d)該最も小さいniを有する重心を第1行に割り当て、該重心を該第1行の最後の重点として記憶することと、
e)撮像部品パラメータにより可変制御できる大きさと、選択した格子構造を検出するのに適した形状とを有する範囲として、所定の行の最後の重心の右に領域を規定することと、
f)次のni値を取得し、全ての既存の行に対して重心が該領域内にあるかを決定することと、
g)該重心が該領域内にある場合では、該重心を該所定の行の最後の重心として割り当てること、または、該重心が該領域外にある場合では、該重心を新たな行の最後の重心として割り当てることと、
h)ステップ(f〜g)をすべての重心に対して繰り返すことと、
i)各行に対して平均y位置を計算し、該行を該平均y位置に従って分類し、一番上の行を行1と、次の行を行2と特定し、行nまで特定することと、
j)該最も小さいniを有する重心を第1列に割り当て、該重心を該第1列の最後の重点として記憶することと、
k)該撮像部品パラメータにより可変制御できる大きさと、該選択した格子構造を検出するのに適した形状とを有する範囲として、所定の列の最後の重心の下に領域を規定することと、
l)次のni値を取得し、全ての既存の列に対して該重心が該領域内にあるか決定することと、
m)該重心が該領域内にある場合では、該重心を該所定の列の最後の重心として割り当てること、または、該重心が該領域外にある場合では、該重心を新たな列の最後の重心として割り当てることと、
n)ステップ(l〜m)をすべての重心に対して繰り返すことと、
o)各列に対して平均x位置を計算し、該列を該平均x位置に従って分類し、最初の列を列1と、次の列を列2と特定し、列nまで特定することと
を包含する、請求項20に記載のアルゴリズム。 a) Compute a straight line formula for each centroid i that includes the classified centroid point i and has a slope that is between values less than about -0.1 or greater than about 0.1. And
and calculating the distance n i between the reference position of b)該線with the image,
c) classifying the full weight i n by starting n i from the smallest n i value;
d) assign the centroid with outermost is small n i in the first row, and storing the heavy hearts as the last priority of the first row,
e) defining a region to the right of the last centroid of a given row as a range having a size that can be variably controlled by imaging component parameters and a shape suitable for detecting the selected grid structure;
f) obtaining the next n i value and determining if the centroid is within the region for all existing rows;
g) if the centroid is within the region, assign the centroid as the last centroid of the given row, or if the centroid is outside the region, assign the centroid to the end of the new row Assigning it as the center of gravity,
h) repeating steps (f to g) for all centroids;
i) Calculate the average y position for each row, classify the rows according to the average y position, identify the top row as row 1 and the next row as row 2 and up to row n When,
j) Assign the centroid with outermost is small n i in the first column, and storing the heavy hearts as the last priority of the first row,
k) defining an area under the last centroid of a given column as a range having a size that can be variably controlled by the imaging component parameters and a shape suitable for detecting the selected grid structure;
l) obtaining the next n i values and determining for all existing columns that the centroid is within the region;
m) if the centroid is within the region, assign the centroid as the last centroid of the given column, or if the centroid is outside the region, assign the centroid to the last of the new column Assigning it as the center of gravity,
n) repeating steps (l-m) for all centroids;
o) calculating an average x position for each column, classifying the columns according to the average x position, identifying the first column as column 1, the next column as column 2, and identifying up to column n; The algorithm of claim 20, comprising:
該網膜から散乱され、目の瞳孔から出射した照明光の重心画像を形成可能な撮像部品と、
該重心画像を取得するように適合された検出器と、
重心の位置ずれ計算を実行して波面測定情報を決定できるように該検出器と動作可能に接続されたプロセッサと、
該選択した波面測定情報が表示可能なように該プロセッサに動作可能に接続された表示部品と、
該選択した波面測定情報のオンライン計算および表示を命令する手段と
を備える、波面測定装置。 An illumination component adapted to provide a small spot of light on the retina;
An imaging component capable of forming a center of gravity image of illumination light scattered from the retina and emitted from the pupil of the eye;
A detector adapted to acquire the centroid image;
A processor operably connected to the detector so as to perform a center of gravity displacement calculation to determine wavefront measurement information;
A display component operatively connected to the processor so that the selected wavefront measurement information can be displayed;
Means for instructing on-line calculation and display of the selected wavefront measurement information.
Applications Claiming Priority (2)
| Application Number | Priority Date | Filing Date | Title |
|---|---|---|---|
| DE10333813A DE10333813A1 (en) | 2003-07-24 | 2003-07-24 | Online wavefront measurement and display |
| PCT/EP2004/008205 WO2005015495A2 (en) | 2003-07-24 | 2004-07-22 | Online wavefront measurement and display |
Publications (2)
| Publication Number | Publication Date |
|---|---|
| JP2006528499A true JP2006528499A (en) | 2006-12-21 |
| JP2006528499A5 JP2006528499A5 (en) | 2007-09-13 |
Family
ID=34071891
Family Applications (1)
| Application Number | Title | Priority Date | Filing Date |
|---|---|---|---|
| JP2006520794A Pending JP2006528499A (en) | 2003-07-24 | 2004-07-22 | Online wavefront measurement and display |
Country Status (11)
| Country | Link |
|---|---|
| US (1) | US7708411B2 (en) |
| EP (1) | EP1658587B1 (en) |
| JP (1) | JP2006528499A (en) |
| KR (1) | KR20060080578A (en) |
| CN (1) | CN1856803A (en) |
| AU (1) | AU2004263957B2 (en) |
| CA (1) | CA2539944A1 (en) |
| DE (1) | DE10333813A1 (en) |
| ES (1) | ES2689935T3 (en) |
| SG (1) | SG145707A1 (en) |
| WO (1) | WO2005015495A2 (en) |
Families Citing this family (11)
| Publication number | Priority date | Publication date | Assignee | Title |
|---|---|---|---|---|
| DE10333794A1 (en) | 2003-07-24 | 2005-03-03 | Technovision Gmbh | Method and device for online contact lens evaluation |
| US7789513B2 (en) | 2007-04-20 | 2010-09-07 | Alcon Refractivehorizons, Inc. | Adaptive wavefront modulation system and method for refractive laser surgery |
| CN101055223B (en) * | 2007-04-26 | 2010-12-08 | 中国科学院光电技术研究所 | Hartman wavefront sensor mass center measurement precision optimization method |
| US8740381B2 (en) * | 2007-06-27 | 2014-06-03 | Bausch & Lomb Incorporated | Method and apparatus for extrapolating diagnostic data |
| DE102008014294A1 (en) * | 2008-03-14 | 2009-09-17 | Bausch & Lomb Inc. | Fast algorithm for wavefront data stream |
| US8254724B2 (en) * | 2008-11-06 | 2012-08-28 | Bausch & Lomb Incorporated | Method and apparatus for making and processing aberration measurements |
| US9504376B2 (en) * | 2009-12-22 | 2016-11-29 | Amo Wavefront Sciences, Llc | Optical diagnosis using measurement sequence |
| CN104103078A (en) * | 2014-07-31 | 2014-10-15 | 中国航天科工集团第三研究院第八三五七研究所 | Helical symmetry center detection method |
| CN104955148B (en) * | 2014-12-09 | 2019-03-19 | 文春明 | A kind of wireless sensor network positioning method using electromagnetic wave symmetric propagation properties |
| US9782064B1 (en) | 2016-04-08 | 2017-10-10 | Clarity Medical Systems, Inc. | Obtaining and displaying histogram and/or confidence of intra-operative refraction and/or IOL power recommendation |
| CN106530278B (en) * | 2016-10-14 | 2020-01-07 | 中国科学院光电技术研究所 | Point light spot detection and background noise characteristic estimation method for point source Hartmann wavefront detector |
Family Cites Families (5)
| Publication number | Priority date | Publication date | Assignee | Title |
|---|---|---|---|---|
| DE4222395A1 (en) | 1992-07-08 | 1994-01-13 | Amtech Ges Fuer Angewandte Mic | Optical system for measuring refraction of eye with light source - has variable imaging optics adjustable in its power of refraction focussing light emanating from light source on retina of eye |
| US5777719A (en) * | 1996-12-23 | 1998-07-07 | University Of Rochester | Method and apparatus for improving vision and the resolution of retinal images |
| FR2788597B1 (en) | 1999-01-15 | 2001-02-23 | Imagine Optic Sarl | HIGH DYNAMIC WAVEFRONT ANALYSIS METHOD AND DEVICE |
| US6234631B1 (en) * | 2000-03-09 | 2001-05-22 | Lasersight Technologies, Inc. | Combination advanced corneal topography/wave front aberration measurement |
| DE10154194A1 (en) | 2001-11-07 | 2003-05-22 | Asclepion Meditec Ag | Method and device for measuring the dynamic behavior of an optical system |
-
2003
- 2003-07-24 DE DE10333813A patent/DE10333813A1/en not_active Withdrawn
-
2004
- 2004-07-22 WO PCT/EP2004/008205 patent/WO2005015495A2/en active Application Filing
- 2004-07-22 SG SG200805750-7A patent/SG145707A1/en unknown
- 2004-07-22 JP JP2006520794A patent/JP2006528499A/en active Pending
- 2004-07-22 AU AU2004263957A patent/AU2004263957B2/en not_active Ceased
- 2004-07-22 CN CNA2004800274699A patent/CN1856803A/en active Pending
- 2004-07-22 CA CA002539944A patent/CA2539944A1/en not_active Abandoned
- 2004-07-22 US US10/565,703 patent/US7708411B2/en active Active
- 2004-07-22 EP EP04763406.8A patent/EP1658587B1/en active Active
- 2004-07-22 KR KR1020067001479A patent/KR20060080578A/en not_active Application Discontinuation
- 2004-07-22 ES ES04763406.8T patent/ES2689935T3/en active Active
Non-Patent Citations (3)
| Title |
|---|
| JPN6010028873, Thomas NIRMAIER, "Hartmann−Shack sensor ASIC’s for real−time adaptive optics in biomedical physics", The 6th Multiconference on Systemics, Cybernetics and Informatics, 2002, vol. 13, pp. 280−284 * |
| JPN6010028875, Dirk Droste, "An ASIC for Hartmann−Shack Wavefront Detection", IEEE JOURNAL OF SOLID−STATE CIRCUITS, 200202, VOL. 37, NO. 2, pp. 173−182 * |
| JPN6010028878, Junzhong Liang, "Objective measurement of wave aberrations of the human eye with the use of a Hartmann−Shack wave−fro", J. Opt. Soc. Am. A, 1994, Vol. 11, No. 7, pp. 1949−1957 * |
Also Published As
| Publication number | Publication date |
|---|---|
| EP1658587B1 (en) | 2018-09-19 |
| ES2689935T3 (en) | 2018-11-16 |
| US7708411B2 (en) | 2010-05-04 |
| CA2539944A1 (en) | 2005-02-17 |
| AU2004263957A1 (en) | 2005-02-17 |
| DE10333813A1 (en) | 2005-02-17 |
| EP1658587A2 (en) | 2006-05-24 |
| WO2005015495A3 (en) | 2005-12-22 |
| WO2005015495A2 (en) | 2005-02-17 |
| CN1856803A (en) | 2006-11-01 |
| US20070008491A1 (en) | 2007-01-11 |
| AU2004263957B2 (en) | 2010-05-13 |
| SG145707A1 (en) | 2008-09-29 |
| KR20060080578A (en) | 2006-07-10 |
Similar Documents
| Publication | Publication Date | Title |
|---|---|---|
| JP4691030B2 (en) | Method and apparatus for online contact lens evaluation | |
| JP4767570B2 (en) | Corneal shape analysis system | |
| US9645413B2 (en) | Line of sight detection device, display method, line of sight detection device calibration method, spectacle lens design method, spectacle lens selection method, spectacle lens manufacturing method, printed matter, spectacle lens sales method, optical device, line of sight information detection method, optical instrument design method, optical instrument, optical instrument selection method, and optical instrument production method | |
| JP2006528499A (en) | Online wavefront measurement and display | |
| JP3453911B2 (en) | Gaze recognition device | |
| CN111462156A (en) | Image processing method for acquiring corneal vertex | |
| CN115590462A (en) | Vision detection method and device based on camera | |
| EP0846439B1 (en) | A method for analyzing a stereoscopic image of a fundus, and an apparatus for executing that method | |
| JP2006528499A5 (en) | ||
| CN114980800B (en) | Refractive pattern generation method, device and computer readable storage medium | |
| KR100865275B1 (en) | Method for photographing image of tongue | |
| Alonso-Caneiro et al. | Estimating corneal surface topography in videokeratoscopy in the presence of strong signal interference | |
| CN103099622B (en) | A kind of body steadiness evaluation methodology based on image | |
| CN113012112A (en) | Evaluation method and system for thrombus detection | |
| US20190290183A1 (en) | Recovery evaluation apparatus and non-transitory computer readable medium | |
| EP4185184A1 (en) | Method for determining a coronal position of an eye relative to the head | |
| JP2022548110A (en) | Methods for Assessing Tear Film Stability | |
| KR100620807B1 (en) | High-resolution wavefront measurement method | |
| JP2022548111A (en) | Apparatus and method for detecting tear breakup | |
| WO2023148372A1 (en) | A computer-implemented systems and methods for interactively measuring either or both sides of the interval of clear vision of the eye | |
| JP2003126040A (en) | Apparatus for evaluating compatibility of contact lens and method for evaluating compatibility | |
| CN115904061A (en) | Gaze deficit compensation | |
| CN116725478A (en) | Analysis method of fundus refractive power and topography generation method | |
| JPH08280621A (en) | Cornea shape measuring apparatus |
Legal Events
| Date | Code | Title | Description |
|---|---|---|---|
| RD02 | Notification of acceptance of power of attorney |
Free format text: JAPANESE INTERMEDIATE CODE: A7422 Effective date: 20070625 |
|
| RD04 | Notification of resignation of power of attorney |
Free format text: JAPANESE INTERMEDIATE CODE: A7424 Effective date: 20070626 |
|
| A521 | Written amendment |
Free format text: JAPANESE INTERMEDIATE CODE: A523 Effective date: 20070720 |
|
| A621 | Written request for application examination |
Free format text: JAPANESE INTERMEDIATE CODE: A621 Effective date: 20070720 |
|
| A131 | Notification of reasons for refusal |
Free format text: JAPANESE INTERMEDIATE CODE: A131 Effective date: 20100525 |
|
| A601 | Written request for extension of time |
Free format text: JAPANESE INTERMEDIATE CODE: A601 Effective date: 20100825 |
|
| A602 | Written permission of extension of time |
Free format text: JAPANESE INTERMEDIATE CODE: A602 Effective date: 20100901 |
|
| A521 | Written amendment |
Free format text: JAPANESE INTERMEDIATE CODE: A523 Effective date: 20100927 |
|
| A131 | Notification of reasons for refusal |
Free format text: JAPANESE INTERMEDIATE CODE: A131 Effective date: 20110308 |
|
| A02 | Decision of refusal |
Free format text: JAPANESE INTERMEDIATE CODE: A02 Effective date: 20110802 |