JP2006023178A - 3-dimensional measuring method and device - Google Patents
3-dimensional measuring method and device Download PDFInfo
- Publication number
- JP2006023178A JP2006023178A JP2004201181A JP2004201181A JP2006023178A JP 2006023178 A JP2006023178 A JP 2006023178A JP 2004201181 A JP2004201181 A JP 2004201181A JP 2004201181 A JP2004201181 A JP 2004201181A JP 2006023178 A JP2006023178 A JP 2006023178A
- Authority
- JP
- Japan
- Prior art keywords
- region
- phase
- value
- phase value
- pixel
- Prior art date
- Legal status (The legal status is an assumption and is not a legal conclusion. Google has not performed a legal analysis and makes no representation as to the accuracy of the status listed.)
- Pending
Links
Images


Landscapes
- Length Measuring Devices By Optical Means (AREA)
Abstract
Description
本発明は、位相シフト法による3次元計測方法とその装置に関する。 The present invention relates to a three-dimensional measurement method and apparatus using a phase shift method.
物体の3次元形状を非接触で計測する手法として、位相シフト法を用いた格子パターン投影法が良く用いられる。具体的には、照度分布が正弦波状の格子パターンを物体に投影し、変形格子画像を得る。そして、格子パターンを横ずらしして、位相が異なる複数枚の画像を得る。得られた複数枚の画像より各画素毎に、その点での格子の位相値を求めて、位相接続処理などを用いて測定対象物の形状を算出する技術である。 As a technique for measuring the three-dimensional shape of an object in a non-contact manner, a lattice pattern projection method using a phase shift method is often used. Specifically, a lattice pattern having an illuminance distribution having a sine wave shape is projected onto an object to obtain a modified lattice image. Then, the lattice pattern is shifted laterally to obtain a plurality of images having different phases. This is a technique for obtaining a phase value of a lattice at each point for each pixel from a plurality of obtained images and calculating a shape of a measurement object using a phase connection process or the like.
従来の3次元形状計測方法としては、特許文献1の技術が有り、この技術においては、色成分を持つ格子パターンを物体に照射し、色成分毎に処理を施して、物体の情報を得る技術が開示されている。
しかし、複雑な表面を持つ計測対象物の計測において、算出された位相値に基づいて形状が再現できない問題がしばしばある。例えば、計測対象物の材質により格子画像に輝度飽和領域がある場合、または、計測対象物の表面変化によりコントラスト低下部分が形成される場合、その領域の形状を正確に測定することが難しい。すなわち、形状を正確に測定するには、位相値の信頼性を判定する必要がある。そのために、輝度飽和領域、コントラスト低下領域など位相の信頼性に影響する部分を抽出する必要がある。 However, in measuring a measurement object having a complicated surface, there is often a problem that the shape cannot be reproduced based on the calculated phase value. For example, when there is a luminance saturation region in the lattice image due to the material of the measurement object, or when a contrast-decreasing portion is formed due to a change in the surface of the measurement object, it is difficult to accurately measure the shape of the region. That is, in order to accurately measure the shape, it is necessary to determine the reliability of the phase value. Therefore, it is necessary to extract a portion that affects the reliability of the phase, such as a luminance saturation region and a contrast reduction region.
従来から行われている位相値の信頼性に影響のある部分の分類および抽出方法は有効とはいえない。例えば、コントラスト低下領域の抽出には、白色かつ無地のパターン光を投影し、撮影した画像を用いて、輝度値が低い部分をコントラスト低下領域と判定する手法がある。しかし、この手法では、格子画像以外の撮影も必要なことと、判定基準が不明確であることが問題である。 Conventional methods for classifying and extracting portions that affect the reliability of phase values are not effective. For example, there is a method for extracting a low contrast area by projecting white and plain pattern light and using a captured image to determine a portion having a low luminance value as a low contrast area. However, this method has a problem that photographing other than the lattice image is necessary and the determination criterion is unclear.
また、輝度飽和領域の抽出には、パターン光を投影した状態をカメラにより取り込んだ画像から物体の表面状態により輝度が飽和する領域を全部抽出し、抽出した領域を形状不定部分と判定する手法がある。また、この場合、抽出された飽和部分に対して、光量を下げて再計測するのが一般的である。しかし、抽出された飽和領域中に、輝度飽和領域があっても位相値が精度範囲内にある部分が存在する場合があり、このような部分が形状不定部分と判断されると情報ロスになる。また、光量を下げて、このような部分を再度測定する際、他の領域でコントラストの低下が発生し計測精度が悪くなる可能性もある。 In addition, the extraction of the luminance saturation region includes a method of extracting all the regions where the luminance is saturated depending on the surface state of the object from the image obtained by projecting the pattern light, and determining the extracted region as an indefinite shape portion. is there. In this case, the extracted saturated portion is generally measured again by reducing the light amount. However, there may be a portion where the phase value is within the accuracy range even if there is a luminance saturation region in the extracted saturation region, and if such a portion is determined to be an indefinite shape, an information loss occurs. . Further, when measuring such a portion again by reducing the light amount, there is a possibility that a reduction in contrast occurs in other regions and the measurement accuracy is deteriorated.
本発明では、格子画像のほかに、位相値と振幅値を用いて、輝度飽和領域、コントラスト低下領域、コントラスト低下領域の境界領域、鏡面反射などによる位相エラー領域の抽出を通じて、位相値の信頼性判定を行い、一般的な装置構成で、位相値の信頼性判定結果を利用して、計測精度を向上する。 In the present invention, in addition to the lattice image, the phase value and amplitude value are used to extract the reliability of the phase value by extracting the luminance saturation region, the contrast reduction region, the boundary region of the contrast reduction region, and the phase error region by specular reflection. The measurement accuracy is improved by making a determination and using the reliability determination result of the phase value with a general apparatus configuration.
本発明の課題は、計測精度が向上された3次元計測方法及びその装置を提供することである。 An object of the present invention is to provide a three-dimensional measurement method and apparatus with improved measurement accuracy.
本発明の3次元計測方法は、格子パターンを複数回シフトして計測対象物に照射し、照射された格子パターンの画像をシフトする毎に撮像し、該画像を用いて3次元形状を計測する、位相シフト法を用いた3次元計測方法において、該画像の各画素の位相値と振幅値を算出するステップと、該算出された位相値では、正確に形状を計測できない部分を分類して抽出するステップと、該抽出された結果に基づき、各画素の位相値の信頼性を判定するステップと、該判定結果を用いて、該計測対象物の形状算出及び結果表示を行うステップとを備えることを特徴とする。 In the three-dimensional measurement method of the present invention, the lattice pattern is shifted a plurality of times to irradiate the measurement object, and an image of the irradiated lattice pattern is captured every time the image is shifted, and the three-dimensional shape is measured using the image. In the three-dimensional measurement method using the phase shift method, the step of calculating the phase value and the amplitude value of each pixel of the image, and the portion where the shape cannot be accurately measured by the calculated phase value are classified and extracted And determining the reliability of the phase value of each pixel based on the extracted result, and calculating the shape of the measurement object and displaying the result using the determination result. It is characterized by.
本発明の3次元計測装置は、格子パターンを複数回シフトして計測対象物に照射し、照射された格子パターンの画像をシフトする毎に撮像し、該画像を用いて3次元形状を計測する、位相シフト法を用いた3次元計測装置において、該画像の各画素の位相値と振幅値を算出する算出手段と、該算出された位相値では、正確に形状を計測できない部分を分類して抽出する抽出手段と、該抽出された結果に基づき、各画素の位相値の信頼性を判定する判定手段と、該判定結果を用いて、該計測対象物の形状算出及び結果表示を行う形状算出表示手段とを備えることを特徴とする。 The three-dimensional measurement apparatus of the present invention shifts the lattice pattern a plurality of times and irradiates the measurement target, captures the image of the irradiated lattice pattern every time it shifts, and measures the three-dimensional shape using the image. In the three-dimensional measurement apparatus using the phase shift method, the calculation means for calculating the phase value and the amplitude value of each pixel of the image, and the portion where the shape cannot be measured accurately by the calculated phase value are classified. Extraction means for extraction, determination means for determining the reliability of the phase value of each pixel based on the extracted result, and shape calculation for calculating the shape of the measurement object and displaying the result using the determination result And a display means.
本発明によれば、輝度飽和領域、コントラスト低下領域、コントラスト低下領域の境界領域、鏡面反射などによる位相エラー領域の抽出を通じて、位相値の信頼性判定が出来、計測精度の向上が可能となる。 According to the present invention, the reliability of a phase value can be determined through extraction of a phase saturation region, a contrast reduction region, a boundary region between contrast reduction regions, a phase error region by specular reflection, and the like, and measurement accuracy can be improved.
本発明の実施形態では、位相シフト法を用いた3次元計測方法を用いる。格子パターンを計測対象物に投影して、前記格子パターンの位相シフトを複数回行い、それぞれの位相シフト時における格子画像を取り込み、各画素の位相値と振幅値を算出する。そして、前記複数の格子画像と前記各画素の位相値と振幅値を用いて、算出された位相値を用いても形状が再現できない部分を分類して抽出し、抽出された結果に基づき、前記各画素の位相値の信頼性を判定し、判定結果を用いて、計測対象物の形状算出及び結果表示を行う。 In the embodiment of the present invention, a three-dimensional measurement method using a phase shift method is used. The lattice pattern is projected onto the measurement object, the phase shift of the lattice pattern is performed a plurality of times, the lattice image at each phase shift is taken in, and the phase value and amplitude value of each pixel are calculated. Then, using the phase value and the amplitude value of each of the plurality of grid images and each pixel, classify and extract a portion whose shape cannot be reproduced using the calculated phase value, and based on the extracted result, The reliability of the phase value of each pixel is determined, and using the determination result, the shape of the measurement object is calculated and the result is displayed.
また、前記分類して抽出する部分は、輝度飽和領域、コントラスト低下領域、コントラスト低下領域の境界領域、鏡面反射などによる位相エラー領域などである。
また、前記輝度飽和領域の抽出において、前記複数の格子画像に基づいて、輝度値が最大輝度値である画素を抽出し、抽出された画素間の隣接関係に基づき、抽出された画素について複数の小領域に隣接する隣接領域を求め、各小領域とその隣接領域に対して、それぞれの位相値ヒストグラムを算出し、算出した位相値ヒストグラムの比較を行い、輝度飽和であっても位相値が計測精度範囲内にある領域かどうかの判定を行う。
The parts to be classified and extracted include a luminance saturation region, a contrast reduction region, a boundary region of the contrast reduction region, a phase error region due to specular reflection, and the like.
Further, in the extraction of the luminance saturation region, a pixel whose luminance value is the maximum luminance value is extracted based on the plurality of grid images, and a plurality of extracted pixels are determined based on the adjacent relationship between the extracted pixels. Find adjacent areas adjacent to a small area, calculate the phase value histogram for each small area and its adjacent areas, compare the calculated phase value histograms, and measure the phase value even when the brightness is saturated It is determined whether the area is within the accuracy range.
また、前記コントラスト低下領域の抽出において、前記輝度飽和領域以外の全画素に対して、振幅値の平均値と標準偏差を求め、振幅値が平均値より小さい画素を処理対象とし、移動平均法で近傍領域内の振幅値の小さい画素を抽出し、抽出された画素全体に対して振幅値の平均値と標準偏差を求めて、コントラスト低下領域か否かの最終的な判定を行う。 Further, in the extraction of the contrast reduction region, the average value and the standard deviation of the amplitude value are obtained for all the pixels other than the luminance saturation region, and the pixel whose amplitude value is smaller than the average value is processed, and the moving average method is used. A pixel having a small amplitude value in the neighboring region is extracted, and an average value and a standard deviation of the amplitude value are obtained with respect to the entire extracted pixel, and a final determination is made as to whether or not the region is a contrast lowered region.
また、前記コントラスト低下領域の境界領域の抽出は、前記コントラスト低下領域に対して膨張処理を実施し、膨張処理の結果を利用して行われる。
また、前記鏡面反射などによる位相エラー領域の抽出は、前記輝度飽和領域、コントラスト低下領域、コントラスト低下領域の境界領域以外の画素について、隣接画素の位相値の差と格子パターンの照射角度の関係を用いて行われる。
In addition, the extraction of the boundary region of the contrast reduction region is performed by performing expansion processing on the contrast reduction region and using the result of the expansion processing.
In addition, the extraction of the phase error region by the specular reflection or the like is performed by calculating the relationship between the phase value difference of adjacent pixels and the irradiation angle of the lattice pattern for pixels other than the luminance saturation region, the contrast reduction region, and the boundary region of the contrast reduction region. Done with.
本発明の実施形態に従った3次元計測装置は、位相シフト法による3次元計測装置であって、格子パターンを計測対象物に投影する手段と、前記格子パターンの位相シフトを複数回行い、それぞれの位相シフト時における格子画像を取り込む手段と、各画素の位相値と振幅値を算出する手段と、前記複数の格子画像と前記各画素の位相値と振幅値を用いて、算出された位相値で形状が再現できない部分を分類して抽出する手段と、抽出される結果に基づき前記各画素の位相値の信頼性を判定する手段と、判定結果を用いて計測対象物の形状を算出する手段と、その結果を表示する手段とを備える。 A three-dimensional measurement apparatus according to an embodiment of the present invention is a three-dimensional measurement apparatus based on a phase shift method, and performs a phase shift of the lattice pattern a plurality of times, a means for projecting the lattice pattern onto a measurement object, A phase value calculated using a means for capturing a lattice image at the time of phase shift, a means for calculating a phase value and an amplitude value of each pixel, and a plurality of lattice images and the phase value and amplitude value of each pixel Means for classifying and extracting a portion whose shape cannot be reproduced, means for determining the reliability of the phase value of each pixel based on the extracted result, and means for calculating the shape of the measurement object using the determination result And means for displaying the result.
また、前記分類して抽出する手段は、輝度飽和領域、コントラスト低下領域、コントラスト低下領域の境界領域、鏡面反射などによる位相エラー領域のうちの少なくとも一つを抽出する。 The classifying and extracting means extracts at least one of a luminance saturation region, a contrast reduction region, a boundary region of the contrast reduction region, and a phase error region due to specular reflection.
以下、本発明の実施形態を図面に従い説明する。
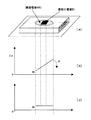
図1は、本発明の実施形態に係る3次元計測装置を含むシステムの構成を示す説明図である。
Hereinafter, embodiments of the present invention will be described with reference to the drawings.
FIG. 1 is an explanatory diagram showing a configuration of a system including a three-dimensional measuring apparatus according to an embodiment of the present invention.
図1に示すように、該システムはステージ1、格子パターン投影機構2、撮影機構3、画像処理装置4とを備える。
格子パターン投影機構2においては、光源21から出射され、照明光学系22を通った光は、照明光学系22の光軸方向と平行な平行光線になり、格子パターン及び走査装置23の中にある格子パターンを照射する。格子パターン及び走査装置23の制御で、格子パターンを照射光学系22の光軸と垂直方向にシフトさせ、格子パターン及び走査装置23を透過した光が、投影光学系24を介して、ステージ1上の計測対象物5に投影する。投影したパターンの像は明度が正弦波状に変化するものになっている。
As shown in FIG. 1, the system includes a
In the grating
計測対象物5によって反射された光は、撮影機構3の結像系31を介してカメラ32に入射する。この結果、計測対象物5によって変形された格子パターンの像がカメラ32によって撮影される。前記格子パターンを数段階に渡って移動させ、各位置毎に、カメラ32からの出力データ(格子画像)を画像処理装置4のデータ保存部41に保存する。また、データ保存部41にカメラ分解能、入射角度、格子ピッチ、位相シフトステップ数を予め保存しておく。
The light reflected by the
位相値と振幅値の算出はデータ処理部42で行われる。例えば、画素(x、y)の位相値Φ(x、y)と振幅値γ(x、y)の算出は、それぞれ以下の式1と式2を用いて行われる。
The calculation of the phase value and the amplitude value is performed by the

位相値信頼性判定部43において、複数の格子画像データ、位相値、振幅値を読み込んで、位相値の信頼性の判定を行う。具体的には、輝度飽和領域の抽出、コントラスト低下領域の抽出、コントラスト低下領域の境界領域の抽出、鏡面反射などによる位相エラー領域の抽出を行う。
The phase value
データ表示部44は、上記各部における処理の結果を表示するディスプレイ等である。
以下、各領域の抽出処理の内容を詳述する。
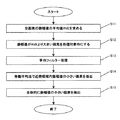
図2は、輝度飽和領域の抽出手順を示すフローチャートである。また、図3は、輝度飽和領域の抽出処理の様子を説明する図である。
The
Hereinafter, the contents of the extraction processing for each region will be described in detail.
FIG. 2 is a flowchart showing a procedure for extracting a luminance saturation region. FIG. 3 is a diagram for explaining the state of the luminance saturation region extraction process.
まず、ステップS1では、複数の格子画像内で輝度がカメラの最大輝度値(例えば255)であるすべての画素を抽出し、輝度飽和領域A1とする。ついでステップS2に進み、領域A1にある画素の隣接関係に基づき(例えば、4隣接あるいは8隣接の関係にある等)、抽出された画素を複数の小領域Ei(i=0、1、2、・・・)へ統合し、各小領域の隣接領域NEi(i=0、1、2、・・・)を求める。NEiは輝度飽和しておらず、かつ、小領域Eiと隣接し、小領域Eiより画素数が多い領域である。例えば、小領域Eiからのユークリッド距離が所定値(例えば、x)以内であり、輝度飽和しておらず、画素数が小領域Eiの2倍(所定値の倍)である領域を用いればよい。 First, in step S1, all pixels whose luminance is the maximum luminance value (for example, 255) of the camera are extracted from the plurality of grid images and set as the luminance saturation region A1. Next, the process proceeds to step S2, and the extracted pixels are divided into a plurality of small areas Ei (i = 0, 1, 2,. ..)) And the adjacent area NEi (i = 0, 1, 2,...) Of each small area is obtained. NEi is an area that is not saturated in luminance, is adjacent to the small area Ei, and has more pixels than the small area Ei. For example, a region where the Euclidean distance from the small region Ei is within a predetermined value (for example, x), the luminance is not saturated, and the number of pixels is twice that of the small region Ei (double of the predetermined value) may be used. .
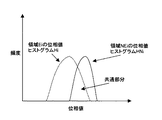
図3(a)の例では、平面サンプル上の一つの飽和領域Eiとその隣接領域NEiを示している。
次に、ステップS3では、EiとNEiの位相値ヒストグラムHi、HNiを求める。
In the example of FIG. 3A, one saturated region Ei and its adjacent region NEi on the planar sample are shown.
Next, in step S3, phase value histograms Hi and HNi of Ei and NEi are obtained.
以下、図3を用いて、ヒストグラムの求め方を説明する。
図3(a)の平面サンプルに対して、画素毎に位相値を求めると、カメラの走査ラインの一つの位相値について、図3(b)に示すような結果が得られる。領域Eiと領域NEi内の位相値の傾きがあるため、このような位相値で求めた二つのヒストグラムを比較することは難しい。本発明の実施形態では、まずCCDの解像度r(1画素の横サイズ)、格子ピッチPitch、入射角度αから以下の式3で傾き角度βを求める。
Hereinafter, the method of obtaining the histogram will be described with reference to FIG.
When the phase value is obtained for each pixel with respect to the planar sample of FIG. 3A, the result shown in FIG. 3B is obtained for one phase value of the scanning line of the camera. Since there is an inclination of the phase value in the region Ei and the region NEi, it is difficult to compare two histograms obtained with such a phase value. In the embodiment of the present invention, first, the tilt angle β is obtained from the CCD resolution r (horizontal size of one pixel), the grating pitch Pitch, and the incident angle α according to the following
以上の処理において、EiとNEiの位相値に2πのとびがある場合、傾き補正前に接続処理を行う。
図4は、輝度飽和領域の抽出処理において生成されるヒストグラムの例を示す図である。
In the above processing, when there is a jump of 2π between the phase values of Ei and NEi, connection processing is performed before tilt correction.
FIG. 4 is a diagram illustrating an example of a histogram generated in the luminance saturation region extraction process.
次に、ステップS4では、図4に示すような二つのヒストグラムHi、HNiを比較する。比較結果の評価について、本発明の実施形態では、二つのHi、HNiの共通部分の画素数がHiの画素数に示す割合を用いる。最後に、ステップS5では、評価の結果が予め設定した評価基準より大きい場合、小領域Eiの位相値が近隣領域との関連性が高いと判断され、この小領域を領域A2(位相値が精度範囲内の領域)の一部とする(輝度飽和領域の境界領域とする)。ステップS4において、相関度、類似度などの評価方法を用いてもよい。 Next, in step S4, two histograms Hi and HNi as shown in FIG. 4 are compared. Regarding the evaluation of the comparison result, in the embodiment of the present invention, the ratio of the number of pixels of the common part of two Hi and HNi to the number of pixels of Hi is used. Finally, in step S5, if the evaluation result is larger than the preset evaluation criterion, it is determined that the phase value of the small area Ei is highly related to the neighboring area, and this small area is designated as the area A2 (the phase value is accurate). A region within the range) (a boundary region of the luminance saturation region). In step S4, an evaluation method such as a correlation degree or a similarity degree may be used.
領域A1と領域A1に含まれる領域A2からなる輝度飽和領域の抽出結果を、データ処理部42とデータ表示部44へ出力する。
図5は、コントラスト低下領域の抽出手順を示すフローチャートである。また、図6は、コントラスト低下領域の抽出処理の様子を示す図である。
The extraction result of the luminance saturation region composed of the region A1 and the region A2 included in the region A1 is output to the
FIG. 5 is a flowchart showing a procedure for extracting a contrast reduction region. FIG. 6 is a diagram showing a state of the process of extracting the contrast reduction region.
まず、輝度飽和領域A1以外の画素全体に対して、振幅値の平均値AVEを求める(ステップS11)。次に、振幅値が平均値AVEより大きい画素を抽出し、以後の処理から外す(ステップS12)。 First, an average value AVE of amplitude values is obtained for all the pixels other than the luminance saturation region A1 (step S11). Next, a pixel whose amplitude value is larger than the average value AVE is extracted and removed from the subsequent processing (step S12).
図6(a)と(b)はステップS12までの処理例を示す図である。図6(a)は、格子パターンの投影の様子を示しており、図6(b)は、コントラスト低下領域抽出処理の対象外領域を示す図である。 FIGS. 6A and 6B are diagrams showing a processing example up to step S12. FIG. 6A shows a state of projection of a lattice pattern, and FIG. 6B shows a region that is not subject to contrast reduction region extraction processing.
更に、ステップS12で残される画素(以後有効画素という)に対して、平均フィルタを用いて平滑化処理を行う(ステップS13)。次に、図6(b)に示すような移動平均用近傍を用いて、移動平均法で近傍領域内の振幅値の小さい画素を抽出する(ステップS14)。近傍のサイズについて、ユーザによる調整は可能である。具体的な抽出方法として、画素(x、y)の振幅値がその近傍の局所平均値より小さい画素を抽出する。ここで、近傍の局所平均値の算出は、近傍領域内有効画素のみに対して実施する。図6の例において、抽出された画素のみに対して、その振幅値を画像化した結果を図6(c)に示す。最後に、ステップS14で抽出された画素の中に、全体から見ると振幅値が小さくないものが含まれる可能性があるため、このような画素を抽出し、最終結果から外す(ステップS15)。具体的な方法として、ステップS14で抽出された画素全体の振幅値の平均値と標準偏差σを求め、所定振幅値範囲内(平均値±3σ)の画素を最終結果とする。図6(d)に、図6(c)の抽出結果の振幅値ヒストグラムを示す。図6(c)の抽出結果の一部はコントラスト低下領域の最終結果になる。 Further, smoothing processing is performed on the pixels remaining in step S12 (hereinafter referred to as effective pixels) using an average filter (step S13). Next, using the moving average neighborhood as shown in FIG. 6B, a pixel having a small amplitude value in the neighborhood region is extracted by the moving average method (step S14). The user can adjust the neighborhood size. As a specific extraction method, a pixel whose amplitude value of the pixel (x, y) is smaller than the local average value in the vicinity thereof is extracted. Here, the calculation of the local average value of the neighborhood is performed only for the effective pixels in the neighborhood area. FIG. 6C shows the result of imaging the amplitude value of only the extracted pixel in the example of FIG. Finally, the pixels extracted in step S14 may include those whose amplitude values are not small as a whole, so such pixels are extracted and excluded from the final result (step S15). As a specific method, the average value and standard deviation σ of the amplitude values of the entire pixels extracted in step S14 are obtained, and the pixels within a predetermined amplitude value range (average value ± 3σ) are used as the final result. FIG. 6D shows an amplitude value histogram of the extraction result of FIG. A part of the extraction result in FIG. 6C is the final result of the contrast reduction region.
コントラスト低下領域の抽出結果を領域Bとして、データ処理部42とデータ表示部44へ出力する。
格子画像において、コントラスト低下領域の境界にある画素の輝度値が不安定であるため、その画素の位相値の信頼性も低い。この領域の抽出は、抽出したコントラスト低下領域が用いられる。予め決めた近傍を用いて、コントラスト低下領域の膨張処理を行い、膨張された部分をコントラスト低下領域の境界領域とする。
The extraction result of the contrast reduction region is output as the region B to the
In the lattice image, since the luminance value of the pixel at the boundary of the contrast reduction region is unstable, the reliability of the phase value of the pixel is low. For the extraction of this region, the extracted contrast reduction region is used. The contrast reduction region is expanded using a predetermined neighborhood, and the expanded portion is set as a boundary region of the contrast decrease region.
コントラスト低下領域の抽出結果を領域Cとして、データ処理部42とデータ表示部44へ出力する。
本発明の実施形態では、輝度飽和領域、コントラスト低下領域、コントラスト低下領域の境界領域以外の画素について、隣接2画素間の位相値の差と入射角度の関係を用いて位相値の信頼性判定を行う。
The extraction result of the contrast reduction region is output as the region C to the
In the embodiment of the present invention, for the pixels other than the luminance saturation region, the contrast reduction region, and the boundary region of the contrast reduction region, the reliability determination of the phase value is performed using the relationship between the phase value difference between the adjacent two pixels and the incident angle. Do.
図7は、鏡面反射などによる位相エラー領域の抽出方法を説明する図である。
図7(a)と(b)において、横軸は走査ライン、縦軸は位相値を示す。入射光線の垂直方向に対する入射角度はαである。また、画素aの位相値Paに対応する点をT1とし、画素aの隣接画素bの位相値Pbに対応する点をT2とする。PaとPbの間に、−2π<(Pb−Pa)<2πが成り立つ。ここで、計測対象は平面サンプルの場合、位相とびが発生していないT1とT2の関係は図7(a)に示すようになる。この場合、βは前述の式3で求められる。画素a、bの間に位相とびが発生した場合、理論上(Pb−Pa)は−2πに近い値になるが、実際にノイズなどの影響で位相とびの値が大きくなる(絶対値が小さくなる)可能性もあるので、位相とび判定基準を−2πより大きい値、例えば−πに設定する。
FIG. 7 is a diagram for explaining a method of extracting a phase error region by specular reflection or the like.
7A and 7B, the horizontal axis indicates the scanning line, and the vertical axis indicates the phase value. The incident angle of the incident light with respect to the vertical direction is α. Further, a point corresponding to the phase value Pa of the pixel a is T1, and a point corresponding to the phase value Pb of the adjacent pixel b of the pixel a is T2. -2π <(Pb-Pa) <2π holds between Pa and Pb. Here, when the measurement target is a plane sample, the relationship between T1 and T2 in which no phase jump occurs is as shown in FIG. In this case, β is obtained by the above-described
本発明の実施形態では、図7(b)に示すように、入射角度αに対して、(Pb−Pa)である位相とびの値が、所定の基準より大きい、かつ、[tanβ−tan(π/2−α)]より小さいなら、画素aと画素bの位相値はエラーとする。つまり、このような位相値を用いて三次元形状を再現すると、画素bのところが光線が入れないところとなる。 In the embodiment of the present invention, as shown in FIG. 7B, the phase skip value (Pb−Pa) is larger than a predetermined reference with respect to the incident angle α, and [tan β−tan ( If smaller than (π / 2−α)], the phase values of the pixel a and the pixel b are considered as errors. That is, when a three-dimensional shape is reproduced using such a phase value, the light beam cannot enter the pixel b.
この位相エラー判別方法を用いて、鏡面反射による位相エラー、ランダムノイズによる位相エラーの一部が抽出される。
本発明の実施形態では、このような位相エラーを鏡面反射になどによる位相エラーと呼ぶ。
Using this phase error discrimination method, a phase error due to specular reflection and a part of a phase error due to random noise are extracted.
In the embodiment of the present invention, such a phase error is called a phase error due to specular reflection or the like.
図8は、鏡面反射による位相エラーの形成原因を説明する図である。
領域Eに入射する主な入射光は、入射光1のほかに、近くの領域E1の鏡面反射による反射光2がある。その結果、各格子画像における領域Eにある画素の輝度値の変化は予測できない。
FIG. 8 is a diagram for explaining the cause of formation of a phase error due to specular reflection.
In addition to the
鏡面反射などによる位相エラー領域の抽出結果を領域Dとして、データ処理部42とデータ表示部44へ出力する。
以上は、位相値信頼性判定部の行う処理である。次に、データ処理部42では、位相値、位相値の信頼性判定結果(領域A1、A2、B、C、D)を用いて計測対象物の形状を算出する。形状の算出方法としては、従来の位相接続処理による形状の算出方法でもよいし、参照平面による形状の算出方法でもよい。これらの処理に、位相値の信頼性を用いることで、より正確な結果が得られる。例えば、位相接続処理に、位相値の信頼性の低い領域を避けて接続するようにすれば、位相接続エラーの伝播が発生しにくくなる。
The phase error region extraction result due to specular reflection or the like is output as a region D to the
The above is the processing performed by the phase value reliability determination unit. Next, the
図9は、本発明の実施形態の処理結果の表示例を示す図である。
最後に、データ表示部44では、格子画像、位相値結果、振幅値結果、形状の算出結果を表示すると共に、位相値の信頼性判定結果(領域A1、A2、B、C、D)も表示するようにする。領域A1、A2、B、C、Dを区別できるように、カラー表示にしてもよい。また、形状を算出する際、各領域内の画素に対してマスクされたかどうかも表示する。図9は領域A1、A2、B、C、Dの表示画面の一例を示している。この表示画面から、領域A2と領域Dをマスクせず、それ以外の領域をマスクして、処理を行ったことも分かる。
FIG. 9 is a diagram illustrating a display example of the processing result according to the embodiment of this invention.
Finally, the
なお、位相値の信頼性判定結果が領域A1、A2、B、C、Dに分類されたため、各領域を段階的に再現すれば、計測対象物全体も得られる。具体的には、それらの領域の再現には、領域それぞれの形成原因に基づき、装置構成を変更する。例えば、光量を自動的に下げて再計測すれば、輝度飽和領域A1の再現ができる。また、投影方向を増やして再計測すれば、コントラスト低下領域Bとコントラスト低下領域の境界領域Cの一部が再現できる。また、投影角度を変更して再計測すれば、鏡面反射などによる位相エラーの一部も再現できる。 In addition, since the reliability determination result of the phase value is classified into regions A1, A2, B, C, and D, if each region is reproduced step by step, the entire measurement object can be obtained. Specifically, for reproducing these areas, the apparatus configuration is changed based on the formation cause of each area. For example, if the light amount is automatically reduced and remeasured, the luminance saturation region A1 can be reproduced. If the projection direction is increased and re-measurement is performed, a part of the boundary region C between the contrast reduction region B and the contrast reduction region can be reproduced. If the projection angle is changed and remeasured, a part of the phase error due to specular reflection or the like can be reproduced.
1 ステージ
2 格子パターン投影機構
3 撮影機構
4 画像処理装置
5 計測対象物
21 光源
22 照明光学系
23 格子パターン及び走査装置
24 投影光学系
31 結像系
32 カメラ
41 データ保存部
42 データ処理部
43 位相値信頼性判定部
44 データ表示部
DESCRIPTION OF
Claims (8)
該画像の各画素の位相値と振幅値を算出するステップと、
該算出された位相値では、正確に形状を計測できない部分を分類して抽出するステップと、
該抽出された結果に基づき、各画素の位相値の信頼性を判定するステップと、
該判定結果を用いて、該計測対象物の形状算出及び結果表示を行うステップと、
を備えることを特徴とする3次元計測方法。 3D using the phase shift method that shifts the grid pattern multiple times and irradiates the measurement object, captures the image of the irradiated grid pattern every time it shifts, and measures the 3D shape using the image In the measurement method,
Calculating a phase value and an amplitude value of each pixel of the image;
In the calculated phase value, a step of classifying and extracting a portion where the shape cannot be measured accurately;
Determining the reliability of the phase value of each pixel based on the extracted result;
Calculating the shape of the measurement object and displaying the result using the determination result; and
A three-dimensional measurement method comprising:
複数の前記画像のそれぞれから最大輝度の画素を抽出するステップと、
抽出された画素を複数の小領域に統合するステップと、
各小領域の隣接領域を求めるステップと、
各小領域とその隣接領域について、それぞれ位相値ヒストグラムを生成するステップと、
小領域の位相値ヒストグラムと、その隣接領域の位相値ヒストグラムとを各小領域について比較するステップと、
該比較したヒストグラムの小領域の位相値が所定の計測精度範囲内であるかどうかを判定するステップと、
を備えることを特徴とする請求項2に記載の3次元計測方法。 The extraction of the luminance saturation region is as follows:
Extracting a pixel of maximum brightness from each of the plurality of images;
Integrating the extracted pixels into a plurality of small regions;
Determining an adjacent region for each small region;
Generating a phase value histogram for each small region and its neighboring regions;
Comparing the phase value histogram of the small region and the phase value histogram of the adjacent region for each small region;
Determining whether the phase value of the small region of the compared histogram is within a predetermined measurement accuracy range;
The three-dimensional measurement method according to claim 2, further comprising:
前記輝度飽和領域以外の全画素について、振幅値の平均値と標準偏差を求めるステップと、
振幅値が平均値より小さい画素を抽出するステップと、
抽出された画素について、振幅値の平均値と標準偏差から、コントラスト低下領域の画素か否かを判定するステップと、
を備えることを特徴とする請求項2に記載の3次元計測方法。 The extraction of the contrast reduction region is as follows:
Obtaining an average value and standard deviation of amplitude values for all pixels other than the luminance saturation region;
Extracting pixels whose amplitude value is smaller than the average value;
For the extracted pixels, from the average value and standard deviation of the amplitude value, determining whether or not the pixel is in the contrast reduction region,
The three-dimensional measurement method according to claim 2, further comprising:
前記輝度飽和領域、コントラスト低下領域、コントラスト低下領域の境界領域以外の画素について、隣接画素の位相値の差と、格子パターンの照射角度の関係を用いて行うことを特徴とする請求項2に記載の3次元計測方法。 The extraction of the phase error region by specular reflection or the like
The pixel other than the luminance saturation region, the contrast lowering region, and the boundary region of the contrast lowering region is performed using a relationship between a phase value difference between adjacent pixels and an irradiation angle of a lattice pattern. 3D measurement method.
該画像の各画素の位相値と振幅値を算出する算出手段と、
該算出された位相値では、正確に形状を計測できない部分を分類して抽出する抽出手段と、
該抽出された結果に基づき、各画素の位相値の信頼性を判定する判定手段と、
該判定結果を用いて、該計測対象物の形状算出及び結果表示を行う形状算出表示手段と、
を備えることを特徴とする3次元計測装置。 3D using the phase shift method that shifts the grid pattern multiple times and irradiates the measurement object, captures the image of the irradiated grid pattern every time it shifts, and measures the 3D shape using the image In the measuring device,
Calculating means for calculating a phase value and an amplitude value of each pixel of the image;
In the calculated phase value, an extraction means for classifying and extracting a portion where the shape cannot be measured accurately;
Determination means for determining the reliability of the phase value of each pixel based on the extracted result;
Using the determination result, shape calculation display means for calculating the shape of the measurement object and displaying the result;
A three-dimensional measuring apparatus comprising:
The portion to be classified and extracted includes at least one of a luminance saturation region, a contrast lowering region, a boundary region of the contrast lowering region, or a phase error region due to specular reflection or the like. The three-dimensional measuring apparatus described.
Priority Applications (1)
| Application Number | Priority Date | Filing Date | Title |
|---|---|---|---|
| JP2004201181A JP2006023178A (en) | 2004-07-07 | 2004-07-07 | 3-dimensional measuring method and device |
Applications Claiming Priority (1)
| Application Number | Priority Date | Filing Date | Title |
|---|---|---|---|
| JP2004201181A JP2006023178A (en) | 2004-07-07 | 2004-07-07 | 3-dimensional measuring method and device |
Publications (2)
| Publication Number | Publication Date |
|---|---|
| JP2006023178A true JP2006023178A (en) | 2006-01-26 |
| JP2006023178A5 JP2006023178A5 (en) | 2007-08-02 |
Family
ID=35796551
Family Applications (1)
| Application Number | Title | Priority Date | Filing Date |
|---|---|---|---|
| JP2004201181A Pending JP2006023178A (en) | 2004-07-07 | 2004-07-07 | 3-dimensional measuring method and device |
Country Status (1)
| Country | Link |
|---|---|
| JP (1) | JP2006023178A (en) |
Cited By (16)
| Publication number | Priority date | Publication date | Assignee | Title |
|---|---|---|---|---|
| JP2008157797A (en) * | 2006-12-25 | 2008-07-10 | Matsushita Electric Works Ltd | Three-dimensional measuring method and three-dimensional shape measuring device using it |
| JP2009150773A (en) * | 2007-12-20 | 2009-07-09 | Nikon Corp | Device and method for measuring three-dimensional shape, and program |
| EP2090864A1 (en) | 2008-02-13 | 2009-08-19 | Konica Minolta Sensing, Inc. | Three-dimensional processor and method for controlling display ot three-dimensional data in the three-dimensional processor |
| JP2010522872A (en) * | 2007-03-28 | 2010-07-08 | エス.オー.アイ.テック シリコン オン インシュレーター テクノロジーズ | Substrate surface defect inspection method and apparatus |
| CN101893428A (en) * | 2009-05-21 | 2010-11-24 | 株式会社高永科技 | Shape measuring apparatus and form measuring method |
| JP2011089981A (en) * | 2009-09-24 | 2011-05-06 | Kde Corp | Inspection system and inspection method |
| US7973913B2 (en) | 2008-10-15 | 2011-07-05 | Fujifilm Corporation | Distance measurement apparatus and method |
| JP2011133328A (en) * | 2009-12-24 | 2011-07-07 | Roland Dg Corp | Method and apparatus for measurement of three-dimensional shape |
| WO2012057284A1 (en) * | 2010-10-27 | 2012-05-03 | 株式会社ニコン | Three-dimensional shape measurement device, three-dimensional shape measurement method, manufacturing method of structure, and structure manufacturing system |
| JP2012159412A (en) * | 2011-02-01 | 2012-08-23 | Sony Corp | Three-dimensional measuring apparatus, three-dimensional measuring method and program |
| JP2012220496A (en) * | 2011-04-06 | 2012-11-12 | General Electric Co <Ge> | Method and device for displaying indication of quality of three-dimensional data for surface of viewed object |
| US8314849B2 (en) | 2008-03-11 | 2012-11-20 | Nikon Corporation | Shape measuring device |
| CN106705855A (en) * | 2017-03-10 | 2017-05-24 | 东南大学 | High-dynamic performance three-dimensional measurement method based on adaptive grating projection |
| JP2019124543A (en) * | 2018-01-16 | 2019-07-25 | 株式会社サキコーポレーション | Method for acquiring inspection device height information and inspection device |
| KR20190104367A (en) * | 2017-03-07 | 2019-09-09 | 오므론 가부시키가이샤 | 3D shape measuring device, 3D shape measuring method and program |
| WO2022059093A1 (en) * | 2020-09-16 | 2022-03-24 | 日本電気株式会社 | Monitoring system, method, and non-temporary computer-readable medium in which program is stored |
-
2004
- 2004-07-07 JP JP2004201181A patent/JP2006023178A/en active Pending
Cited By (21)
| Publication number | Priority date | Publication date | Assignee | Title |
|---|---|---|---|---|
| JP2008157797A (en) * | 2006-12-25 | 2008-07-10 | Matsushita Electric Works Ltd | Three-dimensional measuring method and three-dimensional shape measuring device using it |
| JP2010522872A (en) * | 2007-03-28 | 2010-07-08 | エス.オー.アイ.テック シリコン オン インシュレーター テクノロジーズ | Substrate surface defect inspection method and apparatus |
| JP2009150773A (en) * | 2007-12-20 | 2009-07-09 | Nikon Corp | Device and method for measuring three-dimensional shape, and program |
| EP2090864A1 (en) | 2008-02-13 | 2009-08-19 | Konica Minolta Sensing, Inc. | Three-dimensional processor and method for controlling display ot three-dimensional data in the three-dimensional processor |
| US8121814B2 (en) | 2008-02-13 | 2012-02-21 | Konica Minolta Sensing, Inc. | Three-dimensional processor and method for controlling display of three-dimensional data in the three-dimensional processor |
| US8314849B2 (en) | 2008-03-11 | 2012-11-20 | Nikon Corporation | Shape measuring device |
| US7973913B2 (en) | 2008-10-15 | 2011-07-05 | Fujifilm Corporation | Distance measurement apparatus and method |
| CN101893428A (en) * | 2009-05-21 | 2010-11-24 | 株式会社高永科技 | Shape measuring apparatus and form measuring method |
| JP2010271316A (en) * | 2009-05-21 | 2010-12-02 | Koh Young Technology Inc | Device and method for measuring shape |
| US9275292B2 (en) | 2009-05-21 | 2016-03-01 | Koh Young Technology Inc. | Shape measurement apparatus and method |
| JP2011089981A (en) * | 2009-09-24 | 2011-05-06 | Kde Corp | Inspection system and inspection method |
| JP2011133328A (en) * | 2009-12-24 | 2011-07-07 | Roland Dg Corp | Method and apparatus for measurement of three-dimensional shape |
| WO2012057284A1 (en) * | 2010-10-27 | 2012-05-03 | 株式会社ニコン | Three-dimensional shape measurement device, three-dimensional shape measurement method, manufacturing method of structure, and structure manufacturing system |
| JP2012159412A (en) * | 2011-02-01 | 2012-08-23 | Sony Corp | Three-dimensional measuring apparatus, three-dimensional measuring method and program |
| JP2012220496A (en) * | 2011-04-06 | 2012-11-12 | General Electric Co <Ge> | Method and device for displaying indication of quality of three-dimensional data for surface of viewed object |
| KR20190104367A (en) * | 2017-03-07 | 2019-09-09 | 오므론 가부시키가이샤 | 3D shape measuring device, 3D shape measuring method and program |
| KR102149707B1 (en) * | 2017-03-07 | 2020-08-31 | 오므론 가부시키가이샤 | 3D shape measurement device, 3D shape measurement method and program |
| CN106705855A (en) * | 2017-03-10 | 2017-05-24 | 东南大学 | High-dynamic performance three-dimensional measurement method based on adaptive grating projection |
| JP2019124543A (en) * | 2018-01-16 | 2019-07-25 | 株式会社サキコーポレーション | Method for acquiring inspection device height information and inspection device |
| JP7156794B2 (en) | 2018-01-16 | 2022-10-19 | 株式会社サキコーポレーション | Inspection device height information acquisition method and inspection device |
| WO2022059093A1 (en) * | 2020-09-16 | 2022-03-24 | 日本電気株式会社 | Monitoring system, method, and non-temporary computer-readable medium in which program is stored |
Similar Documents
| Publication | Publication Date | Title |
|---|---|---|
| JP2006023178A (en) | 3-dimensional measuring method and device | |
| EP2175232A1 (en) | Three-dimensional shape measuring device, three-dimensional shape measuring method, three-dimensional shape measuring program, and recording medium | |
| US9521372B2 (en) | Pattern measuring apparatus, pattern measuring method, and computer-readable recording medium on which a pattern measuring program is recorded | |
| JP2011047724A (en) | Apparatus and method for inspecting defect | |
| TWI447836B (en) | Device and method for inspection of wafer cassette | |
| JP2009157543A (en) | Method and apparatus for creating image | |
| JP2007212201A (en) | Pattern inspection method and pattern inspection device | |
| US20220084189A1 (en) | Information processing apparatus, information processing method, and storage medium | |
| JP4286657B2 (en) | Method for measuring line and space pattern using scanning electron microscope | |
| JP2009036589A (en) | Target for calibration and device, method and program for supporting calibration | |
| Iuliani et al. | Image splicing detection based on general perspective constraints | |
| JP2024022625A (en) | Range discrimination device for autofocus in optical imaging systems | |
| JP4538421B2 (en) | Charged particle beam equipment | |
| JPWO2003032261A1 (en) | Coin discrimination device and coin discrimination method | |
| JP2009180690A (en) | Three-dimensional shape measuring apparatus | |
| JP2005345290A (en) | Streak-like flaw detecting method and streak-like flaw detector | |
| JP2006155579A (en) | Image processing method and image processing apparatus | |
| JP2009294027A (en) | Pattern inspection device and method of inspecting pattern | |
| JP2009250937A (en) | Pattern inspection device and method | |
| JP2006332069A (en) | Roughness judgment method of test piece and charged particle beam device | |
| JP2005283197A (en) | Detecting method and system for streak defect of screen | |
| EP3070432B1 (en) | Measurement apparatus | |
| JP2009014519A (en) | Area measuring method and area measuring program | |
| JP2008014717A (en) | Flaw inspection system and flaw inspection method | |
| JP6641485B2 (en) | Position specifying device and position specifying method |
Legal Events
| Date | Code | Title | Description |
|---|---|---|---|
| A521 | Written amendment |
Free format text: JAPANESE INTERMEDIATE CODE: A523 Effective date: 20070614 |
|
| A621 | Written request for application examination |
Free format text: JAPANESE INTERMEDIATE CODE: A621 Effective date: 20070614 |
|
| A977 | Report on retrieval |
Free format text: JAPANESE INTERMEDIATE CODE: A971007 Effective date: 20090914 |
|
| A131 | Notification of reasons for refusal |
Free format text: JAPANESE INTERMEDIATE CODE: A131 Effective date: 20090929 |
|
| A02 | Decision of refusal |
Free format text: JAPANESE INTERMEDIATE CODE: A02 Effective date: 20100209 |