JP2005293334A - Template matching device - Google Patents
Template matching device Download PDFInfo
- Publication number
- JP2005293334A JP2005293334A JP2004108749A JP2004108749A JP2005293334A JP 2005293334 A JP2005293334 A JP 2005293334A JP 2004108749 A JP2004108749 A JP 2004108749A JP 2004108749 A JP2004108749 A JP 2004108749A JP 2005293334 A JP2005293334 A JP 2005293334A
- Authority
- JP
- Japan
- Prior art keywords
- template
- signal
- image
- partial
- matching
- Prior art date
- Legal status (The legal status is an assumption and is not a legal conclusion. Google has not performed a legal analysis and makes no representation as to the accuracy of the status listed.)
- Pending
Links
Images


Landscapes
- Image Analysis (AREA)
Abstract
【課題】 入力信号に幾何学的変化があっても正確に合致位置を特定できるテンプレートマッチング装置およびテンプレートマッチング方法を提供する。
【解決手段】 複数の色成分を含む既知のテンプレート信号の強度のヒストグラムを各色成分ごとに作成し(S1)、複数の色成分を含む入力信号の中の異なる複数の位置から演算用の部分信号を抽出し(S2)、部分信号の強度のヒストグラムを各色成分ごとに作成し(S3)、テンプレート信号の各色成分のヒストグラムと部分信号の各色成分のヒストグラムとに基づいて、同じ色成分どうしを比較することにより、テンプレート信号と部分信号との類似度を求める(S4〜S7)。そして、入力信号の各位置で求められた類似度を大小比較することにより、入力信号の中のテンプレート信号との合致位置を特定する(S11)。
【選択図】 図3
PROBLEM TO BE SOLVED: To provide a template matching apparatus and a template matching method capable of accurately specifying a matching position even if there is a geometric change in an input signal.
A histogram of the intensity of a known template signal including a plurality of color components is created for each color component (S1), and a partial signal for calculation from a plurality of different positions in an input signal including the plurality of color components. (S2), a histogram of the intensity of the partial signal is created for each color component (S3), and the same color component is compared based on the histogram of each color component of the template signal and the histogram of each color component of the partial signal Thus, the similarity between the template signal and the partial signal is obtained (S4 to S7). Then, by comparing the degree of similarity obtained at each position of the input signal, a matching position with the template signal in the input signal is specified (S11).
[Selection] Figure 3
Description
本発明は、画像情報または音声情報などを含む入力信号に対してテンプレートマッチングを行うテンプレートマッチング装置に関する。 The present invention relates to a template matching apparatus that performs template matching on an input signal including image information or audio information.
テンプレートマッチングは、入力信号の中から既知のテンプレート信号に合致する部分信号(ターゲット)を探索して、ターゲットの位置(合致位置)を特定する処理である。この処理では、入力信号の中から抽出した演算用の部分信号と既知のテンプレート信号とのマッチング演算が、演算用の部分信号の抽出位置を少しずつ移動させながら、繰り返し行われる。そして、入力信号の中の各位置でのマッチング演算の結果を大小比較することで、合致位置が特定される。 Template matching is a process of searching for a partial signal (target) that matches a known template signal from input signals and specifying a target position (matching position). In this process, the matching operation between the partial signal for calculation extracted from the input signal and the known template signal is repeatedly performed while the extraction position of the partial signal for calculation is moved little by little. Then, the matching position is specified by comparing the result of the matching calculation at each position in the input signal.
また、マッチング演算には、周知の相互相関法や残差逐次検定法などが用いられる(例えば特許献1を参照)。これらの方法は、演算用の部分信号とテンプレート信号との対応位置どうしで信号強度の演算を行い、その結果を信号全体で集計するものである。
しかしながら、演算用の部分信号とテンプレート信号との対応位置どうしで信号強度の演算を行う上記の方法には、次の問題があった。例えば、画像情報を含む二次元の入力信号の場合、入力信号に幾何学的変化(回転や縮尺の変化など)があると、合致位置の特定を正確に行えるとは限らず、疑似マッチングやマッチング不可能になることがある。また、音声情報を含む一次元の入力信号の場合は、入力信号に幾何学的変化(縮尺の変化など)があると、同様に疑似マッチングやマッチング不可能になることがある。 However, the above method for calculating the signal intensity between the corresponding positions of the partial signal for calculation and the template signal has the following problems. For example, in the case of a two-dimensional input signal containing image information, if there is a geometric change (rotation, change in scale, etc.) in the input signal, it is not always possible to specify the matching position accurately, but pseudo matching or matching It may be impossible. In the case of a one-dimensional input signal including audio information, if there is a geometric change (such as a change in scale) in the input signal, pseudo matching or matching may not be possible.
本発明の目的は、入力信号に幾何学的変化があっても正確に合致位置を特定できるテンプレートマッチング装置を提供することにある。 An object of the present invention is to provide a template matching apparatus that can accurately specify a matching position even if there is a geometric change in an input signal.
請求項1に記載のテンプレートマッチング装置は、複数の色成分を含む既知のテンプレート信号の強度のヒストグラムを各色成分ごとに作成する第1の作成手段と、前記複数の色成分を含む入力信号の中の異なる複数の位置から演算用の部分信号を抽出する抽出手段と、前記抽出手段により抽出された前記部分信号の強度のヒストグラムを各色成分ごとに作成する第2の作成手段と、前記テンプレート信号の各色成分の前記ヒストグラムと前記部分信号の各色成分の前記ヒストグラムとに基づいて、同じ色成分どうしを比較することにより、前記テンプレート信号と前記部分信号との類似度を求める演算手段と、前記入力信号の各位置で求められた前記類似度を大小比較することにより、前記入力信号の中の前記テンプレート信号との合致位置を特定する特定手段とを備えたものである。
The template matching apparatus according to
請求項2に記載のテンプレートマッチング装置は、複数の色成分を含む既知のテンプレート信号の強度の慣性モーメントを各色成分ごとに算出する第1の算出手段と、前記複数の色成分を含む入力信号の中の異なる複数の位置から演算用の部分信号を抽出する抽出手段と、前記抽出手段により抽出された前記部分信号の強度の慣性モーメントを各色成分ごとに算出する第2の算出手段と、前記テンプレート信号の各色成分の前記慣性モーメントと前記部分信号の各色成分の前記慣性モーメントとに基づいて、同じ色成分どうしを比較することにより、前記テンプレート信号と前記部分信号との類似度を求める演算手段と、前記入力信号の各位置で求められた前記類似度を大小比較することにより、前記入力信号の中の前記テンプレート信号との合致位置を特定する特定手段とを備えたものである。
The template matching apparatus according to
請求項3に記載のテンプレートマッチング装置は、既知のテンプレート信号の予め定めた第1範囲と第2範囲との各々における平均強度の差を算出する第1の算出手段と、入力信号の中の異なる複数の位置から演算用の部分信号を抽出する抽出手段と、前記抽出手段により抽出された前記部分信号の前記第1範囲と前記第2範囲との各々における平均強度の差を算出する第2の算出手段と、前記テンプレート信号の前記平均強度の差と前記部分信号の前記平均強度の差とに基づいて、前記テンプレート信号と前記部分信号との類似度を求める演算手段と、前記入力信号の各位置で求められた前記類似度を大小比較することにより、前記入力信号の中の前記テンプレート信号との合致位置を特定する特定手段とを備えたものである。 The template matching apparatus according to claim 3 is different from the first calculation means for calculating the difference in average intensity in each of the predetermined first range and the second range of the known template signal in the input signal. Extracting means for extracting a partial signal for calculation from a plurality of positions; and second means for calculating a difference in average intensity in each of the first range and the second range of the partial signal extracted by the extracting means. Calculation means, calculation means for obtaining a similarity between the template signal and the partial signal based on the difference in average intensity of the template signal and the difference in average intensity of the partial signal, and each of the input signals And specifying means for specifying a matching position with the template signal in the input signal by comparing the degree of similarity determined by the position.
請求項4に記載のテンプレートマッチング装置は、複数の色成分を含む既知のテンプレート信号の予め定めた第1範囲と第2範囲との各々における平均強度の差を各色成分ごとに算出する第1の算出手段と、前記複数の色成分を含む入力信号の中の異なる複数の位置から演算用の部分信号を抽出する抽出手段と、前記抽出手段により抽出された前記部分信号の前記第1範囲と前記第2範囲との各々における平均強度の差を各色成分ごとに算出する第2の算出手段と、前記テンプレート信号の各色成分の前記平均強度の差と前記部分信号の各色成分の前記平均強度の差とに基づいて、同じ色成分どうしを比較することにより、前記テンプレート信号と前記部分信号との類似度を求める演算手段と、前記入力信号の各位置で求められた前記類似度を大小比較することにより、前記入力信号の中の前記テンプレート信号との合致位置を特定する特定手段とを備えたものである。
The template matching apparatus according to
本発明によれば、入力信号に幾何学的変化があっても正確に合致位置を特定することができる。 According to the present invention, even if there is a geometric change in the input signal, the matching position can be specified accurately.
以下、図面を用いて本発明の実施形態を詳細に説明する。
(第1実施形態)
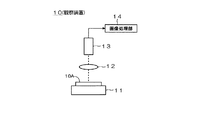
ここでは、第1実施形態のテンプレートマッチング装置および方法について、図1に示す観察装置10を例に説明する。観察装置10には、ステージ11と光学系12とカメラ13と画像処理部14とが設けられる。ステージ11は、試料10Aを支持する。光学系12は、試料10Aの局所領域の光像を形成する。カメラ13は、不図示の撮像素子により試料10Aの光像を撮像し、撮像信号を画像処理部14に出力する。
Hereinafter, embodiments of the present invention will be described in detail with reference to the drawings.
(First embodiment)
Here, the template matching apparatus and method according to the first embodiment will be described using the observation apparatus 10 shown in FIG. 1 as an example. The observation apparatus 10 includes a
画像処理部14は、カメラ13から撮像信号を取り込むと、これを所定ビット(例えば8ビット)のディジタル画像に変換し、入力画像として不図示のメモリに記憶させる。そして、入力画像に対して後述のテンプレートマッチングを行う。試料10Aは、例えば、半導体ウエハや液晶基板、プリント基板、生物標本(例えば細胞)などである。観察装置10を用いて、試料10Aの観察や検査や位置合わせなどが行われる。
When the
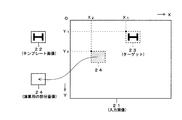
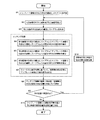
次に、画像処理部14におけるテンプレートマッチングについて説明する。テンプレートマッチングは、例えば図2に示す入力画像21の中から既知のテンプレート画像22に合致する部分画像(ターゲット23)を探索して、ターゲット23の位置(以下「合致位置(X1,Y1)」という)を特定する処理である。第1実施形態のテンプレートマッチングは、図3に示すフローチャートの手順(ステップS1〜S11)にしたがって行われる。
Next, template matching in the
図3の処理では、入力画像21の中から抽出した演算用の部分画像24とテンプレート画像22とのマッチング演算(S4〜S7)が、部分画像24の抽出位置(X2,Y2)を少しずつ移動させながら、繰り返し行われる。マッチング演算(S4〜S7)は、後述の濃度ヒストグラムに基づいて、部分画像24とテンプレート画像22との類似度を求める演算である。類似度は、部分画像24とテンプレート画像22との「類似性に関する指標」の1つであり、「類似性に関する正確な指標」である。
In the processing of FIG. 3, the matching operation (
また、図3の処理では、入力画像21と演算用の部分画像24とテンプレート画像22が、各々、3つの色成分(つまり加色の三原色または光の三原色と呼ばれるRGB成分)を含むとする。RGB成分を含む画像(21,24,22)はカラー画像である。なお、入力画像21は、「画像情報を含む入力信号」に対応する。テンプレート画像22は、「画像情報を含むテンプレート信号」に対応する。演算用の部分画像24は、「画像情報を含む演算用の部分信号」に対応する。
In the processing of FIG. 3, it is assumed that the input image 21, the
図3の処理(S1〜S11)について順に説明する。
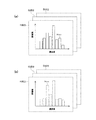
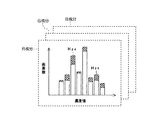
ステップS1において、画像処理部14は、テンプレート画像22の全体からRGB成分の濃度ヒストグラムH22を各色成分ごとに作成する(図4(a)参照)。濃度ヒストグラムH22の作成は、テンプレート画像22の全画素の濃度値を調べ、各濃度値ごとに画素数を計数することにより行われる。テンプレート画像22が8ビットの場合、画素の濃度値は256段階(0〜255)となる。濃度ヒストグラムH22は、テンプレート画像22の中に各濃度値の画素が現れる頻度(画素数)を表した濃度のヒストグラム(度数分布)である。濃度ヒストグラムH22の横軸は濃度値、縦軸は画素数である。
The processes (S1 to S11) in FIG. 3 will be described in order.
In step S1, the
次に(ステップS2)、画像処理部14は、入力画像21の中から演算用の部分画像24を抽出する。演算用の部分画像24は、テンプレート画像22と縦横各々同じ大きさ(画素数)の矩形状である。演算用の部分画像24とテンプレート画像22は、共に、入力画像21より小さい(画素数が少ない)。
次に(ステップS3)、画像処理部14は、ステップS2で抽出した演算用の部分画像24の全体からRGB成分の濃度ヒストグラムH24を各色成分ごとに作成する(図4(b)参照)。この濃度ヒストグラムH24の作成も、上記したテンプレート画像22の濃度ヒストグラムH22と同様にして行われる。濃度ヒストグラムH24も、横軸は濃度値、縦軸は画素数である。
Next (step S <b> 2), the
Next (step S3), and the
次に(ステップS4)、画像処理部14は、部分画像24のR成分の濃度ヒストグラムH24(図4(b)参照)と、テンプレート画像22のR成分の濃度ヒストグラムH22(図4(a)参照)とを比較し、2つのR成分の濃度ヒストグラムH24,H22の重なり部分(図5の斜線部分)の画素数を集計する。この重なり部分(図5の斜線部分)の総画素数KRは、R成分の濃度ヒストグラムH24,H22の類似性に関する指標である。重なり部分(図5の斜線部分)とは、2つの濃度ヒストグラムH24,H22の同じ濃度値どうしで画素数を比較したときの小さい方の画素数に相当する。
Next (step S4), and the
同様に、ステップS5では、部分画像24のG成分の濃度ヒストグラムH24と、テンプレート画像22のG成分の濃度ヒストグラムH22とを比較し、2つのG成分の濃度ヒストグラムH24,H22の重なり部分の画素数を集計する(総画素数KG)。さらに、ステップS6では、部分画像24のB成分の濃度ヒストグラムH24と、テンプレート画像22のB成分の濃度ヒストグラムH22とを比較し、2つのB成分の濃度ヒストグラムH24,H22の重なり部分の画素数を集計する(総画素数KB)。
Similarly, in step S5, a density histogram H 24 of the G component of the
次に(ステップS7)、画像処理部14は、上記ステップS4の集計結果(R成分の重なり部分の総画素数KR)と、ステップS5の集計結果(G成分の重なり部分の総画素数KG)と、ステップS6の集計結果(B成分の重なり部分の総画素数KB)との和を求め、その値を「部分画像24とテンプレート画像22との類似度」とする。
ステップS7で求めた類似度(=KR+KG+KB)は、傾向として、その値が大きいほど、部分画像24とテンプレート画像22との類似性が高く、部分画像24の抽出位置(X2,Y2)が合致位置(X1,Y1)に近いことを表す。
Next (step S7), the
The degree of similarity (= K R + K G + K B ) obtained in step S7 has a tendency that the larger the value, the higher the similarity between the
上記のマッチング演算(S4〜S7)が終了すると、画像処理部14は、次のステップS8において、マッチング演算の結果である類似度(=KR+KG+KB)を、部分画像24の抽出位置(X2,Y2)と対応づけてメモリに保存する。これらのステップS2〜S8の処理を経て、入力画像21の中の1つの抽出位置(X2,Y2)に対する処理が終わる。そして、演算用の部分画像24の抽出位置(X2,Y2)を次の位置へ移動させる場合には(ステップS9がYes)、ステップS10の処理に進む。
When the matching calculation (S4 to S7) is completed, the
ステップS10の処理は、演算用の部分画像24の抽出位置(X2,Y2)の移動処理である。画像処理部14は、部分画像24の抽出位置(X2,Y2)を現在の位置から次の位置へ移動させる。その後、ステップS2の処理に戻り、新たな抽出位置(X2,Y2)において、演算用の部分画像24の抽出(S2)→RGB成分の濃度ヒストグラムの作成(S3)→マッチング演算(S4〜S7)→結果保存(S8)を繰り返す。
The process of step S10 is a process of moving the extraction position (X 2 , Y 2 ) of the
このようにして、ステップS2→…→S10→S2…の処理を繰り返すことにより、演算用の部分画像24の抽出位置(X2,Y2)を少しずつ移動させながら、各々の位置で部分画像24を順に抽出し、部分画像24を抽出する毎に、RGB成分の濃度ヒストグラムH24,H22に基づいてマッチング演算(S4〜S7)を行うことができる。
そして、演算用の部分画像24の抽出位置(X2,Y2)が終点に到達し、そこでのステップS2〜S8の処理が終了すると、画像処理部14は、次の位置への移動を行わずに(S9がNo)、ステップS11の処理に進む。ステップS11では、入力画像21の中の異なる複数の位置で求められた類似度(=KR+KG+KB)を大小比較することにより、その値が最も大きく、テンプレート画像22との類似性が最も高い部分画像24の抽出位置(X2,Y2)を合致位置(X1,Y1)と特定する。以上で入力画像21に対するテンプレートマッチングの処理は終了となる。
In this way, by repeating the processing of steps S2 →... → S10 → S2..., The partial image at each position is moved while the extraction position (X 2 , Y 2 ) of the
Then, when the extraction position (X 2 , Y 2 ) of the
上記のように、第1実施形態のテンプレートマッチングでは、RGB成分の濃度ヒストグラムH24,H22に基づいて、同じ色成分どうしを比較することによりマッチング演算(S4〜S7)を行い、その結果である類似度(=KR+KG+KB)を大小比較する。RGB成分の濃度ヒストグラムH22は、テンプレート画像22のRGB成分それぞれの特徴量であり、RGB成分の濃度ヒストグラムH24は、演算用の部分画像24のRGB成分それぞれの特徴量である。このように、特徴量が画素の位置に依存しない量として求められるので、入力画像21に幾何学的変化(回転や縮尺の変化など)があっても、正確に合致位置(X1,Y1)を特定することができる。
As described above, in the template matching of the first embodiment, the matching operation (S4 to S7) is performed by comparing the same color components based on the density histograms H 24 and H 22 of the RGB components. A certain degree of similarity (= K R + K G + K B ) is compared in magnitude. The RGB component density histogram H 22 is a characteristic amount of each of the RGB components of the template image 22, and the RGB component density histogram H 24 is a characteristic amount of each of the RGB components of the
また、演算用の部分画像24の濃度範囲とテンプレート画像22の濃度範囲とを一致させることにより(正規化処理)、入力画像21のコントラストの変化やノイズにも対応でき、正確に合致位置(X1,Y1)を特定することができる。
さらに、第1実施形態のテンプレートマッチングでは、各々の画像(21,24,22)に含まれる全ての色成分(つまりRGB成分)を用いてマッチング演算(S4〜S7)を行う。このため、多くの情報量を確保でき、より正確に合致位置(X1,Y1)を特定できる。
Further, by matching the density range of the
Furthermore, in the template matching according to the first embodiment, matching calculation (S4 to S7) is performed using all the color components (that is, RGB components) included in each image (21, 24, 22). For this reason, a large amount of information can be secured, and the matching position (X 1 , Y 1 ) can be specified more accurately.
なお、上記した第1実施形態では、図3のステップS7において、ステップS4〜S6の集計結果の和(=KR+KG+KB)を求め、その値を「部分画像24とテンプレート画像22との類似度」としたが、本発明はこれに限定されない。ステップS4〜S6の集計結果の平均値(=[KR+KG+KB]/3)を求め、その値を「部分画像24とテンプレート画像22との類似度」としてもよい。平均値(=[KR+KG+KB]/3)の場合でも、その値が大きいほど、部分画像24とテンプレート画像22との類似性が高く、部分画像24の抽出位置(X2,Y2)が合致位置(X1,Y1)に近いことを表す。
In the first embodiment described above, in step S7 of FIG. 3, the sum (= K R + K G + K B ) of the summation results of steps S4 to S6 is obtained, and the value is expressed as “
また、上記した第1実施形態では、図3のステップS4〜S6において、図5に示すような濃度ヒストグラムH24,H22の重なり部分(斜線部分)の画素数を集計したが、本発明はこれに限定されない。その他、濃度ヒストグラムH24,H22の差分の絶対値(図6の斜線部分)の画素数を集計してもよい。この場合、ステップS4〜S6のRGB成分の集計結果(濃度ヒストグラムH24,H22の差分の絶対値の総画素数KR’,KG’,KB’)の和または平均値は、部分画像24とテンプレート画像22との類似度に相当し、その値が小さいほど、部分画像24とテンプレート画像22との類似性が高く、抽出位置(X2,Y2)が合致位置(X1,Y1)に近いことを表す。
In the first embodiment described above, in steps S4 to S6 in FIG. 3, the number of pixels in the overlapping portion (hatched portion) of the density histograms H 24 and H 22 as shown in FIG. 5 is tabulated. It is not limited to this. In addition, the number of pixels of the absolute value of the difference between the density histograms H 24 and H 22 (shaded portion in FIG. 6) may be totaled. In this case, the sum or average value of the summation results of the RGB components in steps S4 to S6 (the total number of pixels K R ', K G ', K B 'of the absolute values of the differences between the density histograms H 24 , H 22 ) It corresponds to the degree of similarity between the
さらに、上記した第1実施形態では、3つの色成分(つまりRGB成分)を含む画像(21,24,22)の例で説明したが、本発明はこれに限定されない。色成分の数が2つであっても4つ以上であっても本発明を適用できる。つまり複数の色成分を含む場合に本発明を適用できる。
(第2実施形態)
ここでは、演算用の部分画像24とテンプレート画像22とのマッチング演算を、後述の濃度慣性モーメントに基づいて行う場合を説明する。第2実施形態のテンプレートマッチングは、図3のステップS1,S3において“濃度ヒストグラム”の代わりに“濃度慣性モーメント”を算出し、図3のステップS4〜S7に代えて図7のステップS21〜S24の処理を実行するものである。第2実施形態でも、RGB成分を含む画像(21,24,22)を例に説明する。
Furthermore, in the first embodiment described above, the example of the image (21, 24, 22) including three color components (that is, RGB components) has been described, but the present invention is not limited to this. The present invention can be applied regardless of whether the number of color components is two or four or more. That is, the present invention can be applied to a case where a plurality of color components are included.
(Second Embodiment)
Here, a case will be described in which the matching calculation between the calculation
まず(図3のS1のタイミングで)、画像処理部14は、テンプレート画像22の全体からRGB成分の濃度慣性モーメントM22を各色成分ごとに算出する。例えば、R成分の濃度慣性モーメントM22は、テンプレート画像22のR成分(図8)の位置(x,y)における濃度値Aiを用い、次の式(1)により算出される。濃度値Aiの“i”は、テンプレート画像22の中での画素番号である。
First (at the timing of S1 in FIG. 3), the
M22 = Σ(xi 2+yi 2)Ai …(1)
式(1)の濃度慣性モーメントM22は、原点(画像中心)まわりの濃度の慣性モーメントであり、X軸まわりの濃度の慣性モーメント(MX=Σxi 2Ai)と、Y軸まわりの濃度の慣性モーメント(MY=Σyi 2Ai)との和に相当する。R成分の他、G成分,B成分の濃度慣性モーメントM22は、各々、テンプレート画像22のG成分,B成分の全体から、上記の式(1)と同様の式により算出される。
M 22 = Σ (x i 2 + y i 2 ) A i (1)
The density moment of inertia M 22 in the equation (1) is the moment of inertia of the density around the origin (image center), the moment of inertia of the density around the X axis (M X = Σx i 2 A i ), and the moment around the Y axis. This corresponds to the sum of the concentration moment of inertia (M Y = Σy i 2 A i ). In addition to the R component, the density inertia moments M 22 of the G component and the B component are calculated from the entire G component and B component of the template image 22 by the same formula as the above formula (1), respectively.
また、画像処理部14は、入力画像21の中から演算用の部分画像24を抽出すると、図3のS3のタイミングで、演算用の部分画像24の全体からRGB成分の濃度慣性モーメントM24を各色成分ごとに算出する。例えば、R成分の濃度慣性モーメントM24の算出は、部分画像24のR成分の全体から上記した式(1)と同様の式により行われる。G成分,B成分も同様である。
Further, when the
そして次に(図7のステップS21)、画像処理部14は、部分画像24のR成分の濃度慣性モーメントM24と、テンプレート画像22のR成分の濃度慣性モーメントM22とを比較し、2つのR成分の濃度慣性モーメントM24,M22の差分の絶対値を出力する。この場合の出力値ORは、R成分の濃度慣性モーメントM24,M22の類似性に関する指標である。
And then (step S21 in FIG. 7), the
同様に、ステップS22では、部分画像24のG成分の濃度慣性モーメントM24と、テンプレート画像22のG成分の濃度慣性モーメントM22とを比較し、2つのG成分の濃度慣性モーメントM24,M22の差分の絶対値を出力する(出力値OG)。さらに、ステップS23では、部分画像24のB成分の濃度慣性モーメントM24と、テンプレート画像22のB成分の濃度慣性モーメントM22とを比較し、2つのB成分の濃度慣性モーメントM24,M22の差分の絶対値を出力する(出力値OB)。
Similarly, in step S22, the concentration of inertia moment M 24 of the G component of the
次に(ステップS24)、画像処理部14は、上記したステップS21のR成分の出力値ORと、ステップS22のG成分の出力値OGと、ステップS23のB成分の出力値OBとの和を求め、その値を「部分画像24とテンプレート画像22との類似度」とする。
ステップS24で求めた類似度(=OR+OG+OB)は、傾向として、その値が小さいほど、部分画像24とテンプレート画像22との類似性が高く、部分画像24の抽出位置(X2,Y2)が合致位置(X1,Y1)に近いことを表す。
Next (step S24), the
The degree of similarity (= O R + O G + O B ) determined in step S24 is, as the tendency, smaller, the higher the similarity between the
第2実施形態のテンプレートマッチングによれば、演算用の部分画像24の抽出位置(X2,Y2)を少しずつ移動させながら、各々の位置で部分画像24を順に抽出し、部分画像24を抽出する毎に、RGB成分の濃度慣性モーメントM24,M22に基づいてマッチング演算(S21〜S24)を行うことができる。そして、入力画像21の中の異なる複数の位置で求められた類似度(=OR+OG+OB)を大小比較することにより、その値が最も小さく、テンプレート画像22との類似性が最も高い部分画像24の抽出位置(X2,Y2)を合致位置(X1,Y1)と特定することができる。
According to the template matching of the second embodiment, the
上記のように、第2実施形態のテンプレートマッチングでは、RGB成分の濃度慣性モーメントM24,M22に基づいて、同じ色成分どうしを比較することによりマッチング演算(S21〜S24)を行い、その結果である類似度(=OR+OG+OB)を大小比較する。RGB成分の濃度慣性モーメントM22は、テンプレート画像22のRGB成分それぞれの特徴量であり、RGB成分の濃度慣性モーメントM24は、演算用の部分画像24のRGB成分それぞれの特徴量であり、このような特徴量を同じ色成分どうしで比較するため、入力画像21に幾何学的変化(回転や縮尺の変化など)があっても、正確に合致位置(X1,Y1)を特定することができる。
As described above, in the template matching of the second embodiment, matching operations (S21 to S24) are performed by comparing the same color components based on the density inertia moments M 24 and M 22 of the RGB components, and the result The degree of similarity (= O R + O G + O B ) is compared in magnitude. Concentration inertia moment M 22 of the RGB components are each feature quantity RGB components of the template image 22, density inertia M 24 of the RGB components are each feature quantity RGB components of the
さらに、第2実施形態のテンプレートマッチングでは、各々の画像(21,24,22)に含まれる全ての色成分(つまりRGB成分)を用いてマッチング演算(S21〜S24)を行う。このため、多くの情報量を確保でき、より正確に合致位置(X1,Y1)を特定できる。
なお、上記した第2実施形態では、3つの色成分(つまりRGB成分)を含む画像(21,24,22)の例で説明したが、本発明はこれに限定されない。色成分の数が2つであっても4つ以上であっても本発明を適用できる。つまり複数の色成分を含む場合に本発明を適用できる。
(第3実施形態)
ここでは、演算用の部分画像24とテンプレート画像22とのマッチング演算を、後述の領域濃度差に基づいて行う場合を説明する。第3実施形態のテンプレートマッチングは、図3のステップS1,S3において“濃度ヒストグラム”の代わりに“領域濃度差”を算出し、図7のステップS21〜S24において“濃度慣性モーメント”の代わりに“領域濃度差”を用いるものである。第3実施形態でも、RGB成分を含む画像(21,24,22)を例に説明する。
Furthermore, in the template matching according to the second embodiment, matching calculation (S21 to S24) is performed using all color components (that is, RGB components) included in each image (21, 24, 22). For this reason, a large amount of information can be secured, and the matching position (X 1 , Y 1 ) can be specified more accurately.
In the second embodiment described above, an example of an image (21, 24, 22) including three color components (that is, RGB components) has been described. However, the present invention is not limited to this. The present invention can be applied regardless of whether the number of color components is two or four or more. That is, the present invention can be applied to a case where a plurality of color components are included.
(Third embodiment)
Here, a case will be described in which the matching calculation between the calculation
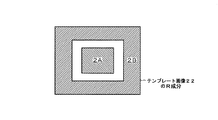
まず(図3のS1のタイミングで)、画像処理部14は、テンプレート画像22の全体からRGB成分の領域濃度差D22を各色成分ごとに算出する。例えば、R成分の領域濃度差D22は、テンプレート画像22のR成分(図9)の予め定めた中央領域2Aと周辺領域2Bとの各々における平均濃度の差により算出される(式(2))。なお、中央領域2Aと周辺領域2Bは、請求項の「第1範囲」と「第2範囲」に対応する。
First (at the timing of S1 in FIG. 3), the
D22 = (中央領域2Aの平均濃度)−(周辺領域2Bの平均濃度) …(2)
式(2)の領域濃度差D22は、周辺領域2Bに対する中央領域2Aの平均的な濃度差を表している。このため、例えば図10(a)に示すように、テンプレート画像22のR成分が、暗い背景(濃度値が最小)の中央に明るい点(濃度値が最大)を含むような場合、濃度値を256段階(0〜255)とすると、中央領域2Aは大きな平均濃度(例えば205)、周辺領域2Bは小さな平均濃度(例えば21)となり、式(2)の領域濃度差D22は大きなプラスの値(例えば184)となる。逆に中央領域2Aが暗く周辺領域2Bが明るい場合、領域濃度差D22はマイナスの値になる。
D 22 = (average density of
The area density difference D 22 in the expression (2) represents an average density difference of the
また、例えば図10(b)に示すように、テンプレート画像22のR成分が、暗い背景(濃度値が最小)の中に分散して多数の明るい点(濃度値が最大)を含むような場合、中央領域2Aは中間的な平均濃度(例えば123)、周辺領域2Bも中間的な平均濃度(例えば108)となり、式(2)の領域濃度差D22は小さな値(例えば15)となる。
また、画像処理部14は、入力画像21の中から演算用の部分画像24を抽出すると、図3のS3のタイミングで、演算用の部分画像24の全体からRGB成分の領域濃度差D24を各色成分ごとに算出する。例えば、R成分の領域濃度差D24の算出は、部分画像24のR成分の全体から、テンプレート画像22と同じ中央領域2A,周辺領域2B(図9)を用い、上記した式(2)と同様の式により行われる。G成分,B成分も同様である。
Further, for example, as shown in FIG. 10B, the R component of the template image 22 includes many bright spots (maximum density value) dispersed in a dark background (density value is minimum). the
Further, when the
そして次に(図7のステップS21のタイミングで)、画像処理部14は、部分画像24のR成分の領域濃度差D24と、テンプレート画像22のR成分の領域濃度差D22(図10(a)の場合は184)(図10(b)の場合は15)とを比較し、2つのR成分の領域濃度差D24,D22の差分の絶対値を出力する。この出力値PRは、R成分の領域濃度差D24,D22の類似性に関する指標である。
Then (at the timing of step S21 in FIG. 7), the
同様に(図7のステップS22のタイミングで)、部分画像24のG成分の領域濃度差D24と、テンプレート画像22のG成分の領域濃度差D22とを比較し、2つのG成分の領域濃度差D24,D22の差分の絶対値を出力する(出力値PG)。さらに(ステップS23のタイミングで)、部分画像24のB成分の領域濃度差D24と、テンプレート画像22のB成分の領域濃度差D22とを比較し、2つのB成分の領域濃度差D24,D22の差分の絶対値を出力する(出力値PB)。
Similarly (at the timing of step S22 in FIG. 7), the G component region density difference D 24 of the
次に(ステップS24のタイミングで)、画像処理部14は、上記したR成分の出力値PRと、G成分の出力値PGと、B成分の出力値PBとの和を求め、その値を「部分画像24とテンプレート画像22との類似度」とする。この類似度(=PR+PG+PB)は、傾向として、その値が大きいほど、部分画像24とテンプレート画像22との類似性が高く、部分画像24の抽出位置(X2,Y2)が合致位置(X1,Y1)に近いことを表す。
Next (at the timing of step S24), the
第3実施形態のテンプレートマッチングによれば、演算用の部分画像24の抽出位置(X2,Y2)を少しずつ移動させながら、各々の位置で部分画像24を順に抽出し、部分画像24を抽出する毎に、RGB成分の領域濃度差D24,D22に基づいてマッチング演算を行うことができる。そして、入力画像21の中の異なる複数の位置で求められた類似度(=PR+PG+PB)を大小比較することにより、その値が最も大きく、テンプレート画像22との類似性が最も高い部分画像24の抽出位置(X2,Y2)を合致位置(X1,Y1)と特定することができる。
According to the template matching of the third embodiment, the
上記のように、第3実施形態のテンプレートマッチングでは、RGB成分の領域濃度差D24,D22に基づいて、同じ色成分どうしを比較することによりマッチング演算(S21〜S24)を行い、その結果である類似度(=PR+PG+PB)を大小比較する。RGB成分の領域濃度差D22は、テンプレート画像22のRGB成分それぞれの特徴量であり、RGB成分の領域濃度差D24は、演算用の部分画像24のRGB成分それぞれの特徴量である。このように、特徴量が画素の位置に依存しない量として求められるので、入力画像21に幾何学的変化(回転や縮尺の変化など)があっても、正確に合致位置(X1,Y1)を特定することができる。
As described above, in the template matching of the third embodiment, the matching operation (S21 to S24) is performed by comparing the same color components based on the RGB component area density differences D 24 and D 22 , and the result The degree of similarity (= P R + P G + P B ) is compared in magnitude. The RGB component region density difference D 22 is a feature amount of each of the RGB components of the template image 22, and the RGB component region density difference D 24 is a feature amount of each of the RGB components of the
また、演算用の部分画像24の濃度範囲とテンプレート画像22の濃度範囲とを一致させることにより(正規化処理)、入力画像21のコントラストの変化やノイズにも対応でき、正確に合致位置(X1,Y1)を特定することができる。
さらに、第3実施形態のテンプレートマッチングでは、各々の画像(21,24,22)に含まれる全ての色成分(つまりRGB成分)を用いてマッチング演算(S21〜S24)を行う。このため、多くの情報量を確保でき、より正確に合致位置(X1,Y1)を特定できる。
Further, by matching the density range of the
Furthermore, in the template matching of the third embodiment, the matching calculation (S21 to S24) is performed using all the color components (that is, RGB components) included in each image (21, 24, 22). For this reason, a large amount of information can be secured, and the matching position (X 1 , Y 1 ) can be specified more accurately.
なお、上記した第3実施形態では、3つの色成分(つまりRGB成分)を含む画像(21,24,22)の例で説明したが、本発明はこれに限定されない。色成分の数が2つであっても4つ以上であっても本発明を適用できる。つまり複数の色成分を含む場合に本発明を適用できる。
また、画像(21,24,22)が複数の色成分を含まない場合、つまり単色の濃淡画像である場合にも、本発明を適用できる。この場合、部分画像24の1つの領域濃度差D24と、テンプレート画像22の1つの領域濃度差D22とを比較し、領域濃度差D24,D22のうち小さい方の値、または、領域濃度差D24,D22の差分の絶対値を「部分画像24とテンプレート画像22との類似度」とすればよい。
In the third embodiment described above, the example of the image (21, 24, 22) including three color components (that is, RGB components) has been described, but the present invention is not limited to this. The present invention can be applied regardless of whether the number of color components is two or four or more. That is, the present invention can be applied to a case where a plurality of color components are included.
The present invention can also be applied to a case where the image (21, 24, 22) does not include a plurality of color components, that is, a single-color gray image. In this case, the one area density difference D 24 of the
さらに、上記した第3実施形態では、領域濃度差D24,D22を算出するための領域として図9に示す中央領域2Aと周辺領域2Bとを予め定めたが、本発明はこれに限定されない。領域の設定が、例えば左側領域と右側領域のように、上記とは異なる位置や形状の場合でも、同様の効果を得ることができる。
(変形例)
なお、上記した実施形態では、濃度ヒストグラムH24,H22に基づくマッチング演算の例と、濃度慣性モーメントM24,M22に基づくマッチング演算の例と、領域濃度差D24,D22に基づくマッチング演算の例をそれぞれ説明したが、本発明はこれに限定されない。任意の2種類を組み合わせてマッチング演算を行う場合にも、本発明を適用できる。あるいは相互相関や最小残差と濃度ヒストグラムなどを組み合わせてもよい。
Furthermore, in the third embodiment described above, the
(Modification)
In the embodiment described above, an example of the matching calculation based on the density histograms H 24 and H 22 , an example of the matching calculation based on the density inertia moments M 24 and M 22, and the matching based on the area density difference D 24 and D 22 Although the example of each calculation was demonstrated, this invention is not limited to this. The present invention can also be applied to a case where a matching operation is performed by combining two arbitrary types. Alternatively, cross-correlation, minimum residual and density histogram may be combined.
また、上記した実施形態では、演算用の部分画像24とテンプレート画像22の形状が矩形状である例を説明したが、本発明はこれに限定されない。部分画像24とテンプレート画像22は、矩形状である必要はない。他の形状でも本質的な処理は同じである。
さらに、上記した実施形態では、図1の観察装置10のような光学顕微鏡装置を例にテンプレートマッチングの説明を行ったが、本発明はこれに限定されない。その他、試料の局所領域を電子線で走査して画像を取り込む電子顕微鏡装置にも、本発明を適用できる。試料の局所領域の画像に限らず、試料の全面の画像を一括で取り込む装置にも、本発明を適用できる。観察装置10などに接続された外部のコンピュータを用いた場合でも、同様の効果を得ることができる。
In the above-described embodiment, the example in which the shapes of the
Furthermore, in the above-described embodiment, the template matching has been described by taking an optical microscope apparatus such as the observation apparatus 10 in FIG. 1 as an example, but the present invention is not limited to this. In addition, the present invention can also be applied to an electron microscope apparatus that scans a local region of a sample with an electron beam and captures an image. The present invention can be applied not only to an image of a local region of a sample but also to an apparatus that captures an image of the entire surface of the sample at once. Even when an external computer connected to the observation apparatus 10 or the like is used, the same effect can be obtained.
また、上記した実施形態では、図1の観察装置10のカメラ13から取り込んだ入力画像(画像情報を含む二次元の入力信号)に対してテンプレートマッチングを行う例について説明したが、本発明はこれに限定されない。その他、音声情報を含む一次元の入力信号(入力音声)に対してテンプレートマッチングを行う場合(信号処理)にも、本発明を適用できる。一次元の入力信号を対象とする場合、上述の「画像の濃度」を「信号の強度」に置き換えて考えればよい。「平均濃度」は「平均強度」に対応する。一次元の入力信号の場合には、入力信号に幾何学的変化(縮尺の変化など)があっても正確に合致位置を特定することができる。
In the embodiment described above, an example in which template matching is performed on an input image (a two-dimensional input signal including image information) captured from the
10 観察装置
11 ステージ
12 光学系
13 カメラ
14 画像処理部
21 入力画像
22 テンプレート画像
23 ターゲット
24 演算用の部分画像
DESCRIPTION OF SYMBOLS 10
Claims (4)
前記複数の色成分を含む入力信号の中の異なる複数の位置から演算用の部分信号を抽出する抽出手段と、
前記抽出手段により抽出された前記部分信号の強度のヒストグラムを各色成分ごとに作成する第2の作成手段と、
前記テンプレート信号の各色成分の前記ヒストグラムと前記部分信号の各色成分の前記ヒストグラムとに基づいて、同じ色成分どうしを比較することにより、前記テンプレート信号と前記部分信号との類似度を求める演算手段と、
前記入力信号の各位置で求められた前記類似度を大小比較することにより、前記入力信号の中の前記テンプレート信号との合致位置を特定する特定手段とを備えた
ことを特徴とするテンプレートマッチング装置。 First creating means for creating a histogram of the intensity of a known template signal including a plurality of color components for each color component;
Extraction means for extracting partial signals for calculation from a plurality of different positions in the input signal including the plurality of color components;
Second creation means for creating a histogram of the intensity of the partial signal extracted by the extraction means for each color component;
An arithmetic means for obtaining a similarity between the template signal and the partial signal by comparing the same color components based on the histogram of each color component of the template signal and the histogram of each color component of the partial signal; ,
A template matching device comprising: specifying means for specifying a matching position with the template signal in the input signal by comparing the similarity obtained at each position of the input signal. .
前記複数の色成分を含む入力信号の中の異なる複数の位置から演算用の部分信号を抽出する抽出手段と、
前記抽出手段により抽出された前記部分信号の強度の慣性モーメントを各色成分ごとに算出する第2の算出手段と、
前記テンプレート信号の各色成分の前記慣性モーメントと前記部分信号の各色成分の前記慣性モーメントとに基づいて、同じ色成分どうしを比較することにより、前記テンプレート信号と前記部分信号との類似度を求める演算手段と、
前記入力信号の各位置で求められた前記類似度を大小比較することにより、前記入力信号の中の前記テンプレート信号との合致位置を特定する特定手段とを備えた
ことを特徴とするテンプレートマッチング装置。 First calculating means for calculating, for each color component, a moment of inertia of the intensity of a known template signal including a plurality of color components;
Extraction means for extracting partial signals for calculation from a plurality of different positions in the input signal including the plurality of color components;
Second calculating means for calculating the moment of inertia of the intensity of the partial signal extracted by the extracting means for each color component;
An operation for obtaining similarity between the template signal and the partial signal by comparing the same color components based on the inertia moment of each color component of the template signal and the inertia moment of each color component of the partial signal. Means,
A template matching device comprising: specifying means for specifying a matching position with the template signal in the input signal by comparing the similarity obtained at each position of the input signal. .
入力信号の中の異なる複数の位置から演算用の部分信号を抽出する抽出手段と、
前記抽出手段により抽出された前記部分信号の前記第1範囲と前記第2範囲との各々における平均強度の差を算出する第2の算出手段と、
前記テンプレート信号の前記平均強度の差と前記部分信号の前記平均強度の差とに基づいて、前記テンプレート信号と前記部分信号との類似度を求める演算手段と、
前記入力信号の各位置で求められた前記類似度を大小比較することにより、前記入力信号の中の前記テンプレート信号との合致位置を特定する特定手段とを備えた
ことを特徴とするテンプレートマッチング装置。 First calculating means for calculating a difference in average intensity in each of a predetermined first range and a second range of a known template signal;
Extraction means for extracting partial signals for calculation from a plurality of different positions in the input signal;
Second calculating means for calculating a difference in average intensity in each of the first range and the second range of the partial signal extracted by the extracting means;
An arithmetic means for obtaining a similarity between the template signal and the partial signal based on the difference in average intensity of the template signal and the difference in average intensity of the partial signal;
A template matching device comprising: specifying means for specifying a matching position with the template signal in the input signal by comparing the similarity obtained at each position of the input signal. .
前記複数の色成分を含む入力信号の中の異なる複数の位置から演算用の部分信号を抽出する抽出手段と、
前記抽出手段により抽出された前記部分信号の前記第1範囲と前記第2範囲との各々における平均強度の差を各色成分ごとに算出する第2の算出手段と、
前記テンプレート信号の各色成分の前記平均強度の差と前記部分信号の各色成分の前記平均強度の差とに基づいて、同じ色成分どうしを比較することにより、前記テンプレート信号と前記部分信号との類似度を求める演算手段と、
前記入力信号の各位置で求められた前記類似度を大小比較することにより、前記入力信号の中の前記テンプレート信号との合致位置を特定する特定手段とを備えた
ことを特徴とするテンプレートマッチング装置。 First calculating means for calculating, for each color component, a difference in average intensity in each of a predetermined first range and a second range of a known template signal including a plurality of color components;
Extraction means for extracting partial signals for calculation from a plurality of different positions in the input signal including the plurality of color components;
Second calculation means for calculating, for each color component, a difference in average intensity between each of the first range and the second range of the partial signal extracted by the extraction means;
Similarity between the template signal and the partial signal is made by comparing the same color components based on the difference in average intensity of the color components of the template signal and the difference in average intensity of the color components of the partial signal. A computing means for determining the degree;
A template matching device comprising: specifying means for specifying a matching position with the template signal in the input signal by comparing the similarity obtained at each position of the input signal. .
Priority Applications (1)
| Application Number | Priority Date | Filing Date | Title |
|---|---|---|---|
| JP2004108749A JP2005293334A (en) | 2004-04-01 | 2004-04-01 | Template matching device |
Applications Claiming Priority (1)
| Application Number | Priority Date | Filing Date | Title |
|---|---|---|---|
| JP2004108749A JP2005293334A (en) | 2004-04-01 | 2004-04-01 | Template matching device |
Publications (1)
| Publication Number | Publication Date |
|---|---|
| JP2005293334A true JP2005293334A (en) | 2005-10-20 |
Family
ID=35326183
Family Applications (1)
| Application Number | Title | Priority Date | Filing Date |
|---|---|---|---|
| JP2004108749A Pending JP2005293334A (en) | 2004-04-01 | 2004-04-01 | Template matching device |
Country Status (1)
| Country | Link |
|---|---|
| JP (1) | JP2005293334A (en) |
Cited By (11)
| Publication number | Priority date | Publication date | Assignee | Title |
|---|---|---|---|---|
| WO2007072678A1 (en) | 2005-12-21 | 2007-06-28 | Nikon Corporation | Image combining method, image combining program, image combining device, template extracting method, and template extracting program |
| WO2007125866A1 (en) | 2006-04-28 | 2007-11-08 | Nikon Corporation | Object extracting method, object pursuing method, image synthesizing method, computer program for extracting object, computer program for pursuing object, computer program for synthesizing images, object extracting device, object pursuing device, and image synthesizing device |
| WO2008111290A1 (en) * | 2007-03-13 | 2008-09-18 | Nikon Corporation | Template matching device, camera with template matching device, and program for allowing computer to carry out template matching |
| JP2009199250A (en) * | 2008-02-20 | 2009-09-03 | Dainippon Printing Co Ltd | Object detection system |
| JP2009199176A (en) * | 2008-02-19 | 2009-09-03 | Dainippon Printing Co Ltd | Object detection system |
| JP2009205421A (en) * | 2008-02-27 | 2009-09-10 | Dainippon Printing Co Ltd | Object detection system |
| JP2009205638A (en) * | 2008-02-29 | 2009-09-10 | Dainippon Printing Co Ltd | Object detection system |
| JP2009211657A (en) * | 2008-03-06 | 2009-09-17 | Dainippon Printing Co Ltd | Object detection system |
| JP2011040070A (en) * | 2009-08-18 | 2011-02-24 | General Electric Co <Ge> | System, method and program product for camera-based object analysis |
| JP2013073452A (en) * | 2011-09-28 | 2013-04-22 | Nihon Yamamura Glass Co Ltd | Boxed article inspection method and boxed article inspection device |
| WO2022054450A1 (en) * | 2020-09-14 | 2022-03-17 | ソニーセミコンダクタソリューションズ株式会社 | Signal processing device, imaging device, and signal processing method |
Citations (5)
| Publication number | Priority date | Publication date | Assignee | Title |
|---|---|---|---|---|
| JPH0676062A (en) * | 1992-06-24 | 1994-03-18 | Mitsubishi Electric Corp | Image processing device |
| JPH06231254A (en) * | 1993-02-03 | 1994-08-19 | Kokusai Denshin Denwa Co Ltd <Kdd> | High-speed recognition search method for moving images |
| JPH11340115A (en) * | 1998-05-21 | 1999-12-10 | Nikon Corp | Pattern matching method and exposure method using the same |
| JP2002150287A (en) * | 2000-11-07 | 2002-05-24 | Minolta Co Ltd | Image detecting device, image detecting method, digital camera and printer |
| JP2004062631A (en) * | 2002-07-30 | 2004-02-26 | Matsushita Electric Ind Co Ltd | Pattern matching method and apparatus, and recording medium storing program executed therein |
-
2004
- 2004-04-01 JP JP2004108749A patent/JP2005293334A/en active Pending
Patent Citations (5)
| Publication number | Priority date | Publication date | Assignee | Title |
|---|---|---|---|---|
| JPH0676062A (en) * | 1992-06-24 | 1994-03-18 | Mitsubishi Electric Corp | Image processing device |
| JPH06231254A (en) * | 1993-02-03 | 1994-08-19 | Kokusai Denshin Denwa Co Ltd <Kdd> | High-speed recognition search method for moving images |
| JPH11340115A (en) * | 1998-05-21 | 1999-12-10 | Nikon Corp | Pattern matching method and exposure method using the same |
| JP2002150287A (en) * | 2000-11-07 | 2002-05-24 | Minolta Co Ltd | Image detecting device, image detecting method, digital camera and printer |
| JP2004062631A (en) * | 2002-07-30 | 2004-02-26 | Matsushita Electric Ind Co Ltd | Pattern matching method and apparatus, and recording medium storing program executed therein |
Cited By (15)
| Publication number | Priority date | Publication date | Assignee | Title |
|---|---|---|---|---|
| WO2007072678A1 (en) | 2005-12-21 | 2007-06-28 | Nikon Corporation | Image combining method, image combining program, image combining device, template extracting method, and template extracting program |
| US8254630B2 (en) | 2006-04-28 | 2012-08-28 | Nikon Corporation | Subject extracting method and device by eliminating a background region using binary masks |
| WO2007125866A1 (en) | 2006-04-28 | 2007-11-08 | Nikon Corporation | Object extracting method, object pursuing method, image synthesizing method, computer program for extracting object, computer program for pursuing object, computer program for synthesizing images, object extracting device, object pursuing device, and image synthesizing device |
| WO2008111290A1 (en) * | 2007-03-13 | 2008-09-18 | Nikon Corporation | Template matching device, camera with template matching device, and program for allowing computer to carry out template matching |
| JP5099120B2 (en) * | 2007-03-13 | 2012-12-12 | 株式会社ニコン | Template matching device, camera equipped with template matching device, computer matching program for computer |
| US8260058B2 (en) | 2007-03-13 | 2012-09-04 | Nikon Corporation | Template matching device, camera with template matching device, and program for allowing computer to carry out template matching |
| JP2009199176A (en) * | 2008-02-19 | 2009-09-03 | Dainippon Printing Co Ltd | Object detection system |
| JP2009199250A (en) * | 2008-02-20 | 2009-09-03 | Dainippon Printing Co Ltd | Object detection system |
| JP2009205421A (en) * | 2008-02-27 | 2009-09-10 | Dainippon Printing Co Ltd | Object detection system |
| JP2009205638A (en) * | 2008-02-29 | 2009-09-10 | Dainippon Printing Co Ltd | Object detection system |
| JP2009211657A (en) * | 2008-03-06 | 2009-09-17 | Dainippon Printing Co Ltd | Object detection system |
| JP2011040070A (en) * | 2009-08-18 | 2011-02-24 | General Electric Co <Ge> | System, method and program product for camera-based object analysis |
| JP2013073452A (en) * | 2011-09-28 | 2013-04-22 | Nihon Yamamura Glass Co Ltd | Boxed article inspection method and boxed article inspection device |
| WO2022054450A1 (en) * | 2020-09-14 | 2022-03-17 | ソニーセミコンダクタソリューションズ株式会社 | Signal processing device, imaging device, and signal processing method |
| US12323699B2 (en) | 2020-09-14 | 2025-06-03 | Sony Semiconductor Solutions Corporation | Signal processing device, imaging device, and signal processing method |
Similar Documents
| Publication | Publication Date | Title |
|---|---|---|
| CN111028213B (en) | Image defect detection method, device, electronic device and storage medium | |
| CN108229490B (en) | Key point detection method, neural network training method, device and electronic equipment | |
| CN108805023B (en) | An image detection method, device, computer equipment and storage medium | |
| EP3509034A1 (en) | Image filtering based on image gradients | |
| CN113609984A (en) | Pointer instrument reading identification method and device and electronic equipment | |
| KR102073468B1 (en) | System and method for scoring color candidate poses against a color image in a vision system | |
| JP2006066478A (en) | Pattern matching device and scanning electron microscope using the same | |
| US7702157B2 (en) | Pattern evaluation method, pattern matching method and computer readable medium | |
| WO2017221592A1 (en) | Image processing device, image processing method, and image processing program | |
| CN105894441A (en) | Image matching method and device | |
| KR102195826B1 (en) | Keypoint identification | |
| CN116452965B (en) | An underwater target detection and recognition method based on acoustic-optical fusion | |
| US8873839B2 (en) | Apparatus of learning recognition dictionary, and method of learning recognition dictionary | |
| JP2005293334A (en) | Template matching device | |
| CN118379696B (en) | Ship target detection method, device and readable storage medium | |
| JP2005352543A (en) | Template matching device | |
| CN102713974A (en) | Learning device, identification device, learning identification system and learning identification device | |
| JP5099120B2 (en) | Template matching device, camera equipped with template matching device, computer matching program for computer | |
| CN118037619A (en) | Defect detection method, device, equipment, system and storage medium | |
| JP5076567B2 (en) | Template matching device, camera equipped with template matching device, computer matching program for computer | |
| JP5401605B2 (en) | Template matching processing apparatus and template matching processing program | |
| CN117474932B (en) | Object segmentation method and device, electronic equipment and storage medium | |
| CN116433502B (en) | Anisotropic depth image restoration method integrating dual-mode inverse certainty | |
| JPH07146937A (en) | Pattern matching method | |
| JP2023019794A (en) | Material structure analysis method and analysis system |
Legal Events
| Date | Code | Title | Description |
|---|---|---|---|
| A621 | Written request for application examination |
Free format text: JAPANESE INTERMEDIATE CODE: A621 Effective date: 20070213 |
|
| A977 | Report on retrieval |
Free format text: JAPANESE INTERMEDIATE CODE: A971007 Effective date: 20091210 |
|
| A131 | Notification of reasons for refusal |
Free format text: JAPANESE INTERMEDIATE CODE: A131 Effective date: 20091215 |
|
| A521 | Written amendment |
Free format text: JAPANESE INTERMEDIATE CODE: A523 Effective date: 20100127 |
|
| A131 | Notification of reasons for refusal |
Free format text: JAPANESE INTERMEDIATE CODE: A131 Effective date: 20100330 |
|
| A02 | Decision of refusal |
Free format text: JAPANESE INTERMEDIATE CODE: A02 Effective date: 20101019 |