JP2005292041A - Chemical substance emission prediction calculation system and method - Google Patents
Chemical substance emission prediction calculation system and method Download PDFInfo
- Publication number
- JP2005292041A JP2005292041A JP2004110190A JP2004110190A JP2005292041A JP 2005292041 A JP2005292041 A JP 2005292041A JP 2004110190 A JP2004110190 A JP 2004110190A JP 2004110190 A JP2004110190 A JP 2004110190A JP 2005292041 A JP2005292041 A JP 2005292041A
- Authority
- JP
- Japan
- Prior art keywords
- emission
- chemical
- concentration
- chemical substances
- atmosphere
- Prior art date
- Legal status (The legal status is an assumption and is not a legal conclusion. Google has not performed a legal analysis and makes no representation as to the accuracy of the status listed.)
- Granted
Links
Images

Landscapes
- Management, Administration, Business Operations System, And Electronic Commerce (AREA)
Abstract
【課題】本発明の課題は、大気中の化学物質測定濃度が異常高濃度を示した場合、大気中の化学物質が放出される排出源からの化学物質排出量の予測計算を行い、大気中化学物質の異常高濃度の原因となる排出源を特定する化学物質排出量予測計算システムを提供することにある。
【解決手段】本発明は、大気観測局において前もって測定された大気中の化学物質濃度が異常高濃度を示さない期間に、排出源から放出される平常時排出量を入力する入力部と、大気中の化学物質濃度が異常高濃度を示した期間に排出源から放出された化学物質の異常時排出量を出力する出力部とを具備し、排出源の(平常時排出量−異常時排出量)の2乗の和が最小となる解を求めることにより、大気中の化学物質の異常高濃度の原因となる排出源を特定することを特徴とするものである。
【選択図】 図1An object of the present invention is to predict the amount of chemical substances emitted from an emission source from which atmospheric chemical substances are released when the measured concentration of chemical substances in the atmosphere shows an abnormally high concentration. The object is to provide a chemical substance emission prediction calculation system that identifies an emission source that causes an abnormally high concentration of chemical substances.
The present invention relates to an input unit for inputting a normal emission amount released from an emission source during a period when the concentration of chemical substances in the atmosphere measured in advance at the atmospheric observation station does not show an abnormally high concentration, Output unit that outputs the amount of abnormal discharge of chemical substances released from the emission source during the period when the concentration of chemical substances in the inside showed an abnormally high concentration. ) To determine the emission source that causes an abnormally high concentration of chemical substances in the atmosphere by obtaining a solution that minimizes the sum of squares.
[Selection] Figure 1
Description
本発明は、大気観測局においてある期間に測定された大気中の化学物質濃度が定められた基準値以上の異常高濃度を示した場合の化学物質排出量予測計算システムおよび方法に関し、例えば大気シミュレーション、大気中の化学物質濃度計算、環境リスクアセスメント、市民の健康管理の分野で応用されるものである。 The present invention relates to a system and method for predicting a chemical substance emission amount when a chemical substance concentration in the atmosphere measured in a certain period at an atmospheric observation station shows an abnormally high concentration that is equal to or higher than a predetermined reference value. It is applied in the fields of atmospheric chemical concentration calculation, environmental risk assessment, and civic health management.
大気観測局において法律で定められた基準値より高濃度(異常高濃度)の化学物質が検出された場合、排出源の排出量を予測計算する手段は従来技術では存在しない。現状では、原因となる排出源を特定するために、すべての排出源から放出される化学物質の排出量を調査するか、過去の経験をもとに、原因となる排出源を特定する方法を用いてきた。 There is no means in the prior art for predicting and calculating the emission amount of an emission source when a chemical substance having a concentration (abnormally high concentration) higher than the reference value stipulated by law is detected by the Atmospheric Observation Station. At present, in order to identify the source of the cause, either the amount of chemical substances released from all sources is investigated, or a method to identify the source of the cause based on past experience. Have been used.
図5は従来の大気中の化学物質濃度が異常高濃度の場合に行われてきた排出源を特定する手順を示すフローチャートである。 FIG. 5 is a flowchart showing a procedure for specifying an emission source that has been performed when the concentration of chemical substances in the atmosphere is abnormally high.
すなわち、すべての処理はステップM00よりスタートする。ステップM00の起動時刻は一定時間毎でも任意の時刻でもなんでもよい。ステップM01以降の処理は、全ての大気観測局の大気中の化学物質濃度を調べる処理である。ステップM01において観測点の指標となる変数nrMに1を代入する。ステップM02において変数nrMが大気観測局数Nr以下であるか否かを判断する。大気観測局数Nr以下であれば処理をステップM03に移す。大気観測局数Nr以下でなければ全ての観測局の調査が完了したので、処理をステップM10へ移し、メインルーチンを終了する。ステップM03において大気観測局数NrMでの測定濃度Cr(nrM)が基準値Ctより大か否かを判断する。大であれば大気中の化学物質濃度が異常高濃度であるのでステップM04においてアラームを出し、ステップM05に移す。大でなければ大気中の化学物質濃度が正常値なので処理をステップM06へ移す。ステップM05では排出源を人手により調査し特定する。排出源の調査が終了したら処理をステップM06へ移す。ステップM06では大気観測局数nrMを1増加させる。 That is, all processing starts from step M00. The activation time of step M00 may be any fixed time or arbitrary time. The processing after Step M01 is processing for examining the chemical substance concentration in the atmosphere of all atmospheric observation stations. In step M01, 1 is substituted into a variable n rM that serves as an index of the observation point. In step M02, it is determined whether or not the variable n rM is equal to or less than the number of atmospheric observation stations N r . The process equal to or less than atmospheric observation station number N r moves to step M03. If the number of atmospheric observation stations is not less than Nr , the survey of all the observation stations is completed, and the process proceeds to step M10 and the main routine is terminated. In step M03, it is determined whether or not the measured concentration C r (n rM ) at the atmospheric observation station number N rM is larger than the reference value C t . If it is larger, the chemical substance concentration in the atmosphere is abnormally high, so an alarm is issued in step M04 and the process proceeds to step M05. If not, the chemical substance concentration in the atmosphere is normal, and the process proceeds to step M06. In step M05, the emission source is manually investigated and specified. When the examination of the emission source is completed, the process proceeds to step M06. In step M06, the number of atmospheric observation stations n rM is increased by one.
このため、排出源の特定に大量の時間を要し、場合によっては、特定できない場合が生じており、大気中への化学物質の排出濃度削減の迅速な指導・命令の実現に支障をきたしてきた。 For this reason, it takes a lot of time to identify the emission source, and in some cases, it may not be possible to identify the emission source, which hinders the realization of prompt guidance and instructions for reducing the emission concentration of chemical substances into the atmosphere. It was.
大気観測局における大気中の化学物質の測定濃度より、その化学物質の排出源からの排出量を予測計算することは、従来は実現できなかった。 Previously, it was impossible to predict and calculate the emission amount of chemical substances from the measured concentrations of chemical substances in the atmosphere at the Atmospheric Observation Station.
図6は従来システムの入出力関係を示す構成説明図である。従来技術では、大気中の化学物質の測定濃度、大気観測局の位置座標、化学物質が大気中に放出される排出源の煙突高度と煙の拡散幅、排出源の位置座標、前記時刻における排出源の風速、風向のみを入力とした。 FIG. 6 is an explanatory diagram showing the input / output relationship of the conventional system. In the prior art, the measured concentration of chemical substances in the atmosphere, the position coordinates of the atmospheric observation station, the chimney height and smoke diffusion width of the emission source from which the chemical substances are released into the atmosphere, the position coordinates of the emission source, the emission at the above time Only the wind speed and direction of the source were input.
これらの入力値を用いて、大気中に化学物質を放出する排出源からの化学物質からの排出量と大気中の化学物質濃度の関係を近似式により表し連立方程式を作ると、変数である排出量の数よりも連立方程式の数が少ないという問題が生じる。化学物質の大気中濃度の観測点数Nrが、化学物質の排出源数Nsよりも少ない(Nr<Ns)からである。以下に例を挙げて説明する。 By using these input values and representing the relationship between the amount of emissions from chemical substances that emit chemical substances into the atmosphere and the concentration of chemical substances in the atmosphere using an approximate expression, a simultaneous equation is created. The problem arises that the number of simultaneous equations is less than the number of quantities. Observation number N r of atmospheric concentrations of chemicals, is from less than the emission source number N s of chemicals (N r <N s). An example will be described below.
排出源からの排出量と観測点における化学物質の濃度値は、下記のようなパフモデル(線形の近似式)で表現される。

ここで、Qs(ns)は排出源nsの排出濃度、coeff(ns,nr)は排出源nsの風速、風向、有効煙突高度、観測点との相対座標、拡散幅と大気観測局nrの高度にする定数である。現状では、地方公共団体に設置されている大気中の化学物質濃度の観測点数Nrが、化学物質の排出源数Nsよりも少ない(Nr<Ns)。制約式である連立方程式の数がNr、変数である化学物質濃度の数がNsであるので、連立方程式の数が変数の数より少ない。 Here, Q s (n s) is emission concentration emission sources n s, coeff (n s, n r) is the wind speed of the emission sources n s, wind direction, the effective chimney height, relative coordinates of the observation point, and diffusion width It is a constant that makes the altitude of the atmospheric observation station n r . At present, observation number N r of the chemical concentration in the atmosphere that has been installed in the local public organizations, less than the emission source number N s of the chemical substance (N r <N s). Since the number of simultaneous equations that are constraint equations is N r and the number of chemical substance concentrations that are variables is N s , the number of simultaneous equations is smaller than the number of variables.
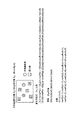
図7は従来の大気観測局の数が排出源の数より少ない場合の例を示す説明図である。すなわち、大気観測局の数Nr=2が排出源の数Ns=5より少なく、連立方程式の個数(Nr)よりも、変数の個数(Ns)が多いため、変数の値を決定することができない。 FIG. 7 is an explanatory diagram showing an example where the number of conventional atmospheric observation stations is smaller than the number of emission sources. That is, since the number of atmospheric observation stations N r = 2 is smaller than the number of emission sources N s = 5 and the number of variables (N s ) is larger than the number of simultaneous equations (N r ), the value of the variable is determined. Can not do it.
排出源からの排出量と観測点における化学物質の濃度値を(式1)のような線形の近似式で表現せず、非線形の式で表現した場合には、大気中の化学物質の測定濃度、大気観測局の位置座標、化学物質が大気中に放出される排出源の煙突高度と煙の拡散幅、排出源の位置座標、前記時刻における排出源の風速、風向のみを入力としている限りにおいては、さらに問題は複雑となり排出源から発生する化学物質濃度の解を求めることはできない。
本発明は上記の事情に鑑みてなされたもので、排出濃度削減の迅速な指導・命令の実現のため、大気中の化学物質測定濃度が異常高濃度を示した場合、大気中の化学物質が放出される排出源からの化学物質排出量の予測計算を行い、大気中化学物質の異常高濃度の原因となる排出源を特定する化学物質排出量予測計算システムおよび方法を提供することを目的とする。 The present invention has been made in view of the above circumstances, and in order to achieve prompt guidance and instructions for emission concentration reduction, when the measured chemical concentration in the atmosphere shows an abnormally high concentration, the chemical in the atmosphere The purpose of the present invention is to provide a chemical substance emission prediction calculation system and method for predicting and calculating chemical substance emissions from released sources, and for identifying the emission sources that cause abnormally high concentrations of atmospheric chemical substances. To do.
上記目的を達成するために本発明は、大気観測局においてある期間に測定された大気中の化学物質濃度が定められた基準値以上の異常高濃度を示した場合の化学物質排出量予測計算システムであって、大気中の化学物質の測定濃度、大気観測局の位置座標、化学物質が大気中に放出される排出源の煙突高度と煙の拡散幅、排出源の位置座標、排出源の風速、風向と、大気観測局において前もって測定された大気中の化学物質濃度が異常高濃度を示さない期間に、排出源から放出される平常時排出量を入力する入力手段と、大気中の化学物質濃度が異常高濃度を示した期間に排出源から放出された化学物質の異常時排出量を出力する出力手段とを具備し、排出源の(平常時排出量−異常時排出量)の2乗の和が最小となる解を求めることにより、大気中の化学物質の異常高濃度の原因となる排出源を特定することを特徴とするものである。 In order to achieve the above object, the present invention provides a system for predicting and calculating the amount of chemical substances emitted when the concentration of chemical substances in the atmosphere measured over a period of time at an atmospheric observation station shows an abnormally high concentration exceeding a predetermined reference value. The measured concentration of chemical substances in the atmosphere, the position coordinates of the atmospheric observation station, the chimney height and smoke diffusion width of the emission source from which chemical substances are released into the atmosphere, the position coordinates of the emission source, the wind speed of the emission source Input means for inputting the normal emission amount released from the emission source during the period when the wind direction and the atmospheric chemical concentration measured in advance by the Atmospheric Observation Station do not show an abnormally high concentration, and chemical substances in the atmosphere Output means for outputting the abnormal discharge amount of the chemical substance released from the discharge source during the period when the concentration showed an abnormally high concentration, and the square of the discharge source (normal discharge amount-abnormal discharge amount) By finding the solution that minimizes the sum of It is characterized in that to identify the emission sources causing abnormally high concentration of the chemical in the atmosphere.
また本発明は、前記化学物質排出量予測計算システムにおいて、入力する化学物質の平常時排出量データとして、法律・規制により届出された化学物質の排出源の平均排出量データを用いることを特徴とするものである。 Further, the present invention is characterized in that, in the chemical substance emission amount prediction calculation system, the average emission amount data of the emission source of the chemical substance notified by law / regulation is used as the normal emission data of the input chemical substance. To do.
また本発明は、前記化学物質排出量予測計算システムにおいて、入力する化学物質の平常時排出量データとして、排出源の化学物質排出量の実測値に統計処理を施して得られた平均排出量データを用いることを特徴とするものである。 Further, the present invention provides an average emission data obtained by subjecting an actual measurement value of a chemical emission amount of an emission source to statistical processing as normal emission data of an input chemical substance in the chemical substance emission prediction calculation system. It is characterized by using.
また本発明は、大気観測局においてある期間に測定された大気中の化学物質濃度が定められた基準値以上の異常高濃度を示した場合の化学物質排出量予測計算方法であって、大気中の化学物質の測定濃度、大気観測局の位置座標、化学物質が大気中に放出される排出源の煙突高度と煙の拡散幅、排出源の位置座標、排出源の風速、風向と、大気観測局において前もって測定された大気中の化学物質濃度が異常高濃度を示さない期間に、排出源から放出される平常時排出量を入力とし、大気中の化学物質濃度が異常高濃度を示した期間に排出源から放出された化学物質の異常時排出量を出力し、排出源の(平常時排出量−異常時排出量)の2乗の和が最小となる解を求めることにより、大気中の化学物質の異常高濃度の原因となる排出源を特定することを特徴とする。 The present invention also relates to a method for calculating and predicting the amount of chemical substances emitted when the concentration of chemical substances in the atmosphere measured over a period of time at an atmospheric observation station shows an abnormally high concentration that exceeds a predetermined reference value. Measurement concentrations of chemical substances, position coordinates of atmospheric observation stations, chimney height and smoke diffusion width of emission sources from which chemical substances are released into the atmosphere, position coordinates of emission sources, wind speeds, wind directions, and atmospheric observations of emission sources Period when atmospheric chemical substance concentration measured in advance in the station does not show abnormally high concentration, and normal emission amount released from the emission source is input, and atmospheric chemical substance concentration shows abnormally high concentration By outputting the abnormal emission amount of the chemical substance released from the emission source, and finding the solution that minimizes the sum of the squares of the emission source (normal emission amount-abnormal emission amount) Identifying sources that cause abnormally high concentrations of chemicals And wherein the Rukoto.
また本発明は、前記化学物質排出量予測計算方法において、入力する化学物質の平常時排出量データとして、法律・規制により届出された化学物質の排出源の平均排出量データを用いることを特徴とする。 Further, the present invention is characterized in that, in the chemical substance emission amount prediction calculation method, the average emission amount data of the chemical substance source notified by law / regulation is used as the normal emission data of the input chemical substance. To do.
また本発明は、前記化学物質排出量予測計算方法において、入力する化学物質の平常時排出量データとして、排出源の化学物質排出量の実測値に統計処理を施して得られた平均排出量データを用いることを特徴とする。 According to the present invention, in the chemical substance emission prediction method, the average emission data obtained by subjecting the measured value of the chemical emission of the emission source to statistical processing as the normal emission data of the input chemical substance. It is characterized by using.
本発明の化学物質排出量予測計算システムおよび方法は、大気中の化学物質の平常時濃度を入力して、排出源からの排出濃度を予測計算することができ、排出源の特定にかかる時間を現状より削減できるため、排出濃度削減の迅速な指導・命令の実現が可能となる。 The chemical substance emission prediction calculation system and method of the present invention can input the normal concentration of the chemical substance in the atmosphere and predict and calculate the emission concentration from the emission source. Since it can be reduced from the current level, it is possible to promptly provide instructions and orders for emission concentration reduction.
以下図面を参照して本発明の実施の形態例を詳細に説明する。 Embodiments of the present invention will be described below in detail with reference to the drawings.
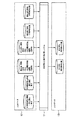
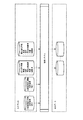
図1は本発明の実施形態例に係る化学物質排出量予測計算システムを示す構成説明図である。すなわち、化学物質排出量予測計算システム11は、大気観測局においてある期間に測定された大気中の化学物質濃度が定められた基準値以上の異常高濃度を示した場合の化学物質排出量予測計算システムであって、大気中の化学物質の測定濃度、大気観測局の位置座標、化学物質が大気中に放出される排出源の煙突高度と煙の拡散幅、排出源の位置座標、排出源の風速、風向と、大気観測局において前もって測定された大気中の化学物質濃度が異常高濃度を示さない期間に、排出源から放出される平常時排出量を入力データ12として入力する入力部と、大気中の化学物質濃度が異常高濃度を示した期間に排出源から放出された化学物質の異常時排出量を出力データ13として出力する出力部とを具備し、排出源の(平常時排出量−異常時排出量)の2乗の和が最小となる解を求めることにより、大気中の化学物質の異常高濃度の原因となる排出源を特定することを特徴とするものである。ここで、異常時排出量、平常時排出量とは、環境基準
に定められる数値を境に、大気観測局の測定値が基準を満たしていないときが異常時、満たしているときが平常時とする。 When the measured value of the atmospheric observation station does not meet the standard, the normal value is when the measured value does not meet the standard.
前記入力データの化学物質の平常時排出量データとして、法律・規制により届出された化学物質の排出源の平均排出量データを用いることができる。また、前記入力データの化学物質の平常時排出量データとして、排出源の化学物質排出量の実測値に統計処理を施して得られた平均排出量データを用いることができる。 As the normal emission data of the chemical substance in the input data, the average emission data of the emission source of the chemical substance notified by law / regulation can be used. Further, as the normal emission data of the chemical substance of the input data, average emission data obtained by performing statistical processing on the actual measurement value of the chemical emission of the emission source can be used.
大気観測局において前もって測定された大気中の化学物質濃度が異常高濃度を示さない期間(平常時)に、排出源から放出される化学物質排出量に統計処理を施した平常時排出量を入力として用いることを特徴とする。これとともに従来用いてきた、気中の化学物質の測定濃度、大気観測局の位置座標、化学物質が大気中に放出される排出源の煙突高度と煙の拡散幅、排出源の位置座標、前記時刻における排出源の風速、風向を入力とし、排出源から放出される化学物質の異常時排出量を予測計算して出力する。 During normal periods when chemical concentrations in the atmosphere measured in advance by the Atmospheric Observation Station do not show abnormally high concentrations, enter the normal emissions that have been subjected to statistical processing on the emissions of chemical substances released from the emission sources. It is used as. Along with this, the measured concentration of chemical substances in the air, the position coordinates of the atmospheric observation station, the chimney height and smoke diffusion width of the emission source from which the chemical substances are released into the atmosphere, the position coordinates of the emission source, Using the wind speed and direction of the emission source at the time as input, the abnormal emission amount of the chemical substance released from the emission source is predicted and output.
本実施形態例では数学的最適化手法を用いて、全ての排出源における平常時排出量との差が最も小さい異常時排出量を求める。化学物質の平常時排出量としては、排出源についてのPRTRデータ、地方公共団体に届出されている年間や月間の平均排出量、各排出源(工場)独自に測定した排出量をもとに統計的操作(平均計算)を施して求める。 In the present embodiment example, a mathematical optimization method is used to obtain the abnormal emission amount having the smallest difference from the normal emission amount in all the emission sources. The normal amount of chemical substances released is based on PRTR data on emission sources, average annual and monthly emissions reported to local governments, and emissions measured independently for each emission source (factory). Obtained by performing manual operation (average calculation).
大気中の化学物質濃度の測定値より、排出源より放出される化学物質の排出量を求める問題は非線形問題に帰着する。まず一般的な非線形問題とは以下により定義される。 The problem of obtaining the amount of chemical substance released from the emission source from the measured value of chemical substance concentration in the atmosphere results in a nonlinear problem. First, a general nonlinear problem is defined as follows.
一般的な非線形問題(nonlinear programming):
f:Rn→R1,gi:Rn→R1,i=1,…,m;hj:Rn→R1,j=1,…,lが与えられたとき、制約条件gi(x)≦0,i=1,…,m;hj(x)=0,j=1,…,lの下でf(x)を最小化する問題。これを本文中では以下のように略記する。
f: R n → R 1 , g i : R n → R 1 , i = 1, ..., m; h j : R n → R 1 , j = 1, ..., l The problem of minimizing f (x) under (x) ≦ 0, i = 1,..., m; hj (x) = 0, j = 1,. This is abbreviated as follows in the text.
上記においてfを目的関数、gi(x)≦0,i=1,…,m;hj(x)=0,j=1,…,lを制約関数と呼ぶ。 In the above, f is an objective function, and gi (x) ≦ 0, i = 1,..., M; hj (x) = 0, j = 1,.
特にm=0,1>0の場合に問題1は以下のように書き表される。
問題1′に対しては、古くからラグランジェの未定係数法(method of indeterminate coefficient)により解が得られることが知られている。いま適当な1個の変数、例えばx1,…,xlを選んだとき、方程式hj(x)=0,j=1,…,lが
xt=φt(xl+1,…,xn),t=1,…,l
のように解けるものと仮定すると、f(x1,…,xn)をxl+1,…,xnのみの関数として表現できるから(問題1′)はxl+1,…,xnの制約なし最適化問題に変換することが可能である。この考え方を精密化したものがラグランジェの未定係数法であり、小規模な問題に対しては、(問題1′)を解く方法として昔からよく用いられてきた。
It has been known for a long time that the
xt = φt (x l + 1 , ..., x n ), t = 1, ..., l
Assuming solvable things as, f (x 1, ..., x n) to x l + 1, ..., because it expressed as a function of x n only (problem 1 ') x l + 1, ..., x It can be transformed into an unconstrained optimization problem of n . A refined version of this idea is Lagrange's undetermined coefficient method, and it has been often used as a method for solving (Problem 1 ') for small problems.
大気中の化学物質濃度の観測値を入力とし、全ての排出源における平常時排出量との差が最も小さい異常時排出量を計算する問題は(問題1′)に帰着することができる。はじめにラグランジェ法を用いた問題の解法について説明し、次にこれを用いたシステムについて説明する。 The problem of calculating abnormal emissions with the smallest difference from normal emissions at all emission sources using the observed values of chemical concentration in the atmosphere as the input can be reduced to (Problem 1 '). First, the problem solving method using the Lagrangian method will be described, and then the system using this will be described.
まず、ラグランジェ法を用いた解法について説明する。制約関数について説明する。制約関数は以下のように表すことができる。
ここでQs(ns)は排出源nsの異常時排出量である。nrは観測点を表す指標であり、1≦nr≦Nrを満たす。Nrは観測点の数を表す。制約関数はNr個存在する。 Here, Q s (n s ) is an abnormal discharge amount of the discharge source n s . n r is an index representing an observation point and satisfies 1 ≦ n r ≦ N r . Nr represents the number of observation points. Constraint function is N r pieces exist.
coeff(ns,nr)は、プルームモデルを用いた場合に以下で表される。
ここでus(ns)は排出源nsの煙突高風速、σsy(ns)は排出源nsのy軸方向の拡散幅、σsz(ns)は排出源nsのz軸方向の拡散幅、Ys(ns)は排出源nsのY軸座標、hse(ns)は排出源nsの有効煙突高度、zr(nr)は観測点nrの高さを表す。 Here u s (n s) is stack height wind emission sources n s, sigma sy (n s) is y-axis direction of the diffusion width of the emission sources n s, sigma sz (n s) is z emission sources n s axial diffusion widths, Y s (n s) is Y-axis coordinate of the emission sources n s, h se (n s ) is effective chimney height of emission sources n s, z r (n r ) is the observation point n r Represents the height.
次に目的関数について説明する。平常時排出量に最も近い値の排出量Qs(ns)を求めようとしているので、目的関数は以下で表すことができる。
式はQs(ns)に関する自乗関数であるため、最小値をもつことは保証される。ここで、Qs aver(ns)は平常時排出量を表す。 Since the equation is a square function with respect to Q s (n s ), it is guaranteed to have a minimum value. Where Q s aver (n s) denotes the normal time of emissions.
大気中の化学物質濃度の観測値を入力とし、全ての排出源における平常時排出量との差が最も小さい異常時排出量を計算する問題は、(式2)の目的関数を(式1)の制約条件下で満足する解Qs(ns)を得ることである。問題を解決するためにラグランジェの未定係数法を用いる。 The problem of calculating the abnormal emission with the smallest difference from the normal emission at all emission sources using the observed value of the chemical concentration in the atmosphere as the input is the objective function of (Equation 2) To obtain a solution Q s (n s ) that is satisfied under the constraints. Lagrange's undetermined coefficient method is used to solve the problem.
ラグランジェの未定係数法について説明する。まずラグランジェ関数について説明する。ラグランジェ関数は以下のようになる。
ここで、2λnrはラグランジェ未定乗数である。目的関数(式2)は先に述べたとおり最小値を持つことは保証されるので、ラグランジェ関数(式3)のQs(ns)、λnrについての一階の偏微分関数をもとめ、これらの導関数がゼロに等しくなるようにλnrを設定すれば、そのときのQs(ns)は(式2)を最小にする。 Here, 2λn r is a Lagrange undetermined multiplier. Since the objective function (Equation 2) is to have a minimum value as described above is ensured, Q s (n s) of the Lagrangian (equation 3), determine the first-order partial differential function for lambda] n r If λn r is set so that these derivatives are equal to zero, then Q s (n s ) minimizes (Equation 2).
(式3)のQs(ns)についての一階の偏微分関数がゼロに等しいと置いた式は以下である。
(式4)を解くと、異常時排出量は以下のように表すことができる。
(式3)のλnrについての一階の偏微分関数がゼロに等しいと置いた式は以下である。
(式6)を解くと、下記式を得ることができる。
(式7)の異常時排出量の項Qs(ns)に(式4)を代入すると、下記式が得られる。
(式9)をすべての観測局における式に変換すると連立方程式(式10)になる。
(式10)は変数λnrの個数がNr個、連立方程式の数がNr個であるから、変数λnrの値を決定することができる。(式10)により決定したλnrを(式5)に代入すれば異常時排出量Qs(ns)を得ることができる。 In (Equation 10), since the number of variables λn r is N r and the number of simultaneous equations is N r , the value of the variable λn r can be determined. Can be obtained lambda] n r determined by (Equation 10) the abnormal emissions by substituting the equation (5) Q s (n s) .
次にシステムについて説明する。本実施形態例のシステムは、以下の3部により構成される。 Next, the system will be described. The system according to the present embodiment includes the following three parts.
(1)観測点異常高濃度検出ルーチン(図2)
(2)排出量算出ルーチン(図3)
(3)制約なし最適化問題への帰着(図4)
(1)は大気観測局において、測定された大気中の化学物質濃度が基準値よりも高いか低いかを判断するルーチンである。基準値よりも高い化学物質濃度が観測された場合には(2)の排出量算出ルーチンへ処理を移行する。
(1) Observation point abnormal high concentration detection routine (Fig. 2)
(2) Emission calculation routine (Fig. 3)
(3) Return to the unconstrained optimization problem (Fig. 4)
(1) is a routine for determining whether the measured atmospheric chemical substance concentration is higher or lower than a reference value in the atmospheric observation station. When a chemical substance concentration higher than the reference value is observed, the process proceeds to the emission amount calculation routine of (2).
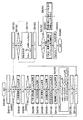
図2はメインルーチンであり、すべての処理はM000よりスタートする。M000の起動時刻は一定時間毎でも任意の時刻でもよい。M010以降の処理は、全ての大気観測局の大気中の化学物質濃度を調べる処理である。M010において観測点の指標となる変数nrMに1を代入する。M020においてnrMが大気観測局数NrM以下であるか否かを判断する。NrM以下であれば処理をM030に移す。NrM以下でなければ全ての観測局の調査が完了したので、処理をM100へ移し、メインルーチンを終了する。M030において大気観測局nrMでの測定濃度Cr(nrM)が基準値Ctより大か否かを判断する。測定濃度Cr(nrM)が基準値Ctより大であれば大気中の化学物質濃度が異常高濃度処理をM040に移す。測定濃度Cr(nrM)が基準値Ctより大でなければ大気中の化学物質濃度が正常値なので処理をM050へ移す。M040では排出源から放出される化学物質の異常時排出量を予測計算する。排出量が予測計算し終わったら処理をM050へ移す。M050ではNrMを1増加させる。 FIG. 2 shows a main routine, and all processes start from M000. The activation time of M000 may be a fixed time or an arbitrary time. The processing after M010 is processing for examining the chemical substance concentration in the atmosphere of all the atmospheric observation stations. In M010, 1 is substituted into a variable n rM that serves as an index of the observation point. In M020, it is determined whether n rM is equal to or less than the number of atmospheric observation stations N rM . If NrM or less, the process proceeds to M030. If it is not less than NrM , the surveys of all the observation stations have been completed, so the process moves to M100 and the main routine is terminated. In M030, it is determined whether or not the measured concentration C r (n rM ) at the atmospheric observation station n rM is larger than the reference value C t . If the measured concentration C r (n rM ) is larger than the reference value C t , the chemical substance concentration in the atmosphere is shifted to M040. If the measured concentration C r (n rM ) is not greater than the reference value C t , the chemical substance concentration in the atmosphere is a normal value, so the process moves to M050. In M040, the abnormal emission amount of the chemical substance released from the emission source is predicted and calculated. When the amount of discharge is estimated and calculated, the process proceeds to M050. In M050, NrM is increased by 1.
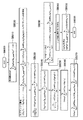
図3は異常時の排出量予測算出ルーチンである。図3中、nrは大気観測局の指標、Nrは大気観測局の総数、Cr(nr)は大気観測局nrでの測定濃度、Zr(nr)は大気観測局の高さ、nsは排出源の指標、Nsは排出源の総数、us(ns)は排出源nsでの煙突高風速、φs(ns)は排出源nsでの排出源風向、ur(nr)は大気観測局nrでの大気観測局風速、φr(nr)は大気観測局nrでの大気観測局風向、Nr(nr)は大気観測局nrでの大気観測局数、Qs(ns)は排出源nsの異常時排出量、Qs aver(ns)は排出源nsの平常時排出量、(Xs(ns),Ys(ns))は排出源nsの座標、hse(ns)は排出源nsの有効煙突高度、us(ns)は排出源nsの煙突高風速、(xr(nr),yr(nr))は大気観測局nrの座標、zr(nr)は大気観測局nrの高さ、σsy(ns),σsz(ns)は排出源nsの拡散幅(Xs(ns)の関数)、Cr(nr)は大気観測局nrの濃度である。 FIG. 3 shows a routine for calculating an emission amount prediction at the time of abnormality. In FIG. 3, n r is an indicator of the atmospheric observation station, N r is the total number of atmospheric observation stations, C r (n r ) is the measured concentration at the atmospheric observation station n r , and Z r (n r ) is the atmospheric observation station indication of height, n s is emission sources, emissions from n s is the total number of emission sources, stack height wind speed at u s (n s) is emission sources n s, phi s (n s) is emission sources n s source wind direction, u r (n r) is atmospheric observation station wind in atmospheric observation station n r, φ r (n r ) is atmospheric observation station wind direction in atmospheric observation station n r, n r (n r ) is atmospheric observation atmospheric observation stations number of stations n r, Q s (n s ) is abnormal emissions of emission sources n s, Q s aver (n s) is normal when emissions of emission sources n s, (X s (n s), Y s (n s)) are coordinates of the emission sources n s, h se (n s) is emission sources n s effective chimney height of, u s (n s) is stack height wind emission sources n s, (x r (n r), y r (n r)) is the coordinates of the atmospheric observation station n r, z r (n r ) is the atmospheric observation station n r height, sigma sy function (n s), σ sz ( n s) is the diffusion width of the emission sources n s (X s (n s )), C r (n r) is This is the concentration of the atmospheric observation station nr .
メインルーチンM040より移行した処理はSA000よりスタートする。スタート後、処理はSA010へ移行する。SA010では変数nrに1を代入する。次にSA020へ処理を移す。SA020においてnrが大気観測局数Nr以下であるか否かを判断する。Nr以下であれば処理をSA030に移す。Nr以下でなければ全ての観測局の調査が完了したので、処理をSA150へ移す。SA030において大気観測局の高さzr(nr)を取得する。次に処理をSA040へ移す。SA040において変数nsに1を代入する。処理をSA050へ移す。SA050においてnsが大気中へ化学物質を放出する排出源の数Ns以下であるか否かを判断する。Ns以下であれば処理をSA060に移す。Ns以下でなければ全ての発生源の調査が完了したので、処理をSA140へ移す。 Processing that has shifted from the main routine M040 starts from SA000. After starting, the process proceeds to SA010. In SA010, 1 is substituted into the variable nr . Next, the process proceeds to SA020. N r is equal to or less than atmospheric observation station number N r in SA020. Equal to or less than N r moves the processing to SA030. Since the investigation of all of observation stations to be less than or equal to N r has been completed, it advances the process to the SA150. In SA030, the height z r (n r ) of the atmospheric observation station is acquired. Next, the process proceeds to SA040. Assigns 1 to a variable n s in SA040. The process is moved to SA050. N s is equal to or less than the number N s of the discharge source emitting chemicals into the atmosphere in SA050. Equal to or less than N s and moves the processing to SA060. If it is not less than N s , all the sources have been investigated, and the process proceeds to SA140.
SA060において、大気観測局において前もって測定された大気中の化学物質濃度が異常高濃度を示さない期間に、排出源から放出される化学物質排出量に統計処理を施した平常時排出量Qs aver(ns)を取得する。次にSA070で排出源nsの風速us(ns)を取得する。次にSA080で排出源nsのφ(ns)を取得する。次にSA090で排出源nsの有効煙突高度hse(ns)を取得する。次にSA100で排出源座標(Xs(ns),Ys(ns))を取得する。次にSA110で排出源nsのy軸方向の拡散幅σsy(ns)、排出源nsのz軸方向の拡散幅σsz(ns)を取得する。次にSA210でcoeff(ns,nr)を計算する。coeff(ns,nr)は、プルームモデルを用いた場合に以下で表される。
次にSA130でnsを1インクリメントして、処理をSA150へ移す。SA150の判断でSA140へ処理が移った場合、nrを1インクリメントして、処理をSA020へ移す。 Next incremented by 1 n s in SA130, shifts the process to SA 150. If the process moves to SA140 as determined by SA150, nr is incremented by 1, and the process moves to SA020.
SA020の判断でSA150へ処理が移った場合、SA150で変数nrに1を代入する。次にSA160へ処理を移す。SA160においてnrが大気観測局数Nr以下であるか否かを判断する。Nr以下であれば処理をSA170に移す。Nr以下でなければ全ての観測局の調査が完了したので、処理をSA190へ移す。SA170において制約式を生成する。制約式は以下の式で表される。
次にSA180においてnrを1インクリメントして、処理をSA160へ移す。SA160からSA190へ処理が移った場合にNs>Nrが成立するか否かを判断する。現状では地方公共団体に設置されている大気観測局の数の方が排出源の数よりも少ないのでSA190の条件式は成立し、SA200へ処理を移す。SA200においてラグランジェの未定係数法を利用する。この結果SA220において異常時排出量Qs(ns)を決定することができる。SA190からSA210へのパスは処理手順を完璧にするために示したものである。SA190の条件式が成立しない手順をあえて示すが、現状の地方公共団体ではSA210へ処理が移ることはない。SA210の処理はNs<Nrの場合に、Nr個の連立一次方程式よりNs個の変数の値を決定する問題なのでSA220への解法は周知である。SA220の後処理を終了し、メインルーチン図2のM040へ処理を移す。 Next, nr is incremented by 1 in SA180, and the process proceeds to SA160. When the process moves from SA160 to SA190, it is determined whether N s > N r is satisfied. At present, since the number of atmospheric observation stations installed in the local public body is smaller than the number of emission sources, the conditional expression of SA190 is satisfied, and the processing is shifted to SA200. In SA200, Lagrange's undetermined coefficient method is used. As a result, the abnormal discharge amount Q s (n s ) can be determined in SA220. The path from SA190 to SA210 is shown to complete the processing procedure. Although the procedure in which the conditional expression of SA190 is not satisfied is intentionally shown, the process does not move to SA210 in the current local public entity. Process SA210 in the case of N s <N r, the solution of the SA220 since problems of determining the value of N r number of simultaneous linear equations from the N s number of variables is well known. The post-processing of SA220 is terminated, and the processing is shifted to M040 in FIG.
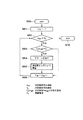
図4は制約なし最適化問題への帰着(ラグランジェの未定定数法)するルーチンである。図3の異常時排出量予測計算システムの処理SA200より処理は移行される。処理はSB000よりスタートする。 FIG. 4 is a routine for reducing to the unconstrained optimization problem (Lagrange's undetermined constant method). The processing shifts from processing SA200 of the abnormal emission prediction calculation system in FIG. Processing starts from SB000.
次に処理はSB010へ移り、目的関数が生成される。SB010で生成される目的関数は以下で表すことができる。
次に処理はSB020へ移りラグランジェ関数が生成される。SB020で生成されるラグランジェ関数は以下で表すことができる。
次にSB030において、SB020で生成したラグランジェ関数のQs(ns)についての一回の偏微分関数がゼロに等しいと置く。式は以下で表される。
次にSB040で、SB030で生成した式を異常時排出量について表せば、式は以下のように表すことができる。
次にSB050において、SB020で生成したラグランジェ関数のλnrxについての一回の偏微分関数がゼロに等しいと置いた式は以下である。
次にSB060において、SB050で生成した式をCr(nrx)について解くと、下記式を得ることができる。
次に、SB070において、SB060の異常時排出量の項Qs(ns)にSB040を代入すると、下記式が得られる。
SB070をすべての観測局における式に変換すると連立方程式SB080になる。
SB080は変数λnrの個数がNr個、連立方程式の数がNr個であるから、SB090において変数λnrの値を決定することができる。 Since the number of variables λn r is N r and the number of simultaneous equations is N r in SB080, the value of the variable λn r can be determined in SB090.
次にSB110において、SB090で求められたλnrの値をSB040へ代入すれば異常時排出量Qs(ns)を得ることができる。 Then the SB 110, it is possible to obtain the abnormal emissions by substituting the value of lambda] n r determined to SB040 Q s (n s) in SB090.
以上のように、原因となる排出源を特定する方法には、他に例えば、排出源の排出量の値を、異常時観測量に近づけるように少しずつ変化させて求めていく方法(最急降下法)もあるが、本発明の実施形態例は、以下のような効果がある。 As described above, there are other methods for identifying the source of the cause, for example, a method in which the value of the emission amount of the emission source is gradually changed so as to approach the observed amount at the time of abnormalities (the steepest descent) However, the embodiment of the present invention has the following effects.
(1)本発明の実施形態例は、繰り返し計算がないため、計算時間が少ない。 (1) In the embodiment of the present invention, since there is no repeated calculation, the calculation time is short.
(2)精度の良い解が得られる。すなわち、大気濃度が環境基準を満たさない状況は突発的な事故が原因である排出量の超過により引き起こされる。よって同時に多数の事業所(工場)が届出排出量を超過する事象が起こる可能性は極めて低い。つまり少数の事業所の届出排出量からの超過が異常の原因であり、その他の事業所は届出排出量遵守(平常時排出量のまま)だから、Ns個の事業所Nsの排出量をNs次元の座標として表せば、異常時排出量座標は平常時排出量座標の近傍にあることが予想されるためである。 (2) A highly accurate solution can be obtained. In other words, the situation where the atmospheric concentration does not meet the environmental standards is caused by an excess of emissions caused by a sudden accident. Therefore, it is very unlikely that a large number of business establishments (factories) will simultaneously exceed the reported emissions. In other words, the excess from the reported emissions of a small number of establishments is the cause of the abnormality, and the other establishments comply with the reported emissions (the amount of normal emissions remains unchanged). This is because the abnormal discharge coordinates are expected to be in the vicinity of the normal discharge coordinates.
なお、本発明は、上記実施形態例そのままに限定されるものではなく、実施段階ではその要旨を逸脱しない範囲で構成要素を変形して具体化できる。また、上記実施形態例に開示されている複数の構成要素の適宜な組み合せにより種々の発明を形成できる。例えば、実施形態例に示される全構成要素から幾つかの構成要素を削除してもよい。 Note that the present invention is not limited to the above-described embodiment as it is, and can be embodied by modifying the constituent elements without departing from the scope of the invention in the implementation stage. In addition, various inventions can be formed by appropriately combining a plurality of constituent elements disclosed in the above embodiment. For example, some components may be deleted from all the components shown in the embodiment.
11 化学物質排出量予測計算システム
12 入力データ
13 出力データ
11 Chemical Emission
Claims (6)
大気中の化学物質の測定濃度、大気観測局の位置座標、化学物質が大気中に放出される排出源の煙突高度と煙の拡散幅、排出源の位置座標、排出源の風速、風向と、
大気観測局において前もって測定された大気中の化学物質濃度が異常高濃度を示さない期間に、排出源から放出される平常時排出量を入力する入力手段と、
大気中の化学物質濃度が異常高濃度を示した期間に排出源から放出された化学物質の異常時排出量を出力する出力手段とを具備し、
排出源の(平常時排出量−異常時排出量)の2乗の和が最小となる解を求めることにより、大気中の化学物質の異常高濃度の原因となる排出源を特定することを特徴とする化学物質排出量予測計算システム。 A system for predicting and calculating the amount of chemical substances emitted when the concentration of chemical substances in the atmosphere measured in a certain period of time at the Atmospheric Observation Bureau shows an abnormally high concentration that exceeds a set reference value,
Measurement concentration of chemical substances in the atmosphere, position coordinates of the atmospheric observation station, chimney height and smoke diffusion width of the emission source from which chemical substances are released into the atmosphere, position coordinates of the emission source, wind speed of the emission source, wind direction,
An input means for inputting a normal emission amount emitted from an emission source during a period in which the atmospheric chemical concentration measured in advance by the atmospheric observation station does not show an abnormally high concentration;
An output means for outputting an abnormal emission amount of the chemical substance released from the emission source during a period when the chemical substance concentration in the atmosphere shows an abnormally high concentration;
Identifying sources that cause abnormally high concentrations of chemicals in the atmosphere by finding a solution that minimizes the sum of the squares of (normal emissions-abnormal emissions) of emission sources Chemical substance emission forecast calculation system.
入力する化学物質の平常時排出量データとして、
法律・規制により届出された化学物質の排出源の平均排出量データを用いることを特徴とする化学物質排出量予測計算システム。 In the chemical substance emission prediction calculation system according to claim 1,
As normal emission data of chemical substances to be entered,
Chemical emission prediction calculation system using average emission data of chemical emission sources notified by laws and regulations.
入力する化学物質の平常時排出量データとして、
排出源の化学物質排出量の実測値に統計処理を施して得られた平均排出量データを用いることを特徴とする化学物質排出量予測計算システム。 In the chemical substance emission prediction calculation system according to claim 1,
As normal emission data of chemical substances to be entered,
A chemical emission prediction calculation system characterized by using average emission data obtained by performing statistical processing on the measured value of chemical emission from the emission source.
大気中の化学物質の測定濃度、大気観測局の位置座標、化学物質が大気中に放出される排出源の煙突高度と煙の拡散幅、排出源の位置座標、排出源の風速、風向と、
大気観測局において前もって測定された大気中の化学物質濃度が異常高濃度を示さない期間に、排出源から放出される平常時排出量を入力とし、
大気中の化学物質濃度が異常高濃度を示した期間に排出源から放出された化学物質の異常時排出量を出力し、
排出源の(平常時排出量−異常時排出量)の2乗の和が最小となる解を求めることにより、大気中の化学物質の異常高濃度の原因となる排出源を特定することを特徴とする化学物質排出量予測計算方法。 A method for predicting the emission of chemical substances when the concentration of chemical substances in the atmosphere measured over a period of time at the Atmospheric Observation Station shows an abnormally high concentration that exceeds a defined reference value,
Measurement concentration of chemical substances in the atmosphere, position coordinates of the atmospheric observation station, chimney height and smoke diffusion width of the emission source from which chemical substances are released into the atmosphere, position coordinates of the emission source, wind speed of the emission source, wind direction,
During the period when the atmospheric chemical substance concentration measured in advance by the Atmospheric Observation Station does not show an abnormally high concentration, the normal emission released from the emission source is input,
Outputs abnormal emissions of chemical substances released from emission sources during periods when the concentration of chemical substances in the atmosphere shows abnormally high levels,
Identifying sources that cause abnormally high concentrations of chemicals in the atmosphere by finding a solution that minimizes the sum of the squares of (normal emissions-abnormal emissions) of emission sources A method for predicting chemical substance emissions.
入力する化学物質の平常時排出量データとして、
法律・規制により届出された化学物質の排出源の平均排出量データを用いることを特徴とする化学物質排出量予測計算方法。 In the chemical substance emission prediction calculation method according to claim 4,
As normal emission data of chemical substances to be entered,
A method for predicting and calculating chemical emissions, which uses average emission data of chemical substances reported by law and regulation.
入力する化学物質の平常時排出量データとして、
排出源の化学物質排出量の実測値に統計処理を施して得られた平均排出量データを用いることを特徴とする化学物質排出量予測計算方法。 In the chemical substance emission prediction calculation method according to claim 4,
As normal emission data of chemical substances to be entered,
A method for predicting a chemical substance emission amount, comprising using average emission data obtained by performing statistical processing on an actual measurement value of a chemical substance emission source.
Priority Applications (1)
| Application Number | Priority Date | Filing Date | Title |
|---|---|---|---|
| JP2004110190A JP4041089B2 (en) | 2004-04-02 | 2004-04-02 | Chemical substance abnormal high concentration emission source identification system and method |
Applications Claiming Priority (1)
| Application Number | Priority Date | Filing Date | Title |
|---|---|---|---|
| JP2004110190A JP4041089B2 (en) | 2004-04-02 | 2004-04-02 | Chemical substance abnormal high concentration emission source identification system and method |
Publications (2)
| Publication Number | Publication Date |
|---|---|
| JP2005292041A true JP2005292041A (en) | 2005-10-20 |
| JP4041089B2 JP4041089B2 (en) | 2008-01-30 |
Family
ID=35325119
Family Applications (1)
| Application Number | Title | Priority Date | Filing Date |
|---|---|---|---|
| JP2004110190A Expired - Lifetime JP4041089B2 (en) | 2004-04-02 | 2004-04-02 | Chemical substance abnormal high concentration emission source identification system and method |
Country Status (1)
| Country | Link |
|---|---|
| JP (1) | JP4041089B2 (en) |
Cited By (8)
| Publication number | Priority date | Publication date | Assignee | Title |
|---|---|---|---|---|
| JP2009068970A (en) * | 2007-09-12 | 2009-04-02 | Nippon Steel Corp | Dust atmospheric dispersion simulation apparatus, method and program |
| JP2011137653A (en) * | 2009-12-25 | 2011-07-14 | Mitsubishi Heavy Ind Ltd | Apparatus and method for estimation of emission source, and program |
| JP2013065208A (en) * | 2011-09-16 | 2013-04-11 | Mitsubishi Heavy Ind Ltd | Substance discharge estimation device, method for the same and program |
| JP2013185988A (en) * | 2012-03-08 | 2013-09-19 | Toshiba Corp | Information processing device and emission point estimation method |
| JP2013221925A (en) * | 2012-04-19 | 2013-10-28 | Jfe Steel Corp | Smoke dust generation source estimation method |
| CN103874937A (en) * | 2011-08-16 | 2014-06-18 | 新日铁住金株式会社 | Method of searching for unsteady dust source position of dustfall |
| US8972203B2 (en) | 2009-09-09 | 2015-03-03 | Mitsubishi Heavy Industries, Ltd. | Disaster-affected area estimation device and program |
| CN113203841A (en) * | 2021-06-21 | 2021-08-03 | 北京思路智园科技有限公司 | Harmful gas detection system and method based on multi-sensor cooperation |
-
2004
- 2004-04-02 JP JP2004110190A patent/JP4041089B2/en not_active Expired - Lifetime
Cited By (9)
| Publication number | Priority date | Publication date | Assignee | Title |
|---|---|---|---|---|
| JP2009068970A (en) * | 2007-09-12 | 2009-04-02 | Nippon Steel Corp | Dust atmospheric dispersion simulation apparatus, method and program |
| US8972203B2 (en) | 2009-09-09 | 2015-03-03 | Mitsubishi Heavy Industries, Ltd. | Disaster-affected area estimation device and program |
| JP2011137653A (en) * | 2009-12-25 | 2011-07-14 | Mitsubishi Heavy Ind Ltd | Apparatus and method for estimation of emission source, and program |
| CN103874937A (en) * | 2011-08-16 | 2014-06-18 | 新日铁住金株式会社 | Method of searching for unsteady dust source position of dustfall |
| CN103874937B (en) * | 2011-08-16 | 2016-01-20 | 新日铁住金株式会社 | The unstable dirt source position of depositing dust seek and visit method |
| JP2013065208A (en) * | 2011-09-16 | 2013-04-11 | Mitsubishi Heavy Ind Ltd | Substance discharge estimation device, method for the same and program |
| JP2013185988A (en) * | 2012-03-08 | 2013-09-19 | Toshiba Corp | Information processing device and emission point estimation method |
| JP2013221925A (en) * | 2012-04-19 | 2013-10-28 | Jfe Steel Corp | Smoke dust generation source estimation method |
| CN113203841A (en) * | 2021-06-21 | 2021-08-03 | 北京思路智园科技有限公司 | Harmful gas detection system and method based on multi-sensor cooperation |
Also Published As
| Publication number | Publication date |
|---|---|
| JP4041089B2 (en) | 2008-01-30 |
Similar Documents
| Publication | Publication Date | Title |
|---|---|---|
| Hu et al. | Evaluation of the new capture vaporizer for aerosol mass spectrometers (AMS) through field studies of inorganic species | |
| Ranzato et al. | A comparison of methods for the assessment of odor impacts on air quality: Field inspection (VDI 3940) and the air dispersion model CALPUFF | |
| US20100199258A1 (en) | Software Forecasting System | |
| JP4041089B2 (en) | Chemical substance abnormal high concentration emission source identification system and method | |
| Bare | Developing a consistent decision-making framework by using the US EPA’s TRACI | |
| Schwarz et al. | Improving statistical methods to derive species sensitivity distributions | |
| Podrez | An update to the ambient ratio method for 1-h NO2 air quality standards dispersion modeling | |
| CN114091863B (en) | Method and device for evaluating pollution level of volatile organic compounds of target object in park | |
| CN114611280A (en) | Ozone comprehensive source apportionment method based on OBM and EBM multi-model | |
| Lofton et al. | Using near‐term forecasts and uncertainty partitioning to inform prediction of oligotrophic lake cyanobacterial density | |
| Barclay et al. | New international handbook on the assessment of odour exposure using dispersion modelling | |
| JP5738140B2 (en) | Substance release amount estimation apparatus, method and program | |
| Carslaw et al. | An empirical approach for the prediction of annual mean nitrogen dioxide concentrations in London | |
| US20230184730A1 (en) | Computer-Assisted Method for Generating Training Data for a Neural Network for Predicting a Concentration of Pollutants at a Measuring Station | |
| CN117252489B (en) | Ozone pollution source evaluation method, device, medium and electronic equipment | |
| Liu et al. | Mapping particulate matter at the body weld department in an automobile assembly plant | |
| Pan et al. | Analysis of GEFS-Aerosols annual budget to better understand the aerosol predictions simulated in the model | |
| US20120203471A1 (en) | Generation source estimation apparatus and method of diffusion material | |
| Magallanes et al. | Automatic classification of steels by processing energy-dispersive X-ray spectra with artificial neural networks | |
| Bellasio et al. | RTMOD: An Internet based system to analyse the predictions of long-range atmospheric dispersion models | |
| Zeng et al. | Optimal reduction of anthropogenic emissions for air pollution control and the retrieval of emission source from observed pollutants Ӏ. Application of incomplete adjoint operator | |
| Gavaris | Comparison of uncertainty estimates in the short term using real data | |
| KR20200000662A (en) | Method for calculating a neutralization of particulate matters in the atmosphere | |
| Vira et al. | Assimilation of surface NO 2 and O 3 observations into the SILAM chemistry transport model | |
| Falit‐Baiamonte et al. | An equity model for locating environmentally hazardous facilities |
Legal Events
| Date | Code | Title | Description |
|---|---|---|---|
| A977 | Report on retrieval |
Free format text: JAPANESE INTERMEDIATE CODE: A971007 Effective date: 20060418 |
|
| A131 | Notification of reasons for refusal |
Free format text: JAPANESE INTERMEDIATE CODE: A131 Effective date: 20070619 |
|
| A521 | Request for written amendment filed |
Free format text: JAPANESE INTERMEDIATE CODE: A523 Effective date: 20070816 |
|
| TRDD | Decision of grant or rejection written | ||
| A01 | Written decision to grant a patent or to grant a registration (utility model) |
Free format text: JAPANESE INTERMEDIATE CODE: A01 Effective date: 20071106 |
|
| A61 | First payment of annual fees (during grant procedure) |
Free format text: JAPANESE INTERMEDIATE CODE: A61 Effective date: 20071108 |
|
| FPAY | Renewal fee payment (event date is renewal date of database) |
Free format text: PAYMENT UNTIL: 20101116 Year of fee payment: 3 |
|
| R151 | Written notification of patent or utility model registration |
Ref document number: 4041089 Country of ref document: JP Free format text: JAPANESE INTERMEDIATE CODE: R151 |
|
| FPAY | Renewal fee payment (event date is renewal date of database) |
Free format text: PAYMENT UNTIL: 20101116 Year of fee payment: 3 |
|
| FPAY | Renewal fee payment (event date is renewal date of database) |
Free format text: PAYMENT UNTIL: 20101116 Year of fee payment: 3 |
|
| FPAY | Renewal fee payment (event date is renewal date of database) |
Free format text: PAYMENT UNTIL: 20111116 Year of fee payment: 4 |
|
| FPAY | Renewal fee payment (event date is renewal date of database) |
Free format text: PAYMENT UNTIL: 20111116 Year of fee payment: 4 |
|
| FPAY | Renewal fee payment (event date is renewal date of database) |
Free format text: PAYMENT UNTIL: 20121116 Year of fee payment: 5 |
|
| FPAY | Renewal fee payment (event date is renewal date of database) |
Free format text: PAYMENT UNTIL: 20121116 Year of fee payment: 5 |
|
| FPAY | Renewal fee payment (event date is renewal date of database) |
Free format text: PAYMENT UNTIL: 20131116 Year of fee payment: 6 |
|
| S531 | Written request for registration of change of domicile |
Free format text: JAPANESE INTERMEDIATE CODE: R313531 |
|
| R350 | Written notification of registration of transfer |
Free format text: JAPANESE INTERMEDIATE CODE: R350 |
|
| EXPY | Cancellation because of completion of term |