JP2005253755A - Tumor region setting method and tumor region setting system - Google Patents
Tumor region setting method and tumor region setting system Download PDFInfo
- Publication number
- JP2005253755A JP2005253755A JP2004070760A JP2004070760A JP2005253755A JP 2005253755 A JP2005253755 A JP 2005253755A JP 2004070760 A JP2004070760 A JP 2004070760A JP 2004070760 A JP2004070760 A JP 2004070760A JP 2005253755 A JP2005253755 A JP 2005253755A
- Authority
- JP
- Japan
- Prior art keywords
- information
- image information
- tumor region
- image
- tumor
- Prior art date
- Legal status (The legal status is an assumption and is not a legal conclusion. Google has not performed a legal analysis and makes no representation as to the accuracy of the status listed.)
- Pending
Links
- 206010028980 Neoplasm Diseases 0.000 title claims abstract description 112
- 238000000034 method Methods 0.000 title claims abstract description 32
- 238000009206 nuclear medicine Methods 0.000 claims description 28
- 238000001959 radiotherapy Methods 0.000 claims description 9
- 239000000284 extract Substances 0.000 abstract description 3
- 239000003814 drug Substances 0.000 description 4
- 229940079593 drug Drugs 0.000 description 4
- AOYNUTHNTBLRMT-SLPGGIOYSA-N 2-deoxy-2-fluoro-aldehydo-D-glucose Chemical compound OC[C@@H](O)[C@@H](O)[C@H](O)[C@@H](F)C=O AOYNUTHNTBLRMT-SLPGGIOYSA-N 0.000 description 3
- 238000000605 extraction Methods 0.000 description 3
- 230000005855 radiation Effects 0.000 description 3
- 238000005070 sampling Methods 0.000 description 3
- 238000006243 chemical reaction Methods 0.000 description 2
- 238000007796 conventional method Methods 0.000 description 2
- 238000010586 diagram Methods 0.000 description 2
- 210000004872 soft tissue Anatomy 0.000 description 2
- WQZGKKKJIJFFOK-GASJEMHNSA-N Glucose Natural products OC[C@H]1OC(O)[C@H](O)[C@@H](O)[C@@H]1O WQZGKKKJIJFFOK-GASJEMHNSA-N 0.000 description 1
- 238000005481 NMR spectroscopy Methods 0.000 description 1
- 201000011510 cancer Diseases 0.000 description 1
- 230000003915 cell function Effects 0.000 description 1
- 238000001514 detection method Methods 0.000 description 1
- 230000000694 effects Effects 0.000 description 1
- 230000037149 energy metabolism Effects 0.000 description 1
- 230000006870 function Effects 0.000 description 1
- 239000008103 glucose Substances 0.000 description 1
- 230000001771 impaired effect Effects 0.000 description 1
- 230000000877 morphologic effect Effects 0.000 description 1
- 210000000056 organ Anatomy 0.000 description 1
- 230000001225 therapeutic effect Effects 0.000 description 1
Images


Abstract
Description
本発明は、放射線医療において、核医学診断装置から取得した核医学画像情報を使用して腫瘍領域を設定する腫瘍領域設定方法及び腫瘍領域設定システムに関する。 The present invention relates to a tumor region setting method and a tumor region setting system for setting a tumor region using nuclear medicine image information acquired from a nuclear medicine diagnostic apparatus in radiology.
一般に放射線治療は、(1)患者のX線CT画像の撮影,(2)X線CT画像を用いた治療計画の立案,(3)治療計画に基づいた放射線照射装置による治療の手順で進められる。治療計画の目的は、主に、X線CT画像上への腫瘍領域の設定と設定済み腫瘍領域に対する照射線量の設定である。腫瘍領域の設定は、X線CT画像上で直接行われる場合や、X線CT画像よりもより軟組織を観察しやすいMRI画像(MRI装置(核磁気共鳴装置)により撮像した画像)を併用して行われる場合等がある。 In general, radiotherapy is performed by (1) taking an X-ray CT image of a patient, (2) making a treatment plan using the X-ray CT image, and (3) a treatment procedure using a radiation irradiation apparatus based on the treatment plan. . The purpose of the treatment plan is mainly to set the tumor area on the X-ray CT image and to set the irradiation dose for the set tumor area. Tumor area setting is performed directly on an X-ray CT image, or by using an MRI image (an image taken with an MRI apparatus (nuclear magnetic resonance apparatus)) that makes it easier to observe soft tissue than an X-ray CT image It may be done.
近年、悪性腫瘍の早期発見に有用な放射線診断機器として、ポジトロンCT(PET)装置が国内外で脚光を浴びている。このPET装置は、陽電子崩壊で放出する放射性核種を薬剤として体内に投与し、体内で陽電子と電子が対消滅した際に放出される1対のγ線(511KeV)を捕らえて画像化する放射線診断装置である。薬剤としては、例えばブドウ糖の類似体であるFDG(2-deoxy-2-fluoro-D-glucose)が用いられる。このFDGは、活発なエネルギー代謝を行う腫瘍に集積する性質を有するため、この性質を利用して腫瘍を撮影することができる。 In recent years, a positron CT (PET) apparatus has been spotlighted at home and abroad as a radiation diagnostic instrument useful for early detection of malignant tumors. This PET device administers a radionuclide released by positron decay into the body as a drug, and captures and images a pair of γ-rays (511 KeV) emitted when the positron and electron disappear in the body. Device. As the drug, for example, FDG (2-deoxy-2-fluoro-D-glucose) which is an analog of glucose is used. Since this FDG has a property of accumulating in a tumor that undergoes active energy metabolism, it is possible to photograph a tumor using this property.
このようにしてPET装置で撮像した画像は、X線CT画像やMRI画像の様な体や臓器の形状を写した形態画像とは違い、細胞機能の活性度を映し出した画像であり腫瘍領域を反映したものである(これを機能画像と呼ぶ)。したがって、腫瘍領域の設定にこのPET画像を併用することにより、X線CT画像やMRI画像では見つけ難かった部分まで腫瘍領域設定を行うことが可能となる。 The image captured by the PET apparatus in this way is an image showing the activity of cell functions and is different from a morphological image showing the shape of a body or organ such as an X-ray CT image or an MRI image. It is reflected (this is called a functional image). Therefore, by using this PET image in combination with the setting of the tumor region, it is possible to set the tumor region up to a portion that is difficult to find in the X-ray CT image or the MRI image.
このようなPET画像を併用した従来技術として、X線CT画像とPET画像とを位置合わせした上で重ね合わせて表示し、腫瘍領域を設定するものがある(例えば、特許文献1及び特許文献2参照。)。
As a conventional technique using such a PET image in combination, there is a technique in which an X-ray CT image and a PET image are aligned and displayed in a superimposed manner to set a tumor region (for example,
上記特許文献1及び特許文献2には明確には記載されていないが、一般にX線CT画像及びPET画像等の医療画像はラスタデータ(画素の集合である二次元配列)で構成されており、X線CT画像上にPET画像を重ね合わせて表示した状態もラスタデータで構成されている。一方、通常、治療計画が使用する腫瘍領域のデータ形式はポリゴン線画のようなベクトル線画データ(大きさと方向を持った線と点)で構成されている。そのため、上記従来技術では、X線CT画像上にPET画像を重ね合わせて表示しても、操作者はそのPET画像データにて判別できる腫瘍領域を治療計画のための腫瘍領域として直接使用することはできず、例えばマウス等の入力手段を用いてPET画像データにて判別できる腫瘍領域の輪郭をなぞり、手動でベクトル線画データに変換しなければならなかった。これでは腫瘍領域の設定に手間がかかる上に、操作者の熟練度等によって腫瘍領域に差が生じることとなり、領域指定の的確さに欠けるという問題点があった。
Although not explicitly described in
本発明は、上記従来技術の問題に鑑みてなされたものであり、その目的は、簡便且つ的確に腫瘍領域を設定することができる腫瘍領域設定方法及び腫瘍領域設定システムを提供することにある。 The present invention has been made in view of the above-described problems of the prior art, and an object thereof is to provide a tumor region setting method and a tumor region setting system capable of setting a tumor region simply and accurately.
(1)上記した目的を達成する第1の発明の特徴は、放射線治療における腫瘍領域設定方法において、核医学画像情報から腫瘍領域の輪郭情報を抽出し、この抽出した輪郭情報をベクトル線画情報に変換することを特徴とする腫瘍領域設定方法にある。 (1) A feature of the first invention that achieves the above-described object is that, in a tumor region setting method in radiotherapy, the contour information of a tumor region is extracted from nuclear medicine image information, and the extracted contour information is converted into vector line drawing information. A method for setting a tumor region is characterized by converting.
本発明においては、例えばカウント値又はSUV値を用いて閾値の設定を行うことにより、演算装置を用いて自動的に腫瘍領域の輪郭をPET画像から抽出し、その輪郭データをベクトル線画に変換することが可能である。これにより、従来のように操作者が手間をかけて腫瘍領域の輪郭をなぞる必要がなくなるので、領域設定作業を大幅に簡便にすることができる。さらに、閾値を用いて自動で輪郭の抽出を行うことから、操作者の熟練度等によらない再現性のある腫瘍領域の設定が可能となる。したがって、本発明によれば、簡便且つ的確に腫瘍領域を設定することができる。 In the present invention, for example, by setting a threshold value using a count value or an SUV value, a contour of a tumor region is automatically extracted from a PET image using an arithmetic unit, and the contour data is converted into a vector line drawing. It is possible. This eliminates the need for the operator to trace the outline of the tumor region as in the prior art, so that the region setting operation can be greatly simplified. Furthermore, since the contour is automatically extracted using the threshold value, it is possible to set a reproducible tumor region regardless of the skill level of the operator. Therefore, according to the present invention, a tumor region can be set easily and accurately.
(2)上記した目的を達成する第2の発明の特徴は、前記核医学画像情報から閾値を用いて前記腫瘍領域の輪郭情報を抽出することを特徴とする請求項1記載の腫瘍領域設定方法にある。 (2) The feature of the second invention for achieving the above object is that the tumor region contour information is extracted from the nuclear medicine image information by using a threshold value. It is in.
(3)上記した目的を達成する第3の発明の特徴は、前記閾値として前記核医学画像情報に含まれる放射能カウント値を用いることを特徴とする請求項2記載の腫瘍領域設定方法にある。
(3) The feature of the third invention for achieving the above object is the method of setting a tumor region according to
(4)上記した目的を達成する第4の発明の特徴は、前記閾値としてSUV値を用いることを特徴とする請求項2記載の腫瘍領域設定方法にある。
(4) A feature of the fourth invention for achieving the above object is the tumor region setting method according to
(5)上記した目的を達成する第5の発明の特徴は、前記ベクトル線画情報とX線CT画像情報とを重ねて表示することを特徴とする請求項2記載の腫瘍領域設定方法にある。
(5) A feature of a fifth invention for achieving the above object is the tumor region setting method according to
(6)上記した目的を達成する第6の発明の特徴は、前記ベクトル線画情報はベジエ曲線情報であることを特徴とする請求項5記載の腫瘍領域設定方法にある。 (6) A feature of the sixth invention for achieving the above object is the tumor region setting method according to claim 5, wherein the vector line drawing information is Bezier curve information.
(7)上記した目的を達成する第7の発明の特徴は、前記ベクトル線画情報はポリゴン線画情報であることを特徴とする請求項5記載の腫瘍領域設定方法にある。 (7) The feature of the seventh invention for achieving the above object is the tumor region setting method according to claim 5, wherein the vector line drawing information is polygon line drawing information.
(8)上記した目的を達成する第8の発明の特徴は、前記核医学画像情報はPET画像情報であることを特徴とする請求項5記載の腫瘍領域設定方法にある。 (8) The feature of the eighth invention for achieving the above object is the tumor region setting method according to claim 5, wherein the nuclear medicine image information is PET image information.
(9)上記した目的を達成する第9の発明の特徴は、放射線治療に際し腫瘍領域の設定を行う腫瘍領域設定システムにおいて、腫瘍領域を含むX線CT画像情報及び核医学画像情報を格納する画像サーバと、前記核医学画像情報から腫瘍領域の輪郭情報を抽出し、前記抽出した輪郭情報をベクトル線画情報に変換する演算装置と、前記演算装置で変換した前記ベクトル線画情報を前記X線CT画像情報に重ねて表示する表示装置とを備えたことを特徴とする腫瘍領域設定システムにある。 (9) A feature of the ninth invention for achieving the above object is an image storing X-ray CT image information and nuclear medicine image information including a tumor region in a tumor region setting system for setting a tumor region during radiotherapy. A server, a computing device for extracting contour information of a tumor region from the nuclear medicine image information, converting the extracted contour information into vector line drawing information, and the vector line drawing information converted by the computing device as the X-ray CT image A tumor region setting system comprising: a display device that displays information in a superimposed manner.
(10)上記した目的を達成する第10の発明の特徴は、放射線治療に際し腫瘍領域の設定を行う腫瘍領域設定システムにおいて、腫瘍領域を含むX線CT画像情報及び核医学画像情報を格納する画像サーバと、前記核医学画像情報から腫瘍領域の輪郭情報を抽出し、前記抽出した輪郭情報をベクトル線画情報に変換する演算装置と、前記X線CT画像情報である第1画像情報と、前記X線CT画像情報と前記核医学画像情報とを重ね合わせた第2画像情報とを並べて表示すると共に、前記演算装置で変換した前記ベクトル線画情報を前記第1画像情報に重ねて表示する表示装置とを備えたことを特徴とする腫瘍領域設定システムにある。 (10) A feature of the tenth invention for achieving the above object is an image storing X-ray CT image information and nuclear medicine image information including a tumor region in a tumor region setting system for setting a tumor region during radiotherapy. A server, a computing device for extracting contour information of the tumor region from the nuclear medicine image information, converting the extracted contour information into vector line drawing information, first image information as the X-ray CT image information, and the X A display device that displays line CT image information and second image information obtained by superimposing the nuclear medicine image information side by side, and displays the vector line drawing information converted by the arithmetic unit on the first image information. A tumor region setting system comprising:
(11)上記した目的を達成する第11の発明の特徴は、放射線治療に際し腫瘍領域の設定を行う腫瘍領域設定システムにおいて、腫瘍領域を含むX線CT画像情報、核医学画像情報、及びMRI画像情報を格納する画像サーバと、前記核医学画像情報から腫瘍領域の輪郭情報を抽出し、前記抽出した輪郭情報をベクトル線画情報に変換する演算装置と、前記X線CT画像情報である第1画像情報と、前記MRI画像情報と前記核医学画像情報とを重ね合わせた第2画像情報とを並べて表示すると共に、前記演算装置で変換した前記ベクトル線画情報を前記第1画像情報に重ねて表示する表示装置とを備えたことを特徴とする腫瘍領域設定システムにある。 (11) A feature of the eleventh invention for achieving the above object is that in a tumor region setting system for setting a tumor region during radiotherapy, X-ray CT image information, nuclear medicine image information, and MRI image including the tumor region An image server for storing information; a computing device for extracting contour information of a tumor region from the nuclear medicine image information; and converting the extracted contour information into vector line drawing information; and a first image that is the X-ray CT image information Information and the second image information obtained by superimposing the MRI image information and the nuclear medicine image information are displayed side by side, and the vector line drawing information converted by the arithmetic unit is displayed superimposed on the first image information. A tumor region setting system comprising a display device.
本発明によれば、核医学画像情報から腫瘍領域の輪郭情報を抽出し、この抽出した輪郭情報をベクトル線画情報に変換することによって、簡便且つ的確に腫瘍領域を設定することができる。 According to the present invention, it is possible to easily and accurately set a tumor region by extracting the contour information of a tumor region from nuclear medicine image information and converting the extracted contour information into vector line drawing information.
以下、本発明の腫瘍領域設定方法及び腫瘍領域設定システムの一実施の形態を図面を参照しつつ説明する。 Hereinafter, an embodiment of a tumor region setting method and a tumor region setting system according to the present invention will be described with reference to the drawings.
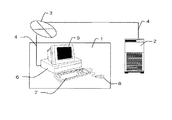
図1は、本実施の形態の腫瘍領域設定システムの全体構成を表す図である。この図1において、治療計画装置1及びX線CT画像やPET画像(核医学画像情報)等をアーカイブする医療画像サーバ2があり、これら治療計画装置1及び医療画像サーバ2は、例えば病院内に敷設されている病院内ネットワーク3にネットワークケーブル4を通して接続されている。治療計画装置1は、医療画像や医療情報を表示するモニタ(表示装置)5,演算装置6,キーボード7、及び入力手段であるマウス8とで構成される。なお、入力手段であるマウス8はその他の入力手段、例えばペンタブレット等でも良い。
FIG. 1 is a diagram illustrating an overall configuration of a tumor region setting system according to the present embodiment. In FIG. 1, there is a
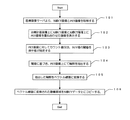
図2に本実施形態の腫瘍領域設定システムが行う処理フローを示す。この図2を用い、本発明が提供する腫瘍領域設定方法について説明する。 FIG. 2 shows a processing flow performed by the tumor region setting system of the present embodiment. A tumor region setting method provided by the present invention will be described with reference to FIG.
治療計画装置1を使用する操作者は、まず医療画像サーバ2より、これから治療計画を立案する患者の治療計画用のX線CT画像とPET画像を取得する(ステップ101)。
An operator who uses the
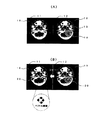
医療画像サーバ2からの医療画像取得が終了すると、治療計画装置1のモニタ5にX線CT画像(第1画像情報)とX線CT画像上にPET画像を重ね合わせた画像(第2画像情報)が並んで表示される(ステップ102)。このときのモニタ5の状態は、図3(A)に示すようになっており、例えば左側の画像表示領域11にはX線CT画像10のみが表示され、右側の画像表示領域12にはX線CT画像10上にPET画像表示領域13(以下、PET画像13)を重ね合わせた画像が表示される。
When the medical image acquisition from the
画像の表示が終了すると、操作者は、PET画像表示領域13に対して、輪郭を抽出するための閾値を設定する(ステップ103)。この閾値は、放射能カウント値及びSUV値のどちらに対して指定しても良い。ここで、放射能カウント値とは、PET画像のラスタデータとして元々格納されている放射能カウント値(以後、カウント値と呼ぶ)である。これは、PET装置に付属する放射線検出器が検出する値である。一方、SUV(Standardized Uptake Value)値は、カウント値を薬剤が患者の体内に均一に分布した場合の平均カウント値で割った値であり、SUV=1は薬剤の平均分布を表す。例えばSUV値が2〜3以上であれば腫瘍の疑いが持たれる。なお、もし操作者が閾値をSUV値で指定しようとした際にPET画像の表示がカウント値であった場合には、閾値が選択された際にPET画像の表示を変換する。反対に、操作者が閾値をカウント値で指定しようとした際にPET画像の表示がSUV値であった場合には、同様にカウント値による表示に変換する。閾値の設定は、図4に示すような閾値設定ダイアログ14を使用する。操作者は閾値の種類を選択するラジオボタン15を選択し、閾値を入力するテキストフィールド16に値を入力後、OKボタン17を押すと閾値の設定が終了する。本実施例では、閾値を設定して抽出する腫瘍領域として、図3(A)のPET画像13中の変換領域18を指定したものとする。
When the display of the image is completed, the operator sets a threshold value for extracting the contour in the PET image display area 13 (step 103). This threshold may be specified for either the radioactivity count value or the SUV value. Here, the radioactivity count value is a radioactivity count value (hereinafter referred to as a count value) originally stored as raster data of a PET image. This is a value detected by a radiation detector attached to the PET apparatus. On the other hand, the SUV (Standardized Uptake Value) value is a value obtained by dividing the count value by the average count value when the drug is uniformly distributed in the patient's body, and SUV = 1 represents the average distribution of the drug. For example, if the SUV value is 2 to 3 or more, a tumor is suspected. Note that if the display of the PET image is a count value when the operator tries to specify the threshold value with the SUV value, the display of the PET image is converted when the threshold value is selected. On the contrary, when the display of the PET image is an SUV value when the operator tries to specify the threshold value by the count value, the display is similarly converted to the display by the count value. The threshold setting uses a
閾値の設定が終了すると、演算装置6が自動的にPET画像13に対して輪郭を抽出する(ステップ104)。PET画像はラスタ画像であるが、ラスタ画像に対する輪郭抽出は、広く一般に知られているアルゴリズムを使用することで達成できる(例えば、「C言語で学ぶ 実践画像処理」 Ohmsha, 1999年 を参照)。具体的には、PET画像の左上の画素から閾値以上の画素を探索し、閾値以上の画素のみの画像を作成する。この際、閾値以上の画素は全て同じ値に変換しておく(この画像データを2値画像と呼ぶ)。2値画像に対して、Pewittの方法等のエッジ抽出アルゴリズムを適用することで、設定した閾値で囲まれた腫瘍領域の輪郭をPET画像13上に形成することができる。さらに、Hilditchの方法等の細線化アルゴリズムを使用し、抽出した輪郭を1画素の幅の輪郭に変換する。
When the setting of the threshold is completed, the
PET画像上での輪郭抽出が終了すると、演算装置6は自動抽出した1画素の幅に細線化した輪郭データをベクトル線画データに変換する(ステップ105)。ベクトル線画とは、ベジエ曲線やポリゴン線のような大きさと方向を持った線画を指し、点列と点列間を結ぶ線で構成されている。輪郭データからベクトル線画(ここではベジエ曲線)データへの変換手順及び方法を次に説明する。
When the contour extraction on the PET image is completed, the
まず、輪郭データは、図5(A)に示すように1画素の幅の線が連続している状態にある。なお、この図5(A)は説明のために輪郭データの一部を拡大して示している。この輪郭データをこのままベクトルデータに変換すると無駄な部分が多いため、サンプリングし点を間引く必要がある。なお、このサンプリングは元の輪郭データの形状が損なわれないように行われる。本実施形態では、サンプリングは画素間の曲率に基づき実施される。すなわち、ある曲率以下の画素は間引いていく。具体的には、図5(A)の画素に番号をつける。これらの番号をつけた点を模式的に示すと図5(B)のようになる。番号をつけた点の座標をそれぞれ(x0, y0)、(x1, y1)、(x2, y2)とする。番号1の点からみて、番号0と1及び番号1と2の線が作る角度θは、θのコサインを曲率Rと定義すると、次の数式1のように表される。

曲率Rが一定値以下の場合は輪郭データから該当する点を間引いていき、図5(C)のようなデータを作成する。ここでは番号2の点が間引かれている。
First, as shown in FIG. 5A, the contour data is in a state in which lines having a width of one pixel are continuous. FIG. 5A shows an enlarged part of the contour data for the purpose of explanation. If this contour data is converted into vector data as it is, there are many useless parts, so it is necessary to sample and thin out points. This sampling is performed so that the shape of the original contour data is not impaired. In the present embodiment, sampling is performed based on the curvature between pixels. That is, pixels having a certain curvature or less are thinned out. Specifically, the pixels in FIG. 5A are numbered. The points with these numbers are schematically shown in FIG. The coordinates of the numbered points are (x0, y0), (x1, y1), and (x2, y2), respectively. When viewed from the point of
When the curvature R is below a certain value, the corresponding points are thinned out from the contour data, and data as shown in FIG. 5C is created. Here, the
このようにして、全ての輪郭データの走査が終了すると、図5(D)に示すように点間の直線上に、新たに丁度点間を3等分した2個の点を挿入する。この2個の点を仮制御点と呼ぶ。仮制御点とそれを挟む両脇の点を用いてベジエ曲線を生成する。 In this way, when the scanning of all the contour data is completed, two points that are just divided into three equal parts are inserted on the straight line between the points as shown in FIG. These two points are called temporary control points. A Bezier curve is generated using the temporary control points and the points on both sides of the temporary control points.
ベジエ曲線を利用した輪郭データのベクトル化を説明する前に、ベジエ曲線について簡単に説明する。ベジエ曲線は、次に示す(数式2)及び(数式3)にて表現できる。ここで、R(t)はパラメータtで表現した曲線、Piは制御点を表す。また、tの範囲は0以上1以下であり、Bi(t)はバーンスタイン関数と言う。(数式2)、(数式3)により、図6に示すような曲線が生成できる。ここで、P3は制御点であり、P0〜P3にはさまれた曲線がベジエ曲線である。
![]()
ベジエ曲線を利用した輪郭データのベクトル化は以下のように行う。サンプリングした輪郭データをベジエ曲線で近似する場合、図5(D)の4点を近似の対象とする。図7に考え方を示す。対象とする4点をQ0〜Q3とする。これらの点をベジエ曲線は通過しなければならない。また、ベジエ曲線は、制御点を持ち、それは一般的には図7に示すようにP0〜P3の点で表される。すなわち、Q0〜Q3の点をベジエ曲線が通過できるように制御点P0〜P3を決定すればよい。
Before describing vectorization of contour data using a Bezier curve, the Bezier curve will be briefly described. The Bezier curve can be expressed by the following (Equation 2) and (Equation 3). Here, R (t) represents a curve represented by a parameter t, and Pi represents a control point. The range of t is 0 or more and 1 or less, and Bi (t) is called a Bernstein function. A curve as shown in FIG. 6 can be generated by (Expression 2) and (Expression 3). Here, P3 is a control point, and a curve sandwiched between P0 to P3 is a Bezier curve.
![]()
Vectorization of contour data using a Bezier curve is performed as follows. When approximating the sampled contour data with a Bezier curve, the four points in FIG. The concept is shown in FIG. The four points of interest are Q0 to Q3. The Bezier curve must pass through these points. A Bezier curve has control points, which are generally represented by points P0 to P3 as shown in FIG. That is, the control points P0 to P3 may be determined so that the Bezier curve can pass through the points Q0 to Q3.
まず、図7よりP0=Q0,P3=Q3である。また、(数式2)より曲線はパラメータtで表現できることが分かっているので、Q0〜Q1間のパラメータをt1,Q1〜Q2間のパラメータをt2,Q2〜Q3間のパラメータをt3とする。P1,P2は、(数式2)を用いて決定することができる。Q1及びQ2を仮制御点と考えて、Q1,Q2に対する式をたてると、
![]()
![]()
となる。(数式4)及び(数式5)をP1及びP2について解くことにより、制御点が全て求まり、図7の点Q0〜Q3をベジエ曲線で近似できる。以上の手順により輪郭データをベクトル線画データに変換する。
First, from FIG. 7, P0 = Q0 and P3 = Q3. Since it is known from (Equation 2) that the curve can be expressed by the parameter t, the parameter between Q0 and Q1 is t1, the parameter between Q1 and Q2 is t2, and the parameter between Q2 and Q3 is t3. P1 and P2 can be determined using (Formula 2). Considering Q1 and Q2 as temporary control points and formulating Q1 and Q2,
![]()
![]()
It becomes. By solving (Equation 4) and (Equation 5) for P1 and P2, all the control points are obtained, and the points Q0 to Q3 in FIG. 7 can be approximated by a Bezier curve. The contour data is converted into vector line drawing data by the above procedure.
演算装置6は、輪郭データのベクトル線画への変換が終了すると、モニタ5に結果を表示する。図3(B)にその結果の表示を示す。右側の画像表示領域12には、PET画像13を重ね合わせたX線CT画像10上にさらにベクトル線画データに変換された腫瘍領域20が重ねて表示される。それと同時に左側の画像表示領域11に表示されたX線CT画像10にベクトル線画で表現された腫瘍領域20がコピーされ表示される(ステップ106)。なお、ベクトル線画に変換された腫瘍領域20は、点と点を結ぶ曲線にて構成されているため、操作者がベクトル線画化された腫瘍領域を編集し、より精度の良い腫瘍領域を形成することもできる。そして、その編集結果は即座にX線CT画像上に反映される。
The
このようにしてX線CT画像上への腫瘍領域の設定が完了すると、その後、設定済み腫瘍領域に対する照射線量の設定等が行われる。 When the setting of the tumor region on the X-ray CT image is completed in this way, the setting of the irradiation dose for the set tumor region is performed thereafter.
以上のような構成である本実施の形態の腫瘍領域設定方法及び腫瘍領域設定システムによれば、以下のような作用が得られる。
すなわち、前述したように、一般に、医療画像はラスタデータ(画素の集合である二次元配列)で構成されており、治療計画が使用する腫瘍領域のデータ形式はポリゴン線画のようなベクトル線画データ(大きさと方向を持った線と点)で構成されている。そのため、前述した特許文献1及び特許文献2記載のような従来技術では、特に明確には記載されていないが、通常、操作者はX線CT画像上にPET画像が重ねて表示されていても、そのPET画像データにて判別できる腫瘍領域を治療計画のための腫瘍領域として直接使用することはできず、例えばマウス等の入力手段を用いてPET画像データにて判別できる腫瘍領域の輪郭をなぞり、手動でポリゴン線画に変換しなければならなかった。これでは腫瘍領域の設定に手間がかかる上に、操作者の熟練度等によって腫瘍領域に差が生じることとなり、領域指定の的確さに欠けるという問題点があった。
According to the tumor region setting method and the tumor region setting system of the present embodiment configured as described above, the following operations can be obtained.
That is, as described above, generally, a medical image is composed of raster data (a two-dimensional array that is a set of pixels), and the data format of a tumor region used by a treatment plan is vector line drawing data (such as a polygon line drawing) ( It is composed of lines and dots having size and direction. For this reason, in the conventional techniques such as those described in
これに対し、本実施の形態によれば、操作者がカウント値又はSUV値を用いて閾値の設定を行うことにより、演算装置6によって自動的に腫瘍領域の輪郭をPET画像13から抽出し、さらにその輪郭データをベクトル線画データに変換して、治療計画に用いることが可能である。これにより、従来のように操作者が手間をかけて腫瘍領域の輪郭をなぞる必要がなくなるので、領域設定作業を大幅に簡便にすることができる。さらに、閾値を用いて自動で輪郭の抽出を行うことから、操作者の熟練度等によらない、再現性のある(言い換えれば信頼性の高い)腫瘍領域の設定が可能となる。したがって、本実施の形態によれば、簡便且つ的確に腫瘍領域を設定することができる。
On the other hand, according to the present embodiment, the operator sets the threshold value using the count value or the SUV value, so that the
なお、以上説明した本実施形態では、ベクトル線画としてベジエ曲線を例にとって説明したが、ベジエ曲線の代わりに例えばポリゴン線等の他のベクトル線画を用いてもよいのは言うまでもない。 In the embodiment described above, a Bezier curve is described as an example of the vector line drawing. However, it goes without saying that another vector line drawing such as a polygon line may be used instead of the Bezier curve.
また、本実施形態ではモニタ5の右側の画像表示領域12にX線CT画像10とPET画像13とを重ねて表示するようにしたが、治療計画を立案したい部位(軟組織等)の場所によってはMRI画像を使用した方がより良く観察できる場合があり、そのような場合には画像表示領域12にMRI画像とPET画像13とを重ねて表示するようにしてもよい。
In the present embodiment, the
またさらに、本実施形態ではモニタ5の表示を画像表示領域11と画像表示領域12とに2分割し、X線CT画像10と、X線CT画像10にPET画像13を重ね合わせた画像とを並べて表示するように構成しているが、これに限らず、例えばモニタ5の表示を一つの画像表示領域、すなわちX線CT画像10とPET画像13とを重ねて表示する画像表示領域12のみで構成するようにしてもよい。
Furthermore, in the present embodiment, the display of the monitor 5 is divided into an image display region 11 and an image display region 12, and an
2 医療画像サーバ(画像サーバ)
5 モニタ(表示装置)
6 演算装置
2 Medical image server (image server)
5 Monitor (display device)
6 Arithmetic unit
Claims (11)
腫瘍領域を含むX線CT画像情報及び核医学画像情報を格納する画像サーバと、
前記核医学画像情報から腫瘍領域の輪郭情報を抽出し、前記抽出した輪郭情報をベクトル線画情報に変換する演算装置と、
前記演算装置で変換した前記ベクトル線画情報を前記X線CT画像情報に重ねて表示する表示装置と
を備えたことを特徴とする腫瘍領域設定システム。 In the tumor area setting system for setting the tumor area during radiotherapy,
An image server for storing X-ray CT image information and nuclear medicine image information including a tumor region;
Extracting the outline information of the tumor region from the nuclear medicine image information, and converting the extracted outline information into vector line drawing information;
A tumor region setting system, comprising: a display device that displays the vector line drawing information converted by the arithmetic device on the X-ray CT image information.
腫瘍領域を含むX線CT画像情報及び核医学画像情報を格納する画像サーバと、
前記核医学画像情報から腫瘍領域の輪郭情報を抽出し、前記抽出した輪郭情報をベクトル線画情報に変換する演算装置と、
前記X線CT画像情報である第1画像情報と、前記X線CT画像情報と前記核医学画像情報とを重ね合わせた第2画像情報とを並べて表示すると共に、前記演算装置で変換した前記ベクトル線画情報を前記第1画像情報に重ねて表示する表示装置と
を備えたことを特徴とする腫瘍領域設定システム。 In the tumor area setting system for setting the tumor area during radiotherapy,
An image server for storing X-ray CT image information and nuclear medicine image information including a tumor region;
Extracting the outline information of the tumor region from the nuclear medicine image information, and converting the extracted outline information into vector line drawing information;
The first image information which is the X-ray CT image information and the second image information obtained by superimposing the X-ray CT image information and the nuclear medicine image information are displayed side by side, and the vector converted by the arithmetic device A tumor region setting system comprising: a display device that displays line drawing information superimposed on the first image information.
腫瘍領域を含むX線CT画像情報、核医学画像情報、及びMRI画像情報を格納する画像サーバと、
前記核医学画像情報から腫瘍領域の輪郭情報を抽出し、前記抽出した輪郭情報をベクトル線画情報に変換する演算装置と、
前記X線CT画像情報である第1画像情報と、前記MRI画像情報と前記核医学画像情報とを重ね合わせた第2画像情報とを並べて表示すると共に、前記演算装置で変換した前記ベクトル線画情報を前記第1画像情報に重ねて表示する表示装置と
を備えたことを特徴とする腫瘍領域設定システム。
In the tumor area setting system for setting the tumor area during radiotherapy,
An image server for storing X-ray CT image information including a tumor region, nuclear medicine image information, and MRI image information;
Extracting the outline information of the tumor region from the nuclear medicine image information, and converting the extracted outline information into vector line drawing information;
The first image information as the X-ray CT image information and the second image information obtained by superimposing the MRI image information and the nuclear medicine image information are displayed side by side, and the vector line drawing information converted by the arithmetic unit is displayed. And a display device that displays the image on the first image information.
Priority Applications (1)
| Application Number | Priority Date | Filing Date | Title |
|---|---|---|---|
| JP2004070760A JP2005253755A (en) | 2004-03-12 | 2004-03-12 | Tumor region setting method and tumor region setting system |
Applications Claiming Priority (1)
| Application Number | Priority Date | Filing Date | Title |
|---|---|---|---|
| JP2004070760A JP2005253755A (en) | 2004-03-12 | 2004-03-12 | Tumor region setting method and tumor region setting system |
Publications (2)
| Publication Number | Publication Date |
|---|---|
| JP2005253755A true JP2005253755A (en) | 2005-09-22 |
| JP2005253755A5 JP2005253755A5 (en) | 2006-02-02 |
Family
ID=35080066
Family Applications (1)
| Application Number | Title | Priority Date | Filing Date |
|---|---|---|---|
| JP2004070760A Pending JP2005253755A (en) | 2004-03-12 | 2004-03-12 | Tumor region setting method and tumor region setting system |
Country Status (1)
| Country | Link |
|---|---|
| JP (1) | JP2005253755A (en) |
Cited By (6)
| Publication number | Priority date | Publication date | Assignee | Title |
|---|---|---|---|---|
| US7440545B2 (en) | 2005-08-31 | 2008-10-21 | Hitachi, Ltd. | Positioning system and method for radiation therapy |
| JP2010505558A (en) * | 2006-10-10 | 2010-02-25 | セダラ ソフトウェア コーポレイション | System and method for segmenting regions in medical images |
| JP2010154944A (en) * | 2008-12-26 | 2010-07-15 | Toshiba Corp | Medical image diagnostic apparatus and fusion image generation method |
| JP2013044615A (en) * | 2011-08-23 | 2013-03-04 | Toshiba Corp | Medical image diagnostic device, image information display device and control program |
| JP2015205110A (en) * | 2014-04-23 | 2015-11-19 | 三菱電機株式会社 | Patient positioning system and positional deviation amount calculation method |
| KR20220095760A (en) * | 2020-12-30 | 2022-07-07 | 계명대학교 산학협력단 | Prediction method for high risk subjects of lung cancer using parameter in positron emission tomography image and analysis apparatus |
-
2004
- 2004-03-12 JP JP2004070760A patent/JP2005253755A/en active Pending
Cited By (7)
| Publication number | Priority date | Publication date | Assignee | Title |
|---|---|---|---|---|
| US7440545B2 (en) | 2005-08-31 | 2008-10-21 | Hitachi, Ltd. | Positioning system and method for radiation therapy |
| JP2010505558A (en) * | 2006-10-10 | 2010-02-25 | セダラ ソフトウェア コーポレイション | System and method for segmenting regions in medical images |
| JP2010154944A (en) * | 2008-12-26 | 2010-07-15 | Toshiba Corp | Medical image diagnostic apparatus and fusion image generation method |
| JP2013044615A (en) * | 2011-08-23 | 2013-03-04 | Toshiba Corp | Medical image diagnostic device, image information display device and control program |
| JP2015205110A (en) * | 2014-04-23 | 2015-11-19 | 三菱電機株式会社 | Patient positioning system and positional deviation amount calculation method |
| KR20220095760A (en) * | 2020-12-30 | 2022-07-07 | 계명대학교 산학협력단 | Prediction method for high risk subjects of lung cancer using parameter in positron emission tomography image and analysis apparatus |
| KR102524555B1 (en) | 2020-12-30 | 2023-04-20 | 계명대학교 산학협력단 | Prediction method for high risk subjects of lung cancer using parameter in positron emission tomography image and analysis apparatus |
Similar Documents
| Publication | Publication Date | Title |
|---|---|---|
| CN109493328B (en) | Medical image display method, viewing device and computer device | |
| KR101913586B1 (en) | Dental image registration method, apparatus, and recording medium thereof | |
| US8290303B2 (en) | Enhanced system and method for volume based registration | |
| JP4879901B2 (en) | Image processing method, image processing program, and image processing apparatus | |
| US20070118100A1 (en) | System and method for improved ablation of tumors | |
| CN100559397C (en) | The affine registration method and system of two dimensional image and operation forward three-dimensional viewing in the operation | |
| JP2012518784A (en) | MR coil attenuation correction in hybrid PET / MR system | |
| US10460508B2 (en) | Visualization with anatomical intelligence | |
| Kagadis et al. | A comparative study of surface‐and volume‐based techniques for the automatic registration between CT and SPECT brain images | |
| CN110570483A (en) | scanning method, scanning device, computer equipment and storage medium | |
| US20210312644A1 (en) | Soft Tissue Stereo-Tracking | |
| CN103648390A (en) | Follow up image acquisition planning and/or post processing | |
| CN111317498B (en) | Image reconstruction method and device, equipment and storage medium | |
| CN113920114B (en) | Image processing method, image processing apparatus, computer device, storage medium, and program product | |
| WO2011041475A1 (en) | Medical image analysis system using n-way belief propagation for anatomical images subject to deformation and related methods | |
| US20110081061A1 (en) | Medical image analysis system for anatomical images subject to deformation and related methods | |
| EP2168492A1 (en) | Medical image displaying apparatus, medical image displaying method, and medical image displaying program | |
| CN114943714A (en) | Medical image processing system, medical image processing apparatus, electronic device, and storage medium | |
| US9014448B2 (en) | Associating acquired images with objects | |
| JP2005253755A (en) | Tumor region setting method and tumor region setting system | |
| JPH08161520A (en) | Method for extracting object part from three-dimensional image | |
| EP2483864A1 (en) | Medical image analysis system for displaying anatomical images subject to deformation and related methods | |
| US20070160272A1 (en) | Tumor region setting method and system | |
| JP2017204041A (en) | Observation information creation device and system | |
| KR20160031794A (en) | Lesion Detection Apparatus and Method |
Legal Events
| Date | Code | Title | Description |
|---|---|---|---|
| A521 | Request for written amendment filed |
Free format text: JAPANESE INTERMEDIATE CODE: A523 Effective date: 20051209 |
|
| A621 | Written request for application examination |
Free format text: JAPANESE INTERMEDIATE CODE: A621 Effective date: 20051209 |
|
| A871 | Explanation of circumstances concerning accelerated examination |
Free format text: JAPANESE INTERMEDIATE CODE: A871 Effective date: 20060331 |
|
| A975 | Report on accelerated examination |
Free format text: JAPANESE INTERMEDIATE CODE: A971005 Effective date: 20060606 |
|
| A131 | Notification of reasons for refusal |
Free format text: JAPANESE INTERMEDIATE CODE: A131 Effective date: 20060704 |
|
| A521 | Request for written amendment filed |
Free format text: JAPANESE INTERMEDIATE CODE: A523 Effective date: 20060831 |
|
| A02 | Decision of refusal |
Free format text: JAPANESE INTERMEDIATE CODE: A02 Effective date: 20061003 |