JP2005121663A - Method and apparatus for estimating component concentration of mixture - Google Patents
Method and apparatus for estimating component concentration of mixture Download PDFInfo
- Publication number
- JP2005121663A JP2005121663A JP2004303570A JP2004303570A JP2005121663A JP 2005121663 A JP2005121663 A JP 2005121663A JP 2004303570 A JP2004303570 A JP 2004303570A JP 2004303570 A JP2004303570 A JP 2004303570A JP 2005121663 A JP2005121663 A JP 2005121663A
- Authority
- JP
- Japan
- Prior art keywords
- concentration
- correction model
- small group
- data set
- dependent variable
- Prior art date
- Legal status (The legal status is an assumption and is not a legal conclusion. Google has not performed a legal analysis and makes no representation as to the accuracy of the status listed.)
- Granted
Links
Images


Classifications
-
- G—PHYSICS
- G01—MEASURING; TESTING
- G01N—INVESTIGATING OR ANALYSING MATERIALS BY DETERMINING THEIR CHEMICAL OR PHYSICAL PROPERTIES
- G01N33/00—Investigating or analysing materials by specific methods not covered by groups G01N1/00 - G01N31/00
-
- G—PHYSICS
- G01—MEASURING; TESTING
- G01N—INVESTIGATING OR ANALYSING MATERIALS BY DETERMINING THEIR CHEMICAL OR PHYSICAL PROPERTIES
- G01N21/00—Investigating or analysing materials by the use of optical means, i.e. using sub-millimetre waves, infrared, visible or ultraviolet light
- G01N21/17—Systems in which incident light is modified in accordance with the properties of the material investigated
- G01N21/25—Colour; Spectral properties, i.e. comparison of effect of material on the light at two or more different wavelengths or wavelength bands
- G01N21/27—Colour; Spectral properties, i.e. comparison of effect of material on the light at two or more different wavelengths or wavelength bands using photo-electric detection ; circuits for computing concentration
- G01N21/274—Calibration, base line adjustment, drift correction
-
- A—HUMAN NECESSITIES
- A61—MEDICAL OR VETERINARY SCIENCE; HYGIENE
- A61B—DIAGNOSIS; SURGERY; IDENTIFICATION
- A61B2560/00—Constructional details of operational features of apparatus; Accessories for medical measuring apparatus
- A61B2560/02—Operational features
- A61B2560/0223—Operational features of calibration, e.g. protocols for calibrating sensors
-
- A—HUMAN NECESSITIES
- A61—MEDICAL OR VETERINARY SCIENCE; HYGIENE
- A61B—DIAGNOSIS; SURGERY; IDENTIFICATION
- A61B5/00—Measuring for diagnostic purposes; Identification of persons
- A61B5/145—Measuring characteristics of blood in vivo, e.g. gas concentration or pH-value ; Measuring characteristics of body fluids or tissues, e.g. interstitial fluid or cerebral tissue
- A61B5/14532—Measuring characteristics of blood in vivo, e.g. gas concentration or pH-value ; Measuring characteristics of body fluids or tissues, e.g. interstitial fluid or cerebral tissue for measuring glucose, e.g. by tissue impedance measurement
Landscapes
- Physics & Mathematics (AREA)
- Health & Medical Sciences (AREA)
- Chemical & Material Sciences (AREA)
- Life Sciences & Earth Sciences (AREA)
- General Health & Medical Sciences (AREA)
- General Physics & Mathematics (AREA)
- Pathology (AREA)
- Immunology (AREA)
- Analytical Chemistry (AREA)
- Biochemistry (AREA)
- Engineering & Computer Science (AREA)
- Spectroscopy & Molecular Physics (AREA)
- Mathematical Physics (AREA)
- Theoretical Computer Science (AREA)
- Food Science & Technology (AREA)
- Medicinal Chemistry (AREA)
- Investigating Or Analysing Materials By Optical Means (AREA)
- Investigating Or Analysing Materials By The Use Of Chemical Reactions (AREA)
- Investigating Or Analyzing Non-Biological Materials By The Use Of Chemical Means (AREA)
- Management, Administration, Business Operations System, And Electronic Commerce (AREA)
Abstract
【課題】 混合物の成分濃度推定方法及び装置を提供する。
【解決手段】 濃度を推定しようとする所定の特定成分を含む複数の独立変数により決定される前記濃度値を従属変数とする補正データセットに対して全域補正モデルを構成する段階と、前記補正データセットを前記従属変数値によって少なくとも2つ以上の小グループに分離し、前記分離された各小グループに属する補正データセットを用いて各小グループ別のローカル補正モデルを構成する段階と、与えられた混合物スペクトルが属する小グループを決定し、決定された小グループのローカル補正モデルを用いて前記特定成分の濃度を推定する段階とよりなる混合物の成分濃度推定方法。
【選択図】図3
PROBLEM TO BE SOLVED: To provide a component concentration estimation method and apparatus for a mixture.
Forming a global correction model for a correction data set having the concentration value determined by a plurality of independent variables including a predetermined specific component whose density is to be estimated as a dependent variable; and the correction data Separating a set into at least two or more small groups according to the dependent variable values, and constructing a local correction model for each small group using a correction data set belonging to each of the separated small groups; and A component concentration estimation method for a mixture comprising: determining a small group to which the mixture spectrum belongs, and estimating the concentration of the specific component using a local correction model of the determined small group.
[Selection] Figure 3
Description
本発明は、混合物の成分濃度推定に係り、特に複数のローカル補正モデルを用いて混合物スペクトルに含まれた特定成分の濃度を推定する方法及び装置に関する。 The present invention relates to a component concentration estimation of a mixture, and more particularly to a method and apparatus for estimating the concentration of a specific component contained in a mixture spectrum using a plurality of local correction models.
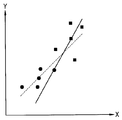
混合物のスペクトルから特定成分の濃度を推定するために一般的に使われる方法、例えばPCR(Principal Component Regression)のような多変量分析法では補正データセットから回帰モデルである全域補正モデルを構成し、全域補正モデルを用いて与えられたスペクトルから特定成分の濃度を予測する。ところが、全域補正モデルを構成するための補正データセットを得る過程では必然的にノイズが発生する。一般的に、ノイズの大きさや特徴は補正データセット全体にわたって同一でないために、ノイズの大きさや特徴によって補正データセットを概念的に多数の小グループに分離する。この場合、補正データセットから全域補正モデルを構成するようになれば、何れか一つの小グループのノイズ特性が他の小グループに伝播される可能性がある。例えば、補正データセットの何れか一つの小グループにはノイズが全くないとしても、全域補正モデルを構成する場合には他の小グループのノイズが伝播されて予測誤差を誘発させる恐れがある。すなわち、図1A及び図1Bに示されたように一つの全域補正モデルを適用する場合、独立変数x値を基準として任意の小グループには適切に適用できるが、他のグループには正確に適用され難い問題点がある。 In a method generally used for estimating the concentration of a specific component from a spectrum of a mixture, for example, a multivariate analysis method such as PCR (Principal Component Regression), a global correction model that is a regression model is constructed from a correction data set, The concentration of a specific component is predicted from a given spectrum using a global correction model. However, noise is inevitably generated in the process of obtaining a correction data set for constructing the global correction model. In general, since the magnitude and characteristics of noise are not the same throughout the correction data set, the correction data set is conceptually separated into a number of small groups according to the magnitude and characteristics of noise. In this case, if a global correction model is configured from the correction data set, the noise characteristics of any one small group may be propagated to other small groups. For example, even if there is no noise in any one small group of the correction data set, when forming the whole area correction model, there is a possibility that noise of other small groups is propagated to induce a prediction error. That is, as shown in FIGS. 1A and 1B, when one global correction model is applied, it can be appropriately applied to an arbitrary small group based on the independent variable x value, but it can be applied accurately to other groups. There is a problem that is difficult to be done.
本発明がな解決しようとする技術的課題は、多変量分析法を利用した特定成分の濃度予測時に発生可能なノイズの伝播問題を解決するために、所定の補正データセットを複数の小グループに分離し、各小グループ別にローカル補正モデルを構成するための方法を提供することである。 The technical problem to be solved by the present invention is that a predetermined correction data set is divided into a plurality of small groups in order to solve the problem of noise propagation that can occur when predicting the concentration of a specific component using multivariate analysis. To provide a method for separating and configuring a local correction model for each small group.
本発明が解決しようとする他の技術的課題は、多変量分析法を利用した特定成分の濃度予測時に発生できるノイズの伝播問題を解決するために、複数のローカル補正モデルを用いて混合物の成分濃度を予測するための方法及び装置を提供することである。 Another technical problem to be solved by the present invention is to solve the problem of noise propagation that can occur when predicting the concentration of a specific component using a multivariate analysis method. It is to provide a method and apparatus for predicting concentration.
前記技術的課題を達成するために、本発明に係るローカル補正モデル生成方法は、(a)濃度を推定しようとする所定の特定成分を含む複数の独立変数により決定される前記濃度値を従属変数とする補正データセットを前記従属変数値によって少なくとも2つ以上の小グループに分離する段階と、(b)前記分離された各小グループに属する補正データセットを用いて各小グループ別のローカル補正モデルを構成する段階と、を含むことが望ましい。 In order to achieve the technical problem, a local correction model generation method according to the present invention includes: (a) a concentration variable determined by a plurality of independent variables including a predetermined specific component whose concentration is to be estimated; Separating the correction data set into at least two or more small groups according to the dependent variable value, and (b) a local correction model for each small group using the correction data set belonging to each of the separated small groups. Preferably comprising the steps of:
前記他の技術的課題を達成するために、本発明に係る混合物の成分濃度推定方法は、(a)濃度を推定しようとする所定の特定成分を含む複数の独立変数により決定される前記濃度値を従属変数とする補正データセットに対して全域補正モデルを構成する段階と、(b)前記補正データセットを前記従属変数値によって少なくとも2つ以上の小グループに分離し、前記分離された各小グループに属する補正データセットを用いて各小グループ別のローカル補正モデルを構成する段階と、(c)与えられた混合物スペクトルが属する小グループを決定し、決定された小グループのローカル補正モデルを用いて前記特定成分の濃度を推定する段階と、を含むことが望ましい。 In order to achieve the other technical problem, a component concentration estimation method for a mixture according to the present invention includes: (a) the concentration value determined by a plurality of independent variables including a predetermined specific component to be estimated for concentration; (B) separating the correction data set into at least two small groups according to the dependent variable values, and forming each of the separated small data Forming a local correction model for each small group using a correction data set belonging to the group; and (c) determining a small group to which a given mixture spectrum belongs, and using the determined local correction model of the small group And estimating the concentration of the specific component.
前記他の技術的課題を達成するために、本発明に係る混合物の成分濃度推定装置は、濃度を推定しようとする所定の特定成分を含む複数の独立変数により決定される前記濃度値を従属変数とする補正データセットに対して全域補正モデルを構成し、前記全域補正モデルを保存する第1補正モデル形成手段と、前記補正データセットを前記従属変数値によって少なくとも2つ以上の小グループに分離し、前記分離された各小グループに属する補正データセットを用いて各小グループ別のローカル補正モデルを構成し、小グループ別のローカル補正モデルを保存する第2補正モデル形成手段と、与えられた混合物スペクトルが属する小グループを決定する小グループ決定部と、前記決定された小グループのローカル補正モデルを用いて前記与えられた混合物スペクトルに含まれた前記特定成分の濃度を推定する濃度推定部と、を含むことが望ましい。 In order to achieve the other technical problem, the component concentration estimation apparatus for a mixture according to the present invention uses the concentration value determined by a plurality of independent variables including a predetermined specific component to be estimated as a dependent variable. And a first correction model forming means for storing the whole area correction model and separating the correction data set into at least two small groups according to the dependent variable values. A second correction model forming means for forming a local correction model for each small group using the correction data set belonging to each of the separated small groups, and storing the local correction model for each small group, and a given mixture A small group determination unit for determining a small group to which the spectrum belongs, and a local correction model of the determined small group; A concentration estimating unit for the estimate the concentration of a specific component mixture contained in the spectrum, it is desirable to include.
前記方法は、望ましくはコンピュータで実行させるためのプログラムを記録したコンピュータ可読記録媒体に具現できる。 Preferably, the method can be embodied on a computer-readable recording medium in which a program for executing on a computer is recorded.
本発明によれば、補正データセットに存在するノイズの大きさや特徴が独立変数値の全区間にわたって同一でない場合、補正データセットを少なくとも2つ以上の小グループに分離して各小グループ別にローカル補正モデルを構成し、与えられた混合物スペクトルが属する小グループのローカル補正モデルを適用して特定成分の濃度を推定することによって、何れか一つの小グループによる予測誤差が他の小グループには影響を及ぼさなく全体的に予測誤差を減少させうる。 According to the present invention, when the magnitude and characteristics of noise present in the correction data set are not the same over the entire interval of the independent variable value, the correction data set is divided into at least two small groups and local correction is performed for each small group. By constructing a model and applying the local correction model of a small group to which a given mixture spectrum belongs to estimate the concentration of a specific component, the prediction error due to any one small group affects the other small groups. Overall, the prediction error can be reduced.
以下、添付した図面に基づき、本発明の望ましい実施例について詳細に説明する。
一般的に補正モデル、すなわち、回帰モデルの構成にあたって、変数xとyは次の数式1のような直線回帰模型で表現できると仮定する。
Hereinafter, preferred embodiments of the present invention will be described in detail with reference to the accompanying drawings.
In general, in constructing a correction model, that is, a regression model, it is assumed that the variables x and y can be expressed by a linear regression model such as the following Equation 1.
![]()
ここで、εは誤差項であって、次の数式2のような統計的な特性を有すると仮定する。
![]()
Here, ε is an error term, and is assumed to have statistical characteristics as shown in the following Equation 2.
![]()
すなわち、あらゆるxに対して誤差項εは等分散性を有すると仮定する。しかし、実際においては誤差項の非同質性によってあらゆるxに対して等分散性の条件を充足させない場合が多い。特に、x値が大きくなるほど誤差項の分散が大きくなる場合には大きい値を有するxにおける誤差が小さな値を有するxに伝播されてくるために、小さな値を有するxでの予測力に悪影響をおよぼす。レベレッジ(leverage)が大きい値を有するxでの誤差が小さな値を有するxに伝播されてくる理由は、通常の場合、レベレッジが大きい値を有するxが回帰モデルの構成時に小さな値を有するxより大きい影響をおよぼすためである。したがって、この場合には与えられた補正データセットを多数の小グループに分離し、各小グループごとにローカル補正モデルを構成すれば、誤差の伝播による予測力の損傷を減少させることができる。以下、補正データセットを多数の小グループに分離する方法について説明する。
![]()
That is, it is assumed that the error term ε has equal dispersion for all x. However, in practice, the equivariance condition is often not satisfied for every x due to the non-homogeneity of the error term. In particular, when the variance of the error term increases as the x value increases, the error in x having a large value is propagated to x having a small value, which adversely affects the predictive power at x having a small value. It affects. The reason why an error at x having a large level of leverage is propagated to x having a small value is usually that x having a large level of leverage is more than x having a small value when constructing a regression model. This is to have a great influence. Therefore, in this case, if a given correction data set is divided into a large number of small groups and a local correction model is formed for each small group, damage to prediction power due to error propagation can be reduced. Hereinafter, a method for separating the correction data set into a large number of small groups will be described.
まず、回帰線y^が次の数式3のような形式を有すると推定する。

ここで、b0、b1、y^はそれぞれβ0、β1、yの推定値を表す。
First, it is presumed that the regression line y ^ has a form like the following Equation 3.
Here, b 0 , b 1 , and y ^ represent estimated values of β 0 , β 1 , and y, respectively.
b0及びb1は、最小ニ乗法を用いて次の数式4及び数式5のように求められる。
前記数式4及び数式5において、x−及びy−はそれぞれxの平均とyの平均を表す。
b 0 and b 1 are obtained as shown in the
In Formula 4 and Formula 5, x − and y − represent the average of x and the average of y, respectively.
一方、前記数式3は次の数式6ないし8のように再配列する。
![]()
![]()
ここで、S(xy)及びS(xx)は、次の数式9のように表される。
yの推定値y^に対する期待値E(y^)は次の数式10のように表される。
次に、yの推定値y^に対する分散Var(y^)は次の数式11のように表される。
すなわち、yの推定値y^に対する分散Var(y^)は次の数式12のように表される。
一方、一つのy値の信頼区間Var(ys^)は、次の数式13のように求められる。
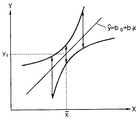
前記数式13において、y値の信頼区間Var(ys^)は2次グラフに近似化させることができ、図4において回帰線の上部に位置するグラフに該当する。回帰線の下部に位置するグラフは、上部に位置するグラフを回帰線に対して対称させたものである。任意のxに対して2つの2次グラフでy値の差をy値の信頼区間Var(ys^)と決定する。
前記数式13からy値の信頼区間Var(ys^)はxの関数であって、xがxの平均と同じである時、すなわち、x=x− である場合に最小値となり、この最小値から対称にx値がxの平均から遠いほど大きくなる。したがって、補正データセットを多数の小グループに分離する方法は、補正データセットをxの平均を基準とした濃度によって分離することが望ましい。その理由は、複数のローカル補正モデルを利用する場合、与えられたスペクトルからどの小グループに属しているかを決定しなければならないが、2つの小グループに分離する場合にはxの平均を基準として補正データセットを分離する場合にエラー率が最小になれる。
On the other hand, a confidence interval Var (y s ^) of one y value is obtained as in the following Equation 13.
In Equation 13, the confidence interval Var (y s ^) of the y value can be approximated to a quadratic graph, and corresponds to the graph located above the regression line in FIG. The graph located at the bottom of the regression line is obtained by making the graph located at the top symmetrical with respect to the regression line. The difference between y values in two quadratic graphs for an arbitrary x is determined as a confidence interval Var (y s ^) of y values.
From Equation 13, the confidence interval Var (y s ^) of the y value is a function of x, and becomes the minimum value when x is the same as the average of x, that is, when x = x − , Symmetrically, the x value increases with distance from the average of x. Therefore, in the method of separating the correction data set into a large number of small groups, it is desirable to separate the correction data set by density based on the average of x. The reason is that when multiple local correction models are used, it is necessary to determine which small group belongs to a given spectrum, but when separating into two small groups, the average of x is used as a reference. The error rate can be minimized when separating the correction data sets.
図2は、本発明に係る混合物の成分濃度推定装置の一実施例の構成を示したブロック図であって、全域補正モデル生成部211、第1貯蔵部212、ローカル補正モデル生成部213、第2貯蔵部214、小グループ決定部215、及び濃度推定部216からなる。
FIG. 2 is a block diagram showing the configuration of an embodiment of the component concentration estimation apparatus of the mixture according to the present invention. The entire area correction
図2を参照すれば、全域補正モデル生成部211では濃度を推定しようとする所定の特定成分を含む複数の独立変数により決定される濃度値を従属変数とする補正データセットに対して全域補正モデルを構成し、全域補正モデルを第1貯蔵部212に保存する。
Referring to FIG. 2, the global correction
ローカル補正モデル生成部213では補正データセットを前記従属変数値によって少なくとも2つ以上の小グループに分離し、前記分離された各小グループに属する補正データセットを用いて各小グループ別のローカル補正モデルを構成し、小グループ別のローカル補正モデルを第2貯蔵部214に保存する。分離しようとする小グループが2つである場合、独立変数の平均に該当する従属変数値を基準として分離することが望ましい。分離しようとする小グループが2つ以上である場合、従属変数値の平均を基準として分離することが望ましい。他の成分としては、濃度を推定しようとする特定成分、例えばグルコースの妨害成分、すなわちヘモグロビンを用いて補正データセットを分離できる。
The local correction
小グループ決定部215では全域補正モデル生成部211から生成された全域補正モデルおよびローカル補正モデル生成部213から分離された小グループ別補正データセットを参照して、与えられた混合物スペクトルが属する小グループを決定する。この時、与えられた混合物スペクトルに対して全域補正モデルを適用して得られる特定成分の濃度値を用いて混合物スペクトルが属する小グループを決定する。
The small
濃度推定部216では小グループ決定部215から決定された小グループのローカル補正モデルを用いて与えられた混合物スペクトルに含まれた特定成分の濃度を推定する。この時、推定された濃度値が推定時に適用されるローカル補正モデルによる濃度範囲に属しない場合、与えられた混合物スペクトルに全域補正モデルを適用して特定成分の濃度値を推定する。
The
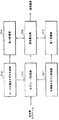
図3は、本発明に係る混合物の成分濃度推定方法の一実施例の動作を説明したフローチャートである。
図3を参照すれば、311段階においては、一般的な多変量分析法を適用して補正データセット全体に対する全域回帰モデルを構成する。
FIG. 3 is a flowchart for explaining the operation of an embodiment of the method for estimating the component concentration of a mixture according to the present invention.
Referring to FIG. 3, in
312段階においては、補正データセットをn個(ここでnは2以上の整数)の小グループに分離する。この時、nが2である場合、独立変数の平均に該当する従属変数値を基準とし、nが2以上である場合、従属変数値の平均を基準として分離する。一方、濃度を推定しようとする特定成分の妨害成分を用いて補正データセットを分離できる。例えば、特定成分がグルコースである場合ヘモグロビンが妨害成分に該当する。
In
313段階においては、全域補正モデルの構成に使われた多変量分析法を用いて各小グループに対するローカル補正モデルを構成する。
In
314段階においては、与えられた混合物スペクトルが属する小グループを決定する。このために、与えられた混合物スペクトルに全域補正モデルを適用して予備濃度値を算出し、与えられた混合物スペクトルの小グループを予備濃度値が属する小グループに決定する。
In
315段階においては、与えられた混合物スペクトルが属する小グループのローカル補正モデルを適用して特定成分の濃度を予測する。
In
316段階においては、315段階で予測された濃度が該当小グループに設定されている濃度範囲内に存在しているかを判断する。
In
317段階においては、316段階での判断結果、予測された濃度が該当小グループに設定されている濃度範囲内に存在していない場合には、311段階で生成された全域補正モデルを与えた混合物スペクトルに適用して特定成分の濃度を予測する。
In
318段階においては、315段階または317段階で予測された濃度を特定成分に対する推定濃度として決定する。
In
本発明は、またコンピュータ可読記録媒体にコンピュータ可読コードとして具現することができる。コンピュータ可読記録媒体は、コンピュータシステムによって読取り可能なデータが保存されるあらゆる種類の記録装置を含む。コンピュータ可読記録媒体の例としては、ROM、RAM、CD−ROM、磁気テープ、フロッピー(登録商標)ディスク、光データ貯蔵装置などがあり、また、キャリアウェーブ(例えばインターネットを通じた伝送)の形態に具現されるものも含む。また、コンピュータ可読記録媒体は、ネットワークにより連結されたコンピュータシステムに分散され、分散方式によってコンピュータが読取り可能なコードが保存されて実行できる。そして、本発明を具現するための機能的なプログラム、コード及びコードセグメントは本発明が属する技術分野のプログラマーにより容易に推論できる。 The present invention can also be embodied as computer readable code on a computer readable recording medium. Computer-readable recording media include any type of recording device that can store data which can be read by a computer system. Examples of computer readable recording media include ROM, RAM, CD-ROM, magnetic tape, floppy (registered trademark) disk, optical data storage device, etc., and embodied in the form of carrier wave (for example, transmission via the Internet). Including those that are made. The computer-readable recording medium is distributed in a computer system connected by a network, and a computer-readable code can be stored and executed by a distributed method. A functional program, code and code segment for embodying the present invention can be easily inferred by a programmer in the technical field to which the present invention belongs.
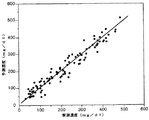
一方、本発明による混合物の成分濃度推定方法の性能を評価するために100個のインビトロ(in−vitro)補正データセットに対して複数のローカル補正モデルを適用した。この時、補正データセットのサンプル数は100個であり、濃度の最小値は31mg/dl、最大値は485mg/dl、平均は221mg/dlであった。このような補正データセットに対して従来のように全域補正モデルを使用する場合、図5Aに示されたように、予測誤差は17.01%であり、濃度を3区間に分離して予測誤差を分析する場合、図5Bに示されたように濃度が小さな区間であるほど相対誤差が大きくなることがわかる。特に、濃度が31〜145mg/dl区間では相対誤差が31%に至った。 Meanwhile, in order to evaluate the performance of the component concentration estimation method of the mixture according to the present invention, a plurality of local correction models were applied to 100 in-vitro correction data sets. At this time, the number of samples in the correction data set was 100, the minimum value of the concentration was 31 mg / dl, the maximum value was 485 mg / dl, and the average was 221 mg / dl. When the whole area correction model is used for such a correction data set as in the prior art, the prediction error is 17.01% as shown in FIG. 5A, and the prediction error is divided into three sections. As shown in FIG. 5B, it can be seen that the relative error increases as the density decreases. In particular, the relative error reached 31% in the concentration range of 31 to 145 mg / dl.
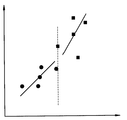
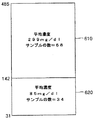
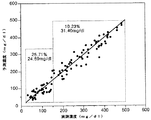
一方、本発明に係る複数のローカル補正モデルを使用する場合、図6Aに示すように補正データセットを2つの小グループ610、620に分離し、各小グループに対してローカル補正モデルを構成し、予測誤差を分析した結果は、図6Bに示すように全域補正モデルを使用する場合に比べて特に低濃度での相対誤差が25.71%に減少した。また、複数のローカル補正モデルを使用する場合、予測誤差は15.29%に全域補正モデルに比べて1.71%減少した。
On the other hand, when using a plurality of local correction models according to the present invention, the correction data set is separated into two
以上、図面と明細書において最適の実施例が開示された。ここで特定の用語が使われたが、これは単に本発明を説明するために使われたものであって、意味限定や特許請求の範囲上に記載された本発明の範囲を制限するために使われたものではない。したがって、当業者であれば、これより多様な変形及び均等な他の実施例が可能である。したがって、本発明の真の技術的な保護範囲は特許請求の範囲上の技術的な思想によって決まるべきである。 In the foregoing, the preferred embodiments have been disclosed in the drawings and specification. Although specific terms are used herein, they are merely used to describe the present invention and are intended to limit the scope of the invention as defined in the meaning limitation and claims. It was not used. Accordingly, those skilled in the art can make various modifications and other equivalent embodiments. Therefore, the true technical protection scope of the present invention should be determined by the technical concept of the claims.
本発明は、混合物で特定成分の濃度予測のために使われる多変量分析法に適用されて、補正データセットを複数の小グループに分離して各小グループ別にローカル補正モデルを構成し、与えられた混合物スペクトルが属する小グループのローカル補正モデルを適用して特定成分の濃度を推定することによって、特定成分の濃度予測時に発生可能なノイズの伝播問題を解決する。 The present invention is applied to a multivariate analysis method used for predicting the concentration of a specific component in a mixture, and a correction data set is divided into a plurality of small groups to form a local correction model for each small group. By applying a local correction model of a small group to which the mixture spectrum belongs, the concentration of the specific component is estimated, thereby solving the problem of noise propagation that can occur when the concentration of the specific component is predicted.
211・・・全域補正モデル生成部
212・・・第1貯蔵部
213・・・ローカル補正モデル生成部
214・・・第2貯蔵部
215・・・小グループ決定部
216・・・濃度推定部
211 ... Global correction
Claims (16)
(b)前記分離された各小グループに属する補正データセットを用いて各小グループ別のローカル補正モデルを構成する段階と、を含むことを特徴とするローカル補正モデル生成方法。 (A) A correction data set having the concentration value determined by a plurality of independent variables including a predetermined specific component whose concentration is to be estimated as a dependent variable is separated into at least two small groups by the dependent variable value. Stages,
And (b) forming a local correction model for each small group using the correction data set belonging to each of the separated small groups.
(b)前記補正データセットを前記従属変数値によって少なくとも2つ以上の小グループに分離し、前記分離された各小グループに属する補正データセットを用いて各小グループ別のローカル補正モデルを構成する段階と、
(c)与えられた混合物スペクトルが属する小グループを決定し、決定された小グループのローカル補正モデルを用いて前記特定成分の濃度を推定する段階と、を含むことを特徴とする混合物の成分濃度推定方法。 (A) configuring a global correction model for a correction data set having the concentration value as a dependent variable determined by a plurality of independent variables including a predetermined specific component whose density is to be estimated;
(B) The correction data set is separated into at least two or more small groups according to the dependent variable values, and a local correction model for each small group is configured using the correction data sets belonging to the separated small groups. Stages,
(C) determining a small group to which a given mixture spectrum belongs, and estimating a concentration of the specific component using a local correction model of the determined small group, and including the component concentration of the mixture Estimation method.
(d)前記(c)段階で推定された濃度値が推定時に適用されるローカル補正モデルによる濃度範囲に属しない場合、前記全域補正モデルを適用して前記特定成分の濃度値を推定する段階をさらに含むことを特徴とする請求項5に記載の混合物の成分濃度推定方法。 The method
(D) When the concentration value estimated in the step (c) does not belong to the concentration range based on the local correction model applied at the time of estimation, the step of estimating the concentration value of the specific component by applying the global correction model Furthermore, the component concentration estimation method of the mixture of Claim 5 characterized by the above-mentioned.
(b)前記分離された各小グループに属する補正データセットを用いて各小グループ別のローカル補正モデルを構成する段階と、を含むローカル補正モデル生成方法を実行できるプログラムを記録したコンピュータ可読記録媒体。 (A) A correction data set having the concentration value determined by a plurality of independent variables including a predetermined specific component whose concentration is to be estimated as a dependent variable is separated into at least two small groups by the dependent variable value. Stages,
(B) configuring a local correction model for each small group using the correction data set belonging to each of the separated small groups, and a computer-readable recording medium recording a program capable of executing a local correction model generation method .
(b)前記補正データセットを前記従属変数値によって少なくとも2つ以上の小グループに分離し、前記分離された各小グループに属する補正データセットを用いて各小グループ別のローカル補正モデルを構成する段階と、
(c)与えられた混合物スペクトルが属する小グループを決定し、決定された小グループのローカル補正モデルを用いて前記特定成分の濃度を推定する段階と、を含む混合物の成分濃度推定方法を実行できるプログラムを記録したコンピュータ可読記録媒体。 (A) configuring a global correction model for a correction data set having the concentration value as a dependent variable determined by a plurality of independent variables including a predetermined specific component whose density is to be estimated;
(B) The correction data set is separated into at least two or more small groups according to the dependent variable values, and a local correction model for each small group is configured using the correction data sets belonging to the separated small groups. Stages,
(C) determining a small group to which a given mixture spectrum belongs, and estimating a concentration of the specific component using a local correction model of the determined small group, and performing a component concentration estimation method for the mixture including A computer-readable recording medium on which a program is recorded.
前記補正データセットを前記従属変数値によって少なくとも2つ以上の小グループに分離し、前記分離された各小グループに属する補正データセットを用いて各小グループ別のローカル補正モデルを構成し、小グループ別のローカル補正モデルを保存する第2補正モデル形成手段と、
与えられた混合物スペクトルが属する小グループを決定する小グループ決定部と、
前記決定された小グループのローカル補正モデルを用いて前記与えられた混合物スペクトルに含まれた前記特定成分の濃度を推定する濃度推定部と、を含むことを特徴とする混合物の成分濃度推定装置。 First, a global correction model is configured for a correction data set having the density value determined by a plurality of independent variables including a predetermined specific component whose density is to be estimated as a dependent variable, and the global correction model is stored. Correction model forming means;
The correction data set is separated into at least two or more small groups according to the dependent variable value, and a local correction model for each small group is configured using the correction data set belonging to each of the separated small groups. Second correction model forming means for storing another local correction model;
A small group determination unit for determining a small group to which a given mixture spectrum belongs;
And a concentration estimating unit for estimating the concentration of the specific component contained in the given mixture spectrum using the determined small group local correction model.
When the density value of the specific component estimated using the determined small group local correction model does not belong to the density range based on the local correction model applied at the time of estimation, the density estimation unit determines the global correction model. 14. The component concentration estimation apparatus for a mixture according to claim 13, wherein the concentration value of the specific component is estimated by application.
Applications Claiming Priority (1)
| Application Number | Priority Date | Filing Date | Title |
|---|---|---|---|
| KR1020030072135A KR100580625B1 (en) | 2003-10-16 | 2003-10-16 | Method and apparatus for estimating component concentration of a mixture |
Publications (2)
| Publication Number | Publication Date |
|---|---|
| JP2005121663A true JP2005121663A (en) | 2005-05-12 |
| JP4261456B2 JP4261456B2 (en) | 2009-04-30 |
Family
ID=34510891
Family Applications (1)
| Application Number | Title | Priority Date | Filing Date |
|---|---|---|---|
| JP2004303570A Expired - Fee Related JP4261456B2 (en) | 2003-10-16 | 2004-10-18 | Method and apparatus for estimating component concentration of mixture |
Country Status (3)
| Country | Link |
|---|---|
| US (1) | US7289912B2 (en) |
| JP (1) | JP4261456B2 (en) |
| KR (1) | KR100580625B1 (en) |
Cited By (2)
| Publication number | Priority date | Publication date | Assignee | Title |
|---|---|---|---|---|
| WO2015174073A1 (en) * | 2014-05-13 | 2015-11-19 | パナソニックIpマネジメント株式会社 | Food analysis device |
| JP2023115777A (en) * | 2022-02-08 | 2023-08-21 | 旭化成メディカル株式会社 | Concentration calculation device, blood processing system, and concentration calculation method |
Families Citing this family (2)
| Publication number | Priority date | Publication date | Assignee | Title |
|---|---|---|---|---|
| US8392343B2 (en) * | 2010-07-21 | 2013-03-05 | Yahoo! Inc. | Estimating probabilities of events in sponsored search using adaptive models |
| KR102593306B1 (en) | 2023-03-21 | 2023-10-25 | 부경대학교 산학협력단 | Apparatus and method for estimating concentration distribution of fluorescent tracer in low-permeability medium |
Family Cites Families (1)
| Publication number | Priority date | Publication date | Assignee | Title |
|---|---|---|---|---|
| US7451065B2 (en) * | 2002-03-11 | 2008-11-11 | International Business Machines Corporation | Method for constructing segmentation-based predictive models |
-
2003
- 2003-10-16 KR KR1020030072135A patent/KR100580625B1/en not_active Expired - Fee Related
-
2004
- 2004-10-15 US US10/964,717 patent/US7289912B2/en not_active Expired - Lifetime
- 2004-10-18 JP JP2004303570A patent/JP4261456B2/en not_active Expired - Fee Related
Cited By (3)
| Publication number | Priority date | Publication date | Assignee | Title |
|---|---|---|---|---|
| WO2015174073A1 (en) * | 2014-05-13 | 2015-11-19 | パナソニックIpマネジメント株式会社 | Food analysis device |
| JP2015215273A (en) * | 2014-05-13 | 2015-12-03 | パナソニックIpマネジメント株式会社 | Food product analysis device |
| JP2023115777A (en) * | 2022-02-08 | 2023-08-21 | 旭化成メディカル株式会社 | Concentration calculation device, blood processing system, and concentration calculation method |
Also Published As
| Publication number | Publication date |
|---|---|
| US7289912B2 (en) | 2007-10-30 |
| US20050086018A1 (en) | 2005-04-21 |
| KR100580625B1 (en) | 2006-05-16 |
| JP4261456B2 (en) | 2009-04-30 |
| KR20050036447A (en) | 2005-04-20 |
Similar Documents
| Publication | Publication Date | Title |
|---|---|---|
| Kuhn | Variable selection using the caret package | |
| US20190095423A1 (en) | Text recognition method and apparatus, and storage medium | |
| US20100076910A1 (en) | Calculating web page importance based on web behavior model | |
| JPWO2019111435A1 (en) | Abnormality judgment device, abnormality judgment method, and program | |
| JP4261456B2 (en) | Method and apparatus for estimating component concentration of mixture | |
| JP2000194745A (en) | Trend evaluating device and method | |
| CN112445613B (en) | Elastic expansion and contraction method, electronic device and storage medium for stream processing platform | |
| Zhang et al. | Improving efficiency of diffusion models via multi-stage framework and tailored multi-decoder architectures | |
| US20130144587A1 (en) | Scalability evaluation device, scalability evaluation method, and scalability evaluation program | |
| US7877335B2 (en) | System and method for learning a network of categories using prediction | |
| CN116542013A (en) | Reliability evaluation method, system and storage medium for power edge computing chip | |
| US20250307674A1 (en) | Parameter estimation device and parameter estimation method | |
| JP2019211633A (en) | Voice processing program, voice processing method and voice processing device | |
| JP5135803B2 (en) | Optimal parameter search program, optimal parameter search device, and optimal parameter search method | |
| JP2000040079A (en) | Parallel data analyzer | |
| US20120046923A1 (en) | Circuit performance estimation device and circuit performance estimation method | |
| KR20170061911A (en) | Method for constructing fused regression network and fused analysis system thereof | |
| KR20160075103A (en) | Method and Device for Predicting Preference of New Content | |
| US20240039833A1 (en) | Multi-path routing method and apparatus oriented to supercomputing user experience quality | |
| KR20210067278A (en) | Device and method for extracting sample graph from original graph having properties of original graph | |
| JP5411823B2 (en) | Estimated value accuracy improving system, estimated value accuracy improving method, and estimated value accuracy improving program | |
| JP2011257676A (en) | Test parameter estimation method, test parameter estimation program and test parameter estimation device | |
| JP7768234B2 (en) | Cosmetics manufacturing support device, cosmetics manufacturing support method, and cosmetics manufacturing support program | |
| CN109584959B (en) | Method and device for correcting sequencing depth | |
| CN109767813B (en) | Method and device for correcting sequencing depth |
Legal Events
| Date | Code | Title | Description |
|---|---|---|---|
| A131 | Notification of reasons for refusal |
Free format text: JAPANESE INTERMEDIATE CODE: A131 Effective date: 20071030 |
|
| A521 | Written amendment |
Free format text: JAPANESE INTERMEDIATE CODE: A523 Effective date: 20080129 |
|
| A131 | Notification of reasons for refusal |
Free format text: JAPANESE INTERMEDIATE CODE: A131 Effective date: 20080408 |
|
| A601 | Written request for extension of time |
Free format text: JAPANESE INTERMEDIATE CODE: A601 Effective date: 20080708 |
|
| A602 | Written permission of extension of time |
Free format text: JAPANESE INTERMEDIATE CODE: A602 Effective date: 20080711 |
|
| A521 | Written amendment |
Free format text: JAPANESE INTERMEDIATE CODE: A523 Effective date: 20080808 |
|
| TRDD | Decision of grant or rejection written | ||
| A01 | Written decision to grant a patent or to grant a registration (utility model) |
Free format text: JAPANESE INTERMEDIATE CODE: A01 Effective date: 20090106 |
|
| A01 | Written decision to grant a patent or to grant a registration (utility model) |
Free format text: JAPANESE INTERMEDIATE CODE: A01 |
|
| A61 | First payment of annual fees (during grant procedure) |
Free format text: JAPANESE INTERMEDIATE CODE: A61 Effective date: 20090205 |
|
| FPAY | Renewal fee payment (event date is renewal date of database) |
Free format text: PAYMENT UNTIL: 20120220 Year of fee payment: 3 |
|
| R150 | Certificate of patent or registration of utility model |
Ref document number: 4261456 Country of ref document: JP Free format text: JAPANESE INTERMEDIATE CODE: R150 Free format text: JAPANESE INTERMEDIATE CODE: R150 |
|
| FPAY | Renewal fee payment (event date is renewal date of database) |
Free format text: PAYMENT UNTIL: 20120220 Year of fee payment: 3 |
|
| FPAY | Renewal fee payment (event date is renewal date of database) |
Free format text: PAYMENT UNTIL: 20130220 Year of fee payment: 4 |
|
| R250 | Receipt of annual fees |
Free format text: JAPANESE INTERMEDIATE CODE: R250 |
|
| FPAY | Renewal fee payment (event date is renewal date of database) |
Free format text: PAYMENT UNTIL: 20140220 Year of fee payment: 5 |
|
| R250 | Receipt of annual fees |
Free format text: JAPANESE INTERMEDIATE CODE: R250 |
|
| R250 | Receipt of annual fees |
Free format text: JAPANESE INTERMEDIATE CODE: R250 |
|
| R250 | Receipt of annual fees |
Free format text: JAPANESE INTERMEDIATE CODE: R250 |
|
| R250 | Receipt of annual fees |
Free format text: JAPANESE INTERMEDIATE CODE: R250 |
|
| R250 | Receipt of annual fees |
Free format text: JAPANESE INTERMEDIATE CODE: R250 |
|
| R250 | Receipt of annual fees |
Free format text: JAPANESE INTERMEDIATE CODE: R250 |
|
| R250 | Receipt of annual fees |
Free format text: JAPANESE INTERMEDIATE CODE: R250 |
|
| R250 | Receipt of annual fees |
Free format text: JAPANESE INTERMEDIATE CODE: R250 |
|
| LAPS | Cancellation because of no payment of annual fees |