JP2004537902A - Automatic thresholding of noisy images - Google Patents
Automatic thresholding of noisy images Download PDFInfo
- Publication number
- JP2004537902A JP2004537902A JP2003517840A JP2003517840A JP2004537902A JP 2004537902 A JP2004537902 A JP 2004537902A JP 2003517840 A JP2003517840 A JP 2003517840A JP 2003517840 A JP2003517840 A JP 2003517840A JP 2004537902 A JP2004537902 A JP 2004537902A
- Authority
- JP
- Japan
- Prior art keywords
- feature size
- average feature
- image
- subset
- threshold
- Prior art date
- Legal status (The legal status is an assumption and is not a legal conclusion. Google has not performed a legal analysis and makes no representation as to the accuracy of the status listed.)
- Withdrawn
Links
Images
Classifications
-
- G—PHYSICS
- G06—COMPUTING; CALCULATING OR COUNTING
- G06T—IMAGE DATA PROCESSING OR GENERATION, IN GENERAL
- G06T5/00—Image enhancement or restoration
-
- G—PHYSICS
- G06—COMPUTING; CALCULATING OR COUNTING
- G06T—IMAGE DATA PROCESSING OR GENERATION, IN GENERAL
- G06T7/00—Image analysis
- G06T7/10—Segmentation; Edge detection
- G06T7/11—Region-based segmentation
-
- G—PHYSICS
- G06—COMPUTING; CALCULATING OR COUNTING
- G06T—IMAGE DATA PROCESSING OR GENERATION, IN GENERAL
- G06T7/00—Image analysis
- G06T7/10—Segmentation; Edge detection
- G06T7/136—Segmentation; Edge detection involving thresholding
-
- G—PHYSICS
- G06—COMPUTING; CALCULATING OR COUNTING
- G06V—IMAGE OR VIDEO RECOGNITION OR UNDERSTANDING
- G06V10/00—Arrangements for image or video recognition or understanding
- G06V10/20—Image preprocessing
- G06V10/28—Quantising the image, e.g. histogram thresholding for discrimination between background and foreground patterns
-
- G—PHYSICS
- G06—COMPUTING; CALCULATING OR COUNTING
- G06T—IMAGE DATA PROCESSING OR GENERATION, IN GENERAL
- G06T2207/00—Indexing scheme for image analysis or image enhancement
- G06T2207/10—Image acquisition modality
- G06T2207/10016—Video; Image sequence
-
- G—PHYSICS
- G06—COMPUTING; CALCULATING OR COUNTING
- G06T—IMAGE DATA PROCESSING OR GENERATION, IN GENERAL
- G06T2207/00—Indexing scheme for image analysis or image enhancement
- G06T2207/10—Image acquisition modality
- G06T2207/10064—Fluorescence image
Landscapes
- Engineering & Computer Science (AREA)
- Physics & Mathematics (AREA)
- General Physics & Mathematics (AREA)
- Theoretical Computer Science (AREA)
- Computer Vision & Pattern Recognition (AREA)
- Multimedia (AREA)
- Image Analysis (AREA)
- Image Processing (AREA)
- Facsimile Image Signal Circuits (AREA)
Abstract
本発明は、画像に対する最適閾値(to)を選択する方法であって、画像を取得するステップと、上記画像のテストセグメントを選択するステップと、複数の閾値(t)のそれぞれにおいてテストセグメントに現れる特徴の平均特徴サイズ(S)を決定し、平均特徴サイズデータ(S(t))を生成するステップと、平均特徴サイズデータ(S(t))の関連部分集合を選択するステップと、平均特徴サイズデータの上記の部分集合の関数として最適閾値(to)を決定するステップと、を含む方法から構成される画像処理方法を提供する。本発明は、本発明の方法によって決定される最適閾値(to)の利用によって、二値画像を生成するための画像の閾値処理方法をさらに提供する。The present invention is a method for selecting an optimal threshold (t o ) for an image, comprising the steps of acquiring an image, selecting a test segment of the image, and selecting a test segment at each of a plurality of thresholds (t). Determining an average feature size (S) of appearing features and generating average feature size data (S (t)); selecting a relevant subset of the average feature size data (S (t)); Determining an optimal threshold value (t o ) as a function of the above subset of feature size data. The present invention, by the use of the optimal threshold value determined by the method of the present invention (t o), further provides a thresholding method of an image to produce a binary image.
Description
【0001】
(発明の技術分野)
本発明は、画像に対する最適閾値(to)を選択するための方法を含む画像処理の自動化可能な方法に関するものであり、最適閾値(to)は複数の閾値(t)のそれぞれにおいて画像中で検出された特徴の平均特徴サイズ(S)を表している平均特徴サイズデータ(S(t))の関数として選択される。このようにして決定された最適閾値(to)は、画像の閾値処理を行って低雑音二値画像を生成するために使用できる。
【0002】
(背景技術)
一般に、「閾値処理」によって、多色画像から二値(二色)画像を導出することが公知である。閾値処理において、ピクセルすなわち画素の初期の色調(たとえば灰色の陰影)が選択された閾値(たとえば、輝度の選択レベル)の上または下のいずれかの決定に基づいて、画像のピクセルすなわち画素が2つの色調のうちの一方に(たとえば、黒色または白色)に割り当てられる。
【0003】
同時係属中の出願で、1999年10月21日に出願された米国特許出願第09/422,584号明細書および1999年10月21日に出願された米国特許出願第09/422,535号明細書は、閾値処理によって画像内部の所定の特徴を識別することができることを開示している。
【0004】
特許文献1は、ビデオ信号の閾値処理をして二値セグメント化ビデオ信号を生成する方法に関する。
【0005】
特許文献2は、目の波面収差を自動的に測定する方法に関する。
【0006】
非特許文献1の394〜96頁および416〜18頁は、ディジタル化画像における特徴検出について述べている。
【特許文献1】
米国特許第5,832,111号明細書
【特許文献2】
米国特許第6,199,986号明細書
【非特許文献1】
ジョン・C・ラス(John C,Russ)著「The Image Processing Handbook(画像処理ハンドブック)」、第2版、(CRC Press 1995)
【0007】
(発明の概要)
簡単に言えば、本発明は、画像に対する最適閾値(to)を選択するための自動化可能な方法であって、画像を取得するステップと、画像のテストセグメントを選択するステップと、複数の閾値(t)のそれぞれにおいてテストセグメントに現れる特徴の平均特徴サイズ(S)を決定し、平均特徴サイズデータ(S(t))を生成するステップと、平均特徴サイズデータ(S(t))の関連部分集合を選択するステップと、平均特徴サイズデータの関連部分集合の関数として最適閾値(to)を決定するステップと、を含む方法を提供する。一般的に、最適閾値(to)は、平均特徴サイズデータの関連部分集合の中間点に等しいか、または近い閾値であると決定される。さらに一般的に、最適閾値(to)は、平均特徴サイズ(S(t))に基づいて重み付けされた平均特徴サイズデータの関連部分集合に現れている加重平均閾値(t)と見なされる。一般的に、関連部分集合は、平均特徴サイズデータの低い閾値飽和水平域を排除するために決定される。S(t)が1%〜100%であり、一般的に1%である平均特徴サイズデータにおいて観察されるSの最大値(Smax)の所与の百分率より大きい値を排除することによって、これを実現することができる。別法およびより一般的に、計数データ(N(t))は、複数の閾値(t)のそれぞれにおいて画像のテストセグメントに現れる特徴の数(N)を計数することによって生成され、平均特徴サイズデータ(S(t))の関連部分集合は、計数データ(N(t))の関数として選択される。一般的に、カットオフ閾値(tc)は、計数データ(N(t))から決定され、平均特徴サイズデータ(S(t))の関連部分集合を決定するために用いられる。平均特徴サイズデータ(S(t))の関連部分集合は、t>tcの場合のすべての値またはt≧tcの場合のすべての値を包含することによって選択される。一般的に、カットオフ閾値(tc)は、計数データ(N(t))の関数として決定され、この関数は、計数データ(N(t))の初期雑音ピークと次の低傾斜領域との間の移行範囲になるカットオフ閾値(tc)を提供する。一般的に、カットオフ閾値(tc)は、関数tc=2tP%−tQ%によって決定される。式中、tP%は、N(t)が計数データで観測されるNの最大値(Nmax)のP%を超えない場合のtの最小値であり、tQ%は、N(t)が計数データで観測されるNの最大値(Nmax)のQ%を超えない場合のtの最小値であり、P%≧Q%であり、P%およびQ%は1%〜100%の間の数から独立に選択される。より一般的に、P%は50%〜95%の間の数から選択され、Q%は5%〜95%の間の数から選択される。
【0008】
別の態様において、本発明は、画像に対する最適閾値(to)を選択するために、本願明細書に開示された任意の方法を含む画像を閾値処理するための自動化可能な方法を提供する。
【0009】
別の態様において、本発明は、画像に対する最適閾値(to)を決定するためのシステムであって、a)ディジタル化画像を提供するための画像素子と、b)データ記憶装置と、c)画像素子からディジタル化画像を受信し、データ記憶装置に書込みしたりデータ記憶装置から読出したりすることができる中央処理装置と、を具備し、中央処理装置が、画像に対する最適閾値(to)を選択するために、本願明細書に開示された方法を実行するようにプログラムされているシステムを提供する。
【0010】
別の態様において、本発明は、画像を閾値処理するためのシステムであって、a)ディジタル化画像を形成するための画像素子と、b)データ記憶装置と、c)画像素子からディジタル化画像を受信し、データ記憶装置に書込みしたりデータ記憶装置から読出したりすることができる中央処理装置と、を具備し、中央処理装置が、画像を閾値処理するために、本願明細書に開示された方法を実行するようにプログラムされているシステムを提供する。
【0011】
別の態様において、本発明は、コンピュータへの導入およびソフトウェアの実行によって、コンピュータに画像に対する最適閾値(to)を選択するための本願明細書に開示された方法を実行させるソフトウェアを記録したデータ記録媒体を提供する。
【0012】
別の態様において、本発明は、コンピュータへの導入およびソフトウェアの実行によって、コンピュータに画像を閾値処理するための本願明細書に開示された方法を実行させるソフトウェアを記録したデータ記録媒体を提供する。
【0013】
当業界で説明されておらず、本発明に提供されることは、平均特徴サイズデータ(S(t))の関数としてtoを選択することによって、ノイズアーティファクトを最小限に抑える画像に対する最適閾値(to)を選択するための自動化可能な方法である。
【0014】
本出願において、
「二値画像」なる語は、たとえば、灰色の陰影などの本質的に任意の中間値を含まない黒色および白色などの2色すなわち2値の画像を意味する。ディジタル画像の場合にはすべての中間値は一般的に排除されるのに対し、光化学画像では中間値の完全な排除は可能ではないと思われる。
【0015】
「特徴」なる語は、類似の値を有する隣接するピクセルすなわち画素の群を意味する。隣接するピクセルすなわち画素は、任意の適切な態様で定義されてもよい。隣接するピクセルすなわち画素は、エッジ(4近傍則)を共有するピクセルすなわち画素のみを含んでもよく、さらに一般的には、エッジまたはコーナ(8近傍則)を共有するピクセルすなわち画素のみを含んでもよい。あるいは、隣接するピクセルすなわち画素は、任意の第3のピクセルすなわち画素を通過することなく直線セグメントによって接続できるピクセルすなわち画素として定義されてもよい。二値画像の場合には、類似の値を有するピクセルすなわち画素は、本質的に同値を有するピクセルすなわち画素である。一般的に、一値は、背景値を表し、その値の「特徴」は排除される。
【0016】
「テストセグメント」なる語は、画像に関して、テストされるものとして選択される画像の一部を意味し、画像の100%まで含むことができる。
【0017】
「平均特徴サイズ」なる語は、一般的にエリアサイズ、ピクセルすなわち画素の数、または類似の測定値として表される一連の特徴の平均サイズを意味している。
【0018】
本発明の効果は、自動化することができ、雑音を排除し、正確な特徴検出を行う画像の閾値処理方法を提供することである。
【0019】
(好ましい実施の形態の詳細な説明)
本発明は、画像に対する最適閾値(to)を選択する方法であって、画像を取得するステップと、上記画像のテストセグメントを選択するステップと、複数の閾値(t)のそれぞれにおいてテストセグメントに現れる特徴の平均特徴サイズ(S)を決定し、平均特徴サイズデータ(S(t))を生成するステップと、平均特徴サイズデータ(S(t))の関連部分集合を選択するステップと、平均特徴サイズデータの上記の部分集合の関数として最適閾値(to)を決定するステップと、を含む方法から構成される画像処理方法を提供する。
【0020】
画像を取得するステップは、任意の適切な方法によって実現されることができる。ビデオカメラ、ディジタルカメラ、光化学カメラ、顕微鏡、視覚走査システム、探針走査システムまたは二次元アレイにおけるデータ点を生成する他の検知装置の利用によって、画像を収集することができる。一般的に、目標画像は、本質的に、明確な特徴を含むが、さらに雑音を含む可能性もある二値画像であると予測される。画像が、画像撮影装置または画像撮影装置によってディジタル形式で最初に生成されない場合には、画像は一般的に、ピクセルにディジタル化される。一般的に、本願明細書に記載された方法は、中央処理装置またはコンピュータの利用によって実現される。
【0021】
図1は、本発明が用いることができる走査システムを示している。図1のシステムにおいて、光の集光ビームが物体を通過し、システムは結果として生じる反射光または蛍光光を検出する。このために、光源10からの光は、光源光学素子12を通って集光され、ミラー14によってここではサンプル用3×4検出プレート16として示される物体の方に偏向される。光源10からの光は、モータ24を用いてミラー14の位置を変更することによって、サンプル上の異なる位置に指向されることができる。サンプル16から発せられた蛍光またはサンプル16からの反射光は、一般に半鍍銀鏡であるミラー15を介して検出光学素子18に戻される。あるいは、光源を中央に用いることができ、米国特許第5,900,949号明細書に示されているように、システムの側面から放射光または蛍光光を検出することができるか、または光源がシステムの側面から用いることができ、中央で放射光または蛍光光を検出することができるか、または任意の他の類似の変形である。検出光学素子18を通過する光は、テレビカメラ、CCD、レーザ反射システム、光電子増倍管、アバランシェフォトダイオード、フォトダイオードまたは単光子計数モジュールなどの任意の適切な画像撮影システム20を用いて検出され、その出力は、解析のためまたはシステム全体を制御するようにプログラムされたコンピュータ22に供給される。コンピュータ22は、一般的に、プログラムを実行するための中央処理装置と、RAM、ハードディスクドライブまたはデータ記憶のための類似の装置などのシステムと、を具備している。この説明は、例示のために過ぎないことを理解されたい。本発明は、光に基づく画像だけでなく、磁気センサまたは触覚センサなどから生成された「シミュレート」画像にも、また、サンプル16だけでなく、検査対象の任意の物体を用いて生成された画像にも等しく同様に使用できる。
【0022】
画像のテストセグメントを選択するステップにおいて、一般的に、テストセグメントは、画像全体を代表するものを追及する。テストセグメントは新しい画像のそれぞれに関して選択されてもよく、一定のテストセグメントエリアが多数の画像のそれぞれに関して用いられてもよい。自動システムにおいて、テストセグメントは一般的に予め決定され同一のセグメント領域が処理されるすべての画像に関して用いられる。テストセグメントは、画像の100%まで含むことができる。計算を簡単にするために、テストセグメントは画像のすべてより少ない部分を含むことができる。テスト画像が特定の特徴を含んでいると予想される場合には、テストセグメントは少なくとも1つの所期の特徴と含むことが一般的であり、4つ以上の特徴を含めばさらに一般的である。
【0023】
平均特徴サイズデータ(S(t))を生成するために、テストセグメントに現れる特徴の平均特徴サイズ(S)が、複数の閾値(t)のそれぞれにおいて決定される。上述したように、「特徴」は、さまざまな方法で定義されることができる。一般的に、8近傍則が用いられる。同一の定義が一般的に、プロセス全体に用いられる。テストセグメントの境界に接している特徴は、含めてもよく排除してもよい。含められるテストセグメントの境界に接している特徴は、全体サイズに含まれてもよく、テストセグメントに含まれる一部にのみ含まれてよい。境界に接している特徴に関する同規則は一般的に、プロセス全体に用いられる。一般的に、テストセグメントの境界に接している特徴は、テストセグメントであるがテストセグメントに含まれる一部にのみに含まれる。平均特徴サイズデータ(S(t))は、tの利用可能な値のすべてに関して算出されることができる。tの利用可能な値は、ディジタル画像において256の値であってもよい。より少ない値を用いる場合には、最良の最適閾値(to)を決定する際に、精度を犠牲にして計算時間を短縮することができる。一般的に、256の可能な値を有するディジタル画像において、tのすべての4つの値に関して、平均特徴サイズデータ(S(t))が算出される。
【0024】
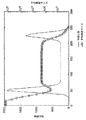
図3には、図2のシミュレートによる雑音を含む画像に関して得られた検出された平均特徴サイズ(S(t))対検出レベル閾値(t)(右の目盛り)を示すグラフが挙げられている。選択された閾値レベルのデータは、表Iに示されている。
【0025】
【表1】

本説明および本図のために、特徴は黒い背景に白い画像として表され、明るめの陰影はtのより高い値を表すことを留意されたい。しかし、たとえば、「より大きい」および「より小さい」を逆にするなど、必要に応じて、用語を調整することによって、逆の決まりを用いてもよい。
【0027】
図3および表Iはまた、複数の閾値(t)のそれぞれにおいて画像に表れる特徴の数(N)の数を計数することによって得られた検出された特徴の数(N(t))対検出レベル閾値(t)(図3の左の目盛り)として作図された計数データのグラフも含む。図3に反映された計算の場合には、テストセグメントは全体画像であり、「特徴」は8近傍則を用いて定義され、計算はtのすべての第4の値に関して行われた。
【0028】
図4〜9は、表Iに示されたように、以下の閾値レベル35、50、75、140、205および225における図2の雑音を含む画像を閾値処理して得られた二値画像である。図7は、本発明によって決定された最適閾値(to)における雑音を含む画像をして得られ、本発明による閾値処理方法の二値画像生成物を示している。
【0029】
図4〜9の検討から、図7が最適に定義され、最も雑音の少ない二値画像であることがわかる。表Iの検討から、図7に関連する閾値は、N(t)(特徴の数)の浅い極小値およびS(t)(特徴サイズ)の浅い極大値に現れていることがわかる。このような所見は、背景および特徴エリアの両方に置いて観察される最小の雑音を含むピクセルと一致する。対照的に、図6は、背景エリアに雑音を含むピクセルを示し、図8は特徴エリアに雑音を含むピクセルを示している。
【0030】
本発明による方法において、最適閾値(to)は、図3のt=75とt=205との間に生じる平均特徴サイズデータの中間点に等しいか、または近い閾値であると決定される。一般的に、平均特徴サイズデータの関連部分集合を得るために、最適閾値(to)は、平均特徴サイズデータの低い閾値飽和水平域を排除した後に、平均特徴サイズ(S(t))に基づいて重み付けされた平均特徴サイズデータに現れている加重平均閾値(t)と見なされる。低い閾値飽和水平域は、図3ではt=0とおよそt=50との間に見られる。図3および4は、画像がこのような低い閾値で「色褪め」し、特徴が1つまたは少数の連続特徴を形成するために効果的に結合され、その結果、きわめて高い平均特徴サイズを生じることを示している。S(t)が1%〜100%であり、一般的に1%である平均特徴サイズデータにおいて観察されるSの最大値(Smax)の所与の百分率より大きい値を排除することによって、関連部分集合を得ることができる。一般的に、Sの最大値のサイズは画像のテストセグメント全体に近づくと予想されるため、百分率は、画像のテストセグメント全体のサイズに対する画像のテストセグメントで予想される特徴のサイズの比より幾分大きいように選択される。あるいは、低い閾値飽和水平域におけるデータを削除するために、S(t)の一定値が、カットオフ値として選択されてもよい。
【0031】
より一般的には、カットオフ閾値(tc)は、計数データ(N(t))から決定され、平均特徴サイズデータ(S(t))の関連部分集合を決定するために用いられる。平均特徴サイズデータ(S(t))の関連部分集合は、t>tcの場合のすべての値またはt≧tcの場合のすべての値を含むことによって選択される。一般的に、カットオフ閾値(tc)は、計数データ(N(t))の関数として決定され、この関数は、計数データ(N(t))の初期雑音ピークと次の水平領域との間の移行範囲になるカットオフ閾値(tc)を決定する。一般的に、カットオフ閾値(tc)は、関数tc=2tP%−tQ%によって決定される。式中、tP%は、N(t)が計数データで観測されるNの最大値(Nmax)のP%を超えない場合のtの最小値であり、tQ%は、N(t)が計数データで観測されるNの最大値(Nmax)のQ%を超えない場合のtの最小値であり、P%≧Q%であり、P%およびQ%は1%〜100%の間の数から独立に選択される。より一般的に、P%は50%〜95%の間の数から選択され、Q%は5%〜95%の間の数から選択される。P%=95%およびQ%=50%であれば、最も一般的である。
【0032】
画像に対する最適閾値(to)が決定された後、(to)における閾値処理に対応する画像が、データとして出力されてもよく、視覚ディスプレイまたは印刷プロセスなどの任意の適切な態様で画像として出力されてもよく、元画像入力のさらなる解析用のマスクとしての出力画像の利用などさらなるデータ変換プロセスを含んでもよい。
【0033】
一般的に、本発明は、コンピュータ技術を用いて、画像に対する最適閾値(to)を選択するため、または画像を閾値処理するためのシステムを提供することによって自動化される。システムは、a)ディジタル化画像を提供するための画像素子と、b)データ記憶装置と、c)画像素子からディジタル化画像を受信し、データ記憶装置に書込みしたりデータ記憶装置から読出したりすることができる中央処理装置と、を具備することができる。本発明はまた、画像に対する最適閾値(to)を選択するため、または画像を閾値処理するために、コンピュータへの導入およびソフトウェアの実行によって、コンピュータに本願明細書に開示された方法を実行させるソフトウェアを記録したデータ記録媒体も含んでいる。
【0034】
本発明は、3次元に拡張してもよい。3次元の場合には、平均特徴サイズは面積ではなく体積を表すと理解されたい。さらに、本発明による方法の利用によって、より高次の画像およびデータ編集物も解析されることができる。多次元データ空間における雑音の低減、決定またはパターン識別のために、本発明による方法に基づく閾値処理を用いることが可能であることは明白である。
【0035】
本発明は、光学情報の自動読取り、特にDNAの検出または分類などの自動解析プロセスに含まれる可能性があるトレー、スライドなどにおけるサンプル点のマトリックスの自動読取りに有用である。
【0036】
これらの具体的な実施形態は決して本発明の範囲を限定することはないことを理解されたい。閾値処理におけるステップは、必ずしも、個々に記載した順序を厳格に実行する必要はない。同様の目的を実現する任意の順序で行ってもよい。本発明の他の改変も前述の説明を照らせば、当業者には明白であろう。これらの説明は本発明を明確に開示する実施形態の具体的な実例を提供するために過ぎない。したがって、本発明は、説明された実施形態または本願明細書に含まれる特定の素子、寸法、材料または構成の使用に限定されるわけではない。添付の特許請求の範囲の精神および範囲を逸脱しない本発明の他の改変および変形も網羅される。
【図面の簡単な説明】
【0037】
【図1】本発明が用いることができる原型的な走査システムの概略図である。
【図2】図1の走査システムによって撮影することができる類の256の灰色陰影におけるシミュレーションによる雑音を含む画像である。
【図3】本発明の方法による図2の雑音を含む画像に関して得られた検出された特徴の数(N(t))対検出レベル閾値(t)(左の目盛り)および平均特徴サイズ(S(t))対検出レベル閾値(t)(右の目盛り)を示すグラフである。
【図4】閾値レベル35で図2の雑音を含む画像を閾値処理によって得られた二値画像である。
【図5】閾値レベル50で図2の雑音を含む画像を閾値処理によって得られた二値画像である。
【図6】閾値レベル75で図2の雑音を含む画像を閾値処理によって得られた二値画像である。
【図7】閾値レベル140で図2の雑音を含む画像を閾値処理によって得られた二値画像である。本発明による閾値処理方法の生成物を示している。
【図8】閾値レベル205で図2の雑音を含む画像を閾値処理によって得られた二値画像である。
【図9】閾値レベル225で図2の雑音を含む画像を閾値処理によって得られた二値画像である。[0001]
(Technical field of the invention)
The present invention relates to an automatable method of image processing, including a method for selecting an optimal threshold (t o ) for an image, wherein the optimal threshold (t o ) is determined in the image at each of a plurality of thresholds (t). Are selected as a function of the average feature size data (S (t)) representing the average feature size (S) of the features detected in. Thus optimum threshold (t o) that is determined may be used by performing threshold processing of the image to generate a low-noise binary image.
[0002]
(Background technology)
In general, it is known to derive a binary (two-color) image from a multicolor image by “threshold processing”. In thresholding, the pixel or pixel of an image is determined to be 2 pixels based on a determination of whether the pixel's initial tone (eg, gray shading) is above or below a selected threshold (eg, a selected level of luminance). (For example, black or white).
[0003]
No. 09 / 422,584, filed Oct. 21, 1999 and US Patent Application No. 09 / 422,535, filed Oct. 21, 1999, are co-pending applications. The specification discloses that certain features within the image can be identified by thresholding.
[0004]
Patent Document 1 relates to a method of performing threshold processing on a video signal to generate a binary segmented video signal.
[0005]
Patent Document 2 relates to a method for automatically measuring the wavefront aberration of an eye.
[0006]
Non-Patent Document 1 pages 394 to 96 and pages 416 to 18 describe feature detection in digitized images.
[Patent Document 1]
US Patent No. 5,832,111 [Patent Document 2]
US Patent No. 6,199,986 [Non-Patent Document 1]
"The Image Processing Handbook", John C. Russ, Second Edition, (CRC Press 1995).
[0007]
(Summary of the Invention)
Briefly stated, the present invention is an automatable method for selecting an optimal threshold (to) for an image, the method comprising: acquiring an image; selecting a test segment of the image; Determining the average feature size (S) of the feature appearing in the test segment in each of (t) and generating the average feature size data (S (t)), and the relationship between the average feature size data (S (t)) the method comprising the steps of selecting a subset, determining an optimal threshold (t o) as a function of the relevant subset of the average feature size data. Generally, the optimal threshold value (t o) is determined to be equal to the midpoint of the relevant subset of the average feature size data, or near threshold. More generally, the optimal threshold (t o ) is considered as the weighted average threshold (t) appearing in a relevant subset of the average feature size data weighted based on the average feature size (S (t)). Generally, the relevant subset is determined to eliminate low threshold saturation horizon of the average feature size data. By eliminating values greater than a given percentage of the maximum value of S (S max ) observed in average feature size data where S (t) is between 1% and 100%, typically 1%. This can be achieved. Alternatively and more generally, the count data (N (t)) is generated by counting the number of features (N) that appear in a test segment of the image at each of a plurality of thresholds (t), and the average feature size The relevant subset of the data (S (t)) is selected as a function of the count data (N (t)). Generally, the cut-off threshold (t c ) is determined from the count data (N (t)) and is used to determine a relevant subset of the average feature size data (S (t)). Related subset average feature size data (S (t)) is selected by the inclusion of all the values in the case of all the values or t ≧ t c in the case of t> t c. In general, the cut-off threshold (t c ) is determined as a function of the count data (N (t)), which function is based on the initial noise peak of the count data (N (t)) and the next low slope region. Provide a cut-off threshold (t c ) that falls in the transition range between Generally, cut-off threshold (t c) is determined by the function t c = 2t P% -t Q %. In the equation, tP % is the minimum value of t when N (t) does not exceed P% of the maximum value of N ( Nmax ) observed in the count data, and tQ% is N (t ) Is the minimum value of t when it does not exceed Q% of the maximum value of N ( Nmax ) observed in the count data, and P% ≧ Q%, where P% and Q% are 1% to 100%. Are independently selected from the numbers between More generally, P% is selected from a number between 50% and 95%, and Q% is selected from a number between 5% and 95%.
[0008]
In another aspect, the present invention is, in order to select the optimal threshold (t o) for the image, providing automatable method for thresholding an image containing any of the methods disclosed herein.
[0009]
In another aspect, the present invention is a system for determining an optimal threshold (t o ) for an image, comprising: a) an image element for providing a digitized image; b) a data storage device; receiving the digitized image from the image device, comprising: a central processing unit or can read from the write or data storage device in the data storage device, a central processing unit, the optimal threshold value (t o) for the image To select, a system is provided that is programmed to perform the methods disclosed herein.
[0010]
In another aspect, the invention is a system for thresholding an image, comprising: a) an image element for forming a digitized image; b) a data storage device; and c) a digitized image from the image element. A central processing unit capable of receiving and writing to and reading from the data storage device, wherein the central processing device is disclosed herein for thresholding images. A system is provided that is programmed to perform the method.
[0011]
In another aspect, the present invention is the introduction and software execution to the computer, data recorded software for executing the methods disclosed herein for selecting an optimum threshold value (t o) for the image to the computer A recording medium is provided.
[0012]
In another aspect, the present invention provides a data storage medium having software recorded thereon that, when installed on a computer and executed by software, causes the computer to perform the methods disclosed herein for thresholding images.
[0013]
Not been described in the art, be provided in the present invention, by selecting t o as a function of the average feature size data (S (t)), the optimal threshold for image minimize noise artifacts to a minimum An automatable method for selecting (t o ).
[0014]
In this application,
The term "binary image" means a two-color or binary image, such as black and white, that does not contain essentially any intermediate values, such as gray shading. In the case of digital images, all intermediate values are generally rejected, whereas it is not possible in photochemical images to completely eliminate the intermediate values.
[0015]
The term "feature" refers to neighboring pixels or groups of pixels having similar values. Neighboring pixels or pixels may be defined in any suitable manner. Neighboring pixels or pixels may include only pixels or pixels that share an edge (4-neighbor rule), and more generally may include only pixels or pixels that share an edge or corner (8-neighbor rule). . Alternatively, an adjacent pixel or pixel may be defined as a pixel or pixel that can be connected by a straight line segment without passing through any third pixel or pixel. In the case of a binary image, pixels or pixels having similar values are essentially pixels or pixels having the same value. In general, one value represents a background value, and the "feature" of that value is excluded.
[0016]
The term "test segment" refers, with respect to an image, to the portion of the image that is selected to be tested and may include up to 100% of the image.
[0017]
The term "average feature size" refers to the average size of a series of features, typically expressed as area size, pixels or number of pixels, or similar measurements.
[0018]
An advantage of the present invention is to provide an image threshold processing method that can be automated, eliminates noise, and performs accurate feature detection.
[0019]
(Detailed description of preferred embodiments)
The present invention is a method for selecting an optimal threshold (t o ) for an image, comprising the steps of acquiring an image, selecting a test segment of the image, and selecting a test segment at each of a plurality of thresholds (t). Determining an average feature size (S) of appearing features and generating average feature size data (S (t)); selecting a relevant subset of the average feature size data (S (t)); Determining an optimal threshold value (t o ) as a function of the above subset of feature size data.
[0020]
The step of acquiring an image can be implemented by any suitable method. Images can be collected by use of video cameras, digital cameras, photochemical cameras, microscopes, visual scanning systems, probe scanning systems or other sensing devices that generate data points in a two-dimensional array. In general, it is expected that the target image will be a binary image that inherently contains distinct features, but may also contain noise. If the image is not initially generated in digital form by the image capture device or the image capture device, the image is typically digitized into pixels. Generally, the methods described herein are implemented using a central processing unit or a computer.
[0021]
FIG. 1 shows a scanning system that can be used with the present invention. In the system of FIG. 1, a focused beam of light passes through the object, and the system detects the resulting reflected or fluorescent light. To this end, light from light source 10 is collected through light source optics 12 and is deflected by mirror 14 toward an object, here shown as a 3 × 4 detection plate 16 for a sample. Light from the light source 10 can be directed to different positions on the sample by using the motor 24 to change the position of the mirror 14. The fluorescence emitted from the sample 16 or the reflected light from the sample 16 is returned to the detection optical element 18 via a mirror 15 which is generally a half-plated silver mirror. Alternatively, a light source can be used centrally and the emitted or fluorescent light can be detected from the side of the system, as shown in US Pat. No. 5,900,949, or the light source can be It can be used from the side of the system and can detect emitted or fluorescent light in the center, or any other similar variant. Light passing through the detection optics 18 is detected using any suitable imaging system 20, such as a television camera, CCD, laser reflection system, photomultiplier, avalanche photodiode, photodiode or single photon counting module. , The output of which is provided to a computer 22 programmed for analysis or to control the entire system. Computer 22 generally comprises a central processing unit for executing programs and a system such as RAM, a hard disk drive or similar device for data storage. It should be understood that this description is for illustrative purposes only. The present invention was generated not only for light-based images, but also for "simulated" images generated from magnetic or tactile sensors, etc., and using any object to be inspected, not just the sample 16. The same can be used for images.
[0022]
In selecting a test segment for an image, the test segment generally seeks to be representative of the entire image. A test segment may be selected for each of the new images, and a fixed test segment area may be used for each of the multiple images. In automatic systems, test segments are generally used for all images in which the same segment area is processed in advance. Test segments can include up to 100% of the image. For ease of calculation, the test segment can include less than all of the image. If the test image is expected to contain certain features, the test segment will typically include at least one expected feature, and more commonly if it includes four or more features. .
[0023]
To generate the average feature size data (S (t)), the average feature size (S) of the features appearing in the test segment is determined at each of the plurality of thresholds (t). As described above, "features" can be defined in various ways. Generally, an 8-neighbor rule is used. The same definition is generally used throughout the process. Features bordering the test segment boundaries may be included or excluded. Features bordering the boundaries of the included test segments may be included in the overall size or may be included only in some of the included test segments. The same rules for bordering features are generally used throughout the process. In general, features bordering the test segment are included only in a part of the test segment but included in the test segment. Average feature size data (S (t)) can be calculated for all available values of t. The available values of t may be 256 values in the digital image. If fewer values are used, the calculation time can be reduced at the expense of accuracy when determining the best optimal threshold (t o ). Generally, in a digital image having 256 possible values, average feature size data (S (t)) is calculated for all four values of t.
[0024]
FIG. 3 includes a graph showing the detected average feature size (S (t)) versus detection level threshold (t) (right scale) obtained for the simulated noisy image of FIG. I have. The data for the selected threshold level is shown in Table I.
[0025]
[Table 1]
Note that for the purposes of this description and this figure, the features are represented as white images on a black background, and lighter shades represent higher values of t. However, the opposite rule may be used by adjusting the terms as needed, eg, reversing “greater than” and “less than”.
[0027]
FIG. 3 and Table I also show the number of detected features (N (t)) versus the number of detected features (N (t)) obtained by counting the number of features (N) appearing in the image at each of the plurality of thresholds (t). It also includes a graph of the count data plotted as the level threshold (t) (left scale in FIG. 3). In the case of the calculation reflected in FIG. 3, the test segment was the whole image, the "feature" was defined using the eight-neighbor rule, and the calculation was performed for all fourth values of t.
[0028]
4-9 show the binary images obtained by thresholding the noisy image of FIG. 2 at the following
[0029]
4 to 9 show that FIG. 7 is the optimally defined binary image with the least noise. From a study of Table I, it can be seen that the thresholds associated with FIG. 7 appear at shallow local minimums of N (t) (number of features) and at shallow local maximums of S (t) (feature size). Such findings are consistent with pixels containing the least noise observed both in the background and in the feature area. In contrast, FIG. 6 shows a noisy pixel in the background area, and FIG. 8 shows a noisy pixel in the feature area.
[0030]
In the method according to the invention, the optimal threshold (t o ) is determined to be a threshold equal to or near the midpoint of the average feature size data occurring between t = 75 and t = 205 in FIG. Generally, in order to obtain a relevant subset of the average feature size data, the optimal threshold value (t o), after eliminating the low threshold saturation plateau average feature size data, the average feature size (S (t)) It is regarded as the weighted average threshold (t) appearing in the average weighted average feature size data. A low threshold saturation horizon is seen in FIG. 3 between t = 0 and approximately t = 50. FIGS. 3 and 4 show that the images "fade" at such a low threshold and the features are effectively combined to form one or a few continuous features, resulting in a very high average feature size. It is shown that. By eliminating values greater than a given percentage of the maximum value of S (S max ) observed in average feature size data where S (t) is between 1% and 100%, typically 1%. An associated subset can be obtained. In general, the percentage of the maximum value of S is expected to approach the entire test segment of the image, so the percentage is less than the ratio of the size of the features expected in the test segment of the image to the size of the entire test segment of the image. Is chosen to be a minute larger. Alternatively, a constant value of S (t) may be selected as the cutoff value to delete data in the low threshold saturation horizontal region.
[0031]
More generally, the cut-off threshold (t c ) is determined from the count data (N (t)) and is used to determine a relevant subset of the average feature size data (S (t)). Related subset average feature size data (S (t)) is selected by including all values in the case of all the values or t ≧ t c in the case of t> t c. In general, the cut-off threshold (t c ) is determined as a function of the count data (N (t)), which is the function of the initial noise peak of the count data (N (t)) and the next horizontal region. A cut-off threshold (t c ) that is a transition range between the two is determined. Generally, cut-off threshold (t c) is determined by the function t c = 2t P% -t Q %. In the equation, tP % is the minimum value of t when N (t) does not exceed P% of the maximum value of N ( Nmax ) observed in the count data, and tQ% is N (t ) Is the minimum value of t when it does not exceed Q% of the maximum value of N ( Nmax ) observed in the count data, and P% ≧ Q%, where P% and Q% are 1% to 100%. Are independently selected from the numbers between More generally, P% is selected from a number between 50% and 95%, and Q% is selected from a number between 5% and 95%. It is most common if P% = 95% and Q% = 50%.
[0032]
After optimal threshold for image (t o) is determined, the image corresponding to the threshold processing in (t o), may be output as data, as an image in any suitable manner, such as a visual display or printing process It may be output and include further data conversion processes, such as using the output image as a mask for further analysis of the original image input.
[0033]
Generally, the present invention uses the computer technology, for selecting the optimum threshold value (t o) for the image, or the image is automated by providing a system for thresholding the. The system receives a) an image element for providing a digitized image, b) a data storage device, and c) a digitized image from the image element and writes to and reads from the data storage device. And a central processing unit that can perform the processing. The present invention also provides for selecting the optimal threshold (t o) for the image, or the image to threshold processing, the introduction and software execution to the computer to perform the methods disclosed herein to a computer It also includes a data recording medium on which software is recorded.
[0034]
The invention may be extended to three dimensions. In the case of three dimensions, it should be understood that the average feature size represents volume, not area. In addition, higher order images and data compilations can also be analyzed by using the method according to the invention. It is clear that thresholding based on the method according to the invention can be used for noise reduction, determination or pattern identification in a multidimensional data space.
[0035]
The present invention is useful for automatic reading of optical information, particularly for reading matrices of sample points on trays, slides, etc., which may be involved in automatic analysis processes such as DNA detection or classification.
[0036]
It should be understood that these specific embodiments in no way limit the scope of the invention. The steps in the thresholding process do not necessarily have to be performed strictly in the order described. It may be performed in any order that achieves the same purpose. Other modifications of the invention will be apparent to those skilled in the art in light of the foregoing description. These descriptions are merely intended to provide specific examples of embodiments that clearly disclose the present invention. Accordingly, the present invention is not limited to the described embodiments or the use of the particular elements, dimensions, materials or configurations included herein. Other modifications and variations of the present invention which do not depart from the spirit and scope of the appended claims are also covered.
[Brief description of the drawings]
[0037]
FIG. 1 is a schematic diagram of a prototype scanning system that can be used with the present invention.
2 is a simulated noisy image of 256 gray shades of the kind that can be taken by the scanning system of FIG. 1;
FIG. 3 shows the number of detected features (N (t)) obtained for the noisy image of FIG. 2 according to the method of the invention versus the detection level threshold (t) (left scale) and the average feature size (S (t)) A graph showing a detection level threshold (t) (right scale).
FIG. 4 is a binary image obtained by performing threshold processing on the image including noise in FIG. 2 at a threshold level of 35;
5 is a binary image obtained by performing threshold processing on the image including noise in FIG. 2 at a threshold level of 50. FIG.
FIG. 6 is a binary image obtained by performing threshold processing on the image including noise in FIG. 2 at a threshold level of 75;
7 is a binary image obtained by performing threshold processing on the image including noise in FIG. 2 at a threshold level 140. FIG. 4 shows the product of the thresholding method according to the invention.
8 is a binary image obtained by performing threshold processing on the image including noise in FIG. 2 at a threshold level 205. FIG.
9 is a binary image obtained by performing threshold processing on the image including noise in FIG. 2 at a threshold level 225. FIG.
Claims (96)
a)画像を取得するステップと、
b)前記画像のテストセグメントを選択するステップと、
c)複数の閾値(t)のそれぞれにおいて前記画像の前記テストセグメントに現れる特徴の平均特徴サイズ(S)を決定し、平均特徴サイズデータ(S(t))を生成するステップと、
d)ステップc)で収集された平均特徴サイズデータの部分集合を選択するステップと、
e)平均特徴サイズデータの前記部分集合の関数として最適閾値(to)を決定するステップと、からなる方法。A method for determining the optimum threshold value (t o) for the image,
a) obtaining an image;
b) selecting a test segment of the image;
c) determining an average feature size (S) of features appearing in the test segment of the image at each of the plurality of thresholds (t) and generating average feature size data (S (t));
d) selecting a subset of the average feature size data collected in step c);
e) determining an optimal threshold (t o ) as a function of said subset of average feature size data.
f)複数の閾値(t)のそれぞれにおいて前記画像の前記テストセグメントに現れる特徴の数(N)を計数して、計数データ(N(t))を生成するステップと、
g)前記計数データ(N(t))の関数として平均特徴サイズデータ(S(t))の部分集合を選択するステップと、を含む、請求項1に記載の方法。further,
f) counting the number (N) of features appearing in the test segment of the image at each of the plurality of thresholds (t) to generate count data (N (t));
g) selecting a subset of average feature size data (S (t)) as a function of said count data (N (t)).
f)複数の閾値(t)のそれぞれにおいて前記画像の前記テストセグメントに現れる特徴の数(N)を計数して、計数データ(N(t))を生成するステップと、
h)前記計数データ(N(t))の関数としてカットオフ閾値(tc)を決定するステップと、
i)カットオフ閾値(tc)の関数として平均特徴サイズデータ(S(t))の部分集合を選択するステップと、を含む、請求項1に記載の方法。further,
f) counting the number (N) of features appearing in the test segment of the image at each of the plurality of thresholds (t) to generate count data (N (t));
h) determining a cut-off threshold (t c ) as a function of said count data (N (t));
i) selecting a subset of the average feature size data (S (t)) as a function of the cut-off threshold (t c ).
j)前記最適閾値(to)を用いた前記画像の閾値処理によって二値画像を取得するステップを含む、請求項1に記載の方法を含む画像の閾値処理方法。further,
by thresholding of the image using j) the optimum threshold (t o) comprises obtaining a binary image, the threshold processing method of an image including the method of claim 1.
j)前記最適閾値(to)を用いた前記画像の閾値処理によって二値画像を取得するステップを含む、請求項7に記載の方法を含む画像の閾値処理方法。further,
8. An image thresholding method comprising the method of claim 7, comprising: j) obtaining a binary image by thresholding the image using the optimal threshold (t o ).
j)前記最適閾値(to)を用いた前記画像の閾値処理によって二値画像を取得するステップを含む、請求項9に記載の方法を含む画像の閾値処理方法。further,
10. An image thresholding method comprising the method of claim 9, comprising: j) obtaining a binary image by thresholding the image using the optimal threshold (t o ).
j)前記最適閾値(to)を用いた前記画像の閾値処理によって二値画像を取得するステップを含む、請求項13に記載の方法を含む画像の閾値処理方法。further,
14. An image thresholding method comprising the method of claim 13, comprising: j) obtaining a binary image by thresholding the image using the optimal threshold (t o ).
j)前記最適閾値(to)を用いた前記画像の閾値処理によって二値画像を取得するステップを含む、請求項17に記載の方法を含む画像の閾値処理方法。further,
18. An image thresholding method comprising the method of claim 17, comprising: j) obtaining a binary image by thresholding the image using the optimal threshold (t o ).
j)前記最適閾値(to)を用いた前記画像の閾値処理によって二値画像を取得するステップを含む、請求項21に記載の方法を含む画像の閾値処理方法。further,
22. An image thresholding method comprising the method of claim 21, comprising: j) obtaining a binary image by thresholding the image using the optimal threshold (t o ).
j)前記最適閾値(to)を用いた前記画像の閾値処理によって二値画像を取得するステップを含む、請求項25に記載の方法を含む画像の閾値処理方法。further,
26. An image thresholding method comprising the method of claim 25, comprising: j) obtaining a binary image by thresholding the image using the optimal threshold (t o ).
i)ディジタル化画像を提供するための画像素子と、
ii)データ記憶装置と、
iii)前記画像素子からディジタル化画像を受信し、前記データ記憶装置に書込みしたり前記データ記憶装置から読出したりすることができる中央処理装置と、
を具備し、前記中央処理装置が、
a)画像を取得し、
b)前記画像のテストセグメントを選択し、
c)複数の閾値(t)のそれぞれにおいて前記画像の前記テストセグメントに現れる特徴の平均特徴サイズ(S)を決定して、平均特徴サイズデータ(S(t))を生成し、
d)ステップc)で収集された平均特徴サイズデータの部分集合を選択し、
e)平均特徴サイズデータの前記部分集合の関数として最適閾値(to)を決定するようにプログラムされている、システム。A system for determining the optimum threshold value (t o) for the image,
i) an image element for providing a digitized image;
ii) a data storage device;
iii) a central processing unit capable of receiving a digitized image from the image element and writing to and reading from the data storage device;
Wherein the central processing unit comprises:
a) obtaining an image,
b) selecting a test segment of the image;
c) determining an average feature size (S) of features appearing in the test segment of the image at each of the plurality of thresholds (t) to generate average feature size data (S (t));
d) selecting a subset of the average feature size data collected in step c),
e) it is programmed to determine an optimum threshold value (t o) as a function of the subset of the average feature size data, system.
f)複数の閾値(t)のそれぞれにおいて前記画像の前記テストセグメントに現れる特徴の数(N)を計数して、計数データ(N(t))を生成し、
g)前記計数データ(N(t))の関数として平均特徴サイズデータ(S(t))の部分集合を選択するようにプログラムされている、請求項33に記載のシステム。The central processing unit further includes:
f) counting the number of features (N) appearing in the test segment of the image at each of the plurality of thresholds (t) to generate count data (N (t));
34. The system of claim 33, wherein g) is programmed to select a subset of the average feature size data (S (t)) as a function of the count data (N (t)).
f)複数の閾値(t)のそれぞれにおいて前記画像の前記テストセグメントに現れる特徴の数(N)を計数して、計数データ(N(t))を生成し、
h)前記計数データ(N(t))の関数としてカットオフ閾値(tc)を決定し、
i)カットオフ閾値(tc)の関数として平均特徴サイズデータ(S(t))の部分集合を選択するようにプログラムされている、請求項33に記載のシステム。The central processing unit further includes:
f) counting the number of features (N) appearing in the test segment of the image at each of the plurality of thresholds (t) to generate count data (N (t));
h) determining a cut-off threshold (t c ) as a function of the count data (N (t));
i) is programmed to select a subset of the (average feature size data as a function of t c) (S (t) cutoff threshold), system of claim 33.
j)前記最適閾値(to)を用いた前記画像の閾値処理によって二値画像を取得するようにさらにプログラムされる、請求項33に記載の方法を含む画像の閾値処理システム。The central processing unit,
j) is further programmed to obtain a binary image by thresholding of the image using the optimal threshold (t o), threshold processing system of an image including the method of claim 33.
j)前記最適閾値(to)を用いた前記画像の閾値処理によって二値画像を取得するようにプログラムされる、請求項39に記載の方法を含む画像の閾値処理システム。The central processing unit further includes:
40. An image thresholding system comprising the method of claim 39, wherein the system is programmed to obtain a binary image by j) thresholding the image using the optimal threshold (t o ).
j)前記最適閾値(to)を用いた前記画像の閾値処理によって二値画像を取得するようにプログラムされる、請求項41に記載の方法を含む画像の閾値処理システム。The central processing unit further includes:
j) is programmed to obtain a binary image by thresholding of the image using the optimal threshold (t o), threshold processing system of an image including the method of claim 41.
j)前記最適閾値(to)を用いた前記画像の閾値処理によって二値画像を取得するようにプログラムされる、請求項45に記載の方法を含む画像の閾値処理システム。The central processing unit further includes:
j) is programmed to obtain a binary image by thresholding of the image using the optimal threshold (t o), threshold processing system of an image including the method of claim 45.
j)前記最適閾値(to)を用いた前記画像の閾値処理によって二値画像を取得するようにプログラムされる、請求項49に記載の方法を含む画像の閾値処理システム。The central processing unit further includes:
50. An image thresholding system comprising the method of claim 49, wherein the image thresholding system is programmed to obtain a binary image by j) thresholding the image using the optimal threshold (t o ).
j)前記最適閾値(to)を用いた前記画像の閾値処理によって二値画像を取得するようにプログラムされる、請求項53に記載の方法を含む画像の閾値処理システム。The central processing unit further includes:
54. An image thresholding system comprising the method of claim 53, wherein the image thresholding system is programmed to obtain a binary image by thresholding the image using the optimal threshold (t o ).
j)前記最適閾値(to)を用いた前記画像の閾値処理によって二値画像を取得するようにプログラムされる、請求項57に記載の方法を含む画像の閾値処理システム。The central processing unit further includes:
58) An image thresholding system comprising the method of claim 57, wherein the system is programmed to obtain a binary image by thresholding the image using the optimal threshold (t o ).
a)画像を取得するステップと、
b)前記画像のテストセグメントを選択するステップと、
c)複数の閾値(t)のそれぞれにおいて前記画像の前記テストセグメントに現れる特徴の平均特徴サイズ(S)を決定し、平均特徴サイズデータ(S(t))を生成するステップと、
d)ステップc)で収集された平均特徴サイズデータの部分集合を選択するステップと、
e)平均特徴サイズデータの前記部分集合の関数として最適閾値(to)を決定するステップと、を含む、データ記憶媒体。A data storage medium having recorded thereon software for causing a computer to execute a method of determining an optimum threshold value (t o ) for an image by introducing the software into the computer and executing the software.
a) obtaining an image;
b) selecting a test segment of the image;
c) determining an average feature size (S) of features appearing in the test segment of the image at each of the plurality of thresholds (t) and generating average feature size data (S (t));
d) selecting a subset of the average feature size data collected in step c);
e) and determining the optimum threshold value (t o) as a function of the subset of the average feature size data, the data storage medium.
f)複数の閾値(t)のそれぞれにおいて前記画像の前記テストセグメントに現れる特徴の数(N)を計数して、計数データ(N(t))を生成するステップと、
g)前記計数データ(N(t))の関数として平均特徴サイズデータ(S(t))の部分集合を選択するステップを含む、請求項65に記載のデータ記憶媒体。The method further comprises:
f) counting the number (N) of features appearing in the test segment of the image at each of the plurality of thresholds (t) to generate count data (N (t));
66. The data storage medium of claim 65, comprising the step of: g) selecting a subset of average feature size data (S (t)) as a function of said count data (N (t)).
f)複数の閾値(t)のそれぞれにおいて前記画像の前記テストセグメントに現れる特徴の数(N)を計数して、計数データ(N(t))を生成するステップと、
h)前記計数データ(N(t))の関数としてカットオフ閾値(tc)を決定するステップと、
i)カットオフ閾値(tc)の関数として平均特徴サイズデータ(S(t))の部分集合を選択するステップと、を含む、請求項65に記載のデータ記憶媒体。The method further comprises:
f) counting the number (N) of features appearing in the test segment of the image at each of the plurality of thresholds (t) to generate count data (N (t));
h) determining a cut-off threshold (t c ) as a function of the count data (N (t));
i) Cutoff comprising the steps of selecting a subset of the thresholds (average feature size data as a function of t c) (S (t) ), a data storage medium of claim 65.
j)前記最適閾値(to)を用いた前記画像の閾値処理によって二値画像を取得するステップをさらに含む、請求項65に記載のデータ記憶媒体。The method comprises:
The data storage medium of claim 65, further comprising: j) obtaining a binary image by thresholding the image using the optimal threshold (t o ).
j)前記最適閾値(to)を用いた前記画像の閾値処理によって二値画像を取得するステップをさらに含む、請求項71に記載のデータ記憶媒体。The method comprises:
j) the optimum threshold (t o) by threshold processing of the image using the further comprises the step of obtaining a binary image, data storage medium of claim 71.
j)前記最適閾値(to)を用いた前記画像の閾値処理によって二値画像を取得するステップをさらに含む、請求項73に記載のデータ記憶媒体。The method comprises:
74. The data storage medium of claim 73, further comprising: j) obtaining a binary image by thresholding the image using the optimal threshold (t o ).
j)前記最適閾値(to)を用いた前記画像の閾値処理によって二値画像を取得するステップをさらに含む、請求項77に記載のデータ記憶媒体。The method comprises:
j) the optimum threshold (t o) further comprises the step of obtaining a binary image by thresholding of the image using the data storage medium of claim 77.
j)前記最適閾値(to)を用いた前記画像の閾値処理によって二値画像を取得するステップをさらに含む、請求項81に記載のデータ記憶媒体。The method comprises:
j) the optimum threshold (t o) by threshold processing of the image using the further comprises the step of obtaining a binary image, data storage medium of claim 81.
j)前記最適閾値(to)を用いた前記画像の閾値処理によって二値画像を取得するステップをさらに含む、請求項85に記載のデータ記憶媒体。The method comprises:
j) the optimum threshold (t o) further comprises the step of obtaining a binary image by thresholding of the image using the data storage medium of claim 85.
j)前記最適閾値(to)を用いた前記画像の閾値処理によって二値画像を取得するステップをさらに含む、請求項89に記載のデータ記憶媒体。The method comprises:
90. The data storage medium of claim 89, further comprising: j) obtaining a binary image by thresholding the image using the optimal threshold (t o ).
Applications Claiming Priority (2)
| Application Number | Priority Date | Filing Date | Title |
|---|---|---|---|
| US09/917,545 US6961476B2 (en) | 2001-07-27 | 2001-07-27 | Autothresholding of noisy images |
| PCT/US2002/019689 WO2003012742A2 (en) | 2001-07-27 | 2002-06-21 | tUTOTHRESHOLDING OF NOISY IMAGES |
Publications (2)
| Publication Number | Publication Date |
|---|---|
| JP2004537902A true JP2004537902A (en) | 2004-12-16 |
| JP2004537902A5 JP2004537902A5 (en) | 2006-01-05 |
Family
ID=25438940
Family Applications (1)
| Application Number | Title | Priority Date | Filing Date |
|---|---|---|---|
| JP2003517840A Withdrawn JP2004537902A (en) | 2001-07-27 | 2002-06-21 | Automatic thresholding of noisy images |
Country Status (6)
| Country | Link |
|---|---|
| US (1) | US6961476B2 (en) |
| EP (1) | EP1415278A2 (en) |
| JP (1) | JP2004537902A (en) |
| KR (1) | KR20040017838A (en) |
| AU (1) | AU2002316323A1 (en) |
| WO (1) | WO2003012742A2 (en) |
Families Citing this family (9)
| Publication number | Priority date | Publication date | Assignee | Title |
|---|---|---|---|---|
| US7057806B2 (en) * | 2003-05-09 | 2006-06-06 | 3M Innovative Properties Company | Scanning laser microscope with wavefront sensor |
| EP1729523B1 (en) * | 2004-02-19 | 2014-04-09 | Mitsubishi Denki Kabushiki Kaisha | Image processing method |
| US20050276512A1 (en) * | 2004-06-01 | 2005-12-15 | 3M Innovative Properties Company | Selective deconvolution of an image |
| KR100765749B1 (en) * | 2005-04-26 | 2007-10-15 | 삼성전자주식회사 | Apparatus and method for binary image compression |
| US8648287B1 (en) | 2005-05-27 | 2014-02-11 | Rambus Inc. | Image sensor using single photon jots and processor to create pixels |
| JP4473335B1 (en) * | 2009-03-27 | 2010-06-02 | 株式会社オプトエレクトロニクス | Optical information reading apparatus and optical information reading method |
| CN101782966B (en) * | 2010-02-11 | 2012-07-04 | 上海点佰趣信息科技有限公司 | Method for binaryzation of fingerprint image |
| US10563164B1 (en) | 2015-10-08 | 2020-02-18 | Charm Sciences, Inc. | Plate reader |
| US10495563B1 (en) | 2016-04-28 | 2019-12-03 | Charm Sciences, Inc. | Plate reader observation methods and operation |
Family Cites Families (13)
| Publication number | Priority date | Publication date | Assignee | Title |
|---|---|---|---|---|
| US4723297A (en) | 1984-09-27 | 1988-02-02 | Siemens Aktiengesellschaft | Method for automatic correction of character skew in the acquisition of a text original in the form of digital scan results |
| US5048096A (en) * | 1989-12-01 | 1991-09-10 | Eastman Kodak Company | Bi-tonal image non-text matter removal with run length and connected component analysis |
| US5506917A (en) * | 1990-07-13 | 1996-04-09 | Nippon Telegraph And Telephone Corporation | Thresholding method for segmenting gray scale image, method for determining background concentration distribution, and image displacement detection method |
| FR2670979A1 (en) | 1990-12-21 | 1992-06-26 | Philips Electronique Lab | LOCAL BINARY SEGMENTATION METHOD OF DIGITIZED IMAGES, BY HISTOGRAMS MISCELLANEOUS. |
| JP3413236B2 (en) | 1993-03-26 | 2003-06-03 | コニカ株式会社 | Character recognition method |
| WO1996012942A1 (en) | 1994-10-20 | 1996-05-02 | Cambridge Imaging Limited | Improved imaging method and apparatus |
| JPH08235355A (en) * | 1995-02-28 | 1996-09-13 | Minolta Co Ltd | Picture processor |
| JP3803411B2 (en) | 1995-12-25 | 2006-08-02 | オリンパス株式会社 | Information reproducing system and information recording medium |
| US5900949A (en) | 1996-05-23 | 1999-05-04 | Hewlett-Packard Company | CCD imager for confocal scanning microscopy |
| US6075574A (en) * | 1998-05-22 | 2000-06-13 | Ati Technologies, Inc | Method and apparatus for controlling contrast of images |
| WO2000004497A1 (en) | 1998-07-14 | 2000-01-27 | The Perkin-Elmer Corporation Pe Biosystems Division | Automatic masking of objects in images |
| WO2000011608A1 (en) * | 1998-08-18 | 2000-03-02 | Koninklijke Philips Electronics N.V. | Apparatus and method for providing an optimum brightness control signal for lung tissue x-ray images |
| US6199986B1 (en) | 1999-10-21 | 2001-03-13 | University Of Rochester | Rapid, automatic measurement of the eye's wave aberration |
-
2001
- 2001-07-27 US US09/917,545 patent/US6961476B2/en not_active Expired - Fee Related
-
2002
- 2002-06-21 KR KR10-2004-7001200A patent/KR20040017838A/en not_active Application Discontinuation
- 2002-06-21 EP EP02746616A patent/EP1415278A2/en not_active Withdrawn
- 2002-06-21 AU AU2002316323A patent/AU2002316323A1/en not_active Abandoned
- 2002-06-21 WO PCT/US2002/019689 patent/WO2003012742A2/en not_active Application Discontinuation
- 2002-06-21 JP JP2003517840A patent/JP2004537902A/en not_active Withdrawn
Also Published As
| Publication number | Publication date |
|---|---|
| EP1415278A2 (en) | 2004-05-06 |
| US20030025942A1 (en) | 2003-02-06 |
| AU2002316323A1 (en) | 2003-02-17 |
| KR20040017838A (en) | 2004-02-27 |
| WO2003012742A3 (en) | 2004-02-19 |
| US6961476B2 (en) | 2005-11-01 |
| WO2003012742A2 (en) | 2003-02-13 |
Similar Documents
| Publication | Publication Date | Title |
|---|---|---|
| US8594396B2 (en) | Image processing apparatus, image processing method, and computer program product | |
| JP3137561B2 (en) | Method and apparatus for determining image quality, method and apparatus for monitoring performance of an image capture device | |
| CN101771823B (en) | Image processing apparatus, image capture apparatus, image output apparatus, and method for these apparatus | |
| JP2016130869A (en) | Method of generating focus signal | |
| JP2005502369A5 (en) | ||
| US7333656B2 (en) | Image processing method and image processing apparatus | |
| JP5229328B2 (en) | Character area extraction device, imaging device having character area extraction function, and character area extraction program | |
| JP2004537902A (en) | Automatic thresholding of noisy images | |
| US9076225B2 (en) | Image processing device, an image processing method and a program to be used to implement the image processing | |
| JP4743773B2 (en) | Edge detection method, apparatus, and program | |
| JP3906221B2 (en) | Image processing method and image processing apparatus | |
| CN113228099A (en) | Method and system for computing point spread function of digital image detector system based on quantum noise measurement of MTF modulation | |
| JPWO2013179329A1 (en) | Optical recording medium and optical information reproducing method | |
| MacLeod | Digital images and automated image analysis systems | |
| JP2009053116A (en) | Image processor and image processing program | |
| US7193196B2 (en) | Methods and systems for evaluating optical systems | |
| JP2021157735A (en) | Image identification system, image identification device, program, and trained model | |
| US11238566B2 (en) | Image processing device, system, and method for improving signal-to-noise of microscopy images | |
| US20220414827A1 (en) | Training apparatus, training method, and medium | |
| JPS62104264A (en) | Method for recognizing irradiation field | |
| JPH09304286A (en) | Apparatus and method for detection-processing of flaw | |
| JP2008501187A (en) | Selective deconvolution of images | |
| CN116709020A (en) | Focusing method and device based on Sobel operator | |
| Bradley et al. | Image Processing | |
| JP2009075924A (en) | Image processor and program |
Legal Events
| Date | Code | Title | Description |
|---|---|---|---|
| A521 | Request for written amendment filed |
Free format text: JAPANESE INTERMEDIATE CODE: A523 Effective date: 20050526 |
|
| A621 | Written request for application examination |
Free format text: JAPANESE INTERMEDIATE CODE: A621 Effective date: 20050526 |
|
| A761 | Written withdrawal of application |
Free format text: JAPANESE INTERMEDIATE CODE: A761 Effective date: 20071206 |
|
| RD03 | Notification of appointment of power of attorney |
Free format text: JAPANESE INTERMEDIATE CODE: A7423 Effective date: 20071206 |