JP2004239901A - Earthquake predicting method, earthquake prediction system, earthquake prediction program and recording medium - Google Patents
Earthquake predicting method, earthquake prediction system, earthquake prediction program and recording medium Download PDFInfo
- Publication number
- JP2004239901A JP2004239901A JP2004009928A JP2004009928A JP2004239901A JP 2004239901 A JP2004239901 A JP 2004239901A JP 2004009928 A JP2004009928 A JP 2004009928A JP 2004009928 A JP2004009928 A JP 2004009928A JP 2004239901 A JP2004239901 A JP 2004239901A
- Authority
- JP
- Japan
- Prior art keywords
- earthquake
- time series
- seismic
- arbitrary
- occurrence
- Prior art date
- Legal status (The legal status is an assumption and is not a legal conclusion. Google has not performed a legal analysis and makes no representation as to the accuracy of the status listed.)
- Granted
Links
- 238000000034 method Methods 0.000 title claims description 41
- 238000001514 detection method Methods 0.000 claims abstract description 52
- 230000007246 mechanism Effects 0.000 claims abstract description 20
- 238000009825 accumulation Methods 0.000 claims description 17
- 230000001186 cumulative effect Effects 0.000 claims description 10
- 230000008569 process Effects 0.000 claims description 9
- 238000009499 grossing Methods 0.000 claims description 8
- 238000012545 processing Methods 0.000 claims description 5
- 230000007274 generation of a signal involved in cell-cell signaling Effects 0.000 claims description 4
- 230000000737 periodic effect Effects 0.000 description 26
- 230000008859 change Effects 0.000 description 23
- 230000000694 effects Effects 0.000 description 17
- 230000033001 locomotion Effects 0.000 description 12
- 230000010355 oscillation Effects 0.000 description 12
- 238000001228 spectrum Methods 0.000 description 10
- 239000000284 extract Substances 0.000 description 8
- 230000002159 abnormal effect Effects 0.000 description 7
- 230000007704 transition Effects 0.000 description 7
- 238000010586 diagram Methods 0.000 description 6
- VEXZGXHMUGYJMC-UHFFFAOYSA-M Chloride anion Chemical compound [Cl-] VEXZGXHMUGYJMC-UHFFFAOYSA-M 0.000 description 5
- 238000012935 Averaging Methods 0.000 description 4
- 230000011664 signaling Effects 0.000 description 4
- 230000001133 acceleration Effects 0.000 description 3
- 230000002354 daily effect Effects 0.000 description 3
- 230000004069 differentiation Effects 0.000 description 3
- 239000003673 groundwater Substances 0.000 description 3
- 238000004062 sedimentation Methods 0.000 description 3
- 239000000126 substance Substances 0.000 description 3
- 230000005856 abnormality Effects 0.000 description 2
- 238000006243 chemical reaction Methods 0.000 description 2
- 238000006073 displacement reaction Methods 0.000 description 2
- 230000003203 everyday effect Effects 0.000 description 2
- 239000010438 granite Substances 0.000 description 2
- 238000012163 sequencing technique Methods 0.000 description 2
- 230000003595 spectral effect Effects 0.000 description 2
- 238000012360 testing method Methods 0.000 description 2
- 238000012795 verification Methods 0.000 description 2
- XLYOFNOQVPJJNP-UHFFFAOYSA-N water Substances O XLYOFNOQVPJJNP-UHFFFAOYSA-N 0.000 description 2
- 230000009471 action Effects 0.000 description 1
- 238000013459 approach Methods 0.000 description 1
- 238000004364 calculation method Methods 0.000 description 1
- 230000003247 decreasing effect Effects 0.000 description 1
- 238000005516 engineering process Methods 0.000 description 1
- 238000000605 extraction Methods 0.000 description 1
- 238000001914 filtration Methods 0.000 description 1
- 229910052500 inorganic mineral Inorganic materials 0.000 description 1
- 230000004807 localization Effects 0.000 description 1
- 238000004519 manufacturing process Methods 0.000 description 1
- 238000005259 measurement Methods 0.000 description 1
- 239000011707 mineral Substances 0.000 description 1
- 239000000203 mixture Substances 0.000 description 1
- 238000012544 monitoring process Methods 0.000 description 1
- 238000005293 physical law Methods 0.000 description 1
- 230000002265 prevention Effects 0.000 description 1
- 238000011160 research Methods 0.000 description 1
- 230000000630 rising effect Effects 0.000 description 1
- 230000035939 shock Effects 0.000 description 1
- 238000012731 temporal analysis Methods 0.000 description 1
- 230000002123 temporal effect Effects 0.000 description 1
- 238000000700 time series analysis Methods 0.000 description 1
- 230000001960 triggered effect Effects 0.000 description 1
Images


Abstract
Description
本発明は地震の予知方法、地震の予知システム及び地震の予知プログラムに係り、特に対象とする領域に発生した地震から所定の地震を抽出し、それら地震の震源情報と発震機構解の情報とから、将来の地震の発生時刻と震源と地震のマグニチュードを予知する地震の予知方法、地震の予知システム、地震の予知プログラム及び記録媒体に関する。 The present invention relates to a method for predicting an earthquake, a system for predicting an earthquake, and a program for predicting an earthquake, and in particular, extracts a predetermined earthquake from an earthquake that has occurred in a target area, and uses the information on the source of the earthquake and the information on the focal mechanism solution. The present invention relates to an earthquake prediction method, an earthquake prediction system, an earthquake prediction program, and a recording medium for predicting a future earthquake occurrence time, an epicenter, and an earthquake magnitude.
大陸プレートの境界付近の地殻や断層に長期間、蓄積されたストレスの開放が、大地震となると考えられていて、ストレスの蓄積とその開放の繰り返し時間は100年余りからなる周期もあるが、そのような長い周期には変動が伴い、その変動は少なくても、20‐30年にもなる。従って、地震活動地域における日々の生活に必要不可欠な数年から数ヶ月の大地震発生の震源と発生時刻とマグニチュードの大きさの短期予知は、次の理由によって、現在の科学技術水準では不可能であり、信頼できる地震予知の方法や装置などは存在しないとされている。 It is considered that the release of stress accumulated in the crust and faults near the boundary of the continental plate for a long time is a large earthquake, and there is a cycle where the accumulation of stress and the repetition time of the release are over 100 years, Such long periods are accompanied by fluctuations, which can be as little as 20-30 years. Therefore, short-term prediction of the source, time, and magnitude of a major earthquake of several years to several months, which is indispensable for daily life in a seismically active area, is impossible at the current technological level for the following reasons. It is said that there is no reliable earthquake prediction method or device.
前記短期地震予知が不可能とされる理由は以下の通りである。すなわち、余震や群発地震等を除く地震発生において、その発生場所、発生時刻、及びマグニチュードはランダムに変化し、その統計的な性質がポアソン過程に従うと広く知られているからである。このため、地震が発生する時刻を、確率的な予知を超えて予知することは、不可能だとされている。 The reason why the short-term earthquake prediction is impossible is as follows. That is, in an earthquake occurrence other than aftershocks and swarm earthquakes, the occurrence location, occurrence time, and magnitude change randomly, and it is widely known that the statistical properties follow the Poisson process. For this reason, it is said that it is impossible to predict the time when an earthquake occurs beyond stochastic prediction.
また、そのランダムな性質が示す普遍法則には、発生した地震のマグニチュードがある大きさ以上を持つ地震の累積発生件数と、マグニチュードとの関係式において、片対数で線形関係を示すグーテン・ベルグの普遍統計法則がある。この普遍法則によると、マグニチュードが、発生した地震のエネルギー、モーメント、更に破壊面積の指数関数で表される事実から、マグニチュードの値がM以上で起きる地震の累積頻度数は、それらパラメータのべき乗でも表示されることになる。このようなべき乗で表される変動現象の統計的な性質は、固有な尺度(例えば、地震のエネルギーが特別な大きさを取るような事を測る尺度)が存在しない事を、理論的に保証しているので、地震予知そのものが、科学的に不可能であると断定する。 In addition, the universal law indicated by the random nature includes Gutenberg's linear relationship in semi-logarithmic relation in the relational expression between the cumulative number of earthquakes with magnitude greater than a certain magnitude and the magnitude. There is a universal statistical law. According to this universal law, the fact that magnitude is represented by the exponential function of the energy, moment, and rupture area of the generated earthquake indicates that the cumulative frequency of earthquakes with a magnitude value of M or more is a power of those parameters. Will be displayed. The statistical nature of such power variability phenomena is a theoretical guarantee that there is no inherent measure (for example, a measure that measures the magnitude of seismic energy to take a particular magnitude). He concludes that earthquake prediction itself is scientifically impossible.
しかし、このような一見ランダムに見受けられる地震現象にも、次の2つの予知方法が提案されている。 However, the following two prediction methods have been proposed for such seemingly random earthquake phenomena.
第1番の予知法は最近の試みである。これはランダムな現象が先の統計法則のべき乗に従う現象の中には統計物理法則から導かれる臨界現象があるので、その臨界現象を地震現象に適用するものである。つまり、臨界現象において物質の相が変化する時点を大地震が発生する時点と仮定して、大地震を予知する方法である。この方法は、統計物理学分野の理論解の一つとして知られている時間的に変化する臨界現象において出現する臨界に達する時刻と、現時刻の時間間隔の対数に比例する周期振動を地震予知に利用しようとするものである。 The first method of prediction is a recent attempt. This applies a critical phenomenon to a seismic phenomenon because there is a critical phenomenon derived from the statistical physics law among phenomena in which a random phenomenon follows the power of the statistical law. In other words, this method predicts a large earthquake by assuming that the time when the phase of a substance changes in the critical phenomenon is the time when a large earthquake occurs. This method predicts the time at which the critical point appears in a time-varying critical phenomenon known as one of the theoretical solutions in the field of statistical physics, and the periodic oscillation proportional to the logarithm of the time interval of the current time. It is intended to be used.
例えば、御前崎の地盤沈下の振動現象について、横軸に時間を取り、相対的な沈下量を縦軸にして表示すると、その振動現象は、先の時間間隔の対数に略比例した周期で振動しながら臨界状態に接近しつつある様にも見受けられる。従って、統計物理学分野の理論解が、御前崎の相対地盤沈下量の振動現象を記述していると仮定する。1999年になされた予知結果では、臨界状態に達する時期が、2004.7年±1.7年となり、その臨界日を東海地震の発生する時期などとする論文報告がある。しかし、そのような臨界振動現象を導く物理法則が、御前崎の地盤沈下の物理現象を記述しているとは言い難い。実際、その論文の予知結果では、2002年には、御前崎の沈降は既に停止から上昇に向かう状態にあるべきだが、2002年12月現在、いまだに沈降し続けているので、東海大地震が仮に2004.7年±1.7年に発生したとしても、予知方法は正しくないと断定せざるを得ない。 For example, if the time is plotted on the horizontal axis and the relative amount of subsidence is displayed on the vertical axis for the vibration phenomenon of subsidence in Omaezaki, the vibration phenomenon vibrates with a period that is approximately proportional to the logarithm of the previous time interval. However, it seems that it is approaching the critical state. Therefore, it is assumed that the theoretical solution in the field of statistical physics describes the oscillation phenomenon of relative land subsidence in Omaezaki. According to the predictions made in 1999, the time to reach the critical state is 2004.7 ± 1.7 years, and there are paper reports that the critical date is the time when the Tokai earthquake occurs. However, it is hard to say that the physical laws leading to such a critical vibration phenomenon describe the physical phenomena of subsidence in Omaezaki. In fact, according to the predictions in that paper, the subsidence of Omaezaki should have been in a state of rising from stoppage in 2002, but as of December 2002, it was still continuing to subside. Even if it occurs in .7 years ± 1.7 years, it must be concluded that the prediction method is incorrect.
前記予知方法に関しては、先に導かれた理論的臨界振動現象そのものが、地震の発生につながる普遍的に観測されてきた地震現象とは異なり、臨界振動現象を地震の発生現象に結びつけることは出来ないとの議論もされていて、地震の確かな予知方法とは言えない。 Regarding the prediction method, the theoretical critical vibration phenomenon itself, which was derived earlier, is different from the universally observed earthquake phenomenon that leads to the occurrence of an earthquake, and the critical vibration phenomenon cannot be linked to the earthquake occurrence phenomenon. It has been argued that there is no such thing, and it cannot be said to be a reliable prediction method for earthquakes.
2番目の予知法は15年程前の試みである。これは、比較的大きな地震の中には、地震発生の数日から、数時間前に、地震と地震との時間間隔のランダム性が崩れるような発生が観測されているので、その乱れを検出して予知に利用しようとしたものである。 The second method of prediction is about 15 years ago. This is because some relatively large earthquakes have been observed from several days to several hours before the occurrence of the earthquake, such that the randomness of the time interval between the earthquakes is lost. And tried to use it for prediction.
実施例として、防災科学技術研究所で、関東甲信越地方の過去の比較的な大きな地震を用いて、その統計的な性質がランダムから変化する時点を検出し予知に利用しようとしたものがある。しかしこの論文報告によると予知が出来なかった例もあり、広く利用されていないようである。 As an example, there is an example in which the Disaster Prevention Research Institute of Science and Technology uses a relatively large earthquake in the past in the Kanto Koshinetsu region to detect a point in time at which the statistical property changes from random and uses it for prediction. However, according to this report, there were cases where prediction was not possible, and it seems that it has not been widely used.
一方、ランダムな地震現象には、固有な尺度は存在しないとする普遍統計法則自体の解釈が疑問視されている。例えば、グーテン・ベルグの普遍法則は、あるマグニチュードM以上の地震の積算数とMの関係を与えるので、Mが持つ変動は平滑され、大部分が余震の影響を受け、本震のみ対象とする地震予知の可能性を完全に否定する統計法則を表している、とは言えないとする主張がある。例えば、本震だけをグーテン・ベルグの関係式で表すと、地震を予知する尺度の存在を示唆するマルチフラクタル性が存在するので、地震現象にはなにか固有な尺度が存在している事実あると論文報告から明らかになっている。 On the other hand, the interpretation of the Universal Statistical Law itself, which has no inherent scale for random earthquake phenomena, has been questioned. For example, Gutenberg's universal law gives the relationship between M and the total number of earthquakes of a magnitude M or more, so the fluctuations of M are smoothed, mostly affected by aftershocks, Some claim that it does not represent a statistical rule that completely denies the possibility of prediction. For example, if only the main shock is expressed by Gutenberg's relational equation, there is multifractality that suggests the existence of a scale that predicts earthquakes, so it is said that there is a fact that there is some unique scale in earthquake phenomena It is clear from the report.
この様な、固有な尺度の中には、地球の岩石圏である地殻の硬い花崗岩石層(Brittle層)と柔らかい玄武岩石層(Ductile層)の境界(D-B層)付近で、大陸のプレート運動によるストレスが玄武岩石層側から、玄武岩石層・花崗岩積層の遷移層へ伝達されると、遷移層の硬い層側の付近で3から4の固有なマグニチュードを持った地震が起きることも論文報告がなされている。また、最近プレート境界に存在するアスぺリティに関連する地震発生には固有な周期性があることも報告されている。しかし、これら尺度の地震予知への適用を、多くの科学者が模索しているが、いまだに、それら尺度を利用した予知方法を見出せていない。従って、阪神・淡路大震災(神戸南部大地震)のような地震の震源及び発生時刻の短期予知は、現在の科学技術水準では不可能とされている。
しかし、地震現象を別の観点から観測すると、短期地震予知の可能性もある。それは、広範囲の領域に起きる地震現象はランダムであるが、地震が発生しそうな場所を限定すれば、局所の地殻変動に観測される異常が大地震につながるかもしれないと仮定し、異常地殻変動がもたらす電磁現象、地殻の地下水、化学物質の変化等を地震の予兆現象とし、その局所に発生する地震を発生直前に予知しようとする短期予知の可能性である。そのような短期予知の可能性を調査した研究には、阪神・淡路大震災の震央付近の地下水に出現した塩化物の含有量の明確な予兆的変化が、地震発生後判明した今までにない科学的資料に基づいた予兆現象の検証として報告されている。従って、そのような予兆現象を利用することが提案されるが、広範囲の地震発生地域のどこかで将来発生する大地震に対し、予兆の再現性、普遍性、予兆検出方法の運用性、及び信頼性に多くの解決しなければならない困難な問題点が存在する。従って、現状では阪神・淡路大震災を直前に予知できなかったように、普遍的な短期地震予知は科学的に困難であると見なされているのである。 However, if we observe seismic phenomena from another viewpoint, there is a possibility of short-term earthquake prediction. It assumes that the seismic phenomena that occur over a wide area are random, but that if an area where an earthquake is likely to occur is limited, anomalies observed in local crustal deformation may lead to a large earthquake. It is a possibility of short-term forecasting, in which electromagnetic phenomena, groundwater in the crust, changes in chemical substances, etc. caused by earthquakes are used as predictive phenomena of earthquakes, and earthquakes occurring locally are predicted immediately before the occurrence. A study investigating the possibility of such a short-term prediction included a clear predictive change in the chloride content that appeared in groundwater near the epicenter of the Great Hanshin-Awaji Earthquake. It is reported as a verification of predictive phenomena based on statistical data. Therefore, it is proposed to use such predictive phenomena, but for large earthquakes that will occur somewhere in the wide range of earthquakes in the future, the reproducibility, universality, operability of the predictive sign detection method, and There are many difficult problems to solve for reliability. Therefore, universal short-term earthquake prediction is considered to be scientifically difficult, as it was not possible to predict the Great Hanshin-Awaji Earthquake immediately before.
現在、国土地理院により、日本中に網の目のように張り巡らされているGPSのネットワーク(GEONET)による地殻変動の観測は、各GPSサイトの日々の地殻変動変位情報を提供している。従って、将来の地震の震央付近に位置するGPSサイトに現れる異常地殻変動は、日本国特許第2787143号の運動変化検出装置を用いて検出できる。この場合、GPSサイトで観測される異常地殻変動が、その近傍で発生するかもしれない地震の予兆だと仮定できる場合は、その予兆検出が数週間前から検出できることが実証されているので、地震の短期もしくは直前予知が可能となる。しかし、異常地殻変動の検出からだけでは、地震のある程度のマグニチュード予知のみならず比較的大きな地震か大地震かの区別さえも、困難となることが多い。 At present, the Geospatial Information Authority of Japan (GEONET), a network of GPS (GEONET) networked throughout Japan, provides daily crustal displacement information for each GPS site. Therefore, abnormal crustal movements appearing at a GPS site located near the epicenter of a future earthquake can be detected using the motion change detection device of Japanese Patent No. 2787143. In this case, if it can be assumed that the abnormal crustal deformation observed at the GPS site is a sign of an earthquake that may occur in the vicinity, it has been demonstrated that the sign detection can be detected several weeks ago. Short-term or short-term prediction is possible. However, it is often difficult to predict not only a certain magnitude of an earthquake but also a distinction between a relatively large earthquake and a large earthquake only from the detection of abnormal crustal deformation.
本発明は、地震発生地帯の領域の広さにかかわらず、地震発生地帯に出現する一見ランダムに見受けられる地震現象から、尺度に依存した地震発生の現象を見つけ出し、その尺度で地震現象を観測し、短期地震予知(地震の発生時刻、震源、マグニチュードの程度の予知)の方法と装置の提供を目的とするものである。本発明は、日本国特許第2787143号の運動変化検出装置を用いた、地殻変動の異常変化検出を地震予兆の検出と見なすこともできるので、この運動変化検出装置を併用することにより、より正確な地震の短期予知装置を提供するものである。 The present invention finds a phenomenon of earthquake occurrence depending on a scale from seemingly random earthquake phenomena appearing in an earthquake occurrence zone, regardless of the size of the area of the earthquake occurrence zone, and observes the earthquake phenomenon on the scale. It is an object of the present invention to provide a method and apparatus for short-term earthquake prediction (forecasting the time of occurrence of an earthquake, the epicenter, and the magnitude of magnitude). According to the present invention, the detection of an abnormal change in crustal deformation using the motion change detecting device of Japanese Patent No. 2787143 can be regarded as the detection of an earthquake sign. The purpose of the present invention is to provide a short-term prediction device for an earthquake.
請求項1の発明は、対象とする領域に発生した地震から所定の地震を抽出し、それら地震の震源情報と発震機構解の情報とから、それら地震情報の各要素を表すパラメータをcとして、その選択領域の地震現象を、各要素cの時系列データで表して観測するために、抽出したj番目の地震の各要素cに関する地震情報をDcjとして数値化する地震要素信号化ステップと、前記地震要素信号化ステップにより抽出されたDcjを、地震の発生順序j(j=1、2、3、・・、m、・・)に基づいて、直接、もしくは、所定の選択処理または平滑化処理を施し、Dc=(Dc1、Dc2、Dc3、・・、Dcm、・・)を得る地震要素の時系列化ステップと、前記地震要素の時系列ステップで得られたDcの任意な地震発生順序mにおける任意間隔n(n=1,2,3、・・)の差、DcmとDcm−nとの差に比例する量を一次差分値ΔDcm,nとして求める一次微分出力ステップと、前記一次微分出力ステップから出力された時系列値ΔDcm,nの任意間隔k(k=1、2、・・)での差、即ちΔDcm,nとΔDcm−k,nとの差に比例する量を任意な地震発生順序mでの二次差分値Δ2Dcm,n,kとして求める二次微分出力ステップと、前記二次微分出力ステップで得られた二次差分値Δ2Dcm,n,kの振幅と位相とを異なる要素間で比較検出し、各要素間の振幅関係と位相関係と地震要素の時系列を出力する振幅位相比較検出ステップと、を備えた、地震の予知方法である。
The invention according to
請求項2の発明は、請求項1において、前記地震の各要素間の振幅位相比較検出ステップにより検出された、各要素間の振幅関係と位相関係と地震要素の時系列とから、地震の発生時刻と震源と地震のマグニチュードを予知するステップを備えてなる、地震の予知方法である。 According to a second aspect of the present invention, according to the first aspect, an earthquake is generated from the amplitude relation and the phase relation between the elements and the time series of the earthquake elements, which are detected by the amplitude phase comparison detection step between the elements of the earthquake. An earthquake prediction method comprising the steps of predicting time, epicenter, and magnitude of an earthquake.
請求項3の発明は、請求項1または請求項2において、任意な地震の発生個数をa(a=1、2、・・)とし、前記地震要素信号化ステップと時系列化ステップにより抽出した地震と地震の一つずつ離れた時間間隔を任意な地震発生順序mまで、a個累積しCIm(a)とする時間間隔累積検出ステップを備えてなる、地震の予知方法である。 According to a third aspect of the present invention, in the first or second aspect, the number of occurrences of an arbitrary earthquake is set to a (a = 1, 2,...) And extracted by the earthquake element signalizing step and the time series forming step. This is a method for predicting an earthquake, comprising a time interval accumulation detecting step of accumulating a number of time intervals apart from each other by one to an arbitrary order m of occurrence of an earthquake and setting it as CIm (a).
請求項4の発明は、請求項1ないし請求項3のいずれかにおいて、任意な地震の発生個数をa(a=1、2、・・)とし、m番目の地震とm−a番目の地震発生時刻の差をCIm(a)とする時間間隔累積検出ステップを備えてなる、地震の予知方法である。 According to a fourth aspect of the present invention, in any one of the first to third aspects, the number of occurrences of an arbitrary earthquake is a (a = 1, 2,...), And the m-th earthquake and the m-a-th earthquake This is a method for predicting an earthquake, comprising a time interval accumulation detection step of setting a difference between occurrence times to CIm (a).
請求項5の発明は、請求項1ないし請求項4のいずれかにおいて、地震要素の時系列化ステップにより得られた地震要素の時系列を地震の各要素c毎にバンドパスフィルターで濾過し任意な地震発生順序mでFcmを得て前記振幅位相比較検出ステップへ出力するフィルタ出力手段を備えてなる、地震の予知装置である。 According to a fifth aspect of the present invention, in any one of the first to fourth aspects, the time series of the seismic elements obtained in the seismic element time series-converting step is filtered by a band-pass filter for each element c of the earthquake. An earthquake prediction apparatus comprising: a filter output unit that obtains Fcm in an earthquake occurrence order m and outputs the Fcm to the amplitude-phase comparison detection step.
請求項6の発明は、対象とする領域に発生した地震から所定の地震を抽出し、それら地震の震源情報と発震機構解の情報とから、それら地震情報の各要素を表すパラメータをcとして、その選択領域の地震現象を、各要素cの時系列データで表して観測するために、抽出したj番目の地震の各要素cに関する地震情報をDcjとして数値化する地震要素信号化手段と、前記地震要素信号化手段により抽出されたDcjを、地震の発生順序j(j=1、2、3、・・、m、・・)に基づいて、直接、もしくは所定の選択化処理または平滑化処理を施し、Dc=(Dc1、Dc2、Dc3、・・、Dcm、・・)を得る地震要素の時系列化手段と、前記地震要素の時系列手段で得られたDcの任意な地震発生順序mにおける任意間隔n(n=1,2,3、・・)の差、DcmとDcm−nとの差に比例する量を一次差分値ΔDcm,nとして求める一次微分出力手段と、前記一次微分出力手段から出力された時系列値ΔDcm,nの任意間隔k(k=1、2、・・)での差、即ちΔDcm,nとΔDcm−k,nとの差に比例する量を任意な地震発生順序mでの二次差分値Δ2Dcm,n,kとして求める二次微分出力手段と、前記二次微分出力ステップで得られた二次差分値Δ2Dcm,n,kの振幅と位相とを異なる要素間で比較検出し、各要素間の振幅関係と位相関係と地震要素の時系列を出力する振幅位相比較検出手段とを備えた、地震の予知装置である。
According to the invention of
請求項7の発明は、請求項6において、前記地震の各要素間の振幅位相比較検出手段により検出された、各要素間の振幅関係と位相関係と地震要素の時系列とから、地震の発生時刻と震源と地震のマグニチュードを予知する手段を備えてなる、地震の予知装置である。 According to a seventh aspect of the present invention, according to the sixth aspect, an earthquake is generated from the amplitude relation and the phase relation between the elements and the time series of the earthquake elements detected by the amplitude and phase comparison detection means between the elements of the earthquake. An earthquake prediction device including means for predicting time, epicenter, and magnitude of an earthquake.
請求項8の発明は、請求項6または請求項7において、任意な地震の発生個数をa(a=1、2、・・)とし、前記地震要素信号化手段と時系列化手段により抽出した地震と地震の一つずつ離れた時間間隔を任意な地震発生順序mまで、a個累積しCIm(a)とする、地震の予知装置である。
According to the invention of
請求項9の発明は、請求項6ないし請求項8のいずれかにおいて任意な地震の発生個数をa(a=1、2、・・)とし、m番目の地震とm−a番目の地震発生時刻の差をCIm(a)とする時間間隔累積検出手段を備えてなる、地震の予知装置である。 According to a ninth aspect of the present invention, in any one of the sixth to eighth aspects, the arbitrary number of earthquakes is a (a = 1, 2,...), And the m-th and m-a-th earthquakes are generated. This is an earthquake prediction device including time interval accumulation detection means for setting a time difference to CIm (a).
請求項10の発明は、請求項6ないし請求項9のいずれかにおいて、前記地震要素の時系列化手段により得られた地震要素の時系列を地震の各要素c毎にバンドパスフィルターで濾過し任意な地震発生順序mでFcmを得て前記振幅位相比較検出手段へ出力するフィルタ出力手段を備えてなる、地震の予知装置である。 According to a tenth aspect of the present invention, in any one of the sixth to ninth aspects, the time series of the seismic elements obtained by the seismic element time-series means is filtered by a band-pass filter for each element c of the earthquake. An earthquake prediction device comprising: a filter output unit that obtains Fcm in an arbitrary earthquake occurrence order m and outputs the Fcm to the amplitude / phase comparison detection unit.
請求項11の発明は、対象とする領域に発生した地震から所定の地震を抽出し、それら地震の震源情報と発震機構解の情報とから、それら地震情報の各要素を表すパラメータをcとして、その選択領域の地震現象を、各要素cの時系列データで表して観測するために、抽出したj番目の地震の各要素cに関する地震情報をDcjとして数値化する地震要素信号化ステップと、前記地震要素信号化ステップにより抽出されたDcjを、地震の発生順序j(j=1、2、3、・・、m、・・)に基づいて、直接、もしくは所定の選択処理または平滑処理を施し、Dc=(Dc1、Dc2、Dc3、・・、Dcm、・・)を得る地震要素の時系列化ステップと、前記地震要素の時系列ステップで得られたDcの任意な地震発生順序mにおける任意間隔n(n=1,2,3、・・)の差、DcmとDcm−nとの差に比例する量を一次差分値ΔDcm,nとして求める一次微分出力ステップと、前記一次微分出力ステップから出力された時系列値ΔDcm,nの任意間隔k(k=1、2、・・)での差、即ちΔDcm,nとΔDcm−k,nとの差に比例する量を任意な地震発生順序mでの二次差分値Δ2Dcm,n,kとして求める二次微分出力ステップと、前記二次微分出力ステップで得られた二次差分値Δ2Dcm,n,kの振幅と位相とを異なる要素間で比較検出し、各要素間の振幅関係と位相関係と地震要素の時系列を出力する振幅位相比較検出ステップとを備えた、地震の予知プログラムである。 The invention according to claim 11 extracts a predetermined earthquake from an earthquake that occurred in a target area, and, based on source information of the earthquake and information on a focal mechanism solution, sets a parameter representing each element of the earthquake information as c, A seismic element signaling step of quantifying the seismic information regarding each element c of the extracted j-th earthquake as Dcj in order to observe the seismic phenomenon of the selected area in the form of time-series data of each element c; The Dcj extracted in the seismic element signalizing step is subjected to direct or predetermined selection processing or smoothing processing based on the earthquake occurrence order j (j = 1, 2, 3,..., M,...). , Dc = (Dc1, Dc2, Dc3,..., Dcm,...), And an arbitrary seismic sequence m of Dc obtained in the seismic element time series step. Interval n (n = 1, , 3,...) And a difference proportional to the difference between Dcm and Dcm-n as a first-order differential value ΔDcm, n, and a time-series value ΔDcm, output from the first-order differential output step. n at an arbitrary interval k (k = 1, 2,...), that is, an amount proportional to the difference between ΔDcm, n and ΔDcm−k, n is a secondary difference value Δ2Dcm in an arbitrary earthquake occurrence order m. , n, k, the secondary differential output step, and the secondary differential value Δ2Dcm obtained in the secondary differential output step, the amplitude and the phase of n, k are compared and detected between different elements, An earthquake prediction program including an amplitude relationship, a phase relationship, and an amplitude phase comparison detection step of outputting a time series of earthquake elements.
請求項12の発明は、請求項11において、前記地震の各要素間の振幅位相比較検出ステップにより検出された、各要素間の振幅関係と位相関係と地震要素の時系列とから、地震の発生時刻と震源と地震のマグニチュードを予知するステップを備えてなる、地震の予知プログラムである。 According to a twelfth aspect of the present invention, in accordance with the eleventh aspect, an earthquake is generated from the amplitude relation and the phase relation between the respective elements and the time series of the seismic elements, which are detected by the amplitude and phase comparison detection step between the respective elements of the earthquake. This is an earthquake prediction program that includes a step of predicting time, epicenter, and magnitude of an earthquake.
請求項13の発明は、請求項11または請求項12において、任意な地震の発生個数をa(a=1、2、・・)とし、前記地震要素信号化ステップと時系列化ステップにより抽出した地震と地震の一つずつ離れた時間間隔を任意な地震発生順序mまで、a個累積しCIm(a)とする時間間隔累積検出ステップとを備えてなる、地震の予知プログラムである。 According to a thirteenth aspect of the present invention, in the eleventh or twelfth aspect, the number of occurrences of an arbitrary earthquake is set to a (a = 1, 2,...) And extracted by the seismic element signalizing step and the time series forming step. This is a program for predicting an earthquake, comprising: a time interval accumulation detecting step of accumulating a number of time intervals of one earthquake and one time interval apart from each other up to an arbitrary order m of occurrence of an earthquake to obtain CIm (a).
請求項14の発明は、請求項11ないし請求項13のいずれかにおいて、任意な地震の発生個数をa(a=1、2、・・)とし、m番目の地震とm−a番目の地震発生時刻の差をCIm(a)とする時間間隔累積検出ステップとを備えてなる、地震の予知プログラムである。 According to a fourteenth aspect of the present invention, in any one of the eleventh to thirteenth aspects, the number of occurrences of an arbitrary earthquake is a (a = 1, 2,...), And the m-th and m-a-th earthquakes are set. A time interval cumulative detection step of setting a difference between occurrence times to CIm (a).
請求項15の発明は、地震要素の時系列化ステップにより得られた地震要素の時系列を地震の各要素c毎にバンドパスフィルターで濾過し任意な地震発生順序mでFcmを得て前記振幅位相比較検出ステップへ出力するフィルタ出力手段を備えてなる、地震の予知プログラムである。
The invention according to
請求項16の発明は、請求項10ないし請求項15のいずれかに記載の予知プログラムを記録した、記録媒体である。 According to a sixteenth aspect of the present invention, there is provided a recording medium storing the prediction program according to any one of the tenth to fifteenth aspects.
請求項1、請求項6及び請求項10の発明によれば、地震要素信号化ステップまたは地震要素信号化手段は、対象とする領域に発生した地震から所定の地震を抽出しそれら地震の震源情報と発震機構解情報とから、それら地震の各情報の要素を表すパラメータをcとして、その選択領域の地震現象を、各要素cの時系列データで表し、観測するために、抽出したj番目の地震の各要素cに関する地震情報をDcjとして数値化する。具体的には、発生した過去の地震の地理的空間、時間間隔、大きさの規模に関する要素を、緯度(LAT)、経度(LON)、深さ(DEP)、地震と地震の時間間隔(INT)、マグニチュード(MAG)として数値化し、更に、発震機構解の情報から得る地震の破壊メカニズムに関する要素を、節面1(N1)と節面2(N2)の走行(R)と傾斜角(DEC)、P軸(PA)とT(TA)軸の方位(DIR)と鉛直角(VER)として数値化する。 According to the first, sixth, and tenth aspects of the present invention, the seismic element signaling step or the seismic element signaling means extracts predetermined earthquakes from the earthquakes that occurred in the target area and records the source information of those earthquakes. And the focal mechanism solution information, the parameter representing each information element of the earthquake is set as c, and the seismic phenomenon in the selected area is represented by time-series data of each element c, and the extracted j-th The earthquake information relating to each element c of the earthquake is quantified as Dcj. Specifically, the elements related to the geographical space, time interval, and magnitude of past earthquakes that have occurred are described as latitude (LAT), longitude (LON), depth (DEP), and time interval between earthquakes (INT ), The magnitude (MAG) is quantified, and the elements related to the rupture mechanism of the earthquake obtained from the information on the focal mechanism solution are expressed as the travel (R) and inclination (DEC) of the nodal surface 1 (N1) and 2 (N2). ), The azimuth (DIR) and vertical angle (VER) of the P axis (PA) and T (TA) axes are digitized.
つまり、過去の地震の震源情報から、その要素cが次の5個のパラメータ、LAT、LON、DEP、INTとMAGで表される地震要素の数値データ、更に、メカニズム解から、その要素cが次の8個のN1-R、N1-DEC、N2−R2、N2−DEC、PA-DEC、PA-VER、TA-DIRとTA-VERで表される地震要素の数値データにするものである。 In other words, from the source information of the past earthquake, the element c is the following five parameters, the numerical data of the earthquake element represented by LAT, LON, DEP, INT and MAG, and from the mechanism solution, the element c is The following eight numerical data of seismic elements represented by N1-R, N1-DEC, N2-R2, N2-DEC, PA-DEC, PA-VER, TA-DIR and TA-VER .
前記時系列化ステップまたは時系列化手段は、地震要素信号化ステップまたは地震要素信号化手段によって抽出されたDcjを、地震の発生順序j(j=1、2、3、・・、m、・・)に基づいて、Dc=(Dc1、Dc2、Dc3、・・、Dcm、・・)を得る地震要素の、直接もしくは後述する所定の選択か平滑処理を施し、Dc=(Dc1、Dc2、Dc3、・・、Dcm、・・)を得る。時系列化ステップ又は時系列化手段は選択された領域の過去から現在までの地震現象の変化を、地震システムが運動して生じる地震一つずつの各要素cの変位時系列と見なすことができる。 The time series forming step or the time series forming means converts the Dcj extracted by the seismic element signal forming step or the seismic element signal forming means into an earthquake occurrence order j (j = 1, 2, 3,..., M,. ) Based on the seismic element that obtains Dc = (Dc1, Dc2, Dc3,..., Dcm,...), Or performs a predetermined selection or smoothing process described later, and Dc = (Dc1, Dc2, Dc3). , ..., Dcm, ...) The time series forming step or time series forming means can regard the change of the seismic phenomenon from the past to the present in the selected area as a displacement time series of each element c of each earthquake generated by the movement of the seismic system. .
また請求項2,3、請求項7,8又は請求項12,13記載の発明によれば、所定の選択か平滑ステップを施した場合、例えば、w個の地震について移動平均を取った場合は、地震発生のランダム性をw個で平均して、少しでもランダムな地震現象の観測を容易にすることができる。 According to the second, third, seventh and eighth aspects or the twelfth and thirteenth aspects, when a predetermined selection or smoothing step is performed, for example, when a moving average is obtained for w earthquakes, In addition, the randomness of occurrence of earthquakes can be averaged by w pieces, thereby facilitating observation of even a little random earthquake phenomenon.
特に、地震要素cが震源要素であるLAT、LON、DEPの場合は、これら時系列Dcは、震源の現在までの時間的な推移を記述し、後述される尺度を用いると、将来の震源位置を推定できる。 In particular, when the seismic element c is the epicenter element LAT, LON, DEP, these time series Dc describe the temporal transition of the epicenter to the present, and using the scale described later, the future epicenter location Can be estimated.
前記一次微分出力ステップまたは一次微分出力手段は、地震要素の時系列化ステップで得られたDcの任意な地震発生順序mにおける任意間隔n(n=1,2,3、・・)の差、DcmとDcm−nとの差に比例する量を一次差分値ΔDcm,nとして求めるは、その間隔nだけ離れたDcmとDcm−nとが常に略異符合となるような変動成分を、時系列データのランダム変動から大きな値として抽出する。 The primary differential output step or the primary differential output means calculates a difference of arbitrary intervals n (n = 1, 2, 3,...) In an arbitrary earthquake occurrence order m of Dc obtained in the time-sequencing step of the seismic element; The amount proportional to the difference between Dcm and Dcm-n is determined as a primary difference value ΔDcm, n. A variable component in which Dcm and Dcm-n separated by an interval n are always substantially opposite signs is obtained in time series. It is extracted as a large value from random fluctuation of data.
従って、一次微分出力ステップまたは一次微分出力手段は、一見ランダムに変動しているような時系列データのなかにn毎に異符号となる変動、つまり周期が略2nとなるような周期変動が存在すれば、その周期変動成分のみをランダム変動から大きく抽出すると共に、同時に、Dcの一次の変化率である速度に比例した量を求める。 Therefore, the primary differential output step or the primary differential output means includes, in seemingly randomly varying time-series data, a variation having a different sign every n, that is, a periodic variation having a period of approximately 2n. Then, only the periodic fluctuation component is largely extracted from the random fluctuation, and at the same time, an amount proportional to the speed, which is the primary rate of change of Dc, is obtained.
前記二次微分出力ステップ又は二次微分出力手段は、時系列ΔDcm,nの任意間隔k(k=1、2、・・)での差、すなわちΔDcj,nとΔDcj−k,nとの差、に比例する量を、地震発生順序jでの二次差分値Δ2Dcm,n,kとして求める。二次微分出力ステップ又は二次微分出力手段は、ΔDcm,nとΔDcm−k,nとが常に略異符合となるような変動成分が存在すれば、地震要素の時系列データから前記一次微分出力ステップで、出力された周期が略2nの周期変動成分の中で更に周期が略2kの周期になるような変動成分のみ大きく抽出する。 The secondary differential output step or the secondary differential output means calculates a difference of the time series ΔDcm, n at an arbitrary interval k (k = 1, 2,...), That is, a difference between ΔDcj, n and ΔDcj−k, n. , Is calculated as a secondary difference value Δ 2 Dcm, n, k in the earthquake occurrence order j. The secondary differential output step or the secondary differential output means performs the primary differential output from the time series data of the seismic element if there is a fluctuation component such that ΔDcm, n and ΔDcm−k, n are always substantially opposite signs. In the step, only the fluctuation component whose period becomes approximately 2k is extracted more greatly from the period fluctuation components of which the output period is approximately 2n.
二次微分出力ステップ又は二次微分出力手段は、同時に、Dcmの二次の変化率である加速度に比例した量を求める。従って、もし前記間隔nとkとを、同じ値(k=n)にすれば、地震要素時系列データDcの変動成分のうち周期変動成分が略2kとなるものだけを大きく抽出することができる。 The secondary differential output step or secondary differential output means simultaneously obtains an amount proportional to the acceleration, which is the secondary rate of change of Dcm. Therefore, if the distances n and k are set to the same value (k = n), only the fluctuation component of the seismic element time-series data Dc having a periodic fluctuation component of approximately 2k can be largely extracted. .
例えば、n=kとした場合、一見ランダムで尺度が存在しないと思われていた地震現象から、略周期が2kの周期変動を尺度として抽出することになる。従って、一見ランダムな地震現象をこの尺度で観測すると、要素c毎に表現された地震現象の周期的な振幅変化を予知計測できるのみならず、その周期を時間計測の基準クロックとしても使用できるので、過去の地震現象から未来の地震現象を予知することができる。 For example, when n = k, a periodic variation having a substantially periodicity of 2k is extracted as a scale from an earthquake phenomenon that seemingly appears to have no scale at all. Therefore, if a seemingly random seismic phenomenon is observed on this scale, not only can the periodic amplitude change of the seismic phenomenon expressed for each element c be measured in a predictive manner, but the period can also be used as a reference clock for time measurement. It is possible to predict future earthquake phenomena from past earthquake phenomena.
前記二次微分出力ステップまたは二次微分出力手段で得られた地震発生順序mの二次差分値Δ2Dcm,n,kの振幅と位相とを異なる要素間で比較検出する振幅位相比較検出ステップは、前記要素時系列のうち、特別な変動周期成分を持っている要素時系列や加速度情報の各要素間での振幅と位相の相互比較の情報を抽出することができる。 An amplitude-phase comparison detection step of comparing and detecting the amplitude and phase of the secondary difference value Δ 2 Dcm, n, k of the order m of earthquake occurrence obtained by the secondary differentiation output step or the secondary differentiation output means between different elements. Can extract, from the element time series, information on an element time series having a special fluctuation period component and information on mutual comparison of amplitude and phase between elements of acceleration information.
従って、尺度が無く一見ランダムだと思われてきた地震現象に、前記記述の間隔k(n=k)で選択した周期振動が、周期現象(尺度)として出現することになる。周期性の尺度で地震現象を観測していくと、もし過去の大地震、例えば1995年1月17日の阪神・淡路大震災等の様な地震の発生が接近すれば、これまで生じてきた地震の周期振動の相互相関情報に異常が現れる。この周期現象に現れる異常を検出すると、大地震が何時発生するかを、地震現象の周期性を利用し予知できるのみならず、地殻に蓄積される応力の大きさと応力の臨界状態を予知できる。 Therefore, the periodic oscillation selected at the interval k (n = k) described above appears as a periodic phenomenon (scale) in an earthquake phenomenon that seems to be seemingly random without a scale. Observing seismic phenomena on a periodicity scale, if a large earthquake in the past approaches, such as the Great Hanshin-Awaji Earthquake on January 17, 1995, the earthquakes that have occurred so far Anomalies appear in the cross-correlation information of the periodic oscillations. When an abnormality appearing in this periodic phenomenon is detected, it is possible to predict not only when a large earthquake will occur using the periodicity of the seismic phenomenon, but also the magnitude of the stress accumulated in the crust and the critical state of the stress.
このように、広範囲の地震発生地帯に生じた過去の地震を、前記振幅位相比較検出ステップまたは振幅位相比較検出手段により検出された、各要素間の振幅、位相関係を用い、未来の地震の予兆現象を検出し、その予兆から発生時刻とマグニチュードの予知、地震要素LAT、LON、DEPの時系列Dcから震源の予知ステップを備えてなる地震の予知方法を構成することができる。 In this way, past earthquakes that occurred in a wide range of earthquake occurrence zones are detected by the amplitude-phase comparison detection step or the amplitude-phase comparison detection means, using the amplitude and phase relationships between the elements to predict the future earthquake. It is possible to configure an earthquake prediction method comprising detecting a phenomenon, predicting the occurrence time and magnitude from the prediction, and predicting the epicenter from the time series Dc of the earthquake elements LAT, LON, and DEP.
さらに、請求項2、3、請求項6、7、請求項11、12によれば、時間間隔累積検出ステップまたは時間間隔累積検出手段は、任意な地震の発生個数をa(a=1、2、・・)とし地震要素信号化ステップと時系列化ステップにより抽出した時間間隔INTを任意な地震発生順序mまで、a個累積しCIm(a)とするか、m番目の地震とm−a番目の地震発生時刻の差をCIm(a)とする。これは、一見ランダムに変化している地震と地震との時間間隔INTを、連続してa個、加算するので、要素INTの時系列Dcに存在するランダム性をいくらか取り除き、CIm(a)が大きくなれば、a個の地震発生に多くの時間を費やしたことになり、単位時間当たりの地震の数が減った事を意味するので、地震活動の静穏が大きくなった事を表現することができる。 Further, according to the second, third, sixth, seventh and eleventh aspects, the time interval cumulative detection step or the time interval cumulative detection means determines the number of occurrences of an arbitrary earthquake as a (a = 1, 2 , ..), and a time interval INT extracted by the seismic element signalizing step and the time-sequencing step is accumulated up to an arbitrary earthquake occurrence order m, and the result is CIm (a), or the m-th earthquake and m−a The difference between the times of occurrence of the th earthquake is CIm (a). This is because a seemingly random change of the time interval INT between earthquakes is continuously added by a, so that some randomness existing in the time series Dc of the element INT is removed, and CIm (a) becomes If it gets bigger, it means that a lot of time has been spent on the occurrence of a earthquakes, which means that the number of earthquakes per unit time has decreased, so it can be expressed that the calm of seismic activity has increased it can.
この時、累積(加算)する個数aを、前述した、地震現象を観測する尺度の周期に相当したk個にすると、CIm(k)は、大地震に進展する地震活動の静穏さを次の3つの段階に分類し、静穏の進行状況とその段階の大きさの程度を記述することができる。 At this time, if the number a to be accumulated (added) is set to k, which corresponds to the period of the scale for observing the seismic phenomenon described above, CIm (k) indicates the calm of the seismic activity that evolves into a large earthquake as follows. It can be classified into three stages and describe the progress of calm and the magnitude of the stage.
まず1段階目は、地震の数年前から観測される静穏の始まりである。次の2段階目は、1年程から半年程前に観測される大地震が起きそうな震央付近で地殻に蓄積された応力状態が臨界状態に達したと思える臨界静穏状態である。そして、3段階目は、大地震発生数日、数時間前に静穏が終了する、大地震発生直前の静穏終了の段階である。従って、CIm(k)の各段階が変化する推移とCIm(k)プロファイルの振幅値と幅の大きさは、これから生じる地震の発生時刻とマグニチュードを予知するパラメータに結びつける作用を持つこととなる。 The first stage is the beginning of the calm that has been observed several years before the earthquake. The second stage is a critical calm state where the stress state accumulated in the crust near the epicenter where a large earthquake is likely to occur about 1 to 6 months ago seems to have reached a critical state. The third stage is a stage in which the calm ends a few days and several hours before the occurrence of the large earthquake, and ends immediately before the occurrence of the large earthquake. Therefore, the transition of each stage of the CIm (k) and the magnitude and width of the CIm (k) profile have an effect of linking the occurrence time and magnitude of the earthquake that will occur to the parameters for predicting the magnitude.
また、請求項5、請求項10、請求項15によれば、フィルタ出力ステップまたはフィルタ出力手段は、地震要素の時系列化ステップで得た地震要素の時系列を地震の各要素c毎にバンドパスフィルターで濾過し、任意な地震発生順序mで地震現象観測の尺度となるFcmを、前記請求項1,2,3、請求項5,6,7、請求項9,10,11における振幅位相比較検出ステップに出力する。
According to the fifth, tenth, and fifteenth aspects, the filter output step or the filter output means converts the time series of the seismic elements obtained in the time series of the seismic elements into a band for each element c of the earthquake. The Fcm, which is a measure of seismic phenomenon observation in an arbitrary earthquake occurrence order m, is filtered by a pass filter, and the amplitude and phase of the Fcm in
任意に選択した広範囲な地震発生領域に発生した地震を選択し、地震要素信号化ステップで、それら地震の要素を数値化する。そして時系列化ステップで、数値化された地震要素を時系列にし、更に二次微分出力ステップもしくは請求項3のバンドパスフィルターで周期変動のみ抽出すると、抽出した各要素の周期変動を、一見ランダムに見受けられる選択地域の地震現象を観測する尺度とすることができる。観測する尺度は、周期的に変動するので、その振動の振幅と位相変化を振幅位相比較ステップで、モニターすると、地震要素INTとDEPの振動の間に生じる位相反転と、地震要素MAGの振動における相対的な振幅情報から、比較的大きな地震の予兆静穏を抽出することができる。更に予兆静穏を抽出後、振動の周期性が時計の時間ベースの機能をするので、静穏が終了する時刻、つまりその地震が発生する時刻を、予兆静穏検出から、これから発生するイベント数で正確に予知することができる。請求項2の時間間隔累積検出ステップで、変動周期に相当するイベント数だけ累積して得たCIm(k)は、略周期に相当するイベント数で平滑(累積)した地震活動の静穏を観測することになり、地震の予兆静穏とマグニチュードの大きさの程度、応力歪が臨界状態に達する過程を明確に抽出できる。
Earthquakes that occurred in an arbitrarily selected wide-area earthquake occurrence area are selected, and the earthquake elements are digitized in the earthquake element signalizing step. Then, in the time series forming step, the numerically converted seismic elements are made into a time series, and if only the periodic fluctuations are extracted by the secondary differential output step or the band pass filter of
地震発生時刻を予知すると同時に、地震要素LAT、LON、DEPの時系列情報から、発生時刻にあたる平均的な震源場所を選択された広い地震発生地帯から推定することができるので、将来発生すると予知されるその比較的大きな地震の震源を予知することができる。発生する地震が阪神・淡路大震災のように非常に大きいかどうかは、CIm(k)に現れる3段階の予兆静穏を特徴付けるプロファイルの大きさで推定することができる。また、阪神・淡路大震災前数年に渡り出現した要素時系列のDEPとMAGの逆位相の周期変動は、地震が発生することにより応力歪が生じその歪が蓄積される場合は、やがて臨界状態に達する推移過程を表しているので、その逆位相の振動個数が将来の地震が大地震かどうかを判定する基準とすることもできる。又、群発地震が終了する頃、例えば、領域が中国地方の場合、群発地震10aと10gの終了する頃に出現するCIm(k)上の特徴あるプロファイルは、群発地震終了後、略70日後に沈降しているフィリピンプレート上に発生した1984年の日向灘地震(10b)と2001年の安芸灘地震(10h)の予兆となっているので、この様なフィリピンプレート上に発生する大地震を、群発地震の観測から予知することもできる。
At the same time as predicting the time of the earthquake, it is possible to estimate the average epicenter at the time of occurrence from the selected large earthquake zone from the time-series information of the LAT, LON, and DEP seismic elements. The source of a relatively large earthquake can be predicted. Whether the earthquake that occurs is as large as the Great Hanshin-Awaji Earthquake can be estimated from the size of the profile that characterizes the three-stage predictive tranquility that appears in CIm (k). In addition, the periodic fluctuation of the antiphase of DEP and MAG in the elemental time series that appeared for several years before the Great Hanshin-Awaji Earthquake, when a stress strain is generated by an earthquake and the strain is accumulated, eventually a critical state , The number of vibrations having the opposite phase can be used as a reference for determining whether or not the future earthquake is a large earthquake. Also, when the swarm earthquake ends, for example, in the Chugoku region, when the
更に、発生するであろう地震の震源を予知した後、国土地理院により日本国中網の目のように張り巡らされたGPSのネットワーク(GEONET)から得られる、予知される震央付近のGPSサイトを選び(もしサイトが無ければGPSを設置する)日々の地殻変動を、日本国特許第2787143号の運動変化検出装置を用いて時系列にすると、地殻運動変化に生じるかもしれない異常地殻変動を、2−3週から数週間前には検出できることが実証されているので、本発明の地震の予知方法、と併用すれば、確実に地震の予知をすることができる。 Furthermore, after predicting the epicenter of the earthquake that will occur, a GPS site near the epicenter predicted from the GPS network (GEONET), which was set up by the GSI like a network in Japan, was obtained. (If there is no site, install GPS) If the daily crustal movement is time-series using the motion change detection device of Japanese Patent No. 2787143, abnormal crustal deformation that may occur due to crustal movement change , 2-3 weeks to several weeks before, it has been proved that it can be reliably used in combination with the earthquake prediction method of the present invention.
そして、請求項16の発明によれば、請求項11ないし請求項15のいずれかのプログラムを所定の処理装置で実施できる。 According to the sixteenth aspect, the program according to any one of the eleventh to fifteenth aspects can be executed by a predetermined processing device.
従って、本発明によれば、地震発生地帯の如何なる領域においても、日々発生している地震の各要素情報と、地殻変動情報とにより地震の予兆を検出し、地震の発生時刻と震源とマグニチュードとリアルタイムで確実に予知することができる。 Therefore, according to the present invention, in any region of the earthquake occurrence zone, each element information of the earthquake that is occurring every day, the sign of the earthquake is detected based on the crustal deformation information, the time of the occurrence of the earthquake, the epicenter, the magnitude, Predictions can be reliably made in real time.
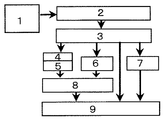
以下本発明を実施するための最良の形態を図面に基づいて説明する。図1は、地震の予知装置を示すブロック図である。本装置は、地震震源・発震機構情報源1と、地震要素信号化手段2と、地震要素の時系列化手段3と、一次微分出力手段4と、二次微分出力手段5と、フィルタ出力手段6と、時間間隔累積検出手段7と、振幅位相比較検出手段8と、予知手段9とからなる。本例において、地震予知装置は、地震震源・発震機構情報源1から得た情報をコンピュータにより地震予知プログラムを実行することにより実現している。
Hereinafter, the best mode for carrying out the present invention will be described with reference to the drawings. FIG. 1 is a block diagram showing an earthquake prediction device. This apparatus includes an earthquake source and focal
次に上述した地震の予知装置を適用した例を、過去の地震の中から、主に1995年1月17日の阪神・淡路大震災を詳しく取り上げ、図1から図11までを用いて説明する。 Next, an example in which the above-described earthquake prediction device is applied will be described in detail with reference to FIGS. 1 to 11, mainly taking into account the Great Hanshin-Awaji Earthquake of January 17, 1995 from the past earthquakes.
地震震源・発震機構情報源1は例えば、日本中に敷かれた地震計のネットワークからの震源情報や、発震機構情報をオンラインもしくはオフラインで抽出し、地震の地震要素信号化手段2〜予知手段9からなる地震予知装置に入力する。そして、装置の各手段が、それら地震情報を処理し、地震の発生時刻、震源、マグニチュードの予知を成す。
The earthquake source and focal
図2、図3、図4は、中国地方で生じた1995年阪神・淡路大震災の予知が出来たかどうかテストするために、中国地方(32度‐36度N、131.5度‐136度N)に、1983年1月から2001年9月までに生じた地震の内、マグニチュードが3.0以上、震源の深さが300km以内の地震を気象庁全国震源カタログから抽出した中国地方の地震の震源分布である。図3は、図2に示された各震源の深さ方向の震源分布で、縦軸に緯度を使用し、横軸に震源の深さをkmの単位で片対数表示した経度方向の断面図である。図4は、図2に示された各震源の深さ方向の震源分布で、横軸に震源の経度、縦軸に深さをkmの単位で片対数表示した緯度方向の断面図である。 Figures 2, 3, and 4 show the results of a test conducted in the Chugoku region (32 ° -36 ° N, 131.5 ° -136 ° N) to test whether the prediction of the 1995 Great Hanshin-Awaji Earthquake that occurred in the Chugoku region was successful. This is the epicenter distribution of the Chugoku region earthquakes of magnitude ≥3.0 and hypocenter depth of less than 300km from the Japan Earthquake's National Catalog of Outbreaks from January 1983 to September 2001. Fig. 3 is a longitudinal cross-sectional view of the hypocenter distribution of each epicenter shown in Fig. 2 with the vertical axis representing latitude and the horizontal axis representing the epicenter depth in semi-logarithmic units in km. It is. FIG. 4 is a cross-sectional view of the epicenter distribution in the depth direction of each epicenter shown in FIG. 2, in which the horizontal axis represents the longitude of the epicenter and the vertical axis represents the depth in semilogarithmic units in km, in a latitudinal direction.
図5は、抽出された地震の震源要素情報を、地震要素信号化ステップと地震要素の時系列化ステップと第二次の微分出力ステップにより、時系列化した実施例である。 FIG. 5 shows an embodiment in which the extracted source element information of the earthquake is time-series by a seismic element signalizing step, a seismic element time-series step, and a secondary differential output step.
図6は、抽出された地震の震源要素情報から得た5つの地震要素の時系列に略共通な60イベントの周期を持つ周期変動が、時系列のスペクトルに存在する事を示した実施例である。 FIG. 6 is an embodiment showing that a periodic variation having a period of 60 events substantially common to the time series of five earthquake elements obtained from the source element information of the extracted earthquake exists in the time series spectrum. is there.
図7は、フィルタ出力ステップを構成する1例として、第二次の微分出力ステップと等価な機能を持つフィルタ構成を図示した実施例である。 FIG. 7 is an embodiment illustrating a filter configuration having a function equivalent to the second-order differential output step as an example of configuring the filter output step.
図8は、図7で示されたフィルタ出力ステップのバンドパスフィルター機能を、スペクトル表示した実施例である。 FIG. 8 shows an embodiment in which the bandpass filter function of the filter output step shown in FIG. 7 is displayed in spectrum.
図9は、時間間隔累積検出ステップを用いて検出したCI(60)とCI(20)を用いて広い選択領域の中国地方出で阪神・淡路大震災等の大地震発生数年前から予兆静穏が観測される事を示した実施例である。 FIG. 9 shows that the sign of quietness has been detected several years before the occurrence of a large earthquake such as the Great Hanshin-Awaji Earthquake from the Chugoku region of a wide selection area using CI (60) and CI (20) detected using the time interval cumulative detection step. This is an example showing what is observed.
図10は、振幅位相検出ステップにより、中国地方の過去の大地震と比較的大きな地震の予兆を検出した実施例である。 FIG. 10 is an embodiment in which a large earthquake in the Chugoku region and a sign of a relatively large earthquake are detected by the amplitude phase detection step.
図11は、図5と図10におけるイベント数が480から800までの範囲を取り出し、1995年阪神・淡路大震災の予兆を検出してから、発生時刻の予知(イベント数で表示する予知時刻)と、震源の予知の求め方を示した実施例である。 FIG. 11 shows a case where the number of events in FIGS. 5 and 10 is extracted from the range of 480 to 800, and after detecting a sign of the 1995 Great Hanshin-Awaji Earthquake, the prediction of the occurrence time (the prediction time indicated by the number of events) and This is an example showing how to obtain the prediction of the epicenter.
図1において、地震震源・発震機構情報源1は、上述した日本中に敷かれた地震計のネットワークから得られる震源や、発震機構情報源である。地震要素信号化手段2は、これら地震情報を、オンラインもしくはオフラインで受け取り、例えば、j番目の地震の各要素cに関する情報をDcjとして数値化する。次に、時系列化手段3では、Dcjを、地震の発生順序j(j=1、2、3、・・、m、・・)に基づいて、直接もしくは所定の選択か平滑ステップを施し、地震の各要素cの時系列、Dc=(Dc1、Dc2、Dc3、・・、Dcm、・・)とする。
In FIG. 1, an earthquake epicenter and focal
そして、一次微分出力手段4では、前記Dcから地震発生順序mにおける、間隔nとkに関する一次(ΔDcm,n)の差分量を、二次微分出力手段5では二次(Δ2Dcm,n,k)の差分量をそれぞれ得る。フィルタ出力手段6は、時系列化手段3で得られた地震要素の時系列Dcを地震の各要素c毎にバンドパスフィルターで濾過し任意な地震発生順序mでFcmを得る。
Then, the first
時間間隔累積検出手段7は、時系列化手段3で得られた時系列Dcの要素cのINTをk個累積し地震活動の3段階の静穏を表すCIm(k)を得る。振幅位相比較検出手段8は、二次微分出力手段5で得た二次差分値Δ2Dcm,n,k、もしくはフィルタ出力手段6で得たDcをバンドパスフィルターしたFcmの振幅と位相とを異なる要素間で比較検出する。これは、各要素のcの中で、二次微分出力手段5もしくはフィルタ出力手段6により選択抽出した周期変動成分の振幅と位相の関係から、地震の予兆、つまり、大地震に発展しそうな地殻の応力歪の状況と応力臨界状態に達した兆候を検出するためのものである。
The time interval
予知手段9では、振幅位相比較検出手段8で検出された地震の予兆を基に、時系列化手段3と時間間隔累積検出手段7から供給される情報から、地震の発生時刻と震源と地震のマグニチュードを予知する(例えば、図1、図2、図3に予知震源の地理的な場所表示と図9と図11を用いた予知進行状況)を日々リアルタイムで解析しそれら情報を表示する。 The prediction means 9 uses the information supplied from the time-series means 3 and the time interval accumulation detection means 7 on the basis of the earthquake sign detected by the amplitude / phase comparison detection means 8 to determine the occurrence time of the earthquake, the epicenter and the earthquake. Forecasting the magnitude (for example, the geographical location display of the prediction epicenter in FIGS. 1, 2, and 3 and the progress of the prediction using FIGS. 9 and 11) is analyzed in real time every day and the information is displayed.
次に、図示された各手段により、震源情報のみ用いて、1984年から2001年9月までに中国地方で生じた過去の大きな地震を対象とし予知が可能であったかを検証する。中でも、1995年阪神・淡路大震災の予知検証の実施例を、図に基づいて詳細する。この例では、地震予知を簡潔に説明するために地震情報源として不均質な断層構造の時空変化情報やプレート境界にあるアスペリティの時空分布情報を与える発震機構解は用いていない。 Next, we will verify whether it is possible to predict the past large earthquakes that occurred in the Chugoku region from 1984 to September 2001, using only the epicenter information, using the illustrated means. Above all, an example of the prediction verification of the 1995 Hanshin-Awaji Earthquake will be described in detail with reference to the drawings. In this example, in order to briefly explain the earthquake prediction, the focal mechanism solution that gives the spatiotemporal change information of the heterogeneous fault structure and the spatiotemporal distribution information of the asperity at the plate boundary is not used as the seismic information source.
図2において、地図に表示された地震は、中国地方(32度‐36度N、131.5度‐136度N)に、1983年1月から2001年9月までに生じた地震の内、マグニチュードが3.0以上、震源の深さが300km以内の地震で、それらは気象庁の全国震源カタログから集めたものである。図の横軸は、経度、縦軸は緯度を表している。点で示された各地震の震央は、マグニチュード(MAG)が3.0以上3.5未満で、丸印の震央は、MAGが3.5以上の地震である。1984年以降の大きな地震のうちMAGが6以上の6個の地震と2つの群発地震とに、10aから10hのラベルを、発生年代順につけた。10aは、1984/05/30(年/月/日)の群発地震、10bは、1984/08/07のMAGが7.1の地震、10cは、1985/05/13のMAGが6.0の地震、10dは、1995/01/17のMAGが7.2の阪神・淡路大震災、10eは、1997/06/25のMAGが6.3の地震、10fは、2000/10/06のMAGが7.3の鳥取地震、10gは、2001/01/12の群発地震、10hは、2001/03/24のMAGが6.7の安芸灘地震である。 In Fig. 2, the earthquakes displayed on the map were in the Chugoku region (32 degrees-36 degrees N, 131.5 degrees-136 degrees N), and the magnitude of the earthquakes from January 1983 to September 2001 Earthquakes with an epicenter of more than 3.0 and a depth of less than 300 km were collected from the Japan Meteorological Agency's national epicenter catalog. The horizontal axis in the figure represents longitude, and the vertical axis represents latitude. The epicenter of each earthquake indicated by a dot has a magnitude (MAG) of 3.0 or more and less than 3.5, and the epicenter indicated by a circle is an earthquake with a MAG of 3.5 or more. Among the large earthquakes since 1984, six earthquakes with MAG of 6 or more and two swarm earthquakes are labeled 10a to 10h in the order of occurrence. 10a is a swarm earthquake of 1984/05/30 (year / month / day), 10b is a 1984/08/07 MAG earthquake of 7.1, 10c is a 1985/05/13 MAG of 6.0 earthquake, 10d Is the Great Hanshin-Awaji Earthquake with a MAG of 7.2 on January 17, 1995, 10e is a 6.3 earthquake with a MAG of June 25, 1997, 10f is a Tottori earthquake with a MAG of 2000/10/06, 7.3. 10g is the earthquake swarm of 2001/12/12 and 10h is the Akinada earthquake of 6.7 MAG on 03/24/2001.
図3において、緯度方向の断面図で示されているMAGが3.5以上の丸印の地震痕跡は、フィリッピン・プレートの北端がユーラシア・プレートの南端下に沈降している状況を表している。11のラベルが付いた線形トレンドは、MAGが3.5以上の地震のうち、後述される略60イベントの周期を持った周期変動(振動)の痕跡である。振動の座標原点は、阪神・淡路大震災の直前までの略700個余りの震源の平均値 (34度N、133.75度E、30km) に略等しい。従って、震央の平均値は、図2に示された中国地方の地理的な中心地で、振動の座標原点は固定されていると仮定する。 In FIG. 3, the quake mark of a circle with a MAG of 3.5 or more shown in the latitudinal sectional view indicates a situation in which the northern end of the Philippine plate is subsided below the southern end of the Eurasian plate. The linear trend labeled 11 is a trace of a periodic fluctuation (vibration) having a cycle of approximately 60 events, which will be described later, among earthquakes having a MAG of 3.5 or more. The coordinate origin of the vibration is approximately equal to the average value (34 degrees N, 133.75 degrees E, 30 km) of approximately 700 hypocenters immediately before the Great Hanshin-Awaji Earthquake. Therefore, it is assumed that the average value of the epicenter is the geographic center of the Chugoku region shown in FIG. 2 and the coordinate origin of the vibration is fixed.
図4において、経度方向の断面図で示されているMAGが3.5以上の丸印の地震痕跡は、フィリッピン・プレートがユーラシア・プレートの下に片対数軸上で略円弧状に位置している状況を表している。 In Fig. 4, the seismic trace indicated by a circle with a MAG of 3.5 or more, which is shown in a longitudinal sectional view, shows that the Philippine plate is located in a substantially arc shape on a semilogarithmic axis below the Eurasian plate. Is represented.
従って、図2と図3と図4において、実施例で用いた地震予知対象領域の中国地方は、フィリッピン・プレートの沈降ゾーン(図3では、右下の10b、10c、10hが存在する震源分布で図4では震源が深い方の円弧状の震源分布)とユーラシア・プレートの南端(図3の左上の10a、10d、10e、10f、10gとが存在する地震の痕跡分布で、図4では痕跡の浅い横帯状の分布)との、プレート境界上に位置している。 Therefore, in FIG. 2, FIG. 3 and FIG. 4, the Chugoku region of the earthquake prediction target area used in the example is the sedimentation zone of the Philippine plate (in FIG. 3, the hypocenter distribution where the lower right 10b, 10c, and 10h exist). Fig. 4 shows the trace distribution of the earthquake where the epicenter is deeper in the arc shape and the southern end of the Eurasian plate (10a, 10d, 10e, 10f, 10g at the upper left of Fig. 3). (Shallow horizontal band-like distribution).
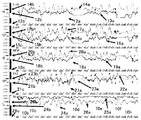
図5において、図1の2と3と5の各ステップによって得られた各地震要素の時系列Dcと二次差分情報を説明する。横軸に全て地震発生の順番(イベント数)を取り、集めた地震の全ての震源と、発生時刻、マグニチュード情報を、2、3の各ステップにより地震要素を5つの行(LAT、LON、DEP、INT、MAG)にわけ、直接得た各時系列Dcをそれぞれ上からLAT行に12a、LON行に15a、DEP行に18a、INT行に21a、MAG行に24aとして図示したものである。また、平滑化ステップの1例として、これら直接得た時系列Dcを20イベントずつ移動平均した時系列を、同様に、上からLAT行に13a、LON行に16a、DEP行に19a、INT行に22a、MAG行に25aとして図示したものである。 In FIG. 5, the time series Dc and the secondary difference information of each seismic element obtained in each step of 2, 3 and 5 in FIG. 1 will be described. The horizontal axis indicates the order of earthquake occurrence (the number of events), and all the sources of the collected earthquakes, the time of occurrence, and the magnitude information are shown in five rows (LAT, LON, DEP) for each of the two or three steps. , INT, and MAG), and the time series Dc directly obtained are shown as 12a in the LAT row, 15a in the LON row, 18a in the DEP row, 21a in the INT row, and 24a in the MAG row from the top. As an example of the smoothing step, similarly, a time series obtained by moving and averaging the directly obtained time series Dc by 20 events is similarly calculated from the top as 13a in the LAT row, 16a in the LON row, 19a in the DEP row, and 19a in the INT row. 22a and 25a in the MAG line.
これら時系列Dcのグラフ表示のための基準値はLATが、12bで示す緯度34度で、LONが15bの経度133度、DEPが18bの30km、INTが21bの200時間、MAGが24bの 5.0である。夫々のスケールはグラフの基準値からのオフセット値を示し、上からLATとLON、が200倍、DEPが10倍、INTが2倍、MAGが400倍されている。上方向に負のオフセット値、下方向に正のオフセット値が取られる。従って、LATとLONの正負の600は、夫々34度と133度から、3度に増減に相当する。つまり、-600は緯度(LAT)の場合31度となり、LONは130度となる。又、DEPは、−300の目盛りが0km、INTは、−400が0時間に、MAGは、−600が3.5、+600が6.5となる。 The reference values for the graph display of these time series Dc are as follows: LAT is 34 degrees latitude indicated by 12b, LON is 133 degrees longitude at 15b, DEP is 30km at 18b, INT is 200 hours at 21b, MAG is 5.0 hours at 24b. It is. Each scale indicates an offset value from the reference value of the graph. From the top, LAT and LON are 200 times, DEP is 10 times, INT is 2 times, and MAG is 400 times. A negative offset value is taken upward and a positive offset value is taken downward. Therefore, the positive and negative 600 of LAT and LON correspond to an increase and decrease of 3 degrees from 34 degrees and 133 degrees, respectively. That is, -600 is 31 degrees in the case of latitude (LAT), and LON is 130 degrees. In addition, DEP has a scale of -300 at 0 km, INT has -400 at 0 hour, MAG has -600 at -600 and +600 at 6.5.
更に、LAT行の左下の12cで示されている緯度35.48度は、モニター中、最新の震源緯度を表示するので、右端の最終イベントの緯度を表示している。同様に、経度(LON)の場合、15cがモニター中の最新経度、震源の深さ(DEP)の場合、18cがモニター中の最新DEP数値、INTの場合、21cがモニター中の最新数値、MAGの場合、24cが最新のMAG数値を表示している。 Furthermore, the latitude of 35.48 degrees indicated by 12c at the lower left of the LAT line indicates the latest epicenter latitude during monitoring, and thus indicates the latitude of the last event on the right end. Similarly, in the case of longitude (LON), 15c is the latest longitude being monitored, the depth of the epicenter (DEP), 18c is the latest DEP value being monitored, and in the case of INT, 21c is the latest value being monitored, MAG In the case of, 24c displays the latest MAG numerical value.
更にMAGのDcを表している24aが6以上になると、太い線で記されていて、その隣には、それら群発地震を除いた6以上の地震に対応するDcにそれらラベルが、10bから10hまで記されている。例えば、予知の実施例として詳細する、阪神・淡路大震災は、10dに対応する。 Furthermore, when 24a representing the Dc of the MAG is 6 or more, it is marked with a bold line, and next to it, the labels corresponding to the Dc corresponding to 6 or more earthquakes excluding the swarm earthquakes are labeled 10b to 10h. Is written. For example, the Great Hanshin-Awaji Earthquake, which is described in detail as an example of prediction, corresponds to 10d.
中国地方に集められた地震要素の時系列の変動、12a、15a、18a、21a、24aは、各イベントが、見かけ上、全てランダムに出現している様子を示している。時系列の非常に小さな変動は(MAGの場合を除いて)これらのイベントが群発地震もしくは大きな地震の余震である事を表している。非常に短いINTを伴う、LAT、LON、DEPの局所化はこれら連続して生じているイベントの場所(震源)を現している。地震要素cがINTの時系列21aは、静穏(長いINT)がランダムに出現する事を示している。
Time-series fluctuations of the seismic elements collected in the Chugoku region, 12a, 15a, 18a, 21a, and 24a, show that all events seem to appear at random. Very small fluctuations in the time series (except in the case of MAG) indicate that these events are swarms or aftershocks of large earthquakes. The localization of LAT, LON, and DEP, with very short INTs, reveals the location of these successive events. The
従って、大地震発生後、その地震発生領域の地震活動を振り返ってみれば、静穏が存在したとされるその予兆的な静穏は認識されない。しかし、13a、16a、19a、22a、25aのグラフに見られるように、要素時系列のランダム性は、20イベントの移動平均を取ることによりある程度取り除くことが出来る。この時、要素INTの時系列22aの最大ピークは、阪神・淡路大震災の直前では、280時間程になり、時系列で最も長いその最大ピークは、時系列全体を見直して始めて阪神・淡路大震災の予兆的な異常静穏と認識できる。この静穏は、更に、時間間隔累積検出ステップ7で、後述の図9における説明で、INTを60個累積し地震活動の静穏を3段階に分類するCIm(60)を用いると、阪神・淡路大震災が発生する前に地震の明確な予兆静穏だと認識できることになる。
Therefore, when looking back on the seismic activity in the earthquake occurrence area after the occurrence of the large earthquake, the sign of the presence of the silence is not recognized. However, as shown in the graphs of 13a, 16a, 19a, 22a, and 25a, the randomness of the element time series can be removed to some extent by taking a moving average of 20 events. At this time, the maximum peak of the
更に、図5においては、各要素の時系列を20イベントで移動平均したDcを用い、4と5のステップでn=k=30と設定し、図1の二次微分出力ステップ5で得た二次差分値Δ2Dcm,n,k(n=k=30イベント)を、夫々、14b、17b、20b、23b、26bを基準に、14a、17a、20a、23a、26aとして、地震要素cが上から順番にLAT、LON、DEP、INT、MAGとなるよう相対表示している。そして、これら、二次差分値の時系列は、図1の5でn=k=30としているので、地震要素時系列Dcの変動成分のうち周期が、そのkの2倍のイベント数にあたる略60イベントとなる周期変動成分のみを抽出している。この変動成分の周期性が、地震現象を観測する尺度(観測窓)となる。そして、図1の位相振幅相対変化検出ステップ8が、具体的な観測ステップを与えることになる。後述する図10において詳細するが、その観測ステップを用いて、地震の予兆を検出し、その地震の震源とイベント数で表示する発生時刻を予知する。
Further, in FIG. 5, using the Dc obtained by moving-averaging the time series of each element in 20 events, n = k = 30 is set in
図6において、このような周期変動成分が3のステップで、直接もしくは平滑化の後に得た時系列Dcに存在している事実を、地震要素の時系列のスペクトルで示す。実施例として、3のステップで直接得た時系列Dcを、イベント4個ずつで移動平均した時系列のスペクトラルを表示している。スペクトラルを得るために使用した地震は阪神・淡路大震災直前までの700イベントである。縦軸は、相対振幅値を表示し、横軸は、周波数(1/イベント数)を表示している。27はLAT、28はLON、29はDEP、30はINT、31はMAGのスペクトルを表示している。これらスペクトルは、各地震要素の時系列Dcが略ランダムに変動している事を示している。つまり、地震現象は一見ランダムに発生しているような印象を与えるが、各地震要素に略共通な周期変動の略60イベントの周期性も存在する。この各要素に共通な略60イベントの周期を、縦矢印32で示してある。この時の周波数は、周期60イベントの逆数で、略0.017(1/イベント)となる。周波数が0.1(1/イベント)以下では、4イベントでDcを移動平均してもしなくとも、Dcは同じスペクトル構造を持つ。又、20個ずつの移動平均した要素時系列、13a、16a、19a、22a、25a、からも直接、略60イベントの周期性が観測される。この周期性は、本震、余震の繰り返しから生じた周期性とは少し異なるようである。従って、この周期変動(振動)を地震現象の観測尺度として使用する。なお、横矢印33は、次の図7において説明するように、二次微分出力ステップ5における二次差分が、バンドパスフィルターの役割を暗に含んでいるので、そのバンドパス範囲を示してある。その領域は、周期で120イベントから40イベントの範囲に相当する。
In FIG. 6, the fact that such a periodic fluctuation component exists in the time series Dc obtained directly or after smoothing in
図7において、35、36、37は、二次微分出力ステップ5に含まれていた特定な周期変動を抽出する機能を説明するためと、その機能と等価なバンドパスフィルターを構成するための矩形波およびその組み合わせの構成図例である。これらの図は、日本国特許第2787143号と第3044228号、米国特許第5626141号に基づいて構成してある。図中、縦軸は、地震の要素時系列の大きさ、横軸はイベント数である。34は地震のある要素時系列を平滑していない直接得られた時系列を表している。簡単のため、イベント数は1から15までとしてある。従って、34a、34b、34c、は夫々イベント数が5、10、15に相当する地震の要素時系列の値を示している。次に、図1の5のステップに含まれる抽出(フィルタ)の詳細機能を説明する。
In FIG. 7,
3の地震要素時系列化の直前に行われる選択か平滑ステップの一例は、時系列34の移動平均である。この移動平均は、任意の観測イベントmが1イベントずつ増加する毎に、図示されている矩形波35を、1イベントずつ右側に移動させ、35内にある3つの矢印が指している時系列34の3イベント(個)の値を読み取り、読み取り値を全て加算し、読み取り個数の3で除算し(平均操作し)、その平均値を35内の右端の矢印が指すイベントの値とすることである。この平均操作は、予め各矢印の長さを1/3にし、各読み取り値にその矢印の長さを掛けても良い。この時、矢印が上向きの場合は正の倍率で、下向きの場合は負の倍率となる。また、読み取り個数に相当する3個のイベントは、35の幅35a(=3イベント)で表示されている。従って、図5の要素時系列13a、16a、19a、22a、25aは、矩形波35の幅35aを20イベントとして平滑していない要素時系列、12a、15a、18a、21a、24aを移動平均して平滑した要素時系列である。
An example of the selection or smoothing step performed immediately before the seismic element time series of No. 3 is a moving average of the
この移動する矩形波を、2段目の36の様に上下方向に2つ、3段目の37の様に、上方に2個、下側に1個(37a)配置すると、それら矩形波36と37で囲まれた時系列34の連続的な読み取り値を得て、時系列34の、夫々一次、二次差分値を見つけることができる。この時、間隔36aで図示されている任意間隔n=kは、5イベントの例である。これら一次差分、二次差分量は、それぞれ数1と数2の次式で与えられる。
If these moving rectangular waves are arranged vertically in two as in the
(数1) (Equation 1)
[(Dc15+Dc14+Dc13)−(Dc10+Dc9+Dc8)]/3
(数2)
[(Dc15 + Dc14 + Dc13)-(Dc10 + Dc9 + Dc8)] / 3
(Equation 2)
[(Dc15+Dc14+Dc13)−2・(Dc10+Dc9+Dc8)+(Dc5+Dc4+Dc3)]/3 [(Dc15 + Dc14 + Dc13) -2. (Dc10 + Dc9 + Dc8) + (Dc5 + Dc4 + Dc3)] / 3
従って、矩形波37aの下向き矢印の長さは他の矢印の2倍で2/3となる。このように矩形波形と一致した時系列34の変動成分のみ抽出するそのような読み取り操作は、要素時系列Dcと矩形波形との相互相関を得る操作となる。この時、相互相関を得るために行うDcの読み取り値の加算、差分操作は、それぞれ、ローパス、ハイパスの各フィルタ操作をDcに施す事である。従って、矩形波の形がそれらフィルタ機能を定めるので、その機能は、全ての矩形波形のイベント数mに関するフーリエ積分変換式(スペクトラル)で与えられる。その変換式は省略し、計算結果のみ図8に表示する。
Therefore, the length of the downward arrow of the
図8において、縦軸は、矩形波形のスペクトルの相対振幅値で、横軸にはその周波数(単位は、イベント数mの逆数でm−1)を使用し、20イベントの周期に対応する高周波が0.05となる領域まで表示してある。移動平均個数を20イベント、n=k=30とした場合の矩形波形37が持つバンドパスフィルター機能を38にグラフ表示した。38の場合は、ハイパスとローパスフィルターのカットオフ周波数が、それぞれ(4x30)−1と(2x20)−1とで与えられるバンドパスフィルターの機能を図示している。それらカットオフ周波数は38の最高強度が半分になる箇所で定義されている。又、その最高強度は略(2x30)−1付近にある。更に、前記の図6では、各要素時系列Dcのスペクトラル上にこのバンドパスフィルターを通過する時系列Dcの変動周波数成分の範囲が、水平な矢印33で図示されている。比較のために、矩形波構成例37において、移動平均個数20と差分を取るための任意間隔n=k=20とが全て等しい場合のバンドパスフィルター機能を、38aに図示した。この事から、38が38aのバンドパスフィルター機能がはるかに優れている事を示している。35の矩形波形で移動平均個数が20の場合のローパスフィルター機能も、39に図示した。次に、地震現象を周期変動成分が略60イベントの周期振動となる尺度で観測するにあたり、各地震要素cの間で略共通な変動周期のうち、60イベントの選択の重要性を、図9に基づいて説明する。
In FIG. 8, the vertical axis indicates the relative amplitude value of the spectrum of the rectangular waveform, and the horizontal axis indicates the frequency (the unit is m −1, which is the reciprocal of the number m of events). Are displayed up to the area where is 0.05. The bandpass filter function of the
図9において、まず、図のスケールに関しては、横軸が、イベント数mを表す。左側の縦軸は日数で、それらは、グラフ40と41のスケールとなり、最大値は、800日である。40と41は、7の時間間隔累積検出ステップにより得た累積INTの CIm(a)を表示していて、40が60個、41が20個のINTを連続してa個累積(加算)した時系列で、それぞれ40がCIm(60) と41がCIm(20)である。もしそれらを、累積個数の60、20で除算すると、INTの時系列Dcの移動平均となる。従って、41は、増加方向が逆となるが、図5の22aと同じ時系列でもある。周期変動の周期に相当する60イベントを累積した40は、60個の連続した地震を発生するのに費やした日数を表し、41は、20個の連続した地震を発生するのに費やした日数を表している。従って、日数が多くなれば、MAGが3.5以上の地震活動が静穏になった事を意味する。この時、地震活動の静穏は、実施例で選択した中国地方という広範囲な領域にわたって観測されている。
In FIG. 9, first, regarding the scale of the figure, the horizontal axis represents the number of events m. The vertical axis on the left is the number of days, which scales the
従って、図9の予兆静穏の検出からは、何処に大地震が発生するのか判らないので、その震源予知は、図11において説明する。また、図9には、これから説明する静穏が地震の予兆となっている状況を明確にするために、MAGとLONとの要素時系列を、横軸に40と41の表示に使用した同一のイベント数を使用し表示している。右側の縦軸は、地震要素がMAGの時系列24a用のスケールで、5以上のMAGだけが表示されている。LONの時系列は、15aで表示されていて、そのスケールは右側の縦軸を使用した相対表示である。LONとMAGの要素時系列は、図5の15aと24aとまったく同一の時系列であるが、それらの値の増加方向は、図5とは逆で、上向きが増加方向である。2つの群発地震10aと10gは、LONの時系列上に示され、MAGが6以上の地震に関しては、10bから10hまでのラベルが24aに付けられている。又、40には、図10において説明する選択領域の中国地方内に発生した地震の予兆を検出した箇所に40aから40hまで8個のラベルを付けている。
Therefore, since it is not known from the detection of the sign of quietness in FIG. 9 where a large earthquake will occur, the prediction of the epicenter will be described with reference to FIG. FIG. 9 shows the same elemental time series of MAG and LON used for the display of 40 and 41 on the horizontal axis in order to clarify the situation in which the calm described below is a sign of an earthquake. Displayed using the number of events. The vertical axis on the right is a scale for the
CIm(60)である40には、明確な予兆的静穏が、イベント数mが783の時、発生した阪神・淡路大震災10dの前に出現し、その静穏には、3つの段階が存在する事を示している。その3つの段階は、m=625から780のイベント間に現れる。第一段階では、そのCIm(60)は、m=625の300日から、m=700の600日へと定常的な上昇で始まる。この様に、静穏はこれからやってくる地震の数年前から徐々に顕著になる。
At CIm (60) 40, a clear predictive tranquility appears before the Great Hanshin-
このような第1段階の静穏は、地震の前では、地震活動度の静穏として普遍的に観測されている。第2段階では、更に突然50日から100日の急増を第1段階に追加する。阪神・淡路大震災直前の第3段階では、第2段階の直後に100日余り急減する。第3段階で、静穏は、地震の数日から数時間前に終了する。この第3段階の静穏が終了する状況は、関東地方における過去のMAGが5以上の地震で観測されているとの論文報告もある。第2段階にある第2番目のCIm(60)のピーク40dが阪神・淡路大震災の最終的な予兆になっていて、応力蓄積の臨界状態を表していると思われる。そのピークは、40dの真下にあるCIm(20)のピークとも一致する。
Such a first-stage tranquility is universally observed as the tranquility of the seismicity before the earthquake. In the second stage, a sudden increase of 50 to 100 days is added to the first stage. In the third stage, just before the Great Hanshin-Awaji Earthquake, it will drop sharply for more than 100 days immediately after the second stage. In the third stage, the calm ends several days to several hours before the earthquake. As for the situation where this third stage of calm is over, there are reports that past MAGs in the Kanto region have been observed by more than 5 earthquakes. The
このような、40c、40e、40fからなる第2段階の急な静穏は主な地震もしくは地震の略2〜3ヶ月前に先立って生じている。この状況は、他地域の地震の予兆的静穏にも現れている。又、実際の地震予知を実施する場合、これから、選択領域に起きるであろうと予知される地震のMAGの程度(例えば阪神・淡路大震災の場合のようにMAGが7以上の地震である)を、過去の大地震に基づいてCIm(60)波形のプロファイルや大きさを表すパラメータ(例えば、静穏がピークに達した最高値と、波形の幅の大きさや、或いは、波形で囲まれる面積等)を用いて、推定することができる。従って、略60イベントの周期で平滑(累積)した地震活動の静穏をCIm(60)で観測すると、地震の予兆静穏とマグニチュードの大きさの程度、応力歪が臨界状態に達する過程を明確に抽出できる。 Such a sudden tranquility in the second stage, consisting of 40c, 40e and 40f, occurred prior to the main earthquake or approximately 2-3 months before the earthquake. This situation is reflected in the sign of the earthquake in other regions. Also, when implementing actual earthquake prediction, the magnitude of the MAG of the earthquake that is predicted to occur in the selected area (for example, an earthquake with a MAG of 7 or more as in the case of the Great Hanshin-Awaji Earthquake) Parameters representing the profile and magnitude of the CIm (60) waveform based on past large earthquakes (eg, the maximum value at which the calm peaked, the magnitude of the waveform width, or the area surrounded by the waveform) Can be used to estimate. Therefore, when the quietness of the seismic activity smoothed (accumulated) at the cycle of about 60 events is observed by CIm (60), the predictive quietness of the earthquake, the magnitude of the magnitude, and the process of the stress strain reaching the critical state are clearly extracted. it can.
又、浅いユーラシア・プレート内(図2の北東方面の兵庫県)で発生した2つの群発地震10aと10gの終了直後から、70日と69日後にそれぞれ沈降しているフィリッピン・プレート上の比較的深い箇所で発生した日向灘地震10bと安芸灘地震10hに関して、CIm(k)のプロファイルから、それら群発地震はその直後70日程後に発生した地震の予兆であると見なせる。その予兆箇所が40aと40hで示されている。それら小さな山の形状は、マグニチュード4以上の地震を集めてCIm(10)を図示すると、群発地震直後、矩形波のようなステップで50日余り急上昇する同じような予兆静穏が観測されるが、それら予兆静穏の痕跡である。更に、群発地震が予兆であるといえることに関しては、国土地理院のGEONETから、地震10gと10hの震央付近のGPSサイトで得た地殻運動の変化を日本国特許第2787143号の運動変化検出装置を用いて時系列解析し、その結果を位相平面に地殻変動の運動軌跡として描くと、その2つの地震がお互いに関係しあい、群発地震がその69日後の安芸灘地震を誘発している様子が判明している。
Immediately after the end of the two
図10において、5により抽出した二次差分の要素時系列周期変動を、8を用いて、上から14aと17a、17aと20a、20aと14a、23aと20a、26aと20aの振幅と位相比較の実施例を表示している。各行の配列は、図5のLAT、LON、DEP、INT、MAG行と同一にしている。ただし、14a、17a、20a、23aと26aの表示に関して、それら各振幅の最大絶対値が1となるように規格化している。各行の縦軸は、相対振幅値のスケールで最大は+1、最小は−1である。各行の+−記号は、それぞれ正負の振幅領域を表示している。各横軸にはイベント数を表示している。阪神・淡路大震災と記した長い矢印が、その地震の発生したイベント箇所(m=783)を示している。更に、振幅位相比較検出ステップ8で検出した地震の静穏的な予兆を、上から4番目のINT行に、40b、40c、40d、40e、40f、40gと記している。これら予兆静穏は、地震要素がDEPの20aとINTの23a間における位相の反転と、同時に、MAGの26aがMAG =3.5の大きさの地震活動が多くなる事を示す負の振幅状態を示している。この様な、予兆静穏の後には、図9の24aに示されるように大きな地震が必ず発生している。ただし予兆40fの後の地震は、MAGが4.9の地震である。次に14aと17a、17aと20a、20aと14aの振幅と位相関係から判明する地震現象の予兆静穏も含め異なる予兆について、その予兆の発生要因について概略する。
In FIG. 10, the amplitude and phase of 14a and 17a, 17a and 20a, 20a and 14a, 23a and 20a, 23a and 20a, and 26a and 20a from the top are compared with the elementary time-series periodic variation of the secondary difference extracted by 5 using 8 Is displayed. The arrangement of each row is the same as the LAT, LON, DEP, INT, and MAG rows in FIG. However, the display of 14a, 17a, 20a, 23a and 26a is standardized so that the maximum absolute value of each amplitude is 1. On the vertical axis of each row, the maximum is +1 and the minimum is -1 on the scale of the relative amplitude value. The plus and minus symbols in each row indicate the positive and negative amplitude regions, respectively. The number of events is displayed on each horizontal axis. The long arrow marked Great Hanshin-Awaji Earthquake indicates the event location (m = 783) where the earthquake occurred. Further, the quiet signs of the earthquake detected in the amplitude phase
本例で選択した中国地方はユーラシア・プレートとフィリッピン・プレートの境界上に位置する。国土地理院のGPS観測網(GEONET)によれば、この境界では、図2における地震10eの震央付近を基準点として固定すると、フィリッピンの沈降プレートが略3cm/year程の速度で南東から北西方向に向かって相対移動している。このプレートの相対運動が、図2、図3、図4に見られるように、プレート境界の地殻の柔らかい層から固い層への遷移領域(D-B層)付近に地震発生地帯を作り出している。この地震発生地帯に観測している様に、全ての地震要素に略共通な長い周期(略60イベント)の振動14a、17a、20a、23aと26aを生じさせる何かが、地震発生地帯に存在しているに違いない。地殻の硬い層と固い層から柔らかい層への遷移領域が弾性体と見なせるなら、それら周期で発生している地震が、地殻の歪の増減に伴い生ずるストレス蓄積の増減を繰り返していると考えられる。
従って、もし、大地震が発生しそうであれば、それら繰り返し振動に、なにか異常(予兆)が、地震の前に表れると考えられる。
The Chugoku region selected in this example is located on the border between the Eurasian plate and the Philippine plate. According to the Geospatial Information Authority of Japan's GPS network (GEONET), the sedimentation plate of the Philippine sedimentation plate at this boundary is fixed at the epicenter of the
Therefore, if a large earthquake is likely to occur, it is considered that something abnormal (predictive sign) appears in those repeated vibrations before the earthquake.
まず、地震要素のLAT、LON、DEPの振動14a、17a、20aを、図2、図3、図4で示される地理的空間の地震の痕跡と対応付け、予兆が出現する事を示す。地震要素がLAT、LONとDEPの振動のゼロ基準は、(34度N、133,75度E、30km)に固定されてあると仮定する。大部分の14aと17aは略同位相、そして、それらは共に20a略逆位相である。従って、中国地方で発生した多くの地震の痕跡は、図2の対角線上の南西から北東方向と、図3、図4の線形なトレンド線11に沿って振動している。従って、もし、14aと17aの振幅値が共に正で20aが負の場合、地震の痕跡は、浅い北東領域にあることになる。しかし、それら振動には、2つの例外が、地震10eと10fに関連して観測される。2つとも、地震の痕跡が南東から北西方向に変えた箇所である。1番目は、14aと17aの逆位相、17aと20aの同位相、20aと14aも同位相への変化で、それらは地震10eの、略1年前に生じているから、予兆変化である。2番目は、14aと17aの逆位相への変化に関しては、地震10fの発生後に起きているが、17aと20a、そして20aと14aの同位相への変化で、これらは、地震10fの発生3ヶ月前に生じているので予兆変化と見なせる。
First, the
次に、予兆静穏が、その様な繰り返し振動に現れる異常である事を示す。23a、20a振動は、予兆的静穏を除くと略同位相である。この同位相の振動は、20aの振幅値が大きくなれば(DEPが深くなれば)23aも大きくなる(INTが長くなる)事を意味する。従って、これら同位相の振動は、震源の深い地震のINTは長くなり、逆に震源の浅い地震のINTは、短くなる傾向にある通常の地震活動を表している。しかし、大地震を起こすような作用が地震発生地帯に働くと、位相が逆転して予兆的静穏、40b、40c、40d、40e、40f、40gが観測される。 Next, it is shown that predictive calm is an abnormality that appears in such repeated vibration. The 23a and 20a vibrations have substantially the same phase except for the sign of quiet. This in-phase vibration means that as the amplitude value of 20a increases (DEP increases), 23a also increases (INT increases). Therefore, these in-phase oscillations indicate normal seismic activity in which the INT of deep-source earthquakes tends to be longer and the INT of shallow-source earthquakes tends to be shorter. However, when an action that causes a large earthquake is applied to the zone where the earthquake occurs, the phases are reversed and predictive tranquilities, 40b, 40c, 40d, 40e, 40f, and 40g, are observed.
更に、振動26aと20aも、余震と阪神・淡路大震災数年前のイベント数が500〜700の区間を除けば、略同位相である。この同位相振動は、DEPが深くなれば、MAGも大きくなる方向に向かう通常の地震活動状況を反映している。しかし、図11にも拡大表示されているように、イベント数が512(1989年12月)頃始まり、719(1993年8月)頃終了した逆位相は、DEPが30kmより浅くなればMAGが3.9より大きくなる。14aと17aのおける振動情報より、それら逆位相の振動は、北東領域における地殻の柔らかい層から硬い層への遷移領域(D-B層)に大きなストレスが徐々に蓄積され、臨界状態に到達する過程である事を示唆している。従って、それら振動は、阪神・淡路大震災の予兆である。継続した逆位相の振動数は、ストレス蓄積の量に比例すると見なせるので、その振動数は、MAGを推測する指標にすることができる。
Furthermore, the
図11において、選択した中国地方という広い領域内に発生した阪神・淡路大震災を取り上げ、予兆静穏を観測後、如何にして阪神・淡路大震災の発生時刻、震源、MAGの大きさを予知するかを説明する。図11は、図5と図10において、イベント数、m、が480から800(1989/06/26から1995/01/17)までの範囲を取り出し重ね合わせて図示したものである。ただし、最下段のMAG行には、予兆静穏を明確に表示するために、振動26a、20a、に加え振動23aを重ね合わせてある。まず、予兆静穏を如何にして検出し、その後地震の発生時刻をイベント数で予知する手法について説明する。
In Fig. 11, we pick up the Great Hanshin-Awaji Earthquake that occurred in a wide area of the selected Chugoku region, observe the sign of calm, and predict how the time, epicenter, and size of MAG of the Great Hanshin-Awaji Earthquake would be predicted. explain. FIG. 11 is a diagram in which the number of events, m, in the range of 480 to 800 (1989/06/26 to 1995/01/17) is extracted and superimposed in FIGS. 5 and 10. However, on the lowermost MAG line,
この期間の中国地方の地震現象から、振幅位相比較検出手段8によって予兆静穏を検出すると次のようになる。INT行もしくはMAG行に表示されている23aが負のピーク付近で(m=700、1993/03/29)、静穏の原因であるかもしれない作用が地震発生地帯に働き、INTを遅延させ始めている。23aがゆっくりとその負のピークから基準箇所の23b(ゼロ)に戻りはじめ、それまで同位相状態にあった23aと20aの周期振動の位相が変化する。これが、イベント数(m)が783の時に発生した阪神・淡路大震災から2年ほど遡った中国地方の地震活動に出現した予兆静穏で、その出現箇所は、CIm(60)である40の第2段階の静穏中にある最初の急な鋭いピークの始まりの箇所(m=710)に相当する。 From the earthquake phenomena in the Chugoku region during this period, the amplitude and phase comparison and detection means 8 detects the sign of calm as follows. 23a displayed in the INT line or MAG line is near the negative peak (m = 700, March 29, 1993), and an effect that may be the cause of calm works in the earthquake-prone area and starts delaying INT. I have. 23a slowly returns from its negative peak to 23b (zero) at the reference point, and the phase of the periodic vibration of 23a and 20a, which had been in the same phase until then, changes. This is the calm sign that appeared in seismic activity in the Chugoku region about two years after the Great Hanshin-Awaji Earthquake that occurred when the number of events (m) was 783, and the place of appearance was CIm (60), the second of 40 Corresponds to the beginning of the first steep sharp peak (m = 710) during the calm of the stage.
位相遅れが明確になるのは、1993年10月頃(m = 725 〜 730)である。更に23aと20aの位相反転(23aの谷と20aの山がm = 745 〜 749にある)が観察されるのは、1994/06/06から1994/09/03(m = 743 〜 757)である。更に、その直後のm = 759 (1994/10/14)が40のプロファイルに示される第2段階の2番目の鋭い増加40dに対応している。この位相反転時、要素MAGの振動26aは、少し変動しているが略負の振幅値を持ち、DEPの20aと略同位相となっている。ステップ8によって、これら振幅、位相関係を検出し、観測された阪神・淡路大震災の予兆的静穏は、地震のINTが長くなる事を示す正の振幅値の23aと、地震のDEPは浅くなる事を示す負の振幅値の20aと、地震活動は静穏状態であるが、略MAG=3.5の大きさを持った地震の地震活動が活発になる事を示す負の振幅値の26aである。そして、この予兆静穏は、図9における40プロファイルの第2段階の予兆静穏を確実に抽出している。このようにして抽出した阪神・淡路大震災の予兆的静穏の推移は、阪神・淡路大震災前に出現した地下水の化学物質の含有量(塩化物の含有量)の予兆変化の推移と非常によく一致する。阪神・淡路大震災直後、在庫ペットボトルのミネラルウォータ中の塩化物含有量を製造年月日順序に解析した論文報告によると、ペットボトルの塩化物の含有量は、1993年9月まで変化が無く安定していた。しかし、約3ヶ月を周期とする振動が1993年11月に始まった。(ステップ8で、最初に明らかな予兆的位相変化の兆候を観測したのは、1993年10月である。)1994年8月の始め、その振動はその周期を変え5ヶ月前に到達した高さのレベルに到達した。それから、そのレベルは新たなピークに到達し、そしてまだ振動し続けた。定常的な塩化物の含有量の上昇が、最終的に確立したのは、1994年の10月か11月である。
The phase delay becomes apparent around October 1993 (m = 725 to 730). Further, the phase inversion of 23a and 20a (the valley of 23a and the peak of 20a are at m = 745 to 749) are observed from June 06, 1994 to September 3, 1994 (m = 743 to 757). is there. Furthermore, the immediately following m = 759 (October 14, 1994) corresponds to the second
予兆静穏を抽出後、予知される阪神・淡路大震災の発生時刻は、CIm(60)プロファイル40の第3段階で予兆静穏が終了する時点で、それは、振動23aが略30イベント後に反転する負の振動23aのピーク付近である。負の振動23aのピークは、INTが短くなった事を示す。従って、予兆的静穏を確立した正の振動23aピークがm=745にあるので、30イベントを加え、阪神・淡路大震災の発生時刻(m=788)をイベント数m=775付近であると予知できる。実際には、23aの振動周期は、静穏により、m=745に観測される正の振動23aピーク時とその直前の負のピークから読み取った半周期が、43イベントと長くなっているので、遅くとも、m=788に、阪神・淡路大震災が発生すると予知できる。このような予知が出来る時期は、この予兆的静穏を確認できる時点、つまり静穏ピーク検出から少しばかり後のm=756(1994/08/22)で、それは、地震発生の略5ヶ月前である。イベント数を用いた地震発生時刻の予知は、23aの振動周期が時計の時間ベースの機能を果たすので正確である。
After the predictive calm is extracted, the predicted occurrence time of the Great Hanshin-Awaji Earthquake is the time when the predictive calm ends at the third stage of the CIm (60)
次に、その震源の予知方法について説明する。図11における、14aと17aとが、イベント数m=480−800の範囲で略同位相、17aと20a、20aと14aとが共に逆位相であるであることは、大部分の地震の痕跡が、略、図2上で、南西から北東の方向に、そして、2つの大陸プレート間を、図3と図4の線形ライン11に沿って、地理的な基準点 (34度N、133.75度E、30km)の周りを振動している事を示している。しかしながら、予兆静穏の期間(m=725-760)になると、14aと17aの符合は正を保ち、20aは略負を保つ。このことは、大部分の地震の震源が、地理的な原点から、北東方向の浅い領域(神戸地方)に向かっている。
Next, a method of predicting the epicenter will be described. In FIG. 11, 14a and 17a are almost in phase in the range of the number of events m = 480-800, and 17a and 20a, and both 20a and 14a are in opposite phase. , Approximately in FIG. 2, in the direction from southwest to northeast, and between the two continental plates, along the
また、その振動の原点は、ステップ3で20個の移動平均して得られた地震要素時系列変動、13a、16a、19a、の線形成分と共に、神戸方向にゆっくりと移動している。阪神・淡路大震災の発生が予知されるイベント数のm=775から788付近まで、加速度に相当する各二次差分である14a、17a、20aの周期振動において、その振動符号が変化しないので、その13a、16a、19aの移動傾向は変化せず、線形性を保つと仮定し、図11における各矢印42a、42b、42cを、予知された地震発生の時刻の中間値m=782まで延長すると、矢印が示すLAT、LON、DEPの読取り値が予知震源の中間値となる。その読み取り値は、北緯34.5度、東経135度、震源の深さが16kmとなり、阪神・淡路大震災の実際の震源、北緯34.70度、東経135.08度、深さ16.08kmときわめて近い。図11において、その実際の震源と予知値との誤差は、12a、15a、18aが、阪神・淡路大震災の一つ前の地震から太い線に変わるように表示されているので、太い線の終端と、各矢印42a、42b、42cの先端との差となる。従って、予知震源と実際の震源の誤差が殆ど無いことがわかる。
In addition, the origin of the vibration is slowly moving in the Kobe direction along with the linear components of the seismic element time-
この地震予知方法を、地震のマグニチュードがCIm(k)のプロファイルの大きさや、20aと26aの間で阪神・淡路大震災数年前から観測されている位相反転振動の回数にかかわらず、抽出した6つの予兆静穏(40bから40gまで)に適用した予知実施例の震源と時刻を全て(LAT、LON、DEP、m)の書式で表示した結果を次にまとめる。なお、予兆静穏40fと40g後の地震の震源予知が少し悪いが、おおむね良い。発生時刻に関しては、全て良い。予兆静穏40g後マグニチュード7.3の地震10fの震源予知でLAT予知が1.6度南方に、又DEPが30kmとなる理由は、この地震が、水に関連した低周波地震の発生に関連していることが論文報告されている。その様な低周波地震の震源分布は、緯度(LAT)が南下した箇所で深さ30km付近にある事から、震源予知は必ずしも悪いと言えない。
This earthquake prediction method was extracted regardless of the magnitude of the earthquake, regardless of the size of the CIm (k) profile and the number of phase-reversal oscillations observed between 20a and 26a several years before the Great Hanshin-Awaji Earthquake. The following summarizes the results of displaying the hypocenters and times of the prediction example applied to the two signs of calm (from 40b to 40g) in the format of (LAT, LON, DEP, m). Although the prediction of the hypocenter of the earthquake after 40f and 40g is slightly bad, it is generally good. As for the occurrence time, everything is good. The reason why the LAT prediction is 1.6 degrees south and the DEP is 30 km in the source prediction of the earthquake 7.3
マグニチュード6.0で1985/05/13の地震10c(33.00度、132.59度、38.08km、230)に対し、予兆静穏40b(m=196に抽出)で予知震源と時刻は(33.6度、133.6度、34km、226−229)。 For a magnitude 6.0 earthquake of 10/13/1985/13/13 (33.00 degrees, 132.59 degrees, 38.08 km, 230), the predictable epicenter and time were (33.6 degrees, 133.6 degrees, 34 km) at a sign of quiet 40b (extracted to m = 196). 226-229).
マグニチュード5.1で1988/07/29の地震(33.68度、132.51度、53.01km、428)に対し、予兆静穏40c(m=396に抽出)で予知震源と時刻は(33.7度、132.7度、46.4km、423−426)。 For a magnitude 5.1 earthquake of 1988/07/29 earthquake (33.68 degrees, 132.51 degrees, 53.01 km, 428), the predictable hypocenter and time were (33.7 degrees, 132.7 degrees, 46.4 km) at a sign of quiet 40c (extracted to m = 396). , 423-426).
マグニチュード7.2で1995/01/17の阪神・淡路大震災10d(34.70度、135.08度、16.06km、783)に対し、予兆静穏40d(m=745に抽出)で予知震源と時刻は(34.5度、135度、16km、775−788)。 The magnitude and magnitude of 10d (34.70 degrees, 135.08 degrees, 16.06 km, 783) of the 1917 Great Hanshin-Awaji Earthquake on January 17, 1995, and the predicted hypocenter and time were (34.5 degrees, 135 Degrees, 16km, 775-788).
マグニチュード6.3で1997/06/25の地震10e(34.48度、131.69度、8.29km、1089)に対し、予兆静穏40c(m=1066に抽出)で予知震源と時刻は(34度、132.5度、30km、1088−1096)。 For a magnitude 6.3 earthquake of 10/06/1997/06/25 (34.48 degrees, 131.69 degrees, 8.29 km, 1089), a predictive quake source and time are (34 degrees, 132.5 degrees, 30 km) at a sign of quiet 40c (extracted to m = 1066). , 1088-1096).
マグニチュード4.9で1999/03/16の地震(35.31度、135.96度、12.08km、1227)に対し、予兆静穏40c(m=1204に抽出)で予知震源と時刻は(34.3度、133度、35.5km、1226−1234)。 For an earthquake of magnitude 4.9 on March 16, 1999 (35.31 degrees, 135.96 degrees, 12.08 km, 1227), the predicted epicenter and time were (34.3 degrees, 133 degrees, 35.5 km) at a sign of quiet 40c (extracted to m = 1204). , 1226-1234).
マグニチュード7.3で2000/10/06の地震10f(35.35度、133.50度、11.26km、1350)に対し、予兆静穏40g(m=1324に抽出)で予知震源と時刻は(33.7度、133.5度、30km、1350−1354)。
For 10f (35.35 degrees, 133.50 degrees, 11.26 km, 1350) of
1 地震震源・発震機構情報源
2 地震要素信号化手段
3 地震要素の時系列化手段
4 一次微分出力手段
5 二次微分出力手段
6 フィルタ出力手段
7 時間間隔累積検出手段
8 振幅位相比較検出手段
9 予知手段
DESCRIPTION OF
Claims (16)
前記地震要素信号化ステップにより抽出されたDcjを、地震の発生順序j(j=1、2、3、・・、m、・・)に基づいて、直接、もしくは、所定の選択処理または平滑化処理を施し、Dc=(Dc1、Dc2、Dc3、・・、Dcm、・・)を得る地震要素の時系列化ステップと、
前記地震要素の時系列ステップで得られたDcの任意な地震発生順序mにおける任意間隔n(n=1,2,3、・・)の差、DcmとDcm−nとの差に比例する量を一次差分値ΔDcm,nとして求める一次微分出力ステップと、
前記一次微分出力ステップから出力された時系列値ΔDcm,nの任意間隔k(k=1、2、・・)での差、即ちΔDcm,nとΔDcm−k,nとの差に比例する量を任意な地震発生順序mでの二次差分値Δ2Dcm,n,kとして求める二次微分出力ステップと、
前記二次微分出力ステップで得られた二次差分値Δ2Dcm,n,kの振幅と位相とを異なる要素間で比較検出し、各要素間の振幅関係と位相関係と地震要素の時系列を出力する振幅位相比較検出ステップと、
を備えた地震の予知方法。 A predetermined earthquake is extracted from the earthquakes that occurred in the target area, and from the source information of the earthquakes and the information of the focal mechanism solution, the parameter representing each element of the earthquake information is set as c, and the seismic phenomenon in the selected area is determined. A seismic element signalizing step of quantifying earthquake information on each element c of the extracted j-th earthquake as Dcj in order to represent and observe the time series data of each element c;
The Dcj extracted in the seismic element signalizing step is directly or predetermined selected or smoothed based on the earthquake occurrence order j (j = 1, 2, 3,..., M,...). Performing a process to obtain a sequence of seismic elements to obtain Dc = (Dc1, Dc2, Dc3,..., Dcm,...);
An amount proportional to the difference between the arbitrary intervals n (n = 1, 2, 3,...) And the difference between Dcm and Dcm-n in the arbitrary earthquake occurrence order m of Dc obtained in the time series step of the earthquake element. As a primary difference value ΔDcm, n,
The amount of the time series value ΔDcm, n output from the primary differential output step at an arbitrary interval k (k = 1, 2,...), That is, an amount proportional to the difference between ΔDcm, n and ΔDcm−k, n As a secondary difference value Δ 2 Dcm, n, k in an arbitrary earthquake occurrence order m;
The amplitude and phase of the secondary difference value Δ 2 Dcm, n, k obtained in the secondary differential output step are compared and detected between different elements, and the amplitude relation and phase relation between each element and the time series of earthquake elements Amplitude phase comparison detection step of outputting
Earthquake prediction method equipped with.
前記地震の各要素間の振幅位相比較検出ステップにより検出された、各要素間の振幅関係と位相関係と地震要素の時系列とから、地震の発生時刻と震源と地震のマグニチュードを予知するステップを備えてなる地震の予知方法。 The method for predicting an earthquake according to claim 1,
The step of predicting the time of occurrence of the earthquake, the epicenter and the magnitude of the earthquake, from the amplitude relationship and the phase relationship between the elements and the time series of the earthquake element, detected by the amplitude phase comparison detection step between the elements of the earthquake. Prepared earthquake prediction method.
地震要素の時系列化ステップにより得られた地震要素の時系列を地震の各要素c毎にバンドパスフィルターで濾過し任意な地震発生順序mでFcmを得て前記振幅位相比較検出ステップへ出力するフィルタ出力手段を備えてなる地震の予知装置。 The method for predicting an earthquake according to any one of claims 1 to 4,
The time series of the seismic elements obtained in the seismic element time series forming step is filtered by a band-pass filter for each element c of the earthquake, Fcm is obtained in an arbitrary earthquake occurrence order m, and output to the amplitude phase comparison detecting step. An earthquake prediction device comprising a filter output means.
前記地震要素信号化手段により抽出されたDcjを、地震の発生順序j(j=1、2、3、・・、m、・・)に基づいて、直接、もしくは所定の選択化処理または平滑化処理を施し、Dc=(Dc1、Dc2、Dc3、・・、Dcm、・・)を得る地震要素の時系列化手段と、
前記地震要素の時系列手段で得られたDcの任意な地震発生順序mにおける任意間隔n(n=1,2,3、・・)の差、DcmとDcm−nとの差に比例する量を一次差分値ΔDcm,nとして求める一次微分出力手段と、
前記一次微分出力手段から出力された時系列値ΔDcm,nの任意間隔k(k=1、2、・・)での差、即ちΔDcm,nとΔDcm−k,nとの差に比例する量を任意な地震発生順序mでの二次差分値Δ2Dcm,n,kとして求める二次微分出力手段と、
前記二次微分出力ステップで得られた二次差分値Δ2Dcm,n,kの振幅と位相とを異なる要素間で比較検出し、各要素間の振幅関係と位相関係と地震要素の時系列を出力する振幅位相比較検出手段とを備えた地震の予知装置。 A predetermined earthquake is extracted from the earthquakes that occurred in the target area, and from the source information of the earthquakes and the information of the focal mechanism solution, the parameter representing each element of the earthquake information is set as c, and the seismic phenomenon in the selected area is determined. A seismic element signal converting means for quantifying the seismic information on each element c of the extracted j-th earthquake as Dcj in order to represent and observe the time series data of each element c;
The Dcj extracted by the seismic element signal generator is directly or predetermined selected or smoothed based on the order of occurrence j of the earthquakes (j = 1, 2, 3,..., M,...). Means for performing a process and obtaining a time series of seismic elements to obtain Dc = (Dc1, Dc2, Dc3,..., Dcm,.
An amount proportional to the difference between arbitrary intervals n (n = 1, 2, 3,...) In the arbitrary earthquake occurrence order m of Dc obtained by the time series means of the earthquake element, and the difference between Dcm and Dcm-n As a primary difference value ΔDcm, n,
The amount of the time series value ΔDcm, n output from the primary differential output means at an arbitrary interval k (k = 1, 2,...), That is, an amount proportional to the difference between ΔDcm, n and ΔDcm−k, n As a secondary difference value Δ 2 Dcm, n, k in an arbitrary earthquake occurrence order m;
The amplitude and phase of the secondary difference value Δ 2 Dcm, n, k obtained in the secondary differential output step are compared and detected between different elements, and the amplitude relation and phase relation between each element and the time series of earthquake elements An earthquake prediction device comprising: an amplitude / phase comparison / detection unit that outputs a signal.
前記地震要素の時系列化手段により得られた地震要素の時系列を地震の各要素c毎にバンドパスフィルターで濾過し任意な地震発生順序mでFcmを得て前記請求項1の振幅位相比較検出手段へ出力するフィルタ出力手段を備えてなる地震の予知装置。 The earthquake prediction device according to any one of claims 6 to 9,
2. The amplitude-phase comparison according to claim 1, wherein the time series of the seismic elements obtained by the means for serializing the seismic elements is filtered by a band-pass filter for each element c of the earthquake to obtain Fcm in an arbitrary order m of occurrence of the earthquake. An earthquake prediction device comprising a filter output means for outputting to a detection means.
前記地震要素信号化ステップにより抽出されたDcjを、地震の発生順序j(j=1、2、3、・・、m、・・)に基づいて、直接、もしくは所定の選択処理または平滑処理を施し、Dc=(Dc1、Dc2、Dc3、・・、Dcm、・・)を得る地震要素の時系列化ステップと、
前記地震要素の時系列ステップで得られたDcの任意な地震発生順序mにおける任意間隔n(n=1,2,3、・・)の差、DcmとDcm−nとの差に比例する量を一次差分値ΔDcm,nとして求める一次微分出力ステップと、
前記一次微分出力ステップから出力された時系列値ΔDcm,nの任意間隔k(k=1、2、・・)での差、即ちΔDcm,nとΔDcm−k,nとの差に比例する量を任意な地震発生順序mでの二次差分値Δ2Dcm,n,kとして求める二次微分出力ステップと、
前記二次微分出力ステップで得られた二次差分値Δ2Dcm,n,kの振幅と位相とを異なる要素間で比較検出し、各要素間の振幅関係と位相関係と地震要素の時系列を出力する振幅位相比較検出ステップとを備えた地震の予知プログラム。 A predetermined earthquake is extracted from the earthquakes that occurred in the target area, and from the source information of the earthquakes and the information of the focal mechanism solution, the parameter representing each element of the earthquake information is set as c, and the seismic phenomenon in the selected area is determined. A seismic element signalizing step of quantifying earthquake information on each element c of the extracted j-th earthquake as Dcj in order to represent and observe the time series data of each element c;
The Dcj extracted in the seismic element signalizing step is subjected to direct or predetermined selection processing or smoothing processing based on an earthquake occurrence order j (j = 1, 2, 3,..., M,...). Applying a seismic element time series to obtain Dc = (Dc1, Dc2, Dc3,..., Dcm,.
An amount proportional to the difference between the arbitrary intervals n (n = 1, 2, 3,...) And the difference between Dcm and Dcm-n in the arbitrary earthquake occurrence order m of Dc obtained in the time series step of the earthquake element. As a primary difference value ΔDcm, n,
The amount of the time series value ΔDcm, n output from the primary differential output step at an arbitrary interval k (k = 1, 2,...), That is, an amount proportional to the difference between ΔDcm, n and ΔDcm−k, n As a secondary difference value Δ 2 Dcm, n, k in an arbitrary earthquake occurrence order m;
The amplitude and phase of the secondary difference value Δ 2 Dcm, n, k obtained in the secondary differential output step are compared and detected between different elements, and the amplitude relation and phase relation between each element and the time series of earthquake elements And an amplitude / phase comparison / detection step of outputting a signal.
前記地震の各要素間の振幅位相比較検出ステップにより検出された、各要素間の振幅関係と位相関係と地震要素の時系列とから、地震の発生時刻と震源と地震のマグニチュードを予知するステップを備えてなる地震の予知プログラム。 In the earthquake prediction program according to claim 11,
The step of predicting the time of occurrence of the earthquake, the epicenter and the magnitude of the earthquake, from the amplitude relationship and the phase relationship between the elements and the time series of the earthquake element, detected by the amplitude phase comparison detection step between the elements of the earthquake. Prepared earthquake prediction program.
を備えてなる地震の予知プログラム。 In the earthquake prediction program according to claim 11 or 12, the number of occurrences of an arbitrary earthquake is set to a (a = 1, 2,...) And extracted by the earthquake element signalizing step and the time series forming step. An earthquake prediction program comprising: a time interval accumulation detection step of accumulating a number of time intervals separated by one from each other to an arbitrary order m of occurrence of an earthquake to obtain CIm (a).
を備えてなる地震の予知プログラム。 The earthquake prediction program according to any one of claims 11 to 13, wherein an arbitrary number of earthquakes is a (a = 1, 2, ...), and an m-th earthquake and an (ma) -th earthquake. An earthquake prediction program comprising: a time interval accumulation detection step in which a difference between occurrence times is set to CIm (a).
地震要素の時系列化ステップにより得られた地震要素の時系列を地震の各要素c毎にバンドパスフィルターで濾過し任意な地震発生順序mでFcmを得て前記振幅位相比較検出ステップへ出力するフィルタ出力手段を備えてなる地震の予知プログラム。 In the earthquake prediction program according to claim 11 or claim 14,
The time series of the seismic elements obtained in the seismic element time series forming step is filtered by a band-pass filter for each element c of the earthquake, Fcm is obtained in an arbitrary earthquake occurrence order m, and output to the amplitude phase comparison detecting step. Earthquake prediction program with filter output means.
Priority Applications (1)
| Application Number | Priority Date | Filing Date | Title |
|---|---|---|---|
| JP2004009928A JP4608643B2 (en) | 2003-01-17 | 2004-01-19 | Earthquake prediction method, earthquake prediction system, earthquake prediction program, and recording medium |
Applications Claiming Priority (2)
| Application Number | Priority Date | Filing Date | Title |
|---|---|---|---|
| JP2003010045 | 2003-01-17 | ||
| JP2004009928A JP4608643B2 (en) | 2003-01-17 | 2004-01-19 | Earthquake prediction method, earthquake prediction system, earthquake prediction program, and recording medium |
Publications (2)
| Publication Number | Publication Date |
|---|---|
| JP2004239901A true JP2004239901A (en) | 2004-08-26 |
| JP4608643B2 JP4608643B2 (en) | 2011-01-12 |
Family
ID=32964841
Family Applications (1)
| Application Number | Title | Priority Date | Filing Date |
|---|---|---|---|
| JP2004009928A Expired - Lifetime JP4608643B2 (en) | 2003-01-17 | 2004-01-19 | Earthquake prediction method, earthquake prediction system, earthquake prediction program, and recording medium |
Country Status (1)
| Country | Link |
|---|---|
| JP (1) | JP4608643B2 (en) |
Cited By (8)
| Publication number | Priority date | Publication date | Assignee | Title |
|---|---|---|---|---|
| JP4867016B2 (en) * | 2005-03-29 | 2012-02-01 | 国立大学法人電気通信大学 | Earthquake prediction system, earthquake prediction method, earthquake prediction program, and recording medium recording earthquake prediction program |
| JP2014066660A (en) * | 2012-09-27 | 2014-04-17 | Nippon Telegr & Teleph Corp <Ntt> | Earthquake prediction system, aggregation device, analyzer, distribution device, earthquake prediction method, and program |
| JP2014092454A (en) * | 2012-11-02 | 2014-05-19 | Takeda Engineering Consultant:Kk | Prediction method, prediction apparatus, prediction program and recording medium for large earthquake and giant earthquake |
| WO2014184928A1 (en) * | 2013-05-16 | 2014-11-20 | 株式会社日立製作所 | Detection device, detection method, and recording medium |
| JP6397972B1 (en) * | 2017-08-09 | 2018-09-26 | 公立大学法人兵庫県立大学 | Earthquake prediction device, earthquake prediction map creation device, earthquake prediction method, earthquake prediction map creation method, and program |
| CN111382908A (en) * | 2020-03-11 | 2020-07-07 | 中国地震局地球物理研究所 | Earthquake random event set simulation method considering large earthquake time correlation |
| CN113589381A (en) * | 2021-08-09 | 2021-11-02 | 成都理工大学 | Phase and reflection coefficient simultaneous inversion method based on compressed sensing |
| CN115327620A (en) * | 2021-05-11 | 2022-11-11 | 中国石油化工股份有限公司 | Microseism joint time difference stacking positioning method |
Families Citing this family (1)
| Publication number | Priority date | Publication date | Assignee | Title |
|---|---|---|---|---|
| JP6666023B2 (en) * | 2015-07-02 | 2020-03-13 | 東京瓦斯株式会社 | Seismic sensor and earthquake judgment method |
Citations (1)
| Publication number | Priority date | Publication date | Assignee | Title |
|---|---|---|---|---|
| JP2787143B2 (en) * | 1992-09-10 | 1998-08-13 | 株式会社武田エンジニアリング・コンサルタント | Motion change detection device |
-
2004
- 2004-01-19 JP JP2004009928A patent/JP4608643B2/en not_active Expired - Lifetime
Patent Citations (1)
| Publication number | Priority date | Publication date | Assignee | Title |
|---|---|---|---|---|
| JP2787143B2 (en) * | 1992-09-10 | 1998-08-13 | 株式会社武田エンジニアリング・コンサルタント | Motion change detection device |
Non-Patent Citations (1)
| Title |
|---|
| JPN6009043588, 武田文秀, "地震属性の時系列における予兆的な地震活動の静穏さとその短期地震予知への応用", (社)日本地震学会 2002年度秋季大会 講演予稿集, 20021101, P.47 * |
Cited By (10)
| Publication number | Priority date | Publication date | Assignee | Title |
|---|---|---|---|---|
| JP4867016B2 (en) * | 2005-03-29 | 2012-02-01 | 国立大学法人電気通信大学 | Earthquake prediction system, earthquake prediction method, earthquake prediction program, and recording medium recording earthquake prediction program |
| JP2014066660A (en) * | 2012-09-27 | 2014-04-17 | Nippon Telegr & Teleph Corp <Ntt> | Earthquake prediction system, aggregation device, analyzer, distribution device, earthquake prediction method, and program |
| JP2014092454A (en) * | 2012-11-02 | 2014-05-19 | Takeda Engineering Consultant:Kk | Prediction method, prediction apparatus, prediction program and recording medium for large earthquake and giant earthquake |
| WO2014184928A1 (en) * | 2013-05-16 | 2014-11-20 | 株式会社日立製作所 | Detection device, detection method, and recording medium |
| GB2528792A (en) * | 2013-05-16 | 2016-02-03 | Hitachi Ltd | Detection device, detection method, and recording medium |
| JP6397972B1 (en) * | 2017-08-09 | 2018-09-26 | 公立大学法人兵庫県立大学 | Earthquake prediction device, earthquake prediction map creation device, earthquake prediction method, earthquake prediction map creation method, and program |
| CN111382908A (en) * | 2020-03-11 | 2020-07-07 | 中国地震局地球物理研究所 | Earthquake random event set simulation method considering large earthquake time correlation |
| CN111382908B (en) * | 2020-03-11 | 2023-08-22 | 中国地震局地球物理研究所 | Earthquake random event set simulation method considering correlation of large earthquake time |
| CN115327620A (en) * | 2021-05-11 | 2022-11-11 | 中国石油化工股份有限公司 | Microseism joint time difference stacking positioning method |
| CN113589381A (en) * | 2021-08-09 | 2021-11-02 | 成都理工大学 | Phase and reflection coefficient simultaneous inversion method based on compressed sensing |
Also Published As
| Publication number | Publication date |
|---|---|
| JP4608643B2 (en) | 2011-01-12 |
Similar Documents
| Publication | Publication Date | Title |
|---|---|---|
| Gischig et al. | Numerical investigation of seismically induced rock mass fatigue as a mechanism contributing to the progressive failure of deep-seated landslides | |
| Lévy et al. | Dynamic response of the Chamousset rock column (Western Alps, France) | |
| Akinci et al. | Effect of time dependence on probabilistic seismic-hazard maps and deaggregation for the Central Apennines, Italy | |
| Uchida et al. | A decade of lessons learned from the 2011 Tohoku‐Oki earthquake | |
| Odbert et al. | Chapter 2 Cyclic phenomena at the Soufrière Hills Volcano, Montserrat | |
| Tormann et al. | Size distribution of Parkfield's microearthquakes reflects changes in surface creep rate | |
| CN103176221A (en) | Mineralizing abnormal feature identification method based on different geological unit background values and contrast values | |
| Diehl et al. | Earthquakes in Switzerland and surrounding regions during 2015 and 2016 | |
| Zollo et al. | Space and time behavior of seismic activity at Mt. Vesuvius volcano, southern Italy | |
| JP4608643B2 (en) | Earthquake prediction method, earthquake prediction system, earthquake prediction program, and recording medium | |
| Tasan et al. | Testing probabilistic seismic hazard estimates against accelerometric data in two countries: France and Turkey | |
| EP0666990B1 (en) | Method of monitoring deformation of geological structures and predicting geodynamic events | |
| Trofymchuk et al. | Ukraine’s Cultural Heritage Objects Within Landslide Hazardous Sites | |
| JP5798545B2 (en) | Prediction method, prediction device, prediction program and recording medium for large earthquakes and large earthquakes | |
| WO2021205218A1 (en) | Methods and systems for earthquake detection and prediction | |
| Payre et al. | Analysis of the passive seismic monitoring performance at the Rousse CO2 storage demonstration pilot | |
| Chelidze et al. | Real time monitoring for analysis of dam stability: Potential of nonlinear elasticity and nonlinear dynamics approaches | |
| Bentz et al. | Analysis of microseismicity framing ML> 2.5 earthquakes at the Geysers geothermal field, California | |
| Pastén et al. | Multifractal time evolution for intraplate earthquakes recorded in southern Norway during 1980–2021 | |
| Nikolopoulos et al. | Traces of long-memory in pre-seismic MHz electromagnetic time series-Part1: Investigation through the R/S analysis and time-evolving spectral fractals | |
| Halldorsson et al. | ICEARRAY II: A new multidisciplinary strong-motion array in North Iceland | |
| Ritsema et al. | The 2011 tohoku earthquake | |
| Bevilacqua et al. | Data analysis of the unsteadily accelerating GPS and seismic records at Campi Flegrei caldera from 2000 to 2020 | |
| Tripaldi et al. | Space-time analysis of informational properties of GPS time series recorded at the Campi Flegrei caldera (Italy) | |
| Sborshchikovi et al. | The Analysis of Dynamical Changes and Local Seismic Activity of the Enguri Arch Dam |
Legal Events
| Date | Code | Title | Description |
|---|---|---|---|
| A621 | Written request for application examination |
Free format text: JAPANESE INTERMEDIATE CODE: A621 Effective date: 20060810 |
|
| A131 | Notification of reasons for refusal |
Free format text: JAPANESE INTERMEDIATE CODE: A131 Effective date: 20090901 |
|
| A131 | Notification of reasons for refusal |
Free format text: JAPANESE INTERMEDIATE CODE: A131 Effective date: 20100105 |
|
| A521 | Request for written amendment filed |
Free format text: JAPANESE INTERMEDIATE CODE: A523 Effective date: 20100308 |
|
| A521 | Request for written amendment filed |
Free format text: JAPANESE INTERMEDIATE CODE: A523 Effective date: 20100319 |
|
| TRDD | Decision of grant or rejection written | ||
| A01 | Written decision to grant a patent or to grant a registration (utility model) |
Free format text: JAPANESE INTERMEDIATE CODE: A01 Effective date: 20100805 |
|
| A01 | Written decision to grant a patent or to grant a registration (utility model) |
Free format text: JAPANESE INTERMEDIATE CODE: A01 |
|
| A61 | First payment of annual fees (during grant procedure) |
Free format text: JAPANESE INTERMEDIATE CODE: A61 Effective date: 20100915 |
|
| FPAY | Renewal fee payment (event date is renewal date of database) |
Free format text: PAYMENT UNTIL: 20131022 Year of fee payment: 3 |
|
| R150 | Certificate of patent or registration of utility model |
Ref document number: 4608643 Country of ref document: JP Free format text: JAPANESE INTERMEDIATE CODE: R150 Free format text: JAPANESE INTERMEDIATE CODE: R150 |
|
| R250 | Receipt of annual fees |
Free format text: JAPANESE INTERMEDIATE CODE: R250 |
|
| R250 | Receipt of annual fees |
Free format text: JAPANESE INTERMEDIATE CODE: R250 |
|
| R250 | Receipt of annual fees |
Free format text: JAPANESE INTERMEDIATE CODE: R250 |
|
| R250 | Receipt of annual fees |
Free format text: JAPANESE INTERMEDIATE CODE: R250 |
|
| R250 | Receipt of annual fees |
Free format text: JAPANESE INTERMEDIATE CODE: R250 |
|
| EXPY | Cancellation because of completion of term |