【0001】
【発明の属する技術分野】
本発明は、大規模の蛋白質相互作用データを3次元に視覚化する技法に関するものである。
【0002】
【従来の技術】
最近、蛋白質体学技術が発達して蛋白質相互作用データが急激に大規模化している。このような大規模のデータは、相互作用する蛋白質を長く列挙するよりグラフ形態で見た方が理解するのにずっと役立つため、蛋白質相互作用ネットワークの視覚化に対する研究が進められてきた。しかし、蛋白質相互作用データを視覚化することはたやすくはない。その理由は、第一に、蛋白質相互作用データは視覚化された時、エッジ交差(edge crossing)が多い複雑な非平面グラフになるからである。第二に、複数個の連結コンポーネント(connected components)で構成された分離グラフ(disconnected graph)になる場合が多いからである。
【0003】
大部分の一般のグラフ作成道具(graph−drawing tools)は、変形されたフォースダイレクト(force−directed)レイアウトアルゴリズムを使用する。と言うのは、このアルゴリズムが融通性(flexibility)があり具現しやすく、ドロー結果も良好なためである。伝統的なフォースダイレクトレイアウトアルゴリズムは、ノードをランダムに配置することから始まり、最適化技法を通してそれらの位置を再調整して最小限のエネルギーを持ったレイアウトを探し出す。色々なフォースダイレクトレイアウトアルゴリズム間の主な差は、エネルギー函数及び最小化技法の選択にある。フォースダイレクトレイアウトアルゴリズムの例としては、カマダ及びカワイ(Kamada及びKawai(1989))によるものと、フルチターマン及びレインゴールド(Fruchterman及びReingold(1991))によるものとがある。前者は、2次元グラフを生成し、分離グラフを視覚化出来ない。多くのフォースダイレクトアルゴリズムの共通的な問題は、大規模グラフの処理が非常に遅いことである。これは、各反復ステップで全ての対のノード間のフォース(force)を計算しなければならないからである。
【0004】
また、リラクション(relaxation)アルゴリズムを基にして蛋白質相互作用を視覚化するジャバアプレットプログラムがムロワカ(Mrowka(2001))によって開発され、Y2H(Yeast Two−Hybrid、Uetz 等、2000)データでテストされた。このプログラムは全ての蛋白質相互作用データがHTMLソースのアプレットプログラムのパラメーターで提供されることを要求し、ウィンドウをキャプチャー(capturing)すること以外には視覚化されたグラフを保存(save)する方法がない。ウィンドウからキャプチャーされたイメージは、静的な(static)イメージであり、一般的に質が落ちる。また、このようなイメージは、以後にデータ変更を反映させた修正ができない。ノードを移動させることは出来るが、後で使用する為に特定蛋白質を含む連結コンポーネントを選択したり保存することも不可能である。
【0005】
この他に、蛋白質相互作用視覚化道具は、固有のアルゴリズムやプログラムを使用しいておらず、一般用途のドロー道具を使用する。例えば、PSIMAP(Park等,2001; Lappe等, 2001)は、蛋白質の構造的分類(Murzin等, 1995)を使用してY2HデータとDIPデータ(Xerarios等, 2001)を比較することによって蛋白質ファミリー間の相互作用を表わしたものであり、トムソーヤ(Tom Sawyer)ソフトウェア(http://www.tomsawyer.com/)によって作成した後、相当な手作業によって写像のエッジ交差を除去した。
【0006】
ワシントン大学のある研究チーム(Schwikowski等, 2000; Tucker等, 2001)は、AGD(http://www.mpi−sb.mpg.de/AGD/)という一般用途のドロー道具を使用してY2Hデータを視覚化した。AGDは、2次元グラフを生成し視覚化結果が比較的満足できる程度であるため、強力な道具であると言えるが、一般用途のドロー道具であるため蛋白質相互作用研究に必要な機能は提供出来ない。例えば、Y2Hデータを含む大部分の蛋白質相互作用データは、多数の連結コンポーネントで構成された分離グラフを生成し、このグラフは、2次元ドローでは除去されない多数のエッジ交差を持った非平面グラフであるとも言える。このようなグラフを分析する方法の一つは、特定蛋白質を含む個別的な連結コンポーネントやサブグラフに対して作業することである。また他の方法は、非平面グラフをエッジ交差が無い3次元グラフに視覚化することである。しかし、AGDは、この機能を提供できないため分析が難しい。
【0007】
一方、上記グラフ作成プログラムは、全てデータベースを問合せ(query)をした後、問合せ結果を直接視覚化できない問題がある。またこれらは、特定形式の入力データを要求するためユーザ(user)がデータ形式を変換しなければならない不便さがある。また、蛋白質相互作用データは時間によって変化するので、このような変更事項を視覚化して反映するのが便利であるが、従来のプログラムは、このような機能を提供することができない。
【0008】
要約すれば、従来のグラフドロー道具は、1) エッジ交差が多い混雑なグラフや修正が難しい静的グラフを描く。2) 多くのデータによるインタラクティブ(interactive)な作業をするのには時間がかかりすぎる。3) 蛋白質相互作用データベースから直接データを読み取ることができず、データが特定形式で入力された時にだけ視覚化が可能であるため、蛋白質相互作用を視覚化するのには適合しないという問題点があった。
【0009】
【発明が解決しようとする課題】
本発明は、上記問題点を解決するためのものであり、大規模の蛋白質相互作用ネットワークを3次元に視覚化する新しい技法を提供するためにものである。
【0010】
より詳細には、従来の他の視覚化アルゴリズムに比べて処理速度が速く、蛋白質相互作用の視覚化だけではなく、インタラクティブな分析にも使用でき、蛋白質相互作用データベースに対する問合せ結果を直接3次元空間に視覚化し、視覚化されたネットワークは、以後の修正またはナビゲート可能なシステムのための新しいフォースダイレクトアルゴリズムを提供することである。
【0011】
【課題を解決するための手段】
本発明は、大規模の蛋白質相互作用データの効率的視覚化技法に関するもので、蛋白質をノードとし、蛋白質間相互作用をエッジとする3次元グラフを描く。本発明は蛋白質相互作用データの全てのノードを極座標の水平及び垂直角度の両方を増加させることによって球体(sphere)表面に配置し、初期レイアウトを生成する第1段階と、上記初期レイアウトの各ノードを隣接ノードとのローカルスプリングフォース(local spring force)と非隣接ノードとのグローバルスプリングフォース(global spring force)の両方を考慮して平衡位置(equilibrium position)に移動させる過程を前もって決められた回数だけ反復してグラフを生成する第2段階とを含むことを特徴とする大規模蛋白質相互作用データの効率的視覚化技法を提供する。
【0012】
本発明は、上記第2段階の反復回数がユーザによって変更可能であり、上記蛋白質相互作用データが格納されているデータベースと連動して作動することをもう一つの特徴とする。
【0013】
また、ユーザ(user)が選択したノードに対する隣ノードとの距離レベルを一定距離までに制限することによって、上記グラフを簡略化する第3段階をさらに含むことを特徴とする。
【0014】
まず、本発明で使用される蛋白質相互作用データに対する用語と特性について詳しく見てみる。蛋白質相互作用データは、ノードが蛋白質を示し、エッジが蛋白質の相互作用を示すグラフに視覚化出来る。ノードの次数(degree)は、エッジの数であり、u=vの時、エッジ(u、v)は自己ループである。また、蛋白質相互作用データは次のような特性を持っている。
【0015】
1) グラフに視覚化した時、蛋白質相互作用データは多数の連結コンポーネントを持った分離グラフになる。例えば、MIPS遺伝的相互作用データ(http://mips.gsf.de/proj/yeast/tables/interaction/)は、100個以上の連結コンポーネントを含んでいる。
【0016】
2) 蛋白質相互作用データは、2次元グラフでは除去されない多数のエッジ交差を持った非平面グラフを産出する。
【0017】
3) 一つのデータ集合において蛋白質毎に非常に異なった数の相互作用する蛋白質を持っているため、これを視覚化したグラフは低い次数だけではなく非常に高い次数のノードも含むようになる。
【0018】
4) 蛋白質相互作用データは、ときおり自己ループに該当する蛋白質相互作用を含んでいる。
【0019】
5) 蛋白質相互作用データは、同一蛋白質対に対して複数の相互作用を含んでいる。
【0020】
本発明では、自己ループに該当する相互作用をデータベースのエッジテーブルに格納するが、ドロー過程を簡単にしてきれいなグラフを生成する為に視覚化ではこれを無視する。また、本来の蛋白質相互作用データベースが同一エッジに対する複数の項目を含んでいたなら、ローカルデータベースには一回だけ格納する。本発明によって視覚化される蛋白質相互作用ネットワークは、イメージ ファイル、ローカルデータベースまたはGML形式(Himsolt、1997)のテキストファイルに格納出来る。GML (Graph Modeling Language)はポータブル(portable)なグラフファイル形式であり、GMLでグラフを保存すると前に計算されたグラフを再びロードして再視覚化出来るという長所がある。
【0021】
従来のフォースダイレクトアルゴリズムの共通的な問題は、大容量のグラフ処理時に速度が非常に遅くなるということであり、本発明では、速度と視覚的鮮明度を大きく向上させられる新しいフォースダイレクトアルゴリズムを通した視覚化技法を提案する。本発明で提案する視覚化技法は、ワルシャウ(Walshaw(2000))のアルゴリズムを基礎として、問題点を改善したものである。
【0022】
本発明のレイアウトアルゴリズムは図1に簡略に記述されている。ワルシャウアルゴリズムの問題点の一つは、グラフが密集サブグラフ(非常に高い次数を持ったノードを含むサブグラフ)を含んでいる時に、願い求める結果を得られないことである。このアルゴリズムは、グラフの大きさがある臨界値(threshold value)以下に下がる時までノード位置を反復的に計算するため、全体的なレイアウトを改善出来ないままアルゴリズムを何回も不必要に反復する場合が発生する。したがって、本発明では、ワルシャウアルゴリズムとは異る終了条件を採用し、デフォルトで20回反復するようにした。20というデフォルト値は、比較実験を根拠に経験的に選択したもので、試用者がインターフェースを通じて反復回数を増加させられる(16行)。
【0023】
各反復ループで、隣接ノード間のローカルスプリングフォース(local spring force)だけではなく(10行)非隣接ノード間のグローバルスプリングフォース(global spring force)まで参照して(8行)ノード位置が更新される。
【0024】
図2は、隣接ノード間のローカルフォースによってノードvが再配置されることを図示した図である。図2aを詳しく見てみると、ノードvは3個のノードに連結されていて、3個の隣接ノードの一つuからのvに対するフォース(force)は、vをvとuの間のラインに沿って動くようにさせる。結果的には、図2bに図示したように、全ての隣接ノードによって生じた結合フォース(aggregate force)は、vを平衡位置(equilibrium position)に移動させる。
【0025】
次は、本発明で採用されている初期レイアウト方法について説明する。従来の一般的なフォースダイレクトグラフドローアルゴリズムは、2次元の平面や3次元空間にグラフの全てのノードをランダムに配置することから始まり、最適化技法を使用してこの初期レイアウトを継続的に修正して最少エネルギーを持ったレイアウトを求める。初期レイアウトにオーバーラップするノードや同一平面上のノードがある場合、それらを再配置する為に計算時間が増加することもある。それで、処理時間を短縮する為に、本発明では初期レイアウトのためにノードをランダムに配置しない。本発明は、極座標の水平及び 垂直角度を増加させることによって球体(sphere)表面にノードを配置する。この方法は、平面にノードを配置する回数を最小化する。図3は、473個のノードを持ったグラフの初期レイアウトの例を図示したものである。図4は、初期レイアウトのための簡略なアルゴリズムである。
【0026】
以下、本発明のアルゴリズムの計算費用(必要な時間)に対して詳しく見てみる。「n(ノードの数)=V」のグラフにおいて、初期レイアウトには時間O(n)だけが所要されアルゴリズムのグローバル時間には影響を及ぼさない。Tを外側ループの総反復数としよう(図1の2行)。ノード一つの移動Dを計算するには時間O(n)がかかるため、外側ループの各ステップで全てのノードの移動Dを計算するには時間O(n2)がかかる。ゆえに、総必要時間は、O(T・n2) = O(n2)である(Tは常数)。スプリング−エンベダー(spring−embedder)アルゴリズム(Kamada及び Kawai、1989)の時間複雑度のO(n3)に比べると、本発明はとても速い。
【0027】
本発明の視覚化技法を利用して具現されたドロー道具では、サブグラフを探して作業することが可能である。蛋白質相互作用ネットワークの大きさや特性上、(分離グラフの連結コンポーネントや特定蛋白質と相互作用する蛋白質のサブグラフと同じ) サブグラフを探し、各サブグラフについて作業することが可能でなければならない。連結コンポーネントを探す手順は全てのノードに適用され、連結コンポーネントの総目録を得られる(図12参照)。図5に図示された例のように、この目録は、各連結コンポーネントの大きさ、ノード、エッジ等だけではなく連結コンポーネントの総数も持っている。
【0028】
また、蛋白質相互作用データは、大容量で時間経過にしたがって変化することがあるため、フラット(flat)ファイルよりはデータベースで管理する方がずっと効率的である。したがって、本発明では蛋白質相互作用データのローカルデータベースを構築した。
【0029】
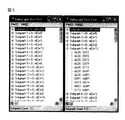
次は、本発明の大規模蛋白質相互作用データの効率的視覚化技法を具現したプログラムであるインタービューアー(InterViewer)を実験した結果について説明する。図5は、MIPS遺伝因子相互作用データの連結コンポーネントを列挙したものである。この例では同一蛋白質対間の重複相互作用を除外して888個の蛋白質間の1093個の相互作用が含まれていて、左側ウィンドウは、MIPS遺伝因子相互作用データ全ての連結コンポーネントを示しており、ここでユーザが連結コンポーネントを選択すると上記連結コンポーネントの全てのエッジが右側ウィンドウに表示される。この例の連結コンポーネント中、サブグラフ0は、2個の自己ループを含み531個のノードと807個のエッジを持った最も大きなサブグラフである。図6は、本発明のサブグラフ0を視覚化したものである。エッジ交差があるように見えるが、ビデオモニターに3次元ドローで視覚化した時は実際にはエッジ交差はない。
【0030】
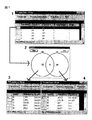
インタービューアーを使用すれば、ユーザ(user)は蛋白質相互作用を分析し、回転やズームによって3次元ドローを探索出来る。図7は、蛋白質相互作用の分析例を図示したものである。最初のウィンドウには全ての機能グループ対に共通する蛋白質の数と各グループ内の内部相互作用の数が示されている。ユーザがこのウィンドウから一行を選択すると、二番目ウィンドウのように蛋白質と機能グループの関係がベン図(venn diagram)で表示される。この図によれば35個の蛋白質が機能「aa (Amino−acid metabolism)」を持っていて、46個の蛋白質が機能 「cc (Cell cycle control)」を持っていて、3個の蛋白質は、二機能を両方持っている。ユーザ(user)が機能グループをクリックすると、三番目と四番目のウィンドウに図示されているように該当機能グループの全ての蛋白質が列挙される。
【0031】
インタービューアーによって視覚化されたグラフは、隣ノードとの距離レベル(distance level of neighbors)を制限することによって簡単化され得る。例えば、図6のCIT2の隣ノード達の距離レベルを5に設定すると、インタービューアーは図8に図示したように76個のノードを持った簡略化されたグラフを探し出す。このグラフで、ユーザが選択したノードのSEP2、PAN1及びFIR1を異なる色で表示し、CIT2はまた違う色で表示することによってユーザの便宜をはかることができる。ユーザは、フォースダイレクトレイアウトを生成する間、一つ以上のノード位置を固定するように選択出来る。初期レイアウト以後に、サブレイアウトの中心を固定させることによって生成された星模様のサブグラフのノード位置は大部分満足に値するグラフを産出してくれる。
【0032】
【発明の効果】
まず、本発明の大規模の蛋白質相互作用ネットワークを明確で美的に優れたグラフに視覚化し、従来のフォースダイレクトアルゴリズムと比べて10倍以上速いシステムを具現出来る。実行時間の比較のために、本発明では従来のグラフドロープログラムのパジェ(Pajek(Batagelj & Mrvar、2001))とチューリップ(Tulip(David、2001))を一緒に実行させた。パジェの場合、レイアウトのためにカマダ及びカワイのアルゴリズム(1989)、エイゲンバリュー(Eigen value)方法(Golub及び van Loan、1996)、フルチターマン及びレインゴールドのアルゴリズム(1991)等、3種類のアルゴリズムが具現されている。最初のアルゴリズムは、分離グラフを描くことが出来ず、2次元グラフだけを描き、二番目のアルゴリズムは、グラフドロー結果がフルチターマン及びレインゴールドのアルゴリズムに比べて良くないので、フルチターマン及びレインゴールドのアルゴリズムだけを比較対象とした。また、チューリップの二つのアルゴリズムであるスプリング−エレクトリック(Spring−Electric)レイアウトとGEMアルゴリズムを比較した。
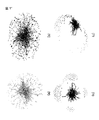
次の表1は、本発明のインタービューアーと上記三種類のアルゴリズムをペンティアムIV 1.7GHzプロセッサーで比較実験した結果である。これらのアルゴリズムによるドロー結果は、図9ないし図11に図示されている。各図面は、インタービューアー、パジェ(Fruchterman−Reingold)、チューリップ(Spring−Electric)及びチューリップ(GEM)による結果グラフを順に図示したものである。
【表1】
また、本発明の視覚化技法は、蛋白質相互作用の視覚化だけではなく個別的な連結コンポーネントやサブグラフ等のインタラクティブな検索及び探索のためのシステムにも使用出来る。
最後に、本発明は蛋白質相互作用データベースを動的に問合せをしてその問合せ結果を直接視覚化することによって、大量の更新データの視覚化及び分析が可能であるという長所がある。
【図面の簡単な説明】
【図1】図1は、本発明の視覚化技法のレイアウトアルゴリズムである。
【図2】図2は、隣接ノード間のローカルフォースによるノード移動を示した図である。
【図3】図3は、473個のノードを持った初期レイアウトの例を示した図である。
【図4】図4は、初期レイアウトのためのアルゴリズムである。
【図5】図5は、サブグラフ目録を示した図である。
【図6】図6は、図5のサブグラフ0を3次元にドローした結果を示した図である。
【図7】図7は、蛋白質相互作用分析の例を示した図である。
【図8】図8は、図6のグラフを簡略化した図である。
【図9】図9は、Y2Hデータに対する視覚化結果として、(a) インタービューアー視覚化結果、(b) パジェ(Fruchterman and Reingold アルゴリズム)視覚化結果、(c) チューリップ(GEMアルゴリズム)視覚化結果、(d) チューリップ(Speing−Electrical Forceアルゴリズム)視覚化結果を図示した図である。
【図10】図10は、MIPS遺伝的相互作用視覚化結果として、(a) インタービューアー視覚化結果、(b) パジェ(Fruchterman and Reingoldアルゴリズム)視覚化結果、(c) チューリップ(GEM アルゴリズム)視覚化結果、(d) チューリップ(Speing−Electrical Force アルゴリズム)視覚化結果を図示した図である。
【図11】図11は、MIPS物理的相互作用視覚化結果として、(a) インタービューアー 視覚化結果、(b) パジェ(Fruchterman and Reingold アルゴリズム)視覚化結果、(c) チューリップ(GEM アルゴリズム)視覚化結果、(d) チューリップ(Speing−Electrical Forceアルゴリズム)視覚化結果を図示した図である。
【図12】図12は、連結コンポーネント(connected component)を探し求める過程を説明した図である。[0001]
TECHNICAL FIELD OF THE INVENTION
The present invention relates to a technique for visualizing large-scale protein interaction data in three dimensions.
[0002]
[Prior art]
2. Description of the Related Art Recently, protein interaction technology has been developed and protein interaction data has been rapidly increased in scale. Research on the visualization of protein interaction networks has been pursued because such large-scale data is much more helpful to understand in graphical form than to enumerate interacting proteins longer. However, visualizing protein interaction data is not easy. The first reason is that when the protein interaction data is visualized, it becomes a complex non-planar graph with many edge crossings. Second, it is often the case that the graph is a disconnected graph composed of a plurality of connected components.
[0003]
Most common graph-drawing tools use a modified force-directed layout algorithm. This is because the algorithm is flexible, easy to implement, and has good draw results. Traditional Force Direct layout algorithms begin by arranging the nodes randomly and then re-adjusting their positions through optimization techniques to find the layout with minimal energy. The main difference between the various force direct layout algorithms lies in the choice of energy function and minimization technique. Examples of Force Direct layout algorithms include those by Kamada and Kawai (Kamada and Kawai (1989)) and those by Fulchitaman and Raingold (Fruchterman and Reingold (1991)). The former generates a two-dimensional graph and cannot visualize the separation graph. A common problem with many ForceDirect algorithms is that processing large graphs is very slow. This is because at each iteration step the force between all pairs of nodes must be calculated.
[0004]
Also, a Java applet program for visualizing protein interactions based on a relaxation algorithm was developed by Mrowka (2001) and tested on Y2H (Yeast Two-Hybrid, Uetz et al., 2000) data. Was. This program requires that all protein interaction data be provided in the parameters of the applet program in the HTML source, and there is a way to save the visualized graph other than capturing the window. Absent. The image captured from the window is a static image and generally degrades. In addition, such an image cannot be modified to reflect the data change thereafter. Nodes can be moved, but it is not possible to select or save connected components containing a particular protein for later use.
[0005]
In addition, the protein interaction visualization tool does not use a specific algorithm or program, but uses a general-purpose drawing tool. For example, PSIMAP (Park et al., 2001; Lappe et al., 2001) uses a structural classification of proteins (Murzin et al., 1995) to compare Y2H data with DIP data (Xerarios et al., 2001) to determine between protein families. After creation by Tom Sawyer software (http://www.tomsawyer.com/), the edge intersection of the mapping was removed by considerable manual work.
[0006]
A research team at the University of Washington (Schwikovski et al., 2000; Tucker et al., 2001) reported that Y2H data was collected using a general purpose draw tool called AGD (http://www.mpi-sb.mpg.de/AGD/). Was visualized. AGD is a powerful tool because it generates a two-dimensional graph and the visualization result is relatively satisfactory. However, it is a general-purpose drawing tool and can provide the functions necessary for protein interaction research. Absent. For example, most protein interaction data, including Y2H data, produces a separation graph composed of a number of connected components, which is a non-planar graph with a number of edge intersections that cannot be removed by a two-dimensional draw. It can be said that there is. One way to analyze such a graph is to work on individual connected components or subgraphs containing specific proteins. Another method is to visualize a non-planar graph into a three-dimensional graph without edge intersections. However, AGD is difficult to analyze because it cannot provide this function.
[0007]
On the other hand, the above-described graph creation programs all have a problem that after querying the database, the query results cannot be directly visualized. They also have the inconvenience of requiring the user to convert the data format to request input data in a particular format. In addition, since protein interaction data changes with time, it is convenient to visualize and reflect such changes, but conventional programs cannot provide such a function.
[0008]
In summary, conventional graph draw tools 1) draw crowded graphs with many edge intersections or static graphs that are difficult to modify. 2) It takes too much time to work interactively with a lot of data. 3) The data cannot be read directly from the protein interaction database and can be visualized only when the data is input in a specific format. Therefore, it is not suitable for visualizing the protein interaction. there were.
[0009]
[Problems to be solved by the invention]
SUMMARY OF THE INVENTION The present invention has been made to solve the above problems, and has been made to provide a new technique for visualizing a large-scale protein interaction network in three dimensions.
[0010]
In more detail, the processing speed is faster than other conventional visualization algorithms, and it can be used not only for visualization of protein interaction but also for interactive analysis. The visualized network is to provide a new force-direct algorithm for later modifiable or navigable systems.
[0011]
[Means for Solving the Problems]
The present invention relates to an efficient visualization technique for large-scale protein interaction data, and draws a three-dimensional graph in which a protein is a node and a protein-protein interaction is an edge. The present invention provides a first step of arranging all nodes of protein interaction data on a sphere surface by increasing both horizontal and vertical angles of polar coordinates to generate an initial layout, and each node of the initial layout. Is moved to an equilibrium position by a predetermined number of times, considering both a local spring force with an adjacent node and a global spring force with a non-adjacent node. A second step of iteratively generating a graph. The technique for efficient visualization of large-scale protein interaction data.
[0012]
Another feature of the present invention is that the number of repetitions of the second step can be changed by a user and operates in conjunction with a database in which the protein interaction data is stored.
[0013]
The method may further include a third step of simplifying the graph by limiting a distance level between a node selected by the user and a neighboring node to a predetermined distance.
[0014]
First, the terms and characteristics of the protein interaction data used in the present invention will be described in detail. The protein interaction data can be visualized in a graph where nodes indicate proteins and edges indicate protein interactions. The degree of a node is the number of edges, and when u = v, the edge (u, v) is a self-loop. The protein interaction data has the following characteristics.
[0015]
1) When visualized in a graph, the protein interaction data becomes a separation graph with many connected components. For example, the MIPS genetic interaction data (http://mips.gsf.de/proj/yeast/tables/interaction/) includes 100 or more connected components.
[0016]
2) The protein interaction data yields a non-planar graph with many edge intersections that cannot be removed in a two-dimensional graph.
[0017]
3) Since a single data set has a very different number of interacting proteins for each protein, a graph visualizing this includes not only low-order nodes but also very high-order nodes.
[0018]
4) The protein interaction data sometimes includes a protein interaction corresponding to a self-loop.
[0019]
5) The protein interaction data includes multiple interactions for the same protein pair.
[0020]
In the present invention, the interaction corresponding to the self-loop is stored in the edge table of the database, but this is ignored in the visualization in order to simplify the drawing process and generate a clean graph. Also, if the original protein interaction database contains a plurality of items for the same edge, it is stored only once in the local database. The protein interaction network visualized by the present invention can be stored in an image file, a local database or a text file in GML format (Himsolt, 1997). GML (Graph Modeling Language) is a portable graph file format, and has the advantage that when a graph is saved in GML, a previously calculated graph can be reloaded and re-visualized.
[0021]
A common problem with conventional force direct algorithms is that they are very slow when processing large graphs, and the present invention introduces a new force direct algorithm that can greatly improve speed and visual clarity. We propose a new visualization technique. The visualization technique proposed in the present invention is based on the algorithm of Walshaw (2000), and improves the problem.
[0022]
The layout algorithm of the present invention is briefly described in FIG. One of the problems with the Warsaw algorithm is that the desired results are not obtained when the graph contains dense subgraphs (subgraphs containing nodes of very high degree). This algorithm iteratively computes node positions until the size of the graph falls below a certain threshold value, so iterating the algorithm unnecessarily many times without improving the overall layout Case occurs. Therefore, in the present invention, an end condition different from that of the Warsaw algorithm is adopted, and the repetition is performed 20 times by default. The default value of 20 was chosen empirically based on comparative experiments and allows the user to increase the number of iterations through the interface (line 16).
[0023]
In each iteration loop, the node position is updated (line 8) with reference not only to the local spring force between adjacent nodes (line 10) but also to the global spring force between non-adjacent nodes (line 8). You.
[0024]
FIG. 2 is a diagram illustrating that a node v is rearranged by a local force between adjacent nodes. Looking at FIG. 2a in detail, node v is connected to three nodes, and the force on v from one of three neighboring nodes u is represented by the line v between v and u. To move along. Consequently, as shown in FIG. 2b, the aggregating force created by all neighboring nodes moves v to equilibrium position.
[0025]
Next, the initial layout method employed in the present invention will be described. The traditional general Force Direct Graph Draw algorithm begins by randomly arranging all nodes of the graph in a two-dimensional plane or three-dimensional space, and continually modifies this initial layout using optimization techniques And seek the layout with the least energy. If there are nodes that overlap or are coplanar with the initial layout, the computation time may need to be increased to rearrange them. Therefore, in order to reduce the processing time, the present invention does not randomly arrange nodes for the initial layout. The present invention places nodes on the sphere surface by increasing the horizontal and vertical angles of the polar coordinates. This method minimizes the number of times a node is placed on a plane. FIG. 3 illustrates an example of an initial layout of a graph having 473 nodes. FIG. 4 is a simplified algorithm for the initial layout.
[0026]
Hereinafter, the calculation cost (required time) of the algorithm of the present invention will be described in detail. In the graph of "n (number of nodes) = V", only the time O (n) is required for the initial layout and does not affect the global time of the algorithm. Let T be the total number of iterations of the outer loop (two rows in FIG. 1). Since it takes time O (n) to calculate the movement D of one node, it takes time O (n 2 ) to calculate the movements D of all nodes in each step of the outer loop. Therefore, the total required time is O (T · n 2 ) = O (n 2 ) (T is a constant). The present invention is very fast compared to the time complexity O (n 3 ) of the spring-embedder algorithm (Kamada and Kawai, 1989).
[0027]
With the drawing tool embodied using the visualization technique of the present invention, it is possible to search for and work with a subgraph. Due to the size and characteristics of the protein interaction network, it must be possible to find subgraphs (same as the connected components of the separation graph and the subgraphs of proteins interacting with a specific protein) and work on each subgraph. The procedure for searching for connected components is applied to all nodes, and a total list of connected components can be obtained (see FIG. 12). As in the example shown in FIG. 5, this list has not only the size, nodes, edges, etc. of each connected component but also the total number of connected components.
[0028]
In addition, since protein interaction data is large in volume and may change over time, it is much more efficient to manage it in a database than in a flat file. Therefore, in the present invention, a local database of protein interaction data was constructed.
[0029]
Next, the results of experiments on InterViewer, a program that implements the efficient visualization technique of large-scale protein interaction data of the present invention, will be described. FIG. 5 lists the connected components of the MIPS genetic factor interaction data. In this example, 1088 interactions between 888 proteins were included excluding overlapping interactions between the same protein pairs, and the left window shows the connected components of all MIPS genetic factor interaction data. Here, when the user selects a connected component, all edges of the connected component are displayed in the right window. In the connected component of this example, subgraph 0 is the largest subgraph with 2 self-loops and 531 nodes and 807 edges. FIG. 6 is a visualization of subgraph 0 of the present invention. Although there appears to be edge intersections, there are actually no edge intersections when visualized with a three-dimensional draw on a video monitor.
[0030]
Using the Interviewer, a user can analyze protein interactions and search for a three-dimensional draw by rotating and zooming. FIG. 7 illustrates an example of analysis of protein interaction. The first window shows the number of proteins common to all functional group pairs and the number of internal interactions within each group. When the user selects one line from this window, the relationship between the protein and the functional group is displayed in a Venn diagram as in the second window. According to this figure, 35 proteins have the function "aa (Amino-acid metabolism)", 46 proteins have the function "cc (Cell cycle control)", and three proteins are: It has both functions. When the user clicks on a function group, all proteins of the function group are listed as shown in the third and fourth windows.
[0031]
The graph visualized by the interviewer can be simplified by limiting the distance level of neighbors. For example, if the distance level of the neighbors of CIT2 in FIG. 6 is set to 5, the interviewer searches for a simplified graph having 76 nodes as shown in FIG. In this graph, the SEP2, PAN1, and FIR1 of the node selected by the user are displayed in different colors, and the CIT2 is displayed in a different color for the convenience of the user. The user can choose to fix one or more node positions while generating the Force Direct layout. After the initial layout, the node positions of the star-patterned subgraph generated by fixing the center of the sub-layout yield a graph that is largely satisfactory.
[0032]
【The invention's effect】
First, the large-scale protein interaction network of the present invention is visualized in a clear and aesthetically superior graph, and a system that is 10 times faster than the conventional Force Direct algorithm can be realized. For comparison of execution times, in the present invention, a conventional graph draw program Pajek (Batagelj & Mrvar, 2001) and a tulip (Tulip (David, 2001)) were executed together. In the case of Paje, there are three kinds of algorithms for layout, such as the Kamada and Kawai algorithm (1989), the Eigen value method (Golub and van Loan, 1996), and the full titerman and rain gold algorithm (1991). It is embodied. The first algorithm cannot draw a separation graph, only a two-dimensional graph, and the second algorithm uses the full titerman and raingold algorithm because the graph draw results are not as good as the full titerman and raingold algorithm. Only was taken as a comparison. Also, the Spring-Electric layout, which is two algorithms of Tulip, and the GEM algorithm were compared.
Table 1 below shows the results of a comparative experiment of the viewer of the present invention and the above three types of algorithms using a Pentium IV 1.7 GHz processor. The draw results from these algorithms are illustrated in FIGS. Each drawing shows a result graph of an interviewer, a Paje (Fruchterman-Reingold), a tulip (Spring-Electric) and a tulip (GEM) in order.
[Table 1]
Also, the visualization techniques of the present invention can be used in systems for interactive search and search of individual connected components and subgraphs, as well as visualization of protein interactions.
Finally, the present invention has the advantage that a large amount of updated data can be visualized and analyzed by dynamically querying the protein interaction database and directly visualizing the query results.
[Brief description of the drawings]
FIG. 1 is a layout algorithm of the visualization technique of the present invention.
FIG. 2 is a diagram illustrating node movement by a local force between adjacent nodes;
FIG. 3 is a diagram illustrating an example of an initial layout having 473 nodes;
FIG. 4 is an algorithm for an initial layout.
FIG. 5 is a diagram showing a subgraph list;
FIG. 6 is a diagram showing a result of drawing the subgraph 0 of FIG. 5 three-dimensionally.
FIG. 7 is a diagram showing an example of a protein interaction analysis.
FIG. 8 is a simplified diagram of the graph of FIG. 6;
FIG. 9 shows, as visualization results for Y2H data, (a) an interviewer visualization result, (b) a Paje (Fruchterman and Reingold algorithm) visualization result, and (c) a tulip (GEM algorithm) visualization result. (D) is a diagram illustrating the result of visualization of a tulip (Speing-Electrical Force algorithm).
FIG. 10 shows (a) Interviewer visualization results, (b) Paje (Fruchterman and Reingold algorithm) visualization results, and (c) Tulip (GEM algorithm) visualization as MIPS genetic interaction visualization results. FIG. 9D is a diagram illustrating a visualization result of a tulip (Speing-Electrical Force algorithm).
FIG. 11 shows (a) Interviewer visualization result, (b) Paje (Fruchterman and Reingold algorithm) visualization result, and (c) Tulip (GEM algorithm) visualization as MIPS physical interaction visualization results. FIG. 9D is a diagram illustrating a result of visualization of a tulip (Sping-Electrical Force algorithm).
FIG. 12 is a diagram illustrating a process of searching for a connected component.