ES2831754T3 - Methods to predict the progression of Barrett's esophagus - Google Patents
Methods to predict the progression of Barrett's esophagus Download PDFInfo
- Publication number
- ES2831754T3 ES2831754T3 ES16869219T ES16869219T ES2831754T3 ES 2831754 T3 ES2831754 T3 ES 2831754T3 ES 16869219 T ES16869219 T ES 16869219T ES 16869219 T ES16869219 T ES 16869219T ES 2831754 T3 ES2831754 T3 ES 2831754T3
- Authority
- ES
- Spain
- Prior art keywords
- intensity
- risk
- biomarkers
- progression
- patients
- Prior art date
- Legal status (The legal status is an assumption and is not a legal conclusion. Google has not performed a legal analysis and makes no representation as to the accuracy of the status listed.)
- Active
Links
Classifications
-
- G—PHYSICS
- G01—MEASURING; TESTING
- G01N—INVESTIGATING OR ANALYSING MATERIALS BY DETERMINING THEIR CHEMICAL OR PHYSICAL PROPERTIES
- G01N33/00—Investigating or analysing materials by specific methods not covered by groups G01N1/00 - G01N31/00
- G01N33/48—Biological material, e.g. blood, urine; Haemocytometers
- G01N33/50—Chemical analysis of biological material, e.g. blood, urine; Testing involving biospecific ligand binding methods; Immunological testing
- G01N33/53—Immunoassay; Biospecific binding assay; Materials therefor
- G01N33/574—Immunoassay; Biospecific binding assay; Materials therefor for cancer
- G01N33/57484—Immunoassay; Biospecific binding assay; Materials therefor for cancer involving compounds serving as markers for tumor, cancer, neoplasia, e.g. cellular determinants, receptors, heat shock/stress proteins, A-protein, oligosaccharides, metabolites
-
- G—PHYSICS
- G01—MEASURING; TESTING
- G01N—INVESTIGATING OR ANALYSING MATERIALS BY DETERMINING THEIR CHEMICAL OR PHYSICAL PROPERTIES
- G01N33/00—Investigating or analysing materials by specific methods not covered by groups G01N1/00 - G01N31/00
- G01N33/48—Biological material, e.g. blood, urine; Haemocytometers
- G01N33/50—Chemical analysis of biological material, e.g. blood, urine; Testing involving biospecific ligand binding methods; Immunological testing
- G01N33/52—Use of compounds or compositions for colorimetric, spectrophotometric or fluorometric investigation, e.g. use of reagent paper and including single- and multilayer analytical elements
-
- G—PHYSICS
- G01—MEASURING; TESTING
- G01N—INVESTIGATING OR ANALYSING MATERIALS BY DETERMINING THEIR CHEMICAL OR PHYSICAL PROPERTIES
- G01N33/00—Investigating or analysing materials by specific methods not covered by groups G01N1/00 - G01N31/00
- G01N33/48—Biological material, e.g. blood, urine; Haemocytometers
- G01N33/50—Chemical analysis of biological material, e.g. blood, urine; Testing involving biospecific ligand binding methods; Immunological testing
- G01N33/53—Immunoassay; Biospecific binding assay; Materials therefor
- G01N33/574—Immunoassay; Biospecific binding assay; Materials therefor for cancer
- G01N33/57407—Specifically defined cancers
- G01N33/57446—Specifically defined cancers of stomach or intestine
-
- G—PHYSICS
- G01—MEASURING; TESTING
- G01N—INVESTIGATING OR ANALYSING MATERIALS BY DETERMINING THEIR CHEMICAL OR PHYSICAL PROPERTIES
- G01N2800/00—Detection or diagnosis of diseases
- G01N2800/56—Staging of a disease; Further complications associated with the disease
Abstract
Un método para determinar un riesgo de progresión de esófago de Barrett en un sujeto, que comprende: a) proporcionar una muestra del sujeto; b) detectar una pluralidad de biomarcadores en la muestra, en donde la pluralidad de biomarcadores son p53, HIF-la, COX2, p16, alfa-metilacil-CoA racemasa (AMACR), CD68, CD45RO, K20 y HER2/neu; c) determinar características de análisis de imágenes asociadas con la pluralidad de biomarcadores y morfología, en donde las características de análisis de imágenes son la intensidad de la suma de p53 nuclear, intensidad media de p53 nuclear, relación de intensidad media de HER2/neu:intensidad media de K20 en grupos de núcleos, relación de intensidad del 95° cuantil de HER2/neu:intensidad del 95° cuantil de K20 en grupos de núcleos, expresión conjunta de CD68 y COX2 celular, intensidad media de p53 en grupos de núcleos, solidez nuclear en células negativas para p16 que sobreexpresan p53, intensidad de la suma de CD45RO en la membrana plasmática, desviación estándar de AMACR en el microambiente, textura de COX2 en el citoplasma, intensidad media de HIF-1 a en el microambiente celular, momento de HIF-1 a en el microambiente celular (producto de la media y la desviación estándar), intensidad media de p16 en el citoplasma, área nuclear en células negativas para p16 que sobreexpresan p53 e intensidad del 95° cuantil nuclear de Hoechst; d) determinar una puntuación usando la combinación de las características de análisis de imágenes; y e) correlacionar la puntuación con el riesgo de progresión de esófago de Barrett en el sujeto.A method of determining a risk of Barrett's esophagus progression in a subject, comprising: a) providing a sample from the subject; b) detecting a plurality of biomarkers in the sample, wherein the plurality of biomarkers are p53, HIF-la, COX2, p16, alpha-methylacyl-CoA racemase (AMACR), CD68, CD45RO, K20 and HER2 / neu; c) determine image analysis characteristics associated with the plurality of biomarkers and morphology, where the image analysis characteristics are the intensity of the sum of nuclear p53, mean intensity of nuclear p53, ratio of mean intensity of HER2 / neu: mean intensity of K20 in groups of nuclei, intensity ratio of the 95th quantile of HER2 / neu: intensity of the 95th quantile of K20 in groups of nuclei, joint expression of CD68 and cellular COX2, mean intensity of p53 in groups of nuclei, nuclear robustness in p16 negative cells that overexpress p53, intensity of CD45RO summation in the plasma membrane, standard deviation of AMACR in the microenvironment, texture of COX2 in the cytoplasm, mean intensity of HIF-1a in the cellular microenvironment, time of HIF-1 a in the cellular microenvironment (product of the mean and standard deviation), mean intensity of p16 in the cytoplasm, nuclear area in p16 negative cells that overexpress p53 e intensity of the 95 ° nuclear quantile of Hoechst; d) determining a score using the combination of the image analysis features; and e) correlating the score with the risk of progression of Barrett's esophagus in the subject.
Description
DESCRIPCIÓNDESCRIPTION
Métodos para predecir la progresión del esófago de BarrettMethods to predict the progression of Barrett's esophagus
IntroducciónIntroduction
El esófago de Barrett (BE, por sus siglas en inglés) es un precursor de adenocarcinoma de esófago (EAC, por sus siglas en inglés). Aunque el riesgo de progresión de BE no displásico (ND) a EAC es muy bajo, las opciones de tratamiento para EAC avanzado son limitadas y la detección temprana es fundamental para un manejo óptimo del paciente. El EAC se puede prevenir si la displasia se detecta y se trata temprano con terapias de erradicación endoscópica tales como ablación por radiofrecuencia (RFA, por sus siglas en inglés) y/o resección endoscópica de la mucosa (EMR, por sus siglas en inglés). A pesar de los programas de vigilancia endoscópica destinados a prevenir el EAC en pacientes con BE, la incidencia de EAC sigue siendo un problema de salud con tasas de supervivencia a 5 años de un 17 %. Se necesitan pruebas precisas para identificar pacientes con BE que tienen alto riesgo de progresión y requieren intervención terapéutica, así como para reconocer a pacientes con BE de bajo riesgo que posiblemente pueden reducir la frecuencia de vigilancia endoscópica. Dichas pruebas han sido difíciles de desarrollar hasta la fecha.Barrett's esophagus (BE) is a precursor to adenocarcinoma of the esophagus (EAC). Although the risk of progression from non-dysplastic BE (ND) to CAD is very low, treatment options for advanced CAD are limited and early detection is essential for optimal patient management. CAD can be prevented if dysplasia is detected and treated early with endoscopic eradication therapies such as radiofrequency ablation (RFA) and / or endoscopic mucosal resection (EMR) . Despite endoscopic surveillance programs aimed at preventing CAD in patients with BE, the incidence of CAD remains a health problem with 5-year survival rates of 17%. Accurate tests are needed to identify BE patients who are at high risk of progression and require therapeutic intervention, as well as to recognize low-risk BE patients who may possibly reduce the frequency of endoscopic surveillance. Such tests have been difficult to develop to date.
Las directrices de práctica actuales recomiendan la vigilancia endoscópica con biopsias a frecuencias determinadas por el grado de displasia. Sin embargo, la evaluación histológica de las biopsias esofágicas puede estar limitada por la variación entre observadores y el muestreo endoscópico aleatorio. Las anomalías histológicas en BE forman un espectro continuo y puede ser difícil distinguir los grados de displasia. Adicionalmente, los cambios moleculares y celulares asociados con la transformación maligna pueden preceder a los cambios morfológicos que los patólogos pueden evaluar mediante histología. Se han realizado esfuerzos durante mucho tiempo para identificar biomarcadores de predicción de riesgo en BE. Este concepto se ha vuelto más importante con el advenimiento de terapias endoscópicas altamente eficaces tales como RFA y EMR. Se han evaluado muchos biomarcadores en BE, pero los biomarcadores de predicción de riesgo han sido difíciles de identificar. La British Society of Gastroenterology (BSG) recomienda el uso de inmunohistoquímico (IHC, por sus siglas en inglés) p53 para ayudar al diagnóstico de displasia, sin embargo, hasta la fecha, no se ha identificado ni validado ningún biomarcador o grupo de biomarcadores para una predicción precisa de riesgo. La compleja estructura de tejidos destaca la necesidad de un enfoque de biología de sistemas alternativo a la patología anatómica. La evaluación de tejidos como un "sistema" puede mejorar las herramientas actuales mediante la cuantificación de características genéticas, inmunológicas, vasculares y morfológicas relevantes para los resultados del paciente. Estas características moleculares y celulares pueden estratificar con mayor precisión las diferencias genéticas y no genéticas que colocan a los pacientes con EB en riesgo de progresión. Este enfoque de patología de sistemas tisulares se describe en Rebecca J. Critchley-Thorne et al.'. "TissueCypher (TM): A systems biology approach to anatomic pathology", Journal of Pathology Informatics, vol. 6, n.01, 31 de agosto de 2015, página 48 y se ha demostrado que tiene posibles aplicaciones de diagnóstico en BE. Este enfoque también puede tener aplicaciones de pronóstico mediante la cuantificación objetiva de múltiples características moleculares y celulares que preceden a los cambios morfológicos definitivos. En el presente documento, se describe un enfoque de patología de sistemas tisulares para estratificación del riesgo en BE. El enfoque emplea el mareaje de biomarcadores de fluorescencia multiplexado con imágenes digitales y análisis de imágenes para cuantificar objetivamente múltiples biomarcadores y morfologías epiteliales y estromales. Los datos morfométricos/biomarcadores cuantitativos se integran mediante un clasificador multivariante en las puntuaciones de pronóstico. El objetivo era desarrollar y validar de forma independiente una prueba de patología de sistemas tisulares que prediga el riesgo futuro de progresar a displasia de alto grado (HGD, por sus siglas en inglés)/EAC en pacientes con BE.Current practice guidelines recommend endoscopic surveillance with biopsies at frequencies determined by the degree of dysplasia. However, the histological evaluation of esophageal biopsies may be limited by inter-observer variation and random endoscopic sampling. Histologic abnormalities in BE form a continuous spectrum, and grades of dysplasia can be difficult to distinguish. Additionally, the molecular and cellular changes associated with malignant transformation can precede morphological changes that pathologists can evaluate by histology. Efforts have been made for a long time to identify risk predictive biomarkers in BE. This concept has become more important with the advent of highly effective endoscopic therapies such as RFA and EMR. Many biomarkers have been evaluated in BE, but predictive risk biomarkers have been difficult to identify. The British Society of Gastroenterology (BSG) recommends the use of immunohistochemical (IHC) p53 to aid in the diagnosis of dysplasia, however, to date, no biomarker or group of biomarkers has been identified or validated for an accurate prediction of risk. The complex structure of tissues highlights the need for an alternative systems biology approach to anatomical pathology. The evaluation of tissues as a "system" can improve current tools by quantifying genetic, immunological, vascular and morphological characteristics relevant to patient outcomes. These molecular and cellular characteristics can more precisely stratify the genetic and non-genetic differences that place EB patients at risk of progression. This approach to tissue systems pathology is described in Rebecca J. Critchley-Thorne et al. '. "TissueCypher (TM): A systems biology approach to anatomic pathology", Journal of Pathology Informatics, vol. 6, n.01, August 31, 2015, page 48 and has been shown to have potential diagnostic applications in BE. This approach may also have prognostic applications through the objective quantification of multiple molecular and cellular features that precede definitive morphological changes. Herein, a tissue systems pathology approach to risk stratification in BE is described. The approach employs multiplexed fluorescence biomarker labeling with digital images and image analysis to objectively quantify multiple epithelial and stromal biomarkers and morphologies. Morphometric data / quantitative biomarkers are integrated using a multivariate classifier in prognostic scores. The objective was to independently develop and validate a tissue systems pathology test that predicts the future risk of progressing to high-grade dysplasia (HGD) / CAD in patients with BE.
Sumario de la invenciónSummary of the invention
De acuerdo con un aspecto, la presente invención proporciona un método para determinar un riesgo de progresión de esófago de Barrett en un sujeto, que comprende: a) proporcionar una muestra del sujeto; b) detectar una pluralidad de biomarcadores en la muestra, en donde la pluralidad de biomarcadores son p53, HIF-1a, COX2, p16, alfa-metilacil-CoA racemasa (AMACR), CD68, CD45RO, K20 y HER2/neu; c) determinar características de análisis de imágenes asociadas con la pluralidad de biomarcadores y morfología, en donde las características de análisis de imágenes son la intensidad de la suma de p53 nuclear, intensidad media de p53 nuclear, relación de intensidad media de HER2/neu:intensidad media de K20 en grupos de núcleos, relación de intensidad del 95o cuantil de HER2/neu:intensidad del 95o cuantil de K20 en grupos de núcleos, expresión conjunta de CD68 y COX2 celular, intensidad media de p53 en grupos de núcleos, solidez nuclear en células negativas para p16 que sobreexpresan p53, intensidad de la suma de CD45RO en la membrana plasmática, desviación estándar de AMACR en el microambiente, textura de COX2 en el citoplasma, intensidad media de HIF-1a en el microambiente celular, momento de HIF-1a en el microambiente celular (producto de la media y la desviación estándar), intensidad media de p16 en el citoplasma, área nuclear en células negativas para p16 que sobreexpresan p53 e intensidad del 95o cuantil nuclear de Hoechst; d) determinar una puntuación usando la combinación de las características de análisis de imágenes; y e) correlacionar la puntuación con el riesgo de progresión de esófago de Barrett en el sujeto.In accordance with one aspect, the present invention provides a method for determining a risk of Barrett's esophagus progression in a subject, comprising: a) providing a sample from the subject; b) detecting a plurality of biomarkers in the sample, wherein the plurality of biomarkers are p53, HIF-1a, COX2, p16, alpha-methylacyl-CoA racemase (AMACR), CD68, CD45RO, K20 and HER2 / neu; c) determine image analysis characteristics associated with the plurality of biomarkers and morphology, where the image analysis characteristics are the intensity of the sum of nuclear p53, mean intensity of nuclear p53, ratio of mean intensity of HER2 / neu: mean intensity of K20 in groups of nuclei, intensity ratio of the 95th quantile of HER2 / neu: intensity of the 95th quantile of K20 in groups of nuclei, joint expression of CD68 and cellular COX2, mean intensity of p53 in groups of nuclei, nuclear solidity in p16 negative cells that overexpress p53, intensity of CD45RO summation in the plasma membrane, standard deviation of AMACR in the microenvironment, texture of COX2 in the cytoplasm, mean intensity of HIF-1a in the cellular microenvironment, time of HIF- 1a in the cellular microenvironment (product of the mean and standard deviation), mean intensity of p16 in the cytoplasm, nuclear area in p16-negative cells that overexpress p53 and i Intensity of the 95th nuclear quantile of Hoechst; d) determining a score using the combination of the image analysis features; and e) correlating the score with the risk of progression of Barrett's esophagus in the subject.
En una realización del método, el sujeto tiene un mayor riesgo de displasia de bajo grado, displasia de alto grado o cáncer de esófago. En otra realización del método, el sujeto ha recibido un diagnóstico de metaplasia intestinal no displásica, atipia reactiva, indefinido para displasia, displasia de bajo grado o displasia de alto grado. Incluso en otra realización del método, la detección de la pluralidad de biomarcadores comprende usar sondas que se unen específicamente a cada uno de los biomarcadores; opcionalmente, en donde las sondas son fluorescentes y/o comprenden un marcador fluorescente, o se detectan mediante una sonda secundaria que es fluorescente y/o comprende un marcador fluorescente, opcionalmente en donde cada sonda está marcada con un fluoróforo diferente. En esta realización, se pueden formar imágenes de portaobjetos marcados para producir campos de visión y/o se pueden analizar portaobjetos completos para extraer características asociadas con biomarcadores y morfología.In one embodiment of the method, the subject is at increased risk for low-grade dysplasia, high-grade dysplasia, or esophagus cancer. In another embodiment of the method, the subject has received a diagnosis of non-dysplastic intestinal metaplasia, reactive atypia, undefined for dysplasia, low-grade dysplasia, or high-grade dysplasia. In yet another embodiment of the method, detecting the plurality of biomarkers comprises using probes that specifically bind to each of the biomarkers; optionally, wherein the probes are fluorescent and / or comprise a fluorescent marker, or are detected by a secondary probe that is fluorescent and / or comprises a fluorescent marker, optionally wherein each probe is labeled with a different fluorophore. In this embodiment, labeled slides can be imaged to produce fields of view and / or entire slides can be analyzed to extract characteristics associated with biomarkers and morphology.
En algunas realizaciones del método, la detección de la pluralidad de biomarcadores se determina simultáneamente. En algunas realizaciones del método, la muestra comprende células que contienen núcleos celulares y en donde los núcleos celulares están marcados con un grupo de reactivos seleccionados del grupo que consiste en Hoechst, 4',6'-diamidino-2-fenilindol (DAPI), tinciones de ácido nucleico de cianina y hematoxilina.In some embodiments of the method, the detection of the plurality of biomarkers is determined simultaneously. In some embodiments of the method, the sample comprises cells that contain cell nuclei and wherein the cell nuclei are labeled with a group of reagents selected from the group consisting of Hoechst, 4 ', 6'-diamidino-2-phenylindole (DAPI), cyanine and hematoxylin nucleic acid stains.
En algunas realizaciones del método, la puntuación se utiliza para determinar si un paciente es candidato para una intervención terapéutica para prevenir la progresión del esófago de Barrett; opcionalmente, en donde la intervención terapéutica es una ablación endoscópica y/o una terapia de resección quirúrgica, o una terapia quirúrgica no endoscópica o una terapia sistémica.In some embodiments of the method, the score is used to determine if a patient is a candidate for a therapeutic intervention to prevent the progression of Barrett's esophagus; optionally, wherein the therapeutic intervention is endoscopic ablation and / or surgical resection therapy, or non-endoscopic surgical therapy or systemic therapy.
En algunas realizaciones del método, (a) la muestra comprende un cepillado, raspado, biopsia o resección quirúrgica de células y/o tejido obtenido del sujeto, (b) la misma está a temperatura ambiente o congelada, o (c) la muestra se obtuvo recientemente, fijada con formalina, fijada con alcohol o incluida en parafina.In some embodiments of the method, (a) the sample comprises a brushing, scraping, biopsy, or surgical resection of cells and / or tissue obtained from the subject, (b) it is at room temperature or frozen, or (c) the sample is recently obtained, formalin-fixed, alcohol-fixed, or paraffin-embedded.
En algunas realizaciones del método, la muestra se tomó mediante muestreo endoscópico aleatorio, muestreo endoscópico asistido por computadora, muestreo endoscópico guiado por imágenes, o muestreo no endoscópico mediante cepillado, abrasión o raspado.In some embodiments of the method, the sample was taken by random endoscopic sampling, computer-assisted endoscopic sampling, image-guided endoscopic sampling, or non-endoscopic sampling by brushing, abrasion, or scraping.
De acuerdo con otro aspecto, la presente invención proporciona un método para clasificar el esófago de Barrett en un sujeto que comprende: a) proporcionar una muestra del sujeto; b) detectar una pluralidad de biomarcadores en la muestra, en donde la pluralidad de biomarcadores son p53, HIF-1a, COX-2, p16, alfa-metilacil-CoA racemasa (AMACR), CD68, CD45RO, K20 y HER2/neu; c) determinar las características de análisis de imágenes asociadas con la pluralidad de biomarcadores y morfología, en donde las características de análisis de imágenes son la intensidad de la suma de p53 nuclear, intensidad media de p53 nuclear, relación de intensidad media de HER2/neu:intensidad media de K20 en grupos de núcleos, relación de intensidad del 95o cuantil de HER2/neu:intensidad del 95o cuantil de K20 en grupos de núcleos, expresión conjunta de CD68 y COX2 celular, intensidad media de p53 en grupos de núcleos, solidez nuclear en células negativas para p16 que sobreexpresan p53, intensidad de la suma de CD45RO en la membrana plasmática; desviación estándar de AMACR en el microambiente, textura de COX2 en el citoplasma, intensidad media de HIF-1a en el microambiente celular, momento de HIF-1a en el microambiente celular (producto de la media y la desviación estándar), intensidad media de p16 en el citoplasma, área nuclear en células negativas para p16 que sobreexpresan p53 e intensidad del 95o cuantil nuclear de Hoechst; (d) determinar una puntuación usando la combinación de las características de análisis de imágenes; y e) correlacionar la puntuación con una clasificación del esófago de Barrett.In accordance with another aspect, the present invention provides a method for classifying Barrett's esophagus in a subject comprising: a) providing a sample from the subject; b) detecting a plurality of biomarkers in the sample, wherein the plurality of biomarkers are p53, HIF-1a, COX-2, p16, alpha-methylacyl-CoA racemase (AMACR), CD68, CD45RO, K20 and HER2 / neu; c) determine the image analysis characteristics associated with the plurality of biomarkers and morphology, where the image analysis characteristics are the intensity of the sum of nuclear p53, mean intensity of nuclear p53, ratio of mean intensity of HER2 / neu : mean intensity of K20 in groups of nuclei, intensity ratio of the 95th quantile of HER2 / neu: intensity of the 95th quantile of K20 in groups of nuclei, joint expression of CD68 and cellular COX2, mean intensity of p53 in groups of nuclei, robustness nuclear in p16 negative cells that overexpress p53, intensity of CD45RO summation at the plasma membrane; standard deviation of AMACR in the microenvironment, texture of COX2 in the cytoplasm, mean intensity of HIF-1a in the cellular microenvironment, time of HIF-1a in the cell microenvironment (product of mean and standard deviation), mean intensity of p16 in the cytoplasm, nuclear area in p16 negative cells that overexpress p53 and intensity of the 95th nuclear quantile of Hoechst; (d) determining a score using the combination of the image analysis features; and e) correlating the score with a Barrett's esophagus classification.
En una realización del método, la clasificación del esófago de Barrett comprende metaplasia intestinal no displásica, atipia reactiva, displasia de bajo grado y displasia de alto grado.In one embodiment of the method, the Barrett's esophagus classification comprises nondysplastic intestinal metaplasia, reactive atypia, low-grade dysplasia, and high-grade dysplasia.
En otra realización del método, la detección de la pluralidad de biomarcadores comprende usar sondas que se unen específicamente a cada uno de los biomarcadores.In another embodiment of the method, detecting the plurality of biomarkers comprises using probes that specifically bind to each of the biomarkers.
En algunas realizaciones del método, la muestra comprende células que contienen núcleos celulares, y en donde los núcleos celulares están marcados con un grupo de reactivos seleccionados del grupo que consiste en Hoechst, 4',6'-diamidino-2-fenilindol (DAPI), tinciones de ácido nucleico de cianina y hematoxilina.In some embodiments of the method, the sample comprises cells that contain cell nuclei, and wherein the cell nuclei are labeled with a group of reagents selected from the group consisting of Hoechst, 4 ', 6'-diamidino-2-phenylindole (DAPI) , cyanine and hematoxylin nucleic acid stains.
Breve descripción de los dibujosBrief description of the drawings
FIG. 1. Mareaje y toma de imágenes de biomarcadores multiplexados en casos de BE de pacientes con progresión de incidentes. Imágenes representativas de los 9 biomarcadores en los que se basa el clasificador de 15 características a partir de 2 biopsias ND (paneles A-B y C-D) y 1 biopsia LGD (paneles E-F) de pacientes con progresión de incidentes. A: p53, AMACR, p16, Hoechst; B: CD68, COX-2, Hoechst; C: p53, AMACR, p16, Hoechst; D: CD68, COX-2, Hoechst; E: HER2/neu, K20, Hoechst; F: HIF-1a, CD45RO, Hoechst.FIG. 1. Labeling and imaging of multiplexed biomarkers in BE cases of patients with incident progression. Representative images of the 9 biomarkers on which the 15-feature classifier is based from 2 ND biopsies (panels A-B and C-D) and 1 LGD biopsy (panels E-F) of patients with incident progression. A: p53, AMACR, p16, Hoechst; B: CD68, COX-2, Hoechst; C: p53, AMACR, p16, Hoechst; D: CD68, COX-2, Hoechst; E: HER2 / neu, K20, Hoechst; F: HIF-1a, CD45RO, Hoechst.
FIG. 2. Desarrollo y rendimiento de la puntuación de riesgo de 15 características en el conjunto de capacitación de pacientes con BE. Panel A: Curva ROC para la puntuación de riesgo de 15 características en el conjunto de capacitación de pacientes con progresión de incidentes y sin progresión. Paneles B, C y D: Análisis de KM de la probabilidad de progresión a HGD/EAC en pacientes con puntuación de riesgo bajo, intermedio y alto mediante el clasificador de riesgo de 15 características de las cuatro instituciones, las tres instituciones estadounidenses y AMC, respectivamente. Panel E: HR y OR univariantes con IC del 95 % para comparaciones entre grupos de riesgo.FIG. 2. Development and performance of the risk score of 15 characteristics in the training set of patients with BE. Panel A: ROC curve for the risk score of 15 characteristics in the training set of patients with incident progression and without progression. Panels B, C and D: KM analysis of the probability of progression to HGD / CAD in patients with low, intermediate and high risk scores using the risk classifier of 15 characteristics of the four institutions, the three US institutions and AMC, respectively. Panel E: Univariate HR and OR with 95% CI for comparisons between risk groups.
FIG. 3. Detección de características de alto riesgo que preceden cambios morfológicos en BE. Se muestran imágenes de endoscopia, H&E y biomarcadores de fluorescencia multiplexados para un paciente con progresión de incidentes (IP, por sus siglas en inglés) paneles A-C) y un paciente sin progresión (NP) (paneles D-F) con diagnóstico del subespecialista Gl de BE ND. El paciente con IP progresó a HGD (displasia de alto grado) 6,3 años más tarde y el clasificador de 15 características lo calificó de alto riesgo. El paciente NP tuvo 7,8 años de vigilancia endoscópica que no mostró progresión a HGD/EAC y se calificó de bajo riesgo. A: Imagen de endoscopia de IP que muestra BE sin lesiones visibles; B: Biopsia teñida con H&E de IP que muestra ND; C: Patrones de biomarcadores en la biopsia ND de IP (fragmento superior izquierdo: p53, p16, AMACR, Hoechst, superior derecha: HER2/neu, K20, Hoechst, inferior izquierda: CD68, COX-2, Hoechst, inferior derecha: HIF-1a, CD45RO, Hoechst; D: Imagen de endoscopia de NP que muestra BE sin lesiones visibles; E: Biopsia teñida con H&E de NP que muestra ND; F: Patrones de biomarcadores en la biopsia ND de NP que muestran ausencia de cambios de alto riesgo (superior izquierda: p53, p16, AMACR, Hoechst, superior derecha: HER2/neu, K20, Hoechst, inferior izquierda: CD68, COX-2, Hoechst, inferior derecha: HIF-1a, CD45RO, Hoechst.FIG. 3. Detection of high-risk characteristics that precede morphological changes in BE. Endoscopy, H&E, and multiplexed fluorescence biomarkers images are shown for one patient with incident progression (IP) panels AC) and one patient without progression (NP) (panels DF) diagnosed by BE subspecialist Gl ND. The PI patient progressed to HGD (high-grade dysplasia) 6.3 years later and was classified as high risk by the 15-characteristic classifier. The PN patient had 7.8 years of endoscopic surveillance that showed no progression to HGD / CAD and was classified as low risk. A: IP endoscopy image showing BE without visible lesions; B: H&E stained biopsy of IP showing ND; C: Biomarker patterns in IP ND biopsy (upper left fragment: p53, p16, AMACR, Hoechst, upper right: HER2 / neu, K20, Hoechst, lower left: CD68, COX-2, Hoechst, lower right: HIF -1a, CD45RO, Hoechst; D: PN endoscopy image showing BE without visible lesions; E: H&E stained biopsy of PN showing ND; F: Biomarker patterns in PN biopsy ND showing absence of changes in high risk (upper left: p53, p16, AMACR, Hoechst, upper right: HER2 / neu, K20, Hoechst, lower left: CD68, COX-2, Hoechst, lower right: HIF-1a, CD45RO, Hoechst.
FIG. 4. Validación del clasificador de riesgo de 15 características en un conjunto de validación independiente de pacientes con BE. Panel A: Curva ROC para el clasificador de riesgo de 15 entidades en el conjunto de validación. Paneles B, C y D: Análisis de KM de la probabilidad de progresión a HGD/EAC en el conjunto de validación de pacientes con puntuación de riesgo bajo, intermedio y alto mediante el clasificador de riesgo de 15 características en pacientes de las cuatro instituciones, instituciones estadounidenses y AMC, respectivamente. E: HR y OR (IC del 95 %) para comparaciones entre grupos de riesgo. F: Tasa de progresión a los 5 años en función continua de la puntuación de riesgo.FIG. 4. Validation of the 15-characteristic risk classifier in an independent validation set of patients with BE. Panel A: ROC curve for the risk classifier of 15 entities in the validation set. Panels B, C and D: KM analysis of the probability of progression to HGD / CAD in the validation set of patients with low, intermediate and high risk scores using the risk classifier of 15 characteristics in patients from the four institutions, US institutions and AMC, respectively. E: HR and OR (95% CI) for comparisons between risk groups. F: Progression rate at 5 years as a continuous function of the risk score.
FIG. 5. Diagrama de flujo de etapas para capacitar y validar el clasificador de 3 niveles y 15 características/mediciones para la predicción de riesgos en biopsias de esófago de Barrett.FIG. 5. Flowchart of stages to train and validate the 3-level classifier and 15 characteristics / measurements for the prediction of risks in Barrett's esophagus biopsies.
FIG. 6. Rendimiento del clasificador de riesgo de 3 niveles en la estratificación de pacientes con BE con HGD/EAC prevalente a partir de pacientes con BE sin progresión. Panel A: Curva ROC para clasificador de riesgo de 3 niveles basado en el resultado binario de bajo/alto. Panel B: Análisis de KM de la probabilidad de diagnóstico posterior de HGD/EAC en pacientes con puntuación de riesgo bajo, intermedio y alto mediante el clasificador de riesgo. Panel C: HR y OR univariantes con IC del 95 % para comparaciones entre los grupos de riesgo previstos por el clasificador.FIG. 6. Performance of the 3-level risk classifier in stratifying BE patients with prevalent HGD / CAD from patients with progression-free BE. Panel A: ROC curve for 3-level risk classifier based on binary low / high result. Panel B: KM analysis of the probability of subsequent diagnosis of HGD / CAD in patients with low, intermediate and high risk scores using the risk classifier. Panel C: univariate HR and OR with 95% CI for comparisons between risk groups predicted by the classifier.
La FIG. 7 ilustra un proceso clasificador de riesgo de 3 niveles y 15 características y la puntuación de riesgo (0 10) y la clase (baja, intermedia o alta) se calculan a partir de la suma ajustada y ponderada por coeficientes de 15 mediciones (características) de análisis de imágenes cuantitativas procedentes de 9 biomarcadores basados en proteínas y morfología de la siguiente manera: 1) Mareaje de portaobjetos de inmunofluorescencia multiplexados - Las secciones seriadas de las biopsias de BE FFPE están inmunomarcadas con fluorescencia para p16, AMACR, p53, HER2, K20, CD68, COX-2, HIF-1a y CD45RO, más Hoechst; 2) Escaneo de fluorescencia de portaobjetos completo - Se obtienen imágenes de portaobjetos marcados mediante un escaneo de fluorescencia de portaobjetos completo que genera datos de imagen en cada biomarcador y núcleo; 3) Análisis de imagen automatizado: Las imágenes de tejido se analizan mediante un programa informático de análisis de imágenes automatizado para extraer 15 características de los 9 biomarcadores basados en proteínas y Hoechst; 4) Clasificación de riesgo: Las 15 características se ajustan utilizando parámetros de centro y ajuste definidos en un estudio de capacitación, ponderado luego por los coeficientes procedentes del análisis de regresión de Cox univariante de las características y los resultados de progresión en el estudio de capacitación como se describe en el presente documento.FIG. 7 illustrates a 3-level, 15-characteristic risk classification process and the risk score (0 10) and class (low, intermediate, or high) are calculated from the adjusted sum and weighted by coefficients of 15 measurements (characteristics) of quantitative image analysis from 9 protein-based and morphology-based biomarkers as follows: 1) Labeling of multiplexed immunofluorescence slides - Serial sections of BE FFPE biopsies are immunolabelled with fluorescence for p16, AMACR, p53, HER2, K20, CD68, COX-2, HIF-1a and CD45RO, plus Hoechst; 2) Full-Slide Fluorescence Scan - Labeled slides are imaged by a full-slide fluorescence scan that generates image data on each biomarker and nucleus; 3) Automated Image Analysis: Tissue images are analyzed by automated image analysis computer program to extract 15 features of the 9 protein-based and Hoechst biomarkers; 4) Risk classification: The 15 characteristics are adjusted using center and fit parameters defined in a training study, then weighted by the coefficients from the univariate Cox regression analysis of the characteristics and the progression results in the training study. as described in this document.
La FIG. 8 ilustra el rendimiento de la puntuación de riesgo de 15 características en biopsias de BE no displásicas y con LGD de pacientes sin progresión y pacientes con HGD/EAC prevalente. Panel A: Curva ROC para la puntuación de riesgo de 15 características y porcentaje de células que sobreexpresan p53 (determinada por un programa informático de análisis de imágenes como se describió anteriormente (Ejemplo 3, referencia 19). Panel B: Gráficos de caja y bigotes de la puntuación de riesgo de 15 características en los casos de no progresión y prevalentes (p < 0,0001, prueba de suma de rango de Wilcoxon que compara casos de no progresión frente a todos los prevalentes). Panel C: OR univariantes con IC del 95 % y valores p de regresión logística para comparaciones entre las clases de riesgo previstas. Panel D: Número de casos con puntuación de riesgo bajo, intermedio (Ínter) y alto mediante diagnóstico patológico del subespecialista Gl. Panel E: Tasa de diagnóstico posterior de HGD/EAC como una función continua de la puntuación de riesgo de 15 características. Las curvas discontinuas indican IC del 95 %. El gráfico de alfombra en el eje x muestra la puntuación de riesgo para los controles de no progresión (guiones negros) y los casos prevalentes (guiones rojos), y se muestran valores de corte para riesgo bajo, Ínter y alto.FIG. 8 illustrates the performance of the 15-feature risk score in LGD and nondysplastic BE biopsies from patients without progression and patients with prevalent HGD / CAD. Panel A: ROC curve for the risk score of 15 characteristics and percentage of cells that overexpress p53 (determined by an image analysis computer program as described above (Example 3, reference 19). Panel B: Box-and-whisker plots of the risk score of 15 characteristics in non-progression and prevalent cases (p <0.0001, Wilcoxon rank sum test that compares non-progression cases versus all prevalent cases). Panel C: univariate OR with CI 95% and logistic regression p-values for comparisons between predicted risk classes Panel D: Number of cases with low, intermediate (Inter) and high risk scores by pathological diagnosis by the Gl subspecialist Panel E: Post diagnosis rate of HGD / EAC as a continuous function of the risk score of 15 characteristics. The dashed curves indicate 95% CI. The carpet plot on the x-axis shows the risk score for non-progression controls (black dashes) and prevalent cases (red dashes), and cutoff values for low, inter, and high risk are shown.
La FIG. 9 ilustra imágenes representativas de biomarcadores de alto riesgo en biopsias de BE. Los paneles A-D muestran una biopsia ND de un paciente que tenía HGD en la endoscopia repetida 310 días después; A: p53, AMACR, Hoechst, B: HER2/neu, Hoechst. C: CD68, COX-2, Hoechst, D: HIF-1a, CD45RO, Hoechst. Los paneles E-H muestran una biopsia de LGD de un paciente que tuvo HGD en la endoscopia repetida 56 días después; E: p53, AMACR, Hoechst; F: HER2/neu, Hoechst. G: CD68, COX-2, H: HIF-1a, CD45RO, Hoechst. Los paneles l-L muestran una biopsia de LGD de un paciente que tuvo HGD en la endoscopia repetida 60 días después; I: p53, AMACR, Hoechst; J: HER2/neu, Hoechst. K: CD68, COX-2, Hoechst, L: HIF-1a, CD45RO, Hoechst. Los paneles M-P muestran una biopsia ND de un paciente de no progresión con un tiempo de vigilancia libre de HGD/EAC de 2.186 días; M: p53, AMACR, Hoechst; N: HER2/neu, Hoechst. O: CD68, COX-2, Hoechst; P: HIF-1a, CD45RO, Hoechst.FIG. 9 illustrates representative images of high-risk biomarkers in BE biopsies. Panels AD show an ND biopsy from a patient who had HGD on repeat endoscopy 310 days later; A: p53, AMACR, Hoechst, B: HER2 / neu, Hoechst. C: CD68, COX-2, Hoechst, D: HIF-1a, CD45RO, Hoechst. Panels EH show a LGD biopsy from a patient who had HGD on repeat endoscopy 56 days later; E: p53, AMACR, Hoechst; F: HER2 / neu, Hoechst. G: CD68, COX-2, H: HIF-1a, CD45RO, Hoechst. Panels lL show a LGD biopsy from a patient who had HGD on repeat endoscopy 60 days later; I: p53, AMACR, Hoechst; J: HER2 / neu, Hoechst. K: CD68, COX-2, Hoechst, L: HIF-1a, CD45RO, Hoechst. The MP panels show an ND biopsy from a non-progression patient with a HGD / CAD-free surveillance time of 2,186 days; M: p53, AMACR, Hoechst; N: HER2 / neu, Hoechst. Or: CD68, COX-2, Hoechst; P: HIF-1a, CD45RO, Hoechst.
La FIG. 10 ilustra imágenes representativas de biomarcadores de alto riesgo y puntuaciones de riesgo en múltiples niveles endoscópicos. Los paneles A-E y los paneles F-J muestran una biopsia de LGD y una biopsia ND, respectivamente, de un paciente con segmento de BE de 2 cm que tuvo HGD en la endoscopia repetida 56 días después. Las imágenes muestran anomalías epiteliales y estromales similares en las biopsias a pesar de la diferencia en el diagnóstico. Las puntuaciones de riesgo de 15 características para las biopsias LGD y ND fueron 8,7 y 8,9 (ambas de alto riesgo), respectivamente. Paneles A-E Biopsia LGD - A: H&E, B: p53, AMACR, Hoechst; C: HER2/neu, Hoechst. D: CD68, COX-2, Hoechst; E: HIF-1a, CD45RO, Hoechst. Paneles F-J Biopsia ND - F: H&E, G: p53, AMACR, Hoechst; H: HER2/neu, Hoechst. I: CD68, COX-2, Hoechst; J: HIF-1a, CD45RO, Hoechst.FIG. 10 illustrates representative images of high-risk biomarkers and risk scores at multiple endoscopic levels. Panels A-E and panels F-J show an LGD biopsy and a ND biopsy, respectively, from a patient with a 2 cm BE segment who had HGD on repeat endoscopy 56 days later. The images show similar epithelial and stromal abnormalities on biopsies despite the difference in diagnosis. The 15-feature risk scores for the LGD and ND biopsies were 8.7 and 8.9 (both high risk), respectively. Panels A-E Biopsy LGD-A: H&E, B: p53, AMACR, Hoechst; C: HER2 / neu, Hoechst. D: CD68, COX-2, Hoechst; E: HIF-1a, CD45RO, Hoechst. Panels F-J Biopsy ND-F: H&E, G: p53, AMACR, Hoechst; H: HER2 / neu, Hoechst. I: CD68, COX-2, Hoechst; J: HIF-1a, CD45RO, Hoechst.
Descripción detalladaDetailed description
Debe entenderse que esta descripción detallada de metodologías particulares tiene el propósito de ilustrar únicamente y que la presente invención no pretende limitarse a ellas. También debe entenderse que la terminología utilizada en la descripción tiene el propósito de describir las versiones o realizaciones particulares únicamente, y no pretende limitar el alcance a menos que se indique explícitamente. A menos que se definan de otro modo, todos los términos técnicos y científicos que se usan en el presente documento tienen el mismo significado que el entendido habitualmente por un experto en la técnica.It should be understood that this detailed description of particular methodologies is for the purpose of illustration only and that the present invention is not intended to be limited thereto. It should also be understood that the terminology used in the description is for the purpose of describing particular versions or embodiments only, and is not intended to limit the scope unless explicitly stated. Unless defined otherwise, all technical and scientific terms used herein have the same meaning as commonly understood by one of ordinary skill in the art.
También cabe destacar que tal como se usa en el presente documento y en las reivindicaciones adjuntas, las formas en singular "un", "uno/una" y "el/la" incluyen las referencias en plural, salvo que el contexto indique claramente otra cosa.It should also be noted that as used herein and in the appended claims, the singular forms "a", "an / an" and "the" include plural references, unless the context clearly indicates otherwise. thing.
Como se usa en este documento, los términos "comprenden", "tienen", e "incluyen" y sus conjugados, como se usa en el presente documento, significan "incluyendo, pero sin limitación". Mientras que varias composiciones, métodos y dispositivos se describen en términos de "que comprenden" varios componentes o etapas (interpretados en el sentido de "que incluyen, pero sin limitación"), las composiciones, métodos y dispositivos también pueden "consistir esencialmente en" o "consistir en" los diversos componentes y etapas, y dicha terminología debe interpretarse como la definición de grupos esencialmente de miembros cerrados.As used herein, the terms "comprise", "have", and "include" and their conjugates, as used herein, mean "including, but not limited to." While various compositions, methods, and devices are described in terms of "comprising" various components or steps (interpreted to mean "including, but not limited to"), compositions, methods, and devices may also "consist essentially of" or "consist of" the various components and stages, and such terminology is to be interpreted as defining essentially closed-member groups.
Los acrónimos de los biomarcadores utilizados en el presente documento se definen en la Tabla 1. Otros acrónimos no definidos específicamente en el presente documento tienen su significado conocido por un experto en la materia.The acronyms of the biomarkers used herein are defined in Table 1. Other acronyms not specifically defined herein have their meanings known to one of ordinary skill in the art.
Tabla 1: Lista de biomarcadoresTable 1: List of biomarkers

Como se usa en el presente documento, el término "biomarcador" significa cualquier analito, metabolito, ácido nucleico, secuencia de aminoácidos o fragmentos de la misma, poliproteína, complejo de proteínas, molécula, o compuesto químico que se produce, metaboliza, cataboliza, secreta, fagocita, o expresa por una célula o tejido y que proporciona una medida útil de la presencia, ausencia o cantidad de un determinado tipo de célula o característica descriptiva indicativa de, característica de o sugestiva de un diagnóstico de una enfermedad o trastorno particular. Los biomarcadores usados en los métodos de la presente invención son las moléculas identificadas en la Tabla 1. Los biomarcadores pueden ser la medida de los niveles de expresión del receptor, activación del factor de transcripción; ubicación o cantidad o actividad de una proteína, polinucleótido, orgánulo y similares; el estado de fosforilación de una proteína, relación de una proteína entre compartimentos celulares y compartimentos tisulares, relación de una proteína a otra proteína, ubicación conjunta o expresión conjunta de al menos dos proteínas, etc. El biomarcador puede ser un ácido nucleico (por ejemplo, ADN, ARN, incluyendo micro ARN, ARNnp, ARNm, ARNr, etc.), un receptor, un antígeno de la membrana celular, un antígeno intracelular y un antígeno extracelular, una molécula de señalización, una proteína, y similares sin limitación, lípidos, lipoproteínas, proteínas, citocinas, quimiocinas, factores de crecimiento, péptidos, ácidos nucleicos, genes y oligonucleótidos, junto con sus complejos relacionados, metabolitos, mutaciones, las variantes, polimorfismos, modificaciones, fragmentos, subunidades, productos de degradación, elementos y otros analitos o medidas procedentes de la muestra. Un biomarcador también puede incluir una proteína o proteínas mutadas, un ácido nucleico mutado o ácidos nucleicos mutados, variaciones en el número de copias y/o variantes de transcripción, en circunstancias en las que dichas mutaciones, variaciones en el número de copias y/o variantes de transcripción son útiles para generar un modelo predictivo, o son útiles en modelos predictivos desarrollados usando marcadores relacionados (por ejemplo, versiones no mutadas de las proteínas o ácidos nucleicos, transcripciones alternativas, etc.).As used herein, the term "biomarker" means any analyte, metabolite, nucleic acid, amino acid sequence or fragments thereof, polyprotein, protein complex, molecule, or chemical compound that is produced, metabolized, catabolized, secretes, phagocytes, or expresses by a cell or tissue and provides a useful measure of the presence, absence, or quantity of a particular cell type or descriptive characteristic indicative of, characteristic of, or suggestive of a diagnosis of a particular disease or disorder. The biomarkers used in the methods of the present invention are the molecules identified in Table 1. Biomarkers can be the measure of receptor expression levels, transcription factor activation; location or amount or activity of a protein, polynucleotide, organelle, and the like; the phosphorylation state of a protein, ratio of a protein between cell compartments and tissue compartments, ratio of one protein to another protein, co-location or joint expression of at least two proteins, etc. The biomarker can be a nucleic acid (for example, DNA, RNA, including microRNA, npRNA, mRNA, rRNA, etc.), a receptor, a cell membrane antigen, an intracellular antigen and an extracellular antigen, a molecule of signaling, a protein, and the like without limitation, lipids, lipoproteins, proteins, cytokines, chemokines, growth factors, peptides, nucleic acids, genes, and oligonucleotides, together with their related complexes, metabolites, mutations, variants, polymorphisms, modifications, fragments, subunits, degradation products, elements, and other analytes or measurements from the sample. A biomarker can also include a mutated protein (s), a mutated nucleic acid (s), copy number variations, and / or transcription variants, in circumstances where such mutations, Variations in copy number and / or transcription variants are useful in generating a predictive model, or are useful in predictive models developed using related markers (eg, non-mutated versions of proteins or nucleic acids, alternate transcripts, etc.) .
Como se usa en el presente documento, la enfermedad es un trastorno gastrointestinal. Como se usa en el presente documento, la expresión "trastorno gastrointestinal" se refiere a cualquier enfermedad o anomalía relacionada con el tubo digestivo que incluye, pero no necesariamente se limita a, una o más de las siguientes afecciones: dolor abdominal, enfermedad de reflujo gastroesofágico (ERGE), estreñimiento, diarrea, diverticulosis, hemorragia gastrointestinal, cáncer de estómago, cáncer esofágico, cáncer de intestino, cáncer de colon, esófago de Barrett, enfermedad del intestino irritable, colitis infecciosa, colitis ulcerosa, enfermedad de Crohn, colitis isquémica, colitis por radiación, síndrome de intestino irritable, perforación aguda, íleon, apendicitis, abscesos intraabdominales, obstrucción intestinal, gastritis, gastritis atrófica metaplásica autoinmunitaria, úlceras en el estómago, enfermedad de úlcera péptica, dispepsia, tumores estromales gastrointestinales, tumores del intestino delgado, síndrome del músculo elevador, enfermedad pilonidal, proctitis, fístulas, fisuras, incontinencia.As used herein, the disease is a gastrointestinal disorder. As used herein, the term "gastrointestinal disorder" refers to any disease or abnormality related to the digestive tract that includes, but is not necessarily limited to, one or more of the following conditions: abdominal pain, reflux disease gastroesophageal (GERD), constipation, diarrhea, diverticulosis, gastrointestinal bleeding, stomach cancer, esophageal cancer, bowel cancer, colon cancer, Barrett's esophagus, irritable bowel disease, infectious colitis, ulcerative colitis, Crohn's disease, ischemic colitis , radiation colitis, irritable bowel syndrome, acute perforation, ileum, appendicitis, intra-abdominal abscess, intestinal obstruction, gastritis, autoimmune metaplastic atrophic gastritis, stomach ulcers, peptic ulcer disease, dyspepsia, gastrointestinal stromal tumors, small intestine tumors , levator muscle syndrome, pilonidal disease, proctitis, fistul ace, fissures, incontinence.
La expresión "subclase del esófago de Barrett" se refiere a cualquier presentación del esófago de Barrett clasificada como con una combinación común de una o más características descriptivas. Una subclase del esófago de Barrett puede referirse a una de las siguientes afecciones: esófago de Barrett, sin displasia, sin progresión en 5 años; esófago de Barrett, sin displasia, progresión a displasia de grado bajo/alto en 5 años; esófago de Barrett, indefinido para displasia, sin progresión en 5 años; esófago de Barrett, indefinido para displasia, progresión a adenocarcinoma o displasia de grado bajo/alto en 5 años; esófago de Barrett, atipia reactiva; esófago de Barrett, displasia de bajo grado, sin progresión en 5 años; esófago de Barrett, displasia de bajo grado, progresión a adenocarcinoma o displasia de alto grado en 5 años; esófago de Barrett, displasia de alto grado; adenocarcinoma de esófago que surge en un antecedente de esófago de Barrett. La subclase de esófago de Barrett puede referirse a una de las siguientes afecciones: displasia de bajo grado, displasia de alto grado, atipia reactiva, indefinida para displasia o esófago de Barrett indeterminado. La subclase de esófago de Barrett puede referirse a una cualquiera de las siguientes afecciones: epitelio columnar de tipo fúndico gástrico, epitelio columnar de tipo cardiaco o epitelio columnar de tipo intestinal con o sin células caliciformes presentes sobre la unión gastroesofágica.The term "Barrett's esophagus subclass" refers to any presentation of Barrett's esophagus classified as having a common combination of one or more descriptive features. A subclass of Barrett's esophagus may refer to one of the following conditions: Barrett's esophagus, no dysplasia, no progression within 5 years; Barrett's esophagus, no dysplasia, progression to low / high grade dysplasia in 5 years; Barrett's esophagus, undefined for dysplasia, without progression in 5 years; Barrett's esophagus, undefined for dysplasia, progression to adenocarcinoma, or low / high-grade dysplasia in 5 years; Barrett's esophagus, reactive atypia; Barrett's esophagus, low-grade dysplasia, no progression in 5 years; Barrett's esophagus, low-grade dysplasia, progression to adenocarcinoma or high-grade dysplasia in 5 years; Barrett's esophagus, high-grade dysplasia; Adenocarcinoma of the esophagus arising from a history of Barrett's esophagus. Barrett's esophagus subclass may refer to one of the following conditions: low-grade dysplasia, high-grade dysplasia, reactive atypia, indefinite for dysplasia, or indeterminate Barrett's esophagus. Barrett's esophagus subclass may refer to any one of the following conditions: gastric fundic-type columnar epithelium, cardiac-type columnar epithelium, or intestinal-type columnar epithelium with or without goblet cells present over the gastroesophageal junction.
Como se usa en el presente documento, las expresiones "muestra de células", "muestra de tejido", o "muestra" significa una composición que comprende una célula aislada o una pluralidad de células. La muestra puede comprender una célula individual, una composición que comprende una pluralidad de células, una muestra de tejido tomada de un sujeto con un trastorno gastrointestinal, una muestra de tejido, una pluralidad de células del tracto gastrointestinal, o una pluralidad de células esofágicas. La muestra puede ser recién obtenida, fijada con formalina, fijada en alcohol y/o incluida en parafina. La muestra de células puede ser una biopsia aislada de un sujeto que ha sido diagnosticado con, se sospecha que tiene, o se ha identificado que tiene, uno o más trastornos gastrointestinales, epitelio columnar de tipo fúndico gástrico, epitelio columnar de tipo cardiaco o epitelio columnar de tipo intestinal con o sin células caliciformes presentes sobre la unión gastroesofágica o esófago de Barrett. La muestra puede comprender un tejido de un cepillado, raspado, biopsia por punción, biopsia por pellizco o resección quirúrgica de un sujeto. La muestra puede aislarse de un paciente humano en uno o más puntos temporales, de manera que al menos una muestra de tejido se aísle de cada punto temporal del mismo paciente. La muestra puede aislarse de múltiples ubicaciones espaciales del mismo paciente en el mismo punto temporal, incluyendo diferentes niveles endoscópicos. La muestra puede aislarse mediante muestreo aleatorio de áreas afectadas por trastornos gastrointestinales o esófago de Barrett o mediante técnicas guiadas por imágenes. La muestra puede incluir una sola célula o múltiples células o fragmentos de células o una alícuota de líquido corporal, tomado de un sujeto, por medios que incluyen venopunción, excreción, eyaculación, masaje, biopsia, aspiración con aguja, muestra de lavado, raspado, incisión quirúrgica o intervención u otros medios conocidos en la materia. La muestra se puede obtener por el sujeto o por un tercero, por ejemplo, un profesional médico. Ejemplos de profesionales médicos incluyen médicos, técnicos de emergencias médicas, enfermeras, personal de servicios de emergencia, psicólogos, personal físico médica, enfermera practicante, cirujanos, dentistas y cualquier otro profesional médico obvio que conozca un experto en la materia. Una muestra puede incluir células sanguíneas periféricas, leucocitos aislados o ARN extraído de células sanguíneas periféricas o leucocitos aislados. La muestra puede ser una pluralidad de muestras tomadas a múltiples niveles endoscópicos discretos. Por ejemplo, se toman diferentes muestras de un sujeto a diferentes niveles endoscópicos y se prepara una puntuación basada en la totalidad de las muestras en lugar de una sola muestra.As used herein, the terms "cell sample", "tissue sample", or "sample" means a composition comprising an isolated cell or a plurality of cells. The sample may comprise a single cell, a composition comprising a plurality of cells, a tissue sample taken from a subject with a gastrointestinal disorder, a tissue sample, a plurality of cells from the gastrointestinal tract, or a plurality of esophageal cells. The sample can be fresh, formalin-fixed, alcohol-fixed, and / or paraffin-embedded. The cell sample may be an isolated biopsy from a subject who has been diagnosed with, suspected to have, or has been identified to have one or more gastrointestinal disorders, gastric fundic-type columnar epithelium, cardiac-type columnar epithelium, or epithelium. Columnar intestinal type with or without goblet cells present over the gastroesophageal junction or Barrett's esophagus. The sample may comprise tissue from a brushing, scraping, needle biopsy, pinch biopsy, or surgical resection of a subject. The sample can be isolated from a human patient at one or more time points, such that at least one tissue sample is isolated from each time point of the same patient. The sample can be isolated from multiple spatial locations of the same patient at the same time point, including different endoscopic levels. The sample can be isolated by random sampling from areas affected by gastrointestinal disorders or Barrett's esophagus or by image-guided techniques. The sample may include a single cell or multiple cells or cell fragments or an aliquot of body fluid, taken from a subject, by means including venipuncture, excretion, ejaculation, massage, biopsy, needle aspiration, wash sample, scrape, surgical incision or intervention or other means known in the art. The sample can be obtained by the subject or by a third party, for example, a medical professional. Examples of medical professionals include physicians, EMTs, nurses, emergency services personnel, psychologists, medical physicists, nurse practitioners, surgeons, dentists, and any other obvious medical professional known to an expert in the field. A sample can include peripheral blood cells, isolated leukocytes, or RNA extracted from peripheral blood cells or isolated leukocytes. The sample can be a plurality of samples taken at multiple discrete endoscopic levels. For example, different samples are taken from a subject at different endoscopic levels and a score is prepared based on all of the samples rather than a single sample.
Como se usa en el presente documento, la expresión "características de análisis de imágenes" se refiere a las mediciones cuantitativas de biomarcadores y morfología dentro de objetos de imagen, incluyendo: características de intensidad de píxeles de los biomarcadores (media, suma, desviación estándar, momento); porcentajes de objetos que exhiben expresión alterada (sobreexpresión, expresión reducida o pérdida de expresión de biomarcadores); características de la relación de intensidad de píxeles (relación de un biomarcador entre diferentes compartimentos subcelulares, relación de un biomarcador a otro en el mismo o en un compartimento subcelular diferente); expresión conjunta o ubicación conjunta de dos o más biomarcadores dentro de la misma célula o dentro del mismo compartimento subcelular; textura de las señales de biomarcadores según lo evaluado mediante matrices de ocurrencia conjunta; morfometría, incluyendo el área objeto, diámetro equivalente, solidez, excentricidad. Las características se pueden ubicar en objetos segmentados basados en células, objetos estructurales de tejido, tipos de células específicas, incluyendo células epiteliales, células endoteliales y células estromales, poblaciones específicas definidas mediante niveles de expresión de 1, 2 o 3 biomarcadores, y para obtener imágenes de microambientes o imágenes de regiones. La medida cuantitativa se puede transformar usando las ecuaciones descritas en el presente documento usando los coeficientes que se describen en el presente documento, por ejemplo, en la Tabla 2. Un experto en la materia entendería cómo transformar las mediciones en la puntuación bruta basándose en la divulgación en el presente documento y el conocimiento del experto en la materia.As used herein, the term "image analysis characteristics" refers to quantitative measurements of biomarkers and morphology within image objects, including: pixel intensity characteristics of biomarkers (mean, sum, standard deviation , moment); percentages of objects exhibiting altered expression (overexpression, reduced expression, or loss of biomarker expression); pixel intensity ratio characteristics (ratio of a biomarker between different subcellular compartments, ratio of one biomarker to another in the same or a different subcellular compartment); co-expression or co-location of two or more biomarkers within the same cell or within the same subcellular compartment; texture of biomarker signals as assessed by co-occurrence matrices; morphometry, including target area, equivalent diameter, solidity, eccentricity. Features can be located in cell-based segmented objects, tissue structural objects, types of specific cells, including epithelial cells, endothelial cells, and stromal cells, specific populations defined by expression levels of 1, 2, or 3 biomarkers, and for imaging of microenvironments or imaging of regions. The quantitative measure can be transformed using the equations described herein using the coefficients described herein, for example in Table 2. One skilled in the art would understand how to transform the measurements into the raw score based on the disclosure in this document and the knowledge of the expert in the field.
Como se usa en el presente documento, el término "control" significa tejido esofágico sano, tejido de esófago de Barrett sin displasia, tejido del esófago de Barrett de un sujeto que no progresó a displasia de grado bajo o grado alto, o a carcinoma de esófago.As used herein, the term "control" means healthy esophageal tissue, Barrett's esophagus tissue without dysplasia, Barrett's esophagus tissue from a subject that did not progress to low-grade or high-grade dysplasia, or carcinoma of the esophagus. .
Como se usa en el presente documento, el término "convertir" significa someter las características a una función de interpretación o algoritmo para un modelo predictivo de enfermedad. La función de interpretación también se puede producir mediante una pluralidad de modelos predictivos, tales como un modelo de regresión, una puntuación o clasificador bayesiano. La función de interpretación puede comprender uno o más términos asociados con uno o más biomarcadores o conjuntos de biomarcadores, uno o más términos asociados con la presencia o ausencia o distribución espacial de los tipos de células específicos desvelados en el presente documento. La función de interpretación comprende uno o más términos asociados con la presencia, ausencia, cuantía, intensidad o distribución espacial de las características morfológicas de una célula en una muestra.As used herein, the term "convert" means to subject the characteristics to an interpretation function or algorithm for a predictive disease model. The interpretation function can also be produced by a plurality of predictive models, such as a regression model, a score, or a Bayesian classifier. The interpretation function may comprise one or more terms associated with one or more biomarkers or sets of biomarkers, one or more terms associated with the presence or absence or spatial distribution of the specific cell types disclosed herein. The interpretation function comprises one or more terms associated with the presence, absence, amount, intensity or spatial distribution of the morphological characteristics of a cell in a sample.
Como se usa en el presente documento, el término "ubicación" se refiere a un compartimento subcelular, célula completa o compartimento tisular. Los compartimentos subcelulares incluyen el núcleo, citoplasma, membrana plasmática y membrana nuclear. Los compartimentos tisulares incluyen el epitelio superficial, glándulas, lámina propia, estroma, capa muscular de la mucosa y tumor.As used herein, the term "location" refers to a subcellular compartment, whole cell, or tissue compartment. Subcellular compartments include the nucleus, cytoplasm, plasma membrane, and nuclear membrane. Tissue compartments include the superficial epithelium, glands, lamina propria, stroma, mucosal muscle layer, and tumor.
Como se usa en el presente documento, el término "sonda" se refiere a cualquier molécula que se una o se intercala con un biomarcador, de manera covalente o no covalente, es decir, anticuerpos, moléculas de ADN o ARN. Las sondas pueden incluir conjuntos de sondas que incluyen una o más sondas que se unen a un único biomarcador. La expresión "conjunto de sondas" es a veces intercambiable para un grupo de dos o más sondas que permiten la detección de uno o más biomarcadores. La sonda o las sondas pueden marcarse con fluorescencia. La sonda marcada con fluorescencia puede ser específica para al menos un biomarcador. El grupo de sondas marcadas con fluorescencia puede detectar al menos aproximadamente dos biomarcadores diferentes. Cada sonda marcada con fluorescencia puede tener diferentes propiedades fluorescentes, que son suficientes para distinguir las diferentes sondas marcadas con fluorescencia en el grupo.As used herein, the term "probe" refers to any molecule that binds to or intercalates with a biomarker, covalently or non-covalently, ie, antibodies, DNA or RNA molecules. Probes can include probe sets that include one or more probes that bind to a single biomarker. The term "probe set" is sometimes interchangeable for a group of two or more probes that allow the detection of one or more biomarkers. The probe (s) can be fluorescently labeled. The fluorescently labeled probe can be specific for at least one biomarker. The pool of fluorescently labeled probes can detect at least about two different biomarkers. Each fluorescently labeled probe can have different fluorescent properties, which are sufficient to distinguish the different fluorescently labeled probes in the cluster.
Los términos "reactivos" o "grupo de reactivos" se refieren a cualquier sustancia o mezcla para usar en análisis químico u otra reacción conocida por los expertos en la materia; es decir, tintes, disolventes, catalizadores, enzimas, patrones, moléculas orgánicas o inorgánicas.The terms "reagents" or "group of reagents" refer to any substance or mixture for use in chemical analysis or other reaction known to those of skill in the art; that is, dyes, solvents, catalysts, enzymes, standards, organic or inorganic molecules.
La expresión "escáner óptico" se utiliza en toda la memoria descriptiva para describir cualquier dispositivo o serie de dispositivos que genere datos de imagen a partir de una muestra de células o conjunto de muestras de células o muestras de tejido. El escáner óptico se utiliza para describir cualquier dispositivo óptico o serie de dispositivos que generen datos de imágenes digitales a partir de una muestra o conjunto de muestras. El escáner óptico puede ser un microscopio conectado a un dispositivo óptico que genera datos de imágenes digitales, que, cuando se envía a un aparato de formación de imágenes, como una impresora láser, un lector de códigos de barras, un microscopio láser de barrido confocal, o una pantalla de imágenes (monitor), puede producir una imagen visible para un usuario. Como se usa en el presente documento, el término "relación" significa la relación entre la cantidad de un biomarcador y la cantidad de un biomarcador diferente en el mismo o diferente compartimento subcelular o compartimento tisular. También puede significar la relación entre la cantidad de un biomarcador en un compartimento subcelular y la cantidad del mismo biomarcador en otro compartimento subcelular dentro de la misma célula. También puede significar la relación entre la cantidad de un biomarcador en un compartimento tisular y la cantidad del mismo biomarcador en otro compartimento tisular dentro de la misma biopsia.The term "optical scanner" is used throughout the specification to describe any device or series of devices that generates image data from a cell sample or set of cell samples or tissue samples. Optical scanner is used to describe any optical device or series of devices that generate digital image data from a sample or set of samples. The optical scanner can be a microscope connected to an optical device that generates digital image data, which, when sent to an imaging apparatus such as a laser printer, a barcode reader, a confocal scanning laser microscope , or an image display (monitor), can produce an image viewable by a user. As used herein, the term "ratio" means the ratio of the amount of a biomarker to the amount of a different biomarker in the same or a different subcellular compartment or tissue compartment. It can also mean the ratio of the amount of a biomarker in one subcellular compartment to the amount of the same biomarker in another subcellular compartment within the same cell. It can also mean the ratio of the amount of a biomarker in one tissue compartment to the amount of the same biomarker in another tissue compartment within the same biopsy.
Como se usa en el presente documento, la expresión "intensidad de la suma de p53 nuclear" es la señal de la suma o total de p53 dentro de núcleos segmentados en una imagen digital de un tejido marcado con reactivos que incluyen un anticuerpo anti-p53 y un marcador nuclear.As used herein, the term "nuclear p53 summation intensity" is the signal of the sum or total of p53 within segmented nuclei in a digital image of tissue labeled with reagents that include an anti-p53 antibody. and a nuclear marker.
Como se usa en el presente documento, la expresión "intensidad media de p53 nuclear" es la media de la intensidad de señal de p53 dentro de núcleos segmentados en una imagen digital de un tejido marcado con reactivos que incluyen un anticuerpo anti-p53 y un marcador nuclear.As used herein, the term "mean nuclear p53 intensity" is the mean signal intensity of p53 within segmented nuclei in a digital image of tissue labeled with reagents including an anti-p53 antibody and a nuclear marker.
Como se usa en el presente documento, la expresión "relación de intensidad media de HER2/neu:intensidad media de K20 en grupos de núcleos" se refiere a la relación entre la intensidad de señal media de HER2/neu y la intensidad media de citoqueratina-20 dentro de grupos de núcleos segmentados en una imagen digital de un tejido marcado con reactivos que incluyen un anticuerpo anti-HER2, un anticuerpo anti-citoqueratina-20 y un marcador nuclear. As used herein, the term "ratio of mean HER2 / neu intensity: mean K20 intensity in clusters of nuclei" refers to the ratio between mean HER2 / neu signal intensity and mean cytokeratin intensity. -20 within clusters of nuclei segmented on a digital image of tissue labeled with reagents including an anti-HER2 antibody, an anti-cytokeratin-20 antibody, and a nuclear marker.
Como se usa en el presente documento, la expresión "relación de intensidad del 950cuantil de HER2/neu:intensidad del 95o cuantil de K20 en grupos de núcleos" se refiere a la relación entre la intensidad de señal del percentil 95 de HER2/neu y la intensidad de señal del percentil 95 de citoqueratina-20 dentro de grupos de núcleos segmentados en una imagen digital de un tejido marcado con reactivos que incluyen un anticuerpo anti-HER2, un anticuerpo anticitoqueratina-20 y un marcador nuclear.As used herein, the term "HER2 / neu 950quantile intensity ratio: K20 95th quantile intensity in clusters of nuclei" refers to the ratio between HER2 / neu 95th percentile signal intensity and the signal intensity of the 95th percentile of cytokeratin-20 within clusters of segmented nuclei in a digital image of tissue labeled with reagents including an anti-HER2 antibody, an anti-cytokeratin-20 antibody, and a nuclear marker.
Como se usa en el presente documento, la expresión "expresión conjunta de COX2 y CD68 celular" se refiere a la señal COX2 ubicada conjuntamente y la señal CD68 dentro de objetos celulares segmentados en una imagen digital de un tejido marcado con reactivos que incluye un anticuerpo anti-COX2, un anticuerpo anti-CD68 y un marcador nuclear.As used herein, the term "coexpression of cellular COX2 and CD68" refers to the co-located COX2 signal and the CD68 signal within segmented cellular objects in a digital image of a reagent-labeled tissue that includes an antibody. anti-COX2, an anti-CD68 antibody and a nuclear marker.
Como se usa en el presente documento, la expresión "intensidad media de p53 en grupos de núcleos" es la media de la intensidad de señal de p53 dentro de grupos de núcleos segmentados en una imagen digital de un tejido marcado con reactivos que incluyen un anticuerpo anti-p53 y un marcador nuclear.As used herein, the term "average intensity of p53 in clusters of nuclei" is the average of the signal intensity of p53 within clusters of segmented nuclei in a digital image of tissue labeled with reagents including an antibody. anti-p53 and a nuclear marker.
Como se usa en el presente documento, la expresión "solidez nuclear en células negativas para p16 que sobreexpresan p53" se refiere a la solidez de los bordes objeto de núcleos segmentados en células que exhiben sobreexpresión de p53 (por encima del umbral de positividad) y expresión reducida concomitante o pérdida de expresión de p16 (por debajo del umbral de positividad de p16) en una imagen digital de un tejido marcado con reactivos que incluyen un anticuerpo anti-p53, un anticuerpo anti-p16 y un marcador nuclear. Por ejemplo, la solidez de los bordes objetos de núcleos segmentados se calcula en una población de objetos basados en células segmentadas que pasan por dos filtros booleanos: la intensidad media de p53 nuclear es superior a 95 y la intensidad media de p16 celular es inferior a 100, en una escala de 0-1023 en imágenes de tejido de 10 bits, o una escala equivalente en imágenes de tejido de bits inferiores o superiores.As used herein, the term "nuclear robustness in p16-negative cells that overexpress p53" refers to the strength of the target edges of segmented nuclei in cells that exhibit p53 overexpression (above the threshold for positivity) and concomitant reduced expression or loss of expression of p16 (below the threshold for p16 positivity) in a digital image of tissue labeled with reagents including an anti-p53 antibody, an anti-p16 antibody, and a nuclear marker. For example, the robustness of the object edges of segmented nuclei is calculated on a population of objects based on segmented cells that pass through two Boolean filters: the mean intensity of nuclear p53 is greater than 95 and the mean intensity of cellular p16 is less than 100, on a scale of 0-1023 on 10-bit tissue images, or an equivalent scale on lower or higher-bit tissue images.
Como se usa en el presente documento, la expresión "intensidad de la suma de CD45RO en la membrana plasmática" es la señal de CD45RO total o suma dentro de los objetos de la membrana plasmática segmentada en una imagen digital de un tejido marcado con reactivos que incluye un anticuerpo anti-CD45RO y un marcador nuclear.As used herein, the term "CD45RO summation intensity at the plasma membrane" is the total or summation CD45RO signal within segmented plasma membrane objects in a digital image of tissue labeled with reagents that includes an anti-CD45RO antibody and a nuclear marker.
Como se usa en el presente documento, la expresión "desviación estándar AMACR en el microambiente" es la desviación estándar de la intensidad de señal de AMACR en objetos basados en células segmentadas ubicados en rectángulos de microambiente de 161 x 161 píxeles en una imagen digital de tejido marcado con reactivos que incluyen un anticuerpo anti-AMACR y un marcador nuclear.As used herein, the term "AMACR microenvironment standard deviation" is the standard deviation of the AMACR signal intensity in segmented cell-based objects located in 161 x 161 pixel microenvironment rectangles in a digital image of tissue labeled with reagents including an anti-AMACR antibody and a nuclear marker.
Como se usa en el presente documento, la expresión "textura de COX2 en el citoplasma" se refiere a la característica de textura de contraste extraída de una matriz de ocurrencia conjunta (descrita por Haralick RM, Shanmugam K, Dinstein I. Textural Features for Image Classification. IEEE Trans Syst Man Cybern B Cybern 1973; SMC-3: 610-21) y una medida de la intensidad de contraste de COX2 entre un píxel y su vecino en objetos de citoplasma segmentados en una imagen digital completa de un tejido marcado con reactivos que incluyen un anticuerpo anti-COX2 y un marcador nuclear.As used herein, the term "cytoplasmic COX2 texture" refers to the contrast texture characteristic extracted from a co-occurring matrix (described by Haralick RM, Shanmugam K, Dinstein I. Textural Features for Image Classification. IEEE Trans Syst Man Cybern B Cybern 1973; SMC-3: 610-21) and a measure of the intensity of COX2 contrast between a pixel and its neighbor in segmented cytoplasmic objects in a complete digital image of tissue marked with reagents including an anti-COX2 antibody and a nuclear marker.
Como se usa en el presente documento, la expresión "intensidad media de HIF-1a en el microambiente celular" es la media de la intensidad de señal de HIF1 alfa en objetos basados en células segmentadas ubicados en rectángulos de microambiente de 161 x 161 píxeles en una imagen digital de tejido marcado con reactivos que incluyen un anticuerpo anti-HIF1 alfa y un marcador nuclear.As used herein, the term "mean intensity of HIF-1a in the cellular microenvironment" is the mean of the signal intensity of HIF1 alpha in segmented cell-based objects located in 161 x 161 pixel microenvironment rectangles in a digital image of tissue labeled with reagents including an anti-HIF1 alpha antibody and a nuclear marker.
Como se usa en el presente documento, la expresión "momento de HIF-1a en el microambiente celular (producto de la media y la desviación estándar)" es la media de la intensidad de señal de HIF1 alfa multiplicada por la desviación estándar de la intensidad de señal de HIFIalfa en objetos basados en células segmentadas ubicados en rectángulos de microambiente de 161 x 161 píxeles en imagen digital de tejido marcado con reactivos que incluyen un anticuerpo anti-HIFIalfa y un marcador nuclear.As used herein, the term "moment of HIF-1a in the cellular microenvironment (product of mean and standard deviation)" is the mean of the signal intensity of HIF1 alpha multiplied by the standard deviation of the intensity. HIFIalpha signal on segmented cell-based objects located in 161 x 161 pixel microenvironment rectangles in digital image of tissue labeled with reagents including an anti-HIFIalpha antibody and a nuclear marker.
Como se usa en el presente documento, la expresión "intensidad media de p16 en el citoplasma" es la media de la intensidad de señal de p16 dentro de compartimentos del citoplasma segmentado en una imagen digital de un tejido marcado con reactivos que incluyen un anticuerpo anti-p16 y un marcador nuclear.As used herein, the term "average intensity of p16 in the cytoplasm" is the average signal intensity of p16 within compartments of the segmented cytoplasm in a digital image of tissue labeled with reagents that include an anti-antibody. -p16 and a nuclear marker.
Como se usa en el presente documento, la expresión "área nuclear en células negativas para pl6 que sobreexpresan p53" se refiere al área de, o al número de píxeles dentro de, núcleos objeto segmentados en células que exhiben sobreexpresión de p53 (por encima del umbral de positividad) y expresión reducida concomitante o pérdida de expresión de p16 (por debajo del umbral de positividad de p16) en una imagen digital de un tejido marcado con reactivos que incluyen un anticuerpo anti-p53, un anticuerpo anti-p16 y un marcador nuclear. Por ejemplo, el área de objetos de núcleos segmentados se calcula en una población de objetos basados en células segmentadas que pasan por dos filtros booleanos: la intensidad media de p53 nuclear es superior a 95 y la intensidad media de p16 celular es inferior a 100, en una escala de 0-1023 en imágenes de 10 bits de muestras, o una escala equivalente en imágenes de bits más bajos o más altos.As used herein, the term "core area in p53-negative cells that overexpress p53" refers to the area of, or the number of pixels within, segmented target nuclei in cells that exhibit p53 overexpression (above the threshold positivity) and concomitant reduced expression or loss of expression of p16 (below the threshold of p16 positivity) in a digital image of tissue labeled with reagents including an anti-p53 antibody, an anti-p16 antibody, and a marker nuclear. For example, the area of segmented nuclei objects is calculated on a population of segmented cell-based objects that pass through two Boolean filters: mean nuclear p53 intensity is greater than 95 and mean cellular p16 intensity is less than 100, on a scale of 0-1023 in 10-bit images of samples, or an equivalent scale in lower or higher bit images.
Como se usa en el presente documento, la expresión "intensidad del 95o cuantil nuclear de Hoechst" es el percentil 95 de la intensidad de señal de Hoechst dentro de objetos de núcleos segmentados en una imagen digital de un tejido marcado con reactivos que incluyen un marcador nuclear.As used herein, the term "Hoechst 95th nuclear quantile intensity" is the 95th percentile of Hoechst signal intensity within segmented nucleus objects in a digital image of tissue labeled with reagents that include a marker. nuclear.
Como se usa en el presente documento, la expresión "marcador nuclear" se refiere a la sustancia química histológica o fluorescente que se une a, o tiñe, los componentes de los núcleos, tales como el ADN, que cuando se obtienen imágenes se pueden utilizar para segmentar núcleos como objetos individuales con imágenes digitales. Como se usa en el presente documento, la expresión "grupos de núcleos" se refiere a la plantilla de análisis de imágenes que segmenta grupos de núcleos en una imagen digital de un tejido marcado con reactivos que incluye un marcador nuclear. Por ejemplo, una plantilla de grupos de núcleos se basa en el suavizado gaussiano en el canal Hoechst de una imagen digital de un tejido marcado con reactivos que incluyen Hoechst, seguido de un filtro de orden de clasificación, umbral de imagen usando el método de Otsu, operaciones morfológicas para eliminar objetos pequeños (imagen abierta (erosión seguida de una dilatación con el mismo elemento estructurante), cerrar (dilatación seguida de una erosión con el mismo elemento estructurante) y dilatar con un plano, elemento estructurante en forma de disco)) y finalmente marcar los componentes conectados.As used herein, the term "nuclear marker" refers to the histological or fluorescent chemical that binds to, or stains, components of nuclei, such as DNA, which when imaging can be used to segment nuclei as individual objects with digital images. As used herein, the term "clusters of nuclei" refers to the image analysis template that segments clusters of nuclei in a digital image of reagent-labeled tissue that includes a nuclear marker. For example, a core group template is based on Gaussian smoothing in the Hoechst channel of a digital image of a tissue labeled with reagents including Hoechst, followed by a sort order filter, image threshold using Otsu's method. , morphological operations to remove small objects (open image (erosion followed by dilation with the same structuring element), close (dilation followed by erosion with the same structuring element) and dilate with a plane, disc-shaped structuring element)) and finally mark the connected components.
Como se usa en el presente documento, la expresión "solidez nuclear" es una medida de la regularidad del contorno de la membrana nuclear, y se puede calcular como la relación entre el área del objeto nuclear y la cubierta convexa del objeto nuclear.As used herein, the term "nuclear solidity" is a measure of the contour regularity of the nuclear membrane, and can be calculated as the ratio of the area of the nuclear object to the convex shell of the nuclear object.
Como se usa en el presente documento, el término "puntuación" se refiere al valor numérico generado a partir del análisis de una muestra de un sujeto utilizando el modelo de predicción de riesgo de 15 características. La puntuación puede referirse a un valor único que se puede utilizar como componente en un modelo predictivo para el diagnóstico, pronóstico o plan de tratamiento clínico para un sujeto, en donde el valor único se calcula mediante la combinación de los valores de características descriptivas a través de una función de interpretación o algoritmo. El "modelo de predicción de riesgo de 15 características" se define como el ajuste de las 15 características utilizando parámetros de ajuste y centro definidos, ponderado luego por los coeficientes procedentes del análisis de regresión de Cox univariante de las características y los resultados de progresión que se realizó en un estudio de capacitación de casos y controles anidados (véase la Tabla 2). La suma ponderada por coeficiente (véase, por ejemplo, la Tabla 2) de las 15 características ajustadas produce una puntuación de riesgo no sellada, que se ajusta de la siguiente manera:As used herein, the term "score" refers to the numerical value generated from analysis of a sample from a subject using the 15-feature risk prediction model. The score may refer to a single value that can be used as a component in a predictive model for the diagnosis, prognosis, or clinical treatment plan for a subject, where the single value is calculated by combining the values of descriptive characteristics through of an interpretation function or algorithm. The "15-feature risk prediction model" is defined as the 15-feature fit using defined center and fit parameters, then weighted by the coefficients from the univariate Cox regression analysis of the features and progression results that was conducted in a nested case-control training study (see Table 2). The coefficient-weighted sum (see, for example, Table 2) of the 15 adjusted characteristics produces an unsealed risk score, which is adjusted as follows:

Se aplican valores de corte a la puntuación de riesgo para clasificar pacientes según el riesgo de progresión. Por ejemplo, en algunas realizaciones, la clase de riesgo se considera baja si la puntuación ajustada se encuentra entre 0 y menos de 5,5, intermedia si la puntuación ajustada es mayor o igual a 5,5 y menor de 6,4, y alta si la puntuación ajustada está entre mayor o igual a 6,4 y 10. Las puntuaciones ajustadas también se pueden asignar a una escala diferente y los diferentes valores de corte se pueden ajustar de acuerdo con las diferentes escalas.Cut-off values are applied to the risk score to classify patients according to risk of progression. For example, in some embodiments, the risk class is considered low if the adjusted score is between 0 and less than 5.5, intermediate if the adjusted score is greater than or equal to 5.5 and less than 6.4, and high if the adjusted score is between greater than or equal to 6.4 and 10. The adjusted scores can also be assigned to a different scale and the different cut-off values can be adjusted according to the different scales.
T l 2:1 r rí i iliz r l l ifi r riT l 2: 1 r rí i iliz r l l ifi r ri

continuacióncontinuation

Como se usa en el presente documento, la expresión "determinar el riesgo de progresión del esófago de Barrett" significa la probabilidad de progresar a una displasia de bajo grado, displasia de alto grado o adenocarcinoma/cáncer de esófago.As used herein, the term "determining the risk of Barrett's esophagus progression" means the probability of progressing to low-grade dysplasia, high-grade dysplasia, or adenocarcinoma / cancer of the esophagus.
Como se usa en el presente documento, la expresión "clasificar el esófago de Barrett" significa asignar una subcategoría de diagnóstico del esófago de Barrett a un sujeto, incluyendo, sin displasia, atipia reactiva, indefinido para displasia, displasia de bajo grado, displasia de alto grado o adenocarcinoma/cáncer de esófago.As used herein, the term "classify Barrett's esophagus" means to assign a diagnostic subcategory of Barrett's esophagus to a subject, including, without dysplasia, reactive atypia, undefined for dysplasia, low-grade dysplasia, dysplasia of high grade or adenocarcinoma / cancer of the esophagus.
Como se usa en el presente documento, la expresión "detectar un efecto de campo asociado con la transformación maligna en un esófago" significa adquirir características y calcular una puntuación que se correlaciona con la presencia de cambios moleculares y celulares en el campo preneoplásico que rodea lesiones displásicas y/o cancerosas en un esófago. Las áreas que rodean las lesiones displásicas y/o cancerosas pueden parecer histológicamente no displásicas o solo displasia de bajo grado, pero pueden presentar cambios o anomalías moleculares y celulares asociados con la transformación maligna en displasia de alto grado y/o cáncer. Estos cambios/anomalías pueden ocurrir dentro de las células epiteliales y estromales y se pueden cuantificar mediante características y convertirse en una puntuación. La detección de anomalías moleculares y celulares en este campo expandido puede superar las limitaciones del muestreo aleatorio y los diagnósticos subjetivos, permitiendo un diagnóstico más temprano y tratamiento de HGD y EAC.As used herein, the term "detecting a field effect associated with malignant transformation in an esophagus" means acquiring characteristics and calculating a score that correlates with the presence of molecular and cellular changes in the preneoplastic field surrounding dysplastic and / or cancerous lesions in an esophagus. The areas surrounding dysplastic and / or cancerous lesions may appear histologically nondysplastic or only low-grade dysplasia, but may present molecular and cellular changes or abnormalities associated with malignant transformation into high-grade dysplasia and / or cancer. These changes / abnormalities can occur within epithelial and stromal cells and can be quantified by characteristics and converted into a score. Detection of molecular and cellular abnormalities in this expanded field can overcome the limitations of random sampling and subjective diagnoses, allowing earlier diagnosis and treatment of HGD and CAD.
Como se usa en el presente documento, el término "instrucciones" se refiere a materiales y métodos para marcar y teñir portaobjetos de tejido con sondas y reactivos, obtener imágenes de las sondas en las muestras de tejido, analizar las imágenes para extraer los datos de biomarcadores y procesar los datos en una puntuación.As used herein, the term "instructions" refers to materials and methods for marking and staining tissue slides with probes and reagents, imaging the probes on tissue samples, analyzing the images to extract data from biomarkers and process the data into a score.
También cabe destacar que tal como se usa en el presente documento y en las reivindicaciones adjuntas, las formas en singular "un", "uno/una" y "el/la" incluyen las referencias en plural, salvo que el contexto indique claramente otra cosa. Por tanto, por ejemplo, la referencia a una "célula" es una referencia a una o más células y equivalentes de las mismas conocidas por los expertos en la materia, y así sucesivamente.It should also be noted that as used herein and in the appended claims, the singular forms "a", "an / an" and "the" include plural references, unless the context clearly indicates otherwise. thing. Thus, for example, reference to a "cell" is a reference to one or more cells and equivalents thereof known to those of skill in the art, and so on.
Como se usa en el presente documento, el término "aproximadamente" significa más o menos un 10% del valor numérico del número que se está utilizando. Por lo tanto, aproximadamente un 50 % significa el intervalo de 45 %-55 %.As used herein, the term "about" means plus or minus 10% of the numerical value of the number being used. Therefore, about 50% means the 45% -55% range.
Hablando en general, el término "tejido" se refiere a cualquier agregación de células especializadas de manera similar que están unidas en el rendimiento de una función particular.Generally speaking, the term "tissue" refers to any aggregation of similarly specialized cells that are united in the performance of a particular function.
El término "anticuerpo" se refiere a una molécula de inmunoglobulina o fragmento de la misma que tiene una estructura específica que interactúa o se une específicamente con una molécula que comprende un antígeno. Como se usa en el presente documento, el término "anticuerpo" incluye ampliamente anticuerpos de longitud completa y puede incluir determinados fragmentos de anticuerpos de los mismos. También se incluyen anticuerpos monoclonales y policlonales, anticuerpos multivalentes y monovalentes, anticuerpos multiespecíficos (por ejemplo, anticuerpos biespecíficos), anticuerpos quiméricos, anticuerpos humanos, anticuerpos humanizados y anticuerpos que han madurado por afinidad. Un anticuerpo se une selectiva o específicamente a un biomarcador de un trastorno gastrointestinal si el anticuerpo se une preferentemente a un antígeno expresado por una célula y tiene menos de un 25 %, o menos de un 10 %, o menos de un 1 % o menos de un 0,1 % de reactividad cruzada con un polipéptido expresado por una célula dentro del tejido gastrointestinales o células procedentes de otro tejido que migra de un tejido al tejido gastrointestinal. Normalmente, el anticuerpo tendrá una afinidad de unión (valor de la constante de disociación (Kd)), para el antígeno o epítopo de aproximadamente 10'6 M, 10'7 M, 10'8 M, 10'9 M, 10'1° M, 10'11 M o 10'12 M. La afinidad de unión se puede evaluar usando cualquier método conocido por un experto en la materia, tal como una resonancia de plasma superficial, ensayos de inmunoafinidad o ELISA.The term "antibody" refers to an immunoglobulin molecule or fragment thereof that has a specific structure that specifically interacts or binds with a molecule that comprises an antigen. As used herein, the term "antibody" broadly includes full-length antibodies and can include certain antibody fragments thereof. Also included are monoclonal and polyclonal antibodies, multivalent and monovalent antibodies, multispecific antibodies (eg, bispecific antibodies), chimeric antibodies, human antibodies, humanized antibodies, and affinity matured antibodies. An antibody selectively or specifically binds to a biomarker for a gastrointestinal disorder if the antibody preferentially binds to an antigen expressed by a cell and is less than 25%, or less than 10%, or less than 1% or less 0.1% cross-reactivity with a polypeptide expressed by a cell within gastrointestinal tissue or cells from another tissue that migrate from a tissue to gastrointestinal tissue. Normally, the antibody will have a binding affinity (value of the dissociation constant (Kd)), for the antigen or epitope of approximately 10.6 M, 10.7 M, 10.8 M, 10.9 M, 10 ' 1 ° M, 10.11 M, or 10.12 M. Binding affinity can be assessed using any method known to one of ordinary skill in the art, such as surface plasma resonance, immunoaffinity assays, or ELISA.
El término "sujeto" se utiliza en toda la memoria descriptiva para describir un animal del que se toma una muestra. El animal puede ser un ser humano. Para el diagnóstico de aquellas afecciones que son específicas de un sujeto específico, tal como un ser humano, el término "paciente" puede usarse indistintamente. En algunos casos en la descripción, el término "paciente" se referirá a pacientes humanos que padecen una enfermedad o trastorno particular. El sujeto puede ser un ser humano sospechoso de tener o estar identificado como en riesgo de desarrollar un trastorno gastrointestinal o esófago de Barrett. El sujeto puede ser un animal no humano del que se aísla o se proporciona una muestra. El término "mamífero" abarca tanto seres humanos como no humanos e incluye, pero no se limita a, seres humanos, primates no humanos, cánidos, felinos, murinos, bovinos, equinos y porcinos.The term "subject" is used throughout the specification to describe an animal from which a sample is taken. The animal can be a human being. For the diagnosis of those conditions that are specific to a specific subject, such as a human, the term "patient" can be used interchangeably. In some instances in the description, the term "patient" will refer to human patients suffering from a particular disease or disorder. The subject may be a human suspected of having or being identified as being at risk of developing a gastrointestinal disorder or Barrett's esophagus. The subject can be a non-human animal from which a sample is isolated or provided. The term "mammal" encompasses both humans and non-humans and includes, but is not limited to, humans, non-human primates, canids, felines, murines, bovines, equines, and pigs.
Los términos "que trata" y "tratar", significan aliviar síntomas, eliminar la causa de manera temporal o permanente o prevenir o retardar la aparición de síntomas. El término "tratamiento" incluye alivio, eliminación de la causa (temporal o permanente) o prevención de síntomas y trastornos asociados con cualquier afección. El tratamiento puede ser tanto un tratamiento previo tal como un tratamiento al inicio de los síntomas.The terms "treating" and "treating" mean to relieve symptoms, eliminate the cause temporarily or permanently, or prevent or delay the onset of symptoms. The term "treatment" includes alleviation, elimination of the cause (temporary or permanent), or prevention of symptoms and disorders associated with any condition. Treatment can be both a pre-treatment as well as a treatment at the onset of symptoms.
Los kits y métodos descritos en el presente documento se pueden utilizar con o en un sujeto que necesite dicho tratamiento, que también puede denominarse "que lo necesite". Como se usa en el presente documento, la expresión "que lo necesite" significa que se ha identificado que el sujeto tiene una necesidad del método o tratamiento particular y que el tratamiento se le ha dado al sujeto para ese propósito particular.The kits and methods described herein can be used with or in a subject in need of such treatment, which may also be referred to as "in need". As used herein, the term "in need" means that the subject has been identified as having a need for the particular method or treatment and that the treatment has been given to the subject for that particular purpose.
El método para determinar el riesgo de progresión del esófago de Barrett en un sujeto de acuerdo con la presente invención se describe anteriormente.The method for determining the risk of Barrett's esophagus progression in a subject according to the present invention is described above.
En algunas realizaciones, el sujeto tiene un mayor riesgo de progresión a metaplasia intestinal no displásica, atipia reactiva, indefinida para displasia, displasia de bajo grado o displasia de alto grado.In some embodiments, the subject is at increased risk of progression to non-dysplastic intestinal metaplasia, reactive atypia, indefinite to dysplasia, low-grade dysplasia, or high-grade dysplasia.
El sujeto que se identifica como un mayor riesgo de progresión a metaplasia intestinal no displásica, atipia reactiva, indefinida para displasia, displasia de bajo grado, displasia de alto grado o cáncer de esófago puede tratarse con una intervención terapéutica. El tratamiento puede ser una terapia de erradicación endoscópica, incluyendo terapia de ablación endoscópica, terapia fotodinámica endoscópica, crioterapia endoscópica, resección endoscópica de la mucosa, una terapia de resección quirúrgica, una terapia quirúrgica no endoscópica o terapia sistémica.The subject identified as being at increased risk of progression to nondysplastic intestinal metaplasia, reactive atypia, Indefinite for dysplasia, low-grade dysplasia, high-grade dysplasia or esophageal cancer can be treated with therapeutic intervention. Treatment can be endoscopic eradication therapy, including endoscopic ablation therapy, endoscopic photodynamic therapy, endoscopic cryotherapy, endoscopic mucosal resection, surgical resection therapy, non-endoscopic surgical therapy, or systemic therapy.
El sujeto puede haber recibido un diagnóstico de metaplasia intestinal no displásica, atipia reactiva, indefinido para displasia, displasia de bajo grado, displasia de alto grado o cáncer de esófago. El método descrito en el presente documento puede comprender además tratar al sujeto que ha recibido el diagnóstico. El tratamiento puede ser una terapia de erradicación endoscópica, incluyendo terapia de ablación endoscópica, terapia fotodinámica endoscópica, crioterapia endoscópica, resección endoscópica de la mucosa, una terapia de resección quirúrgica, una terapia quirúrgica no endoscópica o terapia sistémica.The subject may have received a diagnosis of non-dysplastic intestinal metaplasia, reactive atypia, undefined for dysplasia, low-grade dysplasia, high-grade dysplasia, or esophageal cancer. The method described herein may further comprise treating the subject who has received the diagnosis. Treatment can be endoscopic eradication therapy, including endoscopic ablation therapy, endoscopic photodynamic therapy, endoscopic cryotherapy, endoscopic mucosal resection, surgical resection therapy, non-endoscopic surgical therapy, or systemic therapy.
En algunas realizaciones, la pluralidad de biomarcadores puede detectarse usando sondas que se unen específicamente a cada uno de los biomarcadores. Las sondas pueden ser fluorescentes, contener un marcador fluorescente, o pueden detectarse mediante una sonda fluorescente secundaria o una sonda secundaria marcada con fluorescencia. Además, cada sonda puede marcarse con un fluoróforo diferente.In some embodiments, the plurality of biomarkers can be detected using probes that specifically bind to each of the biomarkers. The probes can be fluorescent, contain a fluorescent marker, or can be detected by a secondary fluorescent probe or a fluorescently labeled secondary probe. Additionally, each probe can be labeled with a different fluorophore.
En algunas realizaciones, la pluralidad de biomarcadores y núcleos celulares marcados pueden formar imágenes para producir campos de visión que se analizan para extraer características asociadas con los biomarcadores y la morfología.In some embodiments, the plurality of biomarkers and labeled cell nuclei can be imaged to produce fields of view that are analyzed to extract characteristics associated with the biomarkers and morphology.
En algunas realizaciones, la detección de la pluralidad de biomarcadores puede determinarse simultáneamente. En algunas realizaciones, los núcleos celulares se pueden marcar con un grupo de reactivos seleccionados del grupo que consiste en Hoechst 33258, Hoechst 33342, Hoechst 34580, 4',6'-diamidino-2-fenilindol (DAPI), tinciones de ácido nucleico de cianina y hematoxilina.In some embodiments, the detection of the plurality of biomarkers can be determined simultaneously. In some embodiments, the cell nuclei can be labeled with a group of reagents selected from the group consisting of Hoechst 33258, Hoechst 33342, Hoechst 34580, 4 ', 6'-diamidino-2-phenylindole (DAPI), nucleic acid stains of cyanine and hematoxylin.
En algunas realizaciones, la puntuación se utiliza para determinar la frecuencia de la vigilancia endoscópica en un sujeto con esófago de Barrett o si un paciente es candidato para una intervención terapéutica para prevenir la progresión del esófago de Barrett. La intervención terapéutica puede ser una terapia de erradicación endoscópica, incluyendo terapia de ablación endoscópica, terapia fotodinámica endoscópica, crioterapia endoscópica, resección endoscópica de la mucosa, una terapia de resección quirúrgica, una terapia quirúrgica no endoscópica o terapia sistémica.In some embodiments, the score is used to determine the frequency of endoscopic surveillance in a subject with Barrett's esophagus or if a patient is a candidate for a therapeutic intervention to prevent progression of Barrett's esophagus. Therapeutic intervention can be endoscopic eradication therapy, including endoscopic ablation therapy, endoscopic photodynamic therapy, endoscopic cryotherapy, endoscopic mucosal resection, surgical resection therapy, non-endoscopic surgical therapy, or systemic therapy.
En algunas realizaciones, la muestra comprende un cepillado, raspado, biopsia o resección quirúrgica de células del sujeto. La muestra puede recolectarse mediante muestreo endoscópico aleatorio, muestreo endoscópico asistido por computadora, muestreo endoscópico guiado por imágenes, o muestreo no endoscópico mediante cepillado, abrasión o raspado.In some embodiments, the sample comprises a brushing, scraping, biopsy, or surgical resection of cells from the subject. The sample can be collected by random endoscopic sampling, computer-assisted endoscopic sampling, image-guided endoscopic sampling, or non-endoscopic sampling by brushing, abrasion, or scraping.
En algunas realizaciones, la muestra puede estar a temperatura ambiente o congelada. La muestra puede ser recién obtenida, fijada con formalina, fijada con alcohol o incluida en parafina.In some embodiments, the sample can be at room temperature or frozen. The sample can be fresh, formalin-fixed, alcohol-fixed, or embedded in paraffin.
El método para clasificar el esófago de Barrett en un sujeto de acuerdo con la presente invención se describe anteriormente.The method for classifying Barrett's esophagus in a subject according to the present invention is described above.
En algunas realizaciones, la clasificación del esófago de Barrett comprende metaplasia intestinal no displásica, atipia reactiva, indefinido para displasia, displasia de bajo grado o displasia de alto grado.In some embodiments, the Barrett's esophagus classification comprises nondysplastic intestinal metaplasia, reactive atypia, undefined for dysplasia, low-grade dysplasia, or high-grade dysplasia.
El sujeto puede haber recibido un diagnóstico de metaplasia intestinal no displásica, atipia reactiva, indefinido para displasia, displasia de bajo grado, displasia de alto grado o cáncer de esófago.The subject may have received a diagnosis of non-dysplastic intestinal metaplasia, reactive atypia, undefined for dysplasia, low-grade dysplasia, high-grade dysplasia, or esophageal cancer.
En algunas realizaciones, la pluralidad de biomarcadores puede detectarse usando sondas que se unen específicamente a cada uno de los biomarcadores. Las sondas pueden ser fluorescentes, contener un marcador fluorescente, o pueden detectarse mediante una sonda fluorescente secundaria o una sonda secundaria marcada con fluorescencia. Además, cada sonda puede marcarse con un fluoróforo diferente.In some embodiments, the plurality of biomarkers can be detected using probes that specifically bind to each of the biomarkers. The probes can be fluorescent, contain a fluorescent marker, or can be detected by a secondary fluorescent probe or a fluorescently labeled secondary probe. Additionally, each probe can be labeled with a different fluorophore.
En algunas realizaciones, la pluralidad de biomarcadores y núcleos celulares marcados pueden formar imágenes para producir campos de visión que se analizan para extraer características asociadas con los biomarcadores y la morfología.In some embodiments, the plurality of biomarkers and labeled cell nuclei can be imaged to produce fields of view that are analyzed to extract characteristics associated with the biomarkers and morphology.
En algunas realizaciones, la detección de la pluralidad de biomarcadores puede determinarse simultáneamente. En algunas realizaciones, los núcleos celulares se pueden marcar con un grupo de reactivos seleccionados del grupo que consiste en Hoechst 33258, Hoechst 33342, Hoechst 34580, 4',6'-diamidino-2-fenilindol (DAPI), tinciones de ácido nucleico de cianina y hematoxilina. In some embodiments, the detection of the plurality of biomarkers can be determined simultaneously. In some embodiments, the cell nuclei can be labeled with a group of reagents selected from the group consisting of Hoechst 33258, Hoechst 33342, Hoechst 34580, 4 ', 6'-diamidino-2-phenylindole (DAPI), nucleic acid stains of cyanine and hematoxylin.
En algunas realizaciones, la puntuación se utiliza para determinar la frecuencia de la vigilancia endoscópica en un sujeto con esófago de Barrett o si un paciente es candidato para una intervención terapéutica para prevenir la progresión del esófago de Barrett. La intervención terapéutica puede ser una terapia de erradicación endoscópica, incluyendo terapia de ablación endoscópica, terapia fotodinámica endoscópica, crioterapia endoscópica, resección endoscópica de la mucosa, una terapia de resección quirúrgica, una terapia quirúrgica no endoscópica o terapia sistémica.In some embodiments, the score is used to determine the frequency of endoscopic surveillance in a subject with Barrett's esophagus or if a patient is a candidate for a therapeutic intervention to prevent progression of Barrett's esophagus. Therapeutic intervention can be endoscopic eradication therapy, including endoscopic ablation therapy, endoscopic photodynamic therapy, endoscopic cryotherapy, endoscopic mucosal resection, surgical resection therapy, non-endoscopic surgical therapy, or systemic therapy.
En algunas realizaciones, la muestra comprende un cepillado, raspado, biopsia o resección quirúrgica de células del sujeto. La muestra puede recolectarse mediante muestreo endoscópico aleatorio, muestreo endoscópico asistido por computadora, muestreo endoscópico guiado por imágenes, o muestreo no endoscópico mediante cepillado, abrasión o raspado.In some embodiments, the sample comprises a brushing, scraping, biopsy, or surgical resection of cells from the subject. The sample can be collected by random endoscopic sampling, computer-assisted endoscopic sampling, image-guided endoscopic sampling, or non-endoscopic sampling by brushing, abrasion, or scraping.
En algunas realizaciones, la muestra puede estar a temperatura ambiente o congelada. La muestra puede ser recién obtenida, fijada con formalina, fijada con alcohol o incluida en parafina.In some embodiments, the sample can be at room temperature or frozen. The sample can be fresh, formalin-fixed, alcohol-fixed, or embedded in paraffin.
En el presente documento se describe un método para detectar un efecto de campo asociado con la transformación maligna del esófago de Barrett en un sujeto, que comprende: a) obtener una muestra gastrointestinal superior del sujeto; b) marcar los núcleos celulares de la muestra con un grupo de reactivos; c) marcar una pluralidad de biomarcadores en la muestra, en donde la pluralidad de biomarcadores son p53, HIF-1a, COX2, p16, alfa-metilacil-CoA racemasa (AMACR), CD68, CD45RO, K20 y HER2/neu; d) detectar la pluralidad de biomarcadores y núcleos celulares marcados con un escáner óptico; e) generar datos de imágenes digitales a partir de la pluralidad de biomarcadores y núcleos celulares marcados detectados; f) analizar la muestra marcada usando una plataforma de imagen digital para obtener imágenes de portaobjetos completos de fluorescencia multicanal para producir características de análisis de imágenes cuantitativas de alta dimensión; g) analizar las características de análisis de imágenes asociadas con la pluralidad de biomarcadores y núcleos celulares, en donde las características de análisis de imágenes son la intensidad de la suma de p53 nuclear, intensidad media de p53 nuclear, relación de intensidad media de HER2/neu:intensidad media de K20 en grupos de núcleos, relación de intensidad del 95o cuantil de HER2/neu:intensidad del 95o cuantil de K20 en grupos de núcleos, expresión conjunta de CD68 y COX2 celular, intensidad media de p53 en grupos de núcleos, solidez nuclear en células negativas para p16 que sobreexpresan p53, intensidad de la suma de CD45RO en la membrana plasmática, desviación estándar de AMACR en el microambiente, textura de COX2 en el citoplasma, intensidad media de HIF-1a en el microambiente celular, momento de HIF-1a en el microambiente celular (producto de la media y la desviación estándar), intensidad media de p16 en el citoplasma, área nuclear en células negativas para p16 que sobreexpresan p53 e intensidad del 95o cuantil nuclear de Hoechst; h) determinar una puntuación usando la combinación de las características de análisis de imágenes; e i) correlacionar la puntuación con la probabilidad de que el sujeto tenga displasia de alto grado o cáncer de esófago.Described herein is a method for detecting a field effect associated with malignant transformation of Barrett's esophagus in a subject, comprising: a) obtaining an upper gastrointestinal sample from the subject; b) marking the cell nuclei of the sample with a set of reagents; c) marking a plurality of biomarkers in the sample, wherein the plurality of biomarkers are p53, HIF-1a, COX2, p16, alpha-methylacyl-CoA racemase (AMACR), CD68, CD45RO, K20 and HER2 / neu; d) detecting the plurality of labeled biomarkers and cell nuclei with an optical scanner; e) generating digital image data from the plurality of detected labeled cell nuclei and biomarkers; f) analyzing the labeled sample using a digital imaging platform to image full multi-channel fluorescence slides to produce high-dimensional quantitative image analysis features; g) analyze the image analysis characteristics associated with the plurality of biomarkers and cell nuclei, where the image analysis characteristics are the intensity of the sum of nuclear p53, mean intensity of nuclear p53, ratio of mean intensity of HER2 / neu: mean intensity of K20 in groups of nuclei, intensity ratio of the 95th quantile of HER2 / neu: intensity of the 95th quantile of K20 in groups of nuclei, joint expression of CD68 and cellular COX2, mean intensity of p53 in groups of nuclei, Nuclear robustness in p16 negative cells that overexpress p53, intensity of CD45RO summation in the plasma membrane, standard deviation of AMACR in the microenvironment, texture of COX2 in the cytoplasm, mean intensity of HIF-1a in the cellular microenvironment, HIF-1a in the cellular microenvironment (product of the mean and standard deviation), mean intensity of p16 in the cytoplasm, nuclear area in p16 negative cells that overexpress n p53 and intensity of the 95th nuclear quantile of Hoechst; h) determining a score using the combination of the image analysis features; and i) correlating the score with the probability that the subject has high-grade dysplasia or esophageal cancer.
En el presente documento se describe un kit para determinar el riesgo de progresión de esófago de Barrett en un sujeto que comprende: a) uno o más reactivos para marcar núcleos celulares en una muestra; b) una o más sondas capaces de detectar una pluralidad de biomarcadores en la muestra, en donde la pluralidad de biomarcadores son p53, HIF-1a, COX2, p16, alfa-metilacil-CoA racemasa (AMACR), CD68, CD45RO, K20 y HER2/neu; y c) instrucciones para analizar características de análisis de imágenes asociadas con la pluralidad de biomarcadores y núcleos celulares, en donde las características de análisis de imágenes son la intensidad de la suma de p53 nuclear, intensidad media de p53 nuclear, relación de intensidad media de HER2/neu:intensidad media de K20 en grupos de núcleos, relación de intensidad del 95o cuantil de HER2/neu:intensidad del 95o cuantil de K20 en grupos de núcleos, expresión conjunta de CD68 y COX2 celular, intensidad media de p53 en grupos de núcleos, solidez nuclear en células negativas para p16 que sobreexpresan p53, intensidad de la suma de CD45RO en la membrana plasmática, desviación estándar de AMACR en el microambiente, textura de COX2 en el citoplasma, intensidad media de HIF-1a en el microambiente celular, momento de HIF-1a en el microambiente celular (producto de la media y la desviación estándar), intensidad media de p16 en el citoplasma, área nuclear en células negativas para p16 que sobreexpresan p53, e intensidad del 95o cuantil del núcleo de Hoechst, para generar una puntuación a partir de la muestra del sujeto.Described herein is a kit for determining the risk of Barrett's esophagus progression in a subject comprising: a) one or more reagents for labeling cell nuclei in a sample; b) one or more probes capable of detecting a plurality of biomarkers in the sample, wherein the plurality of biomarkers are p53, HIF-1a, COX2, p16, alpha-methylacyl-CoA racemase (AMACR), CD68, CD45RO, K20 and HER2 / neu; and c) instructions for analyzing image analysis characteristics associated with the plurality of biomarkers and cell nuclei, where the image analysis characteristics are nuclear p53 sum intensity, nuclear p53 mean intensity, HER2 mean intensity ratio. / neu: mean intensity of K20 in groups of nuclei, intensity ratio of the 95th quantile of HER2 / neu: intensity of the 95th quantile of K20 in groups of nuclei, joint expression of CD68 and cellular COX2, mean intensity of p53 in groups of nuclei , nuclear robustness in p16 negative cells that overexpress p53, intensity of CD45RO summation in the plasma membrane, standard deviation of AMACR in the microenvironment, texture of COX2 in the cytoplasm, mean intensity of HIF-1a in the cellular microenvironment, time of HIF-1a in the cellular microenvironment (product of the mean and standard deviation), mean intensity of p16 in the cytoplasm, nuclear area in cells negative for p16 that overexpress p53, and intensity of the 95th quantile of the nucleus of Hoechst, to generate a score from the subject sample.
La puntuación puede predecir el resultado clínico del esófago de Barrett en el sujeto, el riesgo de progresión, o la determinación de la etapa preneoplásica del esófago de Barrett en el sujeto y/o la determinación de la presencia de displasia de alto grado o cáncer de esófago.The score can predict the clinical outcome of Barrett's esophagus in the subject, the risk of progression, or the determination of the preneoplastic stage of Barrett's esophagus in the subject and / or the determination of the presence of high-grade dysplasia or breast cancer. esophagus.
En el presente documento se describe un kit para clasificar el esófago de Barrett en un sujeto, que comprende: a) uno o más reactivos para marcar núcleos celulares en una muestra; b) una o más sondas capaces de detectar una pluralidad de biomarcadores en la muestra, en donde la pluralidad de biomarcadores son p53, HIF-1a, COX2, p16, alfa-metilacil-CoA racemasa (AMACR), CD68, CD45RO, K20 y HER2/neu; y c) instrucciones para analizar características de análisis de imágenes asociadas con la pluralidad de biomarcadores y núcleos celulares, en donde las características de análisis de imágenes son la intensidad de la suma de p53 nuclear, intensidad media de p53 nuclear, relación de intensidad media de HER2/neu:intensidad media de K20 en grupos de núcleos, relación de intensidad del 95o cuantil de HER2/neu:intensidad del 95o cuantil de K20 en grupos de núcleos, expresión conjunta de CD68 y COX2 celular, intensidad media de p53 en grupos de núcleos, solidez nuclear en células negativas para p16 que sobreexpresan p53, intensidad de la suma de CD45RO en la membrana plasmática, desviación estándar de AMACR en el microambiente, textura de COX2 en el citoplasma, intensidad media de HIF-1a en el microambiente celular, momento de HIF-1a en el microambiente celular (producto de la media y la desviación estándar), intensidad media de p16 en el citoplasma, área nuclear en células negativas para p16 que sobreexpresan p53, e intensidad del 95o cuantil del núcleo de Hoechst, para generar una puntuación a partir de la muestra del sujeto.Described herein is a kit for classifying Barrett's esophagus in a subject, comprising: a) one or more reagents for labeling cell nuclei in a sample; b) one or more probes capable of detecting a plurality of biomarkers in the sample, wherein the plurality of biomarkers are p53, HIF-1a, COX2, p16, alpha-methylacyl-CoA racemase (AMACR), CD68, CD45RO, K20 and HER2 / neu; and c) instructions for analyzing image analysis characteristics associated with the plurality of biomarkers and cell nuclei, where the image analysis characteristics are nuclear p53 sum intensity, nuclear p53 mean intensity, HER2 mean intensity ratio. / neu: mean intensity of K20 in groups of nuclei, intensity ratio of the 95th quantile of HER2 / neu: intensity of the 95th quantile of K20 in groups of nuclei, joint expression of CD68 and cellular COX2, mean intensity of p53 in groups of nuclei , nuclear robustness in cells negative for p16 overexpressing p53, intensity of summation of CD45RO in plasma membrane, standard deviation of AMACR in microenvironment, texture of COX2 in cytoplasm, mean intensity of HIF-1a in cellular microenvironment, moment of HIF-1a in microenvironment cell (product of mean and standard deviation), mean intensity of p16 in the cytoplasm, nuclear area in p16-negative cells that overexpress p53, and intensity of the 95th quantile of the Hoechst nucleus, to generate a score from the sample of the subject.
La puntuación puede predecir el resultado clínico del esófago de Barrett en el sujeto, el riesgo de progresión, o la determinación de la etapa preneoplásica del esófago de Barrett en el sujeto y/o la determinación de la presencia de displasia de alto grado o cáncer de esófago.The score can predict the clinical outcome of Barrett's esophagus in the subject, the risk of progression, or the determination of the preneoplastic stage of Barrett's esophagus in the subject and / or the determination of the presence of high-grade dysplasia or breast cancer. esophagus.
Los datos de imagen obtenidos con el escáner óptico se pueden analizar como se describe en Prichard JW et al. TissueCypher: A Systems Biology Approach to Anatomic Pathology. Journal of Pathology Informatics. 2015;6:48. Image data obtained with the optical scanner can be analyzed as described in Prichard JW et al. TissueCypher: A Systems Biology Approach to Anatomic Pathology. Journal of Pathology Informatics. 2015; 6: 48.
Por ejemplo, secciones de biopsias de Barrett fijadas con formalina e incluidas en parafina (FFPE, por sus siglas en inglés) pueden teñirse con H&E mediante métodos histológicos estándar. Se pueden marcar secciones adicionales mediante inmunofluorescencia multiplexada para citoqueratina 20 (CK-20), Ki-67, b-catenina, p16, alfa-metilacilcoenzima A racemasa (AMACR), p53, receptor 2 del factor de crecimiento epidérmico humano/neu (HER2/neu), CDX-2, CD68, factor nuclear kappa-B (NF-kB) p65, ciclooxigenasa-2 (COX-2), factor 1 alfa inducible por hipoxia (HIF-1a), CD45RO, CD1a más Hoechst para marcar núcleos. El grupo de biomarcadores también puede incluir biomarcadores de procesos estromales tales como angiogénesis y subconjuntos de células inmunitarias específicas, por ejemplo, macrófagos. Los biomarcadores pueden, por ejemplo, multiplexarse en subgrupos de fluorescencia de cuatro canales que constan de Hoechst y tres biomarcadores por portaobjetos. Los portaobjetos se pueden hornear durante 30 minutos a 60 °C, desparafinar por inmersión en Aqua DePar (Biocare Medical, Concord, CA), seguido de la recuperación del epítopo en tampón de pH 9 de Tris-ácido etilendiaminotetraacético a 97-99 °C durante 30 minutos y luego a temperatura ambiente durante 20 minutos. Luego los portaobjetos se pueden lavar, bloquear primero con lmage-¡T FX Signal Enhancer (Life Technologies, Carlsbad, CA) y luego con tampón de bloqueo de suero de cabra al 5 % seguido de incubación con un cóctel de anticuerpos primarios que contiene anticuerpos (i) anti-CK-20, anti-Ki-67 y anti-b-catenina; (¡i) anti-p16, anti-AMACR y anti-p53; (i¡¡) anti-HER2/neu, anti-CK-20 y anti-CDX-2; (iv) CD68, NF-kB p65 y anti-COX2; o (v) anti-HIF-1a, anti-CD45RO y anti-CD1a durante aproximadamente 1 hora a temperatura ambiente. Los anticuerpos pueden ser cualquier anticuerpo adecuado. Los portaobjetos se pueden lavar e incubar durante aproximadamente 1 hora a temperatura ambiente con un cóctel de anticuerpos secundarios que contenga, por ejemplo, anticuerpos de cabra anti-lgG específica de ¡sotipo de ratón y de cabra anti-IgG de conejo conjugados con Alexa Fluors 488, 555 y 647 (Life Technologies), que son específicos de cada cóctel de anticuerpos primarios. Los portaobjetos se pueden lavar, marcar con Hoechst 33342 (Life Technologies) durante aproximadamente 3 minutos, lavar de nuevo y montar con un cubreobjetos de vidrio utilizando Prolong Gold Antifade (Life Technologies).For example, sections of formalin-fixed paraffin-embedded (FFPE) Barrett's biopsies can be H&E stained using standard histological methods. Additional sections can be marked by multiplexed immunofluorescence for cytokeratin 20 (CK-20), Ki-67, b-catenin, p16, alpha-methylacylcoenzyme A racemase (AMACR), p53, human epidermal growth factor receptor 2 / neu (HER2 / neu), CDX-2, CD68, nuclear factor kappa-B (NF-kB) p65, cyclooxygenase-2 (COX-2), hypoxia-inducible factor 1 alpha (HIF-1a), CD45RO, CD1a plus Hoechst for labeling nuclei. The group of biomarkers can also include biomarkers of stromal processes such as angiogenesis and subsets of specific immune cells, eg macrophages. Biomarkers can, for example, be multiplexed into four channel fluorescence subsets consisting of Hoechst and three biomarkers per slide. Slides can be baked for 30 minutes at 60 ° C, dewaxed by immersion in Aqua DePar (Biocare Medical, Concord, CA), followed by epitope retrieval in Tris-ethylenediaminetetraacetic acid pH 9 buffer at 97-99 ° C for 30 minutes and then at room temperature for 20 minutes. The slides can then be washed, blocked first with Image-¡T FX Signal Enhancer (Life Technologies, Carlsbad, CA) and then with 5% Goat Serum Blocking Buffer followed by incubation with a primary antibody cocktail containing antibodies. (i) anti-CK-20, anti-Ki-67 and anti-b-catenin; (Ii) anti-p16, anti-AMACR and anti-p53; (i¡¡) anti-HER2 / neu, anti-CK-20 and anti-CDX-2; (iv) CD68, NF-kB p65 and anti-COX2; or (v) anti-HIF-1a, anti-CD45RO and anti-CD1a for about 1 hour at room temperature. The antibodies can be any suitable antibody. The slides can be washed and incubated for approximately 1 hour at room temperature with a secondary antibody cocktail containing, for example, Alexa Fluors conjugated goat anti-mouse isotype-specific IgG and goat anti-rabbit IgG antibodies. 488, 555, and 647 (Life Technologies), which are specific for each primary antibody cocktail. Slides can be washed, stained with Hoechst 33342 (Life Technologies) for approximately 3 minutes, washed again, and mounted with a glass coverslip using Prolong Gold Antifade (Life Technologies).
De los portaobjetos teñidos con H&E se pueden obtener imágenes con un aumento de x20. De los portaobjetos marcados con fluorescencia se pueden, por ejemplo, obtener imágenes mediante un escaneo de fluorescencia de 4 canales de portaobjetos completo con un aumento de x20 sobre, por ejemplo, un ScanScope FL (Aperio Technologies/Leica BioSystems, Vista, CA) utilizando un conjunto de filtros de cuatro bandas BrightLine® Pinkel optimizado para 4',6-diamidino-2-fenilindol, isotiocianato de fluoresceína, tetrametilrodamina y Cy5 (FF01-440/521/607/700-25) y filtros de excitación de paso de banda de banda única BrightLine® FF01-387/11-25, FF01-485/20-25, FF01-560/25-25 y FF01-650/13-25 (Semrock, Rochester, NY, EE.UU.). Se puede utilizar un dispositivo de calibración de fuente de luz para garantizar la iluminación constante necesaria para el análisis cuantitativo de imágenes (Lumen Dynamics/Excelitas Technologies Corp., Waltham, MA).H&E stained slides can be imaged at x20 magnification. Fluorescence-labeled slides can, for example, be imaged by a 4-channel fluorescence scan of entire slides at x20 magnification on, for example, a ScanScope FL (Aperio Technologies / Leica BioSystems, Vista, CA) using a set of BrightLine® Pinkel four-band filters optimized for 4 ', 6-diamidino-2-phenylindole, fluorescein isothiocyanate, tetramethylrhodamine and Cy5 (FF01-440 / 521/607 / 700-25) and pass-through excitation filters Single band BrightLine® FF01-387 / 11-25, FF01-485 / 20-25, FF01-560 / 25-25 and FF01-650 / 13-25 (Semrock, Rochester, NY, USA). A light source calibration device can be used to ensure the constant illumination required for quantitative image analysis (Lumen Dynamics / Excelitas Technologies Corp., Waltham, MA).
El análisis de imágenes, luego puede incluir, por ejemplo, análisis de imágenes de fluorescencia de portaobjetos completos. Este método puede incluir un mecanismo de lectura de archivos de alto rendimiento basado en el formato BigTiff para decodificar datos de imágenes sin procesar, Algoritmos de MatLab para segmentar objetos de tejidos de bajo nivel como núcleos, citoplasma, membrana plasmática y células completas para permitir la recopilación de características a nivel celular y subcelular y también modelos de visión por computadora de orden superior para la cuantificación espacial de biomarcadores en compartimentos tisulares, tales como el epitelio, áreas metaplásicas y lámina propia. Se pueden realizar análisis adicionales como se describe en Prichard JW et al. TissueCypher: A Systems Biology Approach to Anatomic Pathology. Journal of Pathology Informatics. 2015;6:48. También se pueden realizar otros métodos de análisis, que son similares a los métodos descritos en el presente documento.Image analysis can then include, for example, whole slide fluorescence image analysis. This method can include a high-performance file reading mechanism based on the BigTiff format to decode raw image data, MatLab algorithms to segment low-level tissue objects such as nuclei, cytoplasm, plasma membrane, and whole cells to enable the collection of characteristics at the cellular and subcellular level and also higher order computer vision models for the spatial quantification of biomarkers in tissue compartments, such as the epithelium, metaplastic areas and lamina propria. Additional analyzes can be performed as described in Prichard JW et al. TissueCypher: A Systems Biology Approach to Anatomic Pathology. Journal of Pathology Informatics. 2015; 6: 48. Other methods of analysis can also be performed, which are similar to the methods described herein.
Aunque las realizaciones en el presente documento se han descrito con considerable detalle con referencia a determinadas realizaciones preferidas de las mismas, son posibles otras versiones. Por lo tanto, el alcance de las reivindicaciones adjuntas no debe limitarse a la descripción y las versiones preferidas contenidas en esta memoria descriptiva.Although the embodiments herein have been described in considerable detail with reference to certain preferred embodiments thereof, other versions are possible. Therefore, the scope of the appended claims should not be limited to the description and preferred versions contained in this specification.
EjemplosExamples
EJEMPLO 1. Antecedentes: Se necesitan mejores métodos para predecir el riesgo de progresión del esófago de Barrett (BE). El presente objetivo fue determinar si un enfoque de patología de sistemas tisulares podría predecir la progresión en pacientes con BE no displásico, indefinido para displasia o displasia de bajo grado.EXAMPLE 1. Background: Better methods are needed to predict the risk of Barrett's esophagus (BE) progression. The present objective was to determine whether a tissue systems pathology approach could predict the progression in patients with non-dysplastic BE, undefined for dysplasia or low-grade dysplasia.
Métodos: Se realizó un estudio de casos y controles anidado para desarrollar y validar un sistema de clasificación que predice la progresión de BE a displasia de alto grado (HGD) o adenocarcinoma de esófago (EAC), basado en la cuantificación de variables epiteliales y estromales en biopsias iniciales. Se recopilaron datos de pacientes en programas de vigilancia endoscópica en 4 instituciones. Los pacientes cuyo BE progresó a HGD o EAC en s 1 año (n = 79) se emparejaron con pacientes cuyo BE no progresó (controles, n = 287). Las biopsias se asignaron aleatoriamente a conjuntos de capacitación o validación. Se realizaron análisis de inmunofluorescencia para 14 biomarcadores y se analizaron biomarcadores cuantitativos y características morfométricas. Las características de pronóstico se seleccionaron en el conjunto de capacitación y se combinaron en clasificadores. El clasificador de mejor rendimiento se evaluó en el conjunto de validación.Methods: A nested case-control study was conducted to develop and validate a classification system that predicts the progression of BE to high-grade dysplasia (HGD) or esophageal adenocarcinoma (CAD), based on the quantification of epithelial and stromal variables. in initial biopsies. Patient data were collected in endoscopic surveillance programs at 4 institutions. Patients whose BE progressed to HGD or CAD in s 1 year (n = 79) were matched with patients whose BE did not progress (controls, n = 287). Biopsies were randomly assigned to training or validation sets. Immunofluorescence analyzes were performed for 14 biomarkers and quantitative biomarkers and morphometric characteristics were analyzed. Forecast characteristics were selected from the training set and combined in classifiers. The best performing classifier was evaluated in the validation set.
Resultados: Se seleccionó un clasificador de 3 niveles y 15 características en el conjunto de capacitación y se probó en el conjunto de validación. El clasificador estratificó a los pacientes en clases de riesgo bajo, intermedio y alto (cociente de riesgo, 9,42; intervalo de confianza del 95 %, 4,6-19,24 (alto riesgo frente a bajo riesgo); P < 0,0001). También proporcionó información de pronóstico independiente que superó las predicciones realizadas con base en análisis de patología, longitud del segmento, edad, sexo o sobreexpresión de p53.Results: A classifier with 3 levels and 15 characteristics was selected in the training set and tested in the validation set. The classifier stratified patients into low, intermediate, and high risk classes (hazard ratio, 9.42; 95% confidence interval, 4.6-19.24 (high risk vs. low risk); P <0 , 0001). It also provided independent prognostic information that exceeded predictions made based on analysis of pathology, segment length, age, gender, or overexpression of p53.
Conclusión: Se desarrolló una prueba de patología de sistemas tisulares que predice mejor el riesgo de progresión en BE que variables clínicopatológicas.Conclusion: A tissue systems pathology test was developed that better predicts the risk of progression in BE than clinicopathological variables.
Impacto: La prueba puede mejorar el análisis histológico como un método objetivo y cuantitativo para estratificar el riesgo de pacientes con BE.Impact: The test can improve histological analysis as an objective and quantitative method to stratify the risk of patients with BE.
Diseño del estudio y pacientes: Se construyó un estudio de casos y controles anidado que utilizó una cohorte multicéntrica de pacientes con BE en programas de vigilancia endoscópica con datos de resultados clínicos de cuatro instituciones. Los casos de BE con diagnóstico de metaplasia solo o sin displasia (ND), indefinido para displasia (IND) o displasia de bajo grado (LGD) se recuperaron del Geisinger Health System, Universidad de Pittsburgh, Universidad de Pensilvania y Academic Medical Center (AMC), Ámsterdam, Países Bajos. Los diagnósticos se confirmaron por un único patólogo subespecialista gastrointestinal (Gl) en cada institución de EE.UU. (J.M.D. (Casos de la Universidad de Pittsburgh), N.C.J. (Casos de la Universidad de Pensilvania), J.L. (Casos de Geisinger y AMC). Los criterios de inclusión fueron la disponibilidad de bloques de tejido y datos clínicopatológicos y la confirmación de metaplasia intestinal. Los criterios de exclusión fueron antecedentes de HGD/EAC, diagnóstico de HGD/EAC en menos de 1 año de seguimiento, calidad insuficiente del tejido según la evaluación de un patólogo, y preparación del tejido con fijador de Bouin o azul de metileno. Se seleccionó para cada paciente la biopsia de vigilancia más temprana que cumplió con los criterios de inclusión/exclusión. Pacientes que progresaron a HGD/EAC en s 1 año (pacientes con progresión de incidentes/casos, n = 41 capacitación, n = 38 validación) se emparejaron con controles de no progresión con una mediana de tiempo de vigilancia libre de HGD/EAC de 5,6 años (n = 142 capacitación, n = 145 validación) basado en el género, longitud del segmento y edad cuando fue posible. Se asignaron aleatoriamente conjuntos de casos y controles de las instituciones estadounidenses y europeas a conjuntos de capacitación o validación (Tabla 3). En el conjunto de capacitación, 33/41 pacientes con progresión progresaron a HGD y 8/41 a EAC y en el conjunto de validación independiente, 29/38 pacientes con progresión progresaron a HGD y 9/38 a EAC (Tabla 4). Los elementos de información recopilados fueron: fecha de recogida del caso, diagnóstico patológico original proporcionado por un patólogo generalista y un patólogo subespecialista Gl revisó el diagnóstico para el caso probado, fecha y diagnóstico original de cada biopsia de vigilancia, criterio de valoración de la progresión (HGD/EAC), tiempo de vigilancia libre de HGD/EAC (tiempo entre el caso probado y el diagnóstico de HGD/EAC o el último seguimiento), edad, sexo, raza y longitud de segmento (cm) y clase de segmento (corto s 3 cm, largo > 3 cm). Faltaban datos de longitud de segmento para 24 pacientes. La edad y el género fueron completos para todos los pacientes. El diagnóstico patológico original extraído de los registros médicos se proporcionó por un patólogo generalista para 304/366 pacientes y por un patólogo subespecialista Gl para 62/366 pacientes. Study design and patients: A nested case-control study was constructed using a multicenter cohort of BE patients in endoscopic surveillance programs with clinical outcome data from four institutions. BE cases diagnosed with metaplasia alone or without dysplasia (ND), undefined for dysplasia (IND) or low-grade dysplasia (LGD) were retrieved from Geisinger Health System, University of Pittsburgh, University of Pennsylvania and Academic Medical Center (AMC ), Amsterdam, The Netherlands. Diagnoses were confirmed by a single gastrointestinal (GI) subspecialty pathologist at each US institution (JMD (University of Pittsburgh Cases), NCJ (University of Pennsylvania Cases), JL (Geisinger and AMC Cases) The inclusion criteria were the availability of tissue blocks and clinicopathological data and the confirmation of intestinal metaplasia. The exclusion criteria were history of HGD / CAD, diagnosis of HGD / CAD in less than 1 year of follow-up, insufficient tissue quality as assessed by a pathologist, and tissue preparation with Bouin's fixative or methylene blue. The earliest surveillance biopsy that met the inclusion / exclusion criteria was selected for each patient. Patients who progressed to HGD / CAD in s 1 year (patients with incident / case progression, n = 41 training, n = 38 validation) were matched with non-progression controls with a median HGD / CAD-free surveillance time 5.6 years (n = 142 training, n = 145 validation) based on gender, segment length and age when possible. Case-control sets from US and European institutions were randomly assigned to training or validation sets (Table 3). In the training set, 33/41 patients with progression progressed to HGD and 8/41 to CAD and in the independent validation set, 29/38 patients with progression progressed to HGD and 9/38 to CAD (Table 4). The information elements collected were: date of collection of the case, original pathological diagnosis provided by a general pathologist and a subspecialty pathologist Gl reviewed the diagnosis for the tested case, date and original diagnosis of each surveillance biopsy, endpoint of progression (HGD / EAC), HGD / EAC free surveillance time (time between tested case and diagnosis of HGD / CAD or last follow-up), age, sex, race and segment length (cm) and segment class ( short s 3 cm, long> 3 cm). Segment length data was missing for 24 patients. Age and gender were complete for all patients. The original pathology diagnosis extracted from medical records was provided by a general pathologist for 304/366 patients and by a Gl subspecialty pathologist for 62/366 patients.

T l 4. R m n l ri ri v l r i n l r r i n n i n n r r i n in i nT l 4. R m n l ri ri v l r i n l r r i n n i n n r r i n in i n

Selección de biomarcadores candidatos: En el estudio se seleccionó y examinó el siguiente grupo candidato de 14 biomarcadores de proteínas: K20 (citoqueratina-20), Ki-67, p-catenina, p16INK4a, AMACR (alfa-metilacil-CoA racemasa), p53, HER2/neu, CDX-2, CD68, NF-KB-p65, COX-2 (ciclooxigenasa-2), HIF-1a (subunidad del factor 1-alfa inducible por hipoxia), CD45RO y CD1a. Los biomarcadores incluían marcadores de anomalías de células epiteliales que se han descrito en la progresión de BE y también biomarcadores estromales que se sabe que desempeñan un papel en la carcinogénesis.Selection of candidate biomarkers: The following candidate group of 14 protein biomarkers was selected and examined in the study: K20 (cytokeratin-20), Ki-67, p-catenin, p16INK4a, AMACR (alpha-methylacyl-CoA racemase), p53 , HER2 / neu, CDX-2, CD68, NF-KB-p65, COX-2 (cyclooxygenase-2), HIF-1a (hypoxia-inducible factor 1-alpha subunit), CD45RO and CD1a. The biomarkers included epithelial cell abnormality markers that have been described in BE progression and also stromal biomarkers that are known to play a role in carcinogenesis.
Inmunomarcaje por fluorescencia: Se tiñeron secciones de 5 pm de biopsias de BE fijadas con formalina e incluidas en parafina (FFPE) con H&E mediante métodos estándar. Se marcaron secciones adicionales mediante inmunofluorescencia multiplexada para el grupo de biomarcadores candidatos enumerados anteriormente, más mareaje con Hoechst, de acuerdo con los métodos descritos anteriormente. Los biomarcadores se multiplexaron en subgrupos que consisten en Hoechst y 3 biomarcadores/portaobjetos detectados a través de anticuerpos secundarios conjugados con Alexa Fluor-488, -555 y -647 (Life Technologies, Carlsbad, California).Fluorescence immunolabeling: 5 pm sections of formalin-fixed paraffin-embedded (FFPE) biopsies were stained with H&E by standard methods. Additional sections were marked by multiplexed immunofluorescence for the group of candidate biomarkers listed above, plus Hoechst labeling, according to the methods described above. Biomarkers were multiplexed into subgroups consisting of Hoechst and 3 biomarkers / slides detected via Alexa Fluor-488, -555 and -647 conjugated secondary antibodies (Life Technologies, Carlsbad, California).
Imágenes de portaobjetos completas: Se tomaron imágenes de portaobjetos teñidos con H&E con un aumento de 20x en un escáner de patología digital NanoZoomer (Hamamatsu Photonics, KK, Japón). Se tomaron imágenes de portaobjetos inmunomarcados con fluorescencia a 20x en un ScanScope FL (Aperio Technologies/Leica BioSystems, Vista, CA) con una fuente de luz calibrada como se describió anteriormente. Se utilizó un procedimiento de imágenes estandarizado que incluía tiempos de exposición establecidos.Whole Slide Images: H&E stained slides were imaged at 20x magnification on a NanoZoomer digital pathology scanner (Hamamatsu Photonics, KK, Japan). 20x fluorescence immunolabelled slides were imaged on a ScanScope FL (Aperio Technologies / Leica BioSystems, Vista, CA) with a calibrated light source as described above. A standardized imaging procedure was used that included established exposure times.
Análisis de imágenes: Se analizaron imágenes de fluorescencia de portaobjetos completos utilizando la plataforma de análisis de imágenes TissueCypher™ (Cemostics, Inc., Pittsburgh, PA), que produce datos de características cuantitativas de alta dimensión sobre biomarcadores y morfología. La plataforma utiliza algoritmos para segmentar objetos basados en células para permitir la recopilación cuantitativa de datos de características morfológicas y de biomarcadores a nivel celular y subcelular. La plataforma también emplea modelos de visión por computadora para cuantificar biomarcadores en el epitelio, metaplasia y lámina propia. Las características (mediciones continuas y cuantitativas de biomarcadores y/o morfología) incluyeron intensidades de biomarcadores y expresión conjunta dentro de compartimentos subcelulares y compartimentos tisulares apropiados, morfometría y mediciones de biomarcadores basadas en microambiente. Se extrajeron características de los biomarcadores candidatos y la morfología. El programa informático extrajo 1.184 características de análisis de imágenes/biopsia y las resumió como mediciones múltiples, (percentiles, IQR, porcentaje positivo, estadísticas de resumen espacial) dando como resultado 13.538 características/mediciones por biopsia. El programa informático de análisis de imágenes no conocía el estado de casos y controles de las muestras.Image Analysis: Fluorescence images of whole slides were analyzed using the TissueCypher ™ image analysis platform (Cemostics, Inc., Pittsburgh, PA), which produces high-dimensional quantitative feature data on biomarkers and morphology. The platform uses algorithms to segment cell-based objects to enable quantitative collection of biomarker and morphological characteristic data at the cellular and subcellular level. The platform also uses computer vision models to quantify biomarkers in the epithelium, metaplasia, and lamina propria. Characteristics (continuous and quantitative measurements of biomarkers and / or morphology) included biomarker intensities and co-expression within appropriate subcellular and tissue compartments, morphometry, and microenvironment-based biomarker measurements. Characteristics of candidate biomarkers and morphology were extracted. The software extracted 1,184 biopsy / image analysis features and summarized them as multiple measurements, (percentiles, IQR, positive percent, spatial summary statistics) resulting in 13,538 biopsy features / measurements. The image analysis software was not aware of the case-control status of the samples.
Análisis estadísticos: Se desarrolló un clasificador de predicción de riesgos dentro del conjunto de capacitación y se definió prospectivamente antes de la prueba en el conjunto de validación. Se probó la hipótesis de que los pacientes de la clase de riesgo bajo prevista tienen un riesgo significativamente menor de progresión a HGD/EAC que los pacientes de la clase de riesgo alto prevista. También se probó la hipótesis de que las clases de riesgo añadirían información de pronóstico independiente más allá del diagnóstico patológico y la longitud del segmento.Statistical analyzes: A risk prediction classifier was developed within the training set and defined prospectively prior to testing in the validation set. The hypothesis was tested that patients in the predicted low-risk class have a significantly lower risk of progression to HGD / CAD than patients in the predicted high-risk class. The hypothesis that risk classes would add independent prognostic information beyond pathological diagnosis and segment length was also tested.
Desarrollo del modelo de predicción de riesgo: Se realizó una regresión logística condicional univariante en el conjunto de capacitación con 13.538 características/mediciones para comparar pacientes sin progresión con pacientes con progresión y permitir la selección de características para la construcción de modelos multivariantes. Se combinaron características seleccionadas en clasificadores y se realizó una validación cruzada de exclusión (LOOCV, por sus siglas en inglés) para estimar el rendimiento pronóstico de los clasificadores. En cada repetición de la LOOCV, se apartó 1 grupo de casos y controles (progresión y no progresión emparejadas) y los restantes grupos de casos y controles se utilizaron como conjunto de capacitación. El modelo de predicción se construyó en el conjunto de capacitación mediante la suma de las características ponderadas mediante los coeficientes Cox univariantes, y luego este modelo se aplicó en los casos de prueba para calcular una puntuación. El proceso de LOOCV se repitió hasta que todos los grupos de casos y controles fueron tratados como el caso de prueba una vez. El resultado final del proceso de LOOCV fue una puntuación de riesgo para cada paciente en un intervalo de 0-10. El tiempo de supervivencia para la regresión de riesgos proporcionales de Cox se definió como el tiempo entre el caso probado en este estudio y el diagnóstico de progresión a HGD/EAC o el último seguimiento para la no progresión. La regresión de Cox solo se utilizó después de que se seleccionaron las características (mediante regresión logística condicional) para derivar las ponderaciones de estas características seleccionadas para calcular una puntuación de riesgo para el modelo de predicción, y existen similitudes sorprendentes entre la función de probabilidad logística condicional y función de probabilidad parcial utilizada para ajustar un modelo de riesgos proporcionales de Cox. Se calcularon los índices de concordancia (índices C) y se trazaron curvas de rendimiento diagnóstico (curvas ROC) basadas en el resultado binario de bajo/alto para el riesgo a 5 años de progresión a HGD/EAC. Se determinaron valores de corte para estratificar a los pacientes en clases de riesgo bajo, intermedio y alto. Los valores de corte se eligieron para lograr un valor predictivo negativo (NPV, por sus siglas en inglés) y un valor predictivo positivo (PPV, por sus siglas en inglés) de más de un 95 % y 65 %, respectivamente, no ajustado para la prevalencia de enfermedades en el conjunto de capacitación. Se utilizaron curvas de Kaplan-Meier (KM) para representar la probabilidad de progresión a HGD/EAC en las 3 clases de riesgo. Se calcularon cocientes de riesgos (HR, por sus siglas en inglés) con intervalos de confianza (IC) del 95 % a partir de la regresión de riesgos proporcionales de Cox y los cocientes de posibilidades (OR, por sus siglas en inglés) con IC del 95 % se calcularon a partir de la regresión logística condicional. Se utilizó la prueba del orden logarítmico para evaluar la igualdad de probabilidad de las curvas de progresión de los grupos de riesgo a partir del análisis de KM, mientras que la prueba de puntuación se realizó con regresión logística condicional para examinar la significancia de la asociación de los grupos de riesgo con la incidencia de HGD/EAC.Development of the risk prediction model: A univariate conditional logistic regression was performed on the training set with 13,538 characteristics / measurements to compare patients without progression with patients with progression and allow the selection of characteristics for the construction of multivariate models. Characteristics selected in classifiers were combined and a cross-exclusion validation (LOOCV) was performed to estimate the prognostic performance of the classifiers. At each repetition of the LOOCV, 1 group of cases and controls (matched progression and non-progression) was set aside and the remaining groups of cases and controls were used as a training set. The prediction model was built on the training set by summing the weighted characteristics using the univariate Cox coefficients, and then this model was applied in the test cases to calculate a score. The LOOCV process was repeated until all groups of cases and controls were treated as the test case once. The final result of the LOOCV process was a risk score for each patient in a range of 0-10. Survival time for Cox proportional hazards regression was defined as the time between the case tested in this study and the diagnosis of progression to HGD / CAD or the last follow-up for non-progression. Cox regression was only used after characteristics were selected (using conditional logistic regression) to derive the weights of these selected characteristics to calculate a risk score for the prediction model, and there are striking similarities between the logistic probability function conditional and partial probability function used to fit a Cox proportional hazards model. Concordance indices (C indices) were calculated and diagnostic performance curves (ROC curves) were plotted based on the binary low / high outcome for the 5-year risk of progression to HGD / CAD. Cut-off values were determined to stratify patients into low, intermediate and high risk classes. Cutoff values were chosen to achieve a negative predictive value (NPV) and a positive predictive value (PPV) of more than 95% and 65%, respectively, not adjusted for the prevalence of diseases in the training set. Kaplan-Meier (KM) curves were used to represent the probability of progression to HGD / CAD in the 3 risk classes. Hazard ratios (HR) with 95% confidence intervals (CI) were calculated from Cox proportional hazards regression and odds ratios (OR) with CI 95% were calculated from conditional logistic regression. The logarithmic order test was used to evaluate the equality of probability of the progression curves of the risk groups from the KM analysis, while the scoring test was performed with conditional logistic regression to examine the significance of the association of risk groups with the incidence of HGD / CAD.
Validación independiente del modelo de predicción de riesgos: El conjunto de validación independiente se puso en cuarentena durante la fase de capacitación. Los cálculos del tamaño de muestra indicaron que se requería un total de 43 pacientes en el conjunto de validación para asegurar un poder de un 80 % para detectar una diferencia significativa de un 50 % en el riesgo de progresión a los 5 años a HGD/EAC entre los clasificados como de alto riesgo frente a los de bajo riesgo, a un nivel de significancia de 0,05. Todos los parámetros del ensayo se especificaron previamente, incluyendo las 15 características/mediciones, coeficientes y valores de corte del clasificador antes de probar en el conjunto de validación. Se calculó la puntuación de riesgo para cada paciente y se asignaron las clases de riesgo según los valores de corte establecidos. Se calcularon el NPV y el PPV ajustados a la prevalencia para los grupos de riesgo bajo y alto pronosticados en función de las tasas de progresión anual informadas anteriormente para los pacientes con BE con diagnóstico del subespecialista Gl de ND, IND y LGD de 0,6 %, 0,9 % y 9,1 %, respectivamente.Independent validation of the risk prediction model: The independent validation set was quarantined during the training phase. Sample size calculations indicated that a total of 43 patients were required in the validation set to ensure 80% power to detect a significant 50% difference in the risk of progression at 5 years to HGD / CAD between those classified as high risk versus low risk, at a significance level of 0.05. All assay parameters were pre-specified, including the 15 characteristics / measurements, coefficients, and classifier cutoffs prior to testing on the validation set. The risk score was calculated for each patient and the risk classes were assigned according to the established cut-off values. Prevalence-adjusted NPV and PPV were calculated for predicted low and high risk groups based on previously reported annual progression rates for BE patients diagnosed with subspecialist Gl of ND, IND, and LGD of 0.6 %, 0.9% and 9.1%, respectively.
Comparación del rendimiento del clasificador frente a variables clínicas: Se realizaron modelos de Cox multivariante para evaluar si la prueba, tanto como clases categóricas como una variable continua, añadiría información de pronóstico independiente más allá de los factores clínicos tradicionales. Se dicotomizaron las siguientes variables: diagnóstico ((LGD frente a ND/IND combinados, sexo (0 para F, 1 para M), longitud del segmento (0 para corto, 1 para largo). El porcentaje de células que sobreexpresan p53 (determinado por el análisis de imágenes) y la edad se evaluaron como variables continuas. Los pacientes con falta de longitud de segmento y/o diagnóstico del patólogo generalista original se excluyeron de los modelos de Cox multivariante.Classifier performance comparison against clinical variables: Multivariate Cox models were performed to assess whether the test, both as categorical classes and as a continuous variable, would add independent prognostic information beyond traditional clinical factors. The following variables were dichotomized: diagnosis ((LGD vs combined ND / IND, sex (0 for F, 1 for M), segment length (0 for short, 1 for long). The percentage of cells that overexpress p53 (determined by image analysis) and age were evaluated as continuous variables Patients with lack of segment length and / or diagnosis by the original generalist pathologist were excluded from multivariate Cox models.
Resultados: La cohorte anidada de casos y controles incluyó muestras previas a la progresión de 79 (n = 41 en el conjunto de capacitación, n = 38 en el conjunto de validación) pacientes con BE con ND, IND o LGD que progresaron a HGD o EAC al menos 1 año después y 287 muestras de pacientes de control emparejados que no mostraron progresión (n = 142 en el conjunto de capacitación, n = 145 en el conjunto de validación). Los conjuntos de casos y controles de las instituciones estadounidenses y europeas se asignaron aleatoriamente al conjunto de capacitación o de validación. Los pacientes que no progresaron tuvieron una mediana de tiempo de vigilancia libre de HGD/EAC de 5,9 (IQR 4,5, 8,2) y 5,5 años (IQR 4,1, 8,5) en los conjuntos de capacitación y validación, respectivamente. La mediana del tiempo hasta la progresión fue de 2,9 (IQR 2,3, 3,7) y 2,8 (IQR 2,0, 4,2) años en los conjuntos de capacitación y validación, respectivamente. Las características clínicas de los pacientes se resumen en la Tabla 3.Results: The nested case-control cohort included pre-progression samples of 79 (n = 41 in the training set, n = 38 in the validation set) BE patients with ND, IND, or LGD who progressed to HGD or CEA at least 1 year later and 287 matched control patient samples showing no progression (n = 142 in the training set, n = 145 in the validation set). Case control sets from US and European institutions were randomly assigned to the training or validation set. Patients who did not progress had a median HGD / CAD-free surveillance time of 5.9 (IQR 4.5, 8.2) and 5.5 years (IQR 4.1, 8.5) in the sets of training and validation, respectively. The median time to progression was 2.9 (IQR 2.3, 3.7) and 2.8 (IQR 2.0, 4.2) years in the training and validation sets, respectively. The clinical characteristics of the patients are summarized in Table 3.
Desarrollo del clasificador de 15 características en el conjunto de capacitación: Se analizaron imágenes de fluorescencia de portaobjetos completos de mareaje de biomarcadores multiplexados mediante un programa informático de análisis de imágenes para generar 13.538 características/mediciones por biopsia en el conjunto de capacitación. Un conjunto de 17 características de análisis de imágenes procedentes de p53, HER2, Ki-67, K20, COX2, CD68, HIF-1a, p16INK4A, AMACR, Se seleccionaron CD45RO y la morfología nuclear en función de los valores p de la regresión logística condicional univariante que comparaba casos frente a controles (Tabla 5). Development of the 15-feature classifier in the training set: Fluorescence images of whole multiplexed biomarker labeling slides were analyzed using image analysis software to generate 13,538 biopsy features / measurements in the training set. A set of 17 image analysis characteristics from p53, HER2, Ki-67, K20, COX2, CD68, HIF-1a, p16INK4A, AMACR, CD45RO and nuclear morphology were selected based on the p-values of the logistic regression Univariate conditional comparing cases versus controls (Table 5).
Tabla 5.17 características de análisis de imágenes candidatas (incluyendo las 15 características principales iliz r l l ifi r riTable 5.17 Candidate Image Analysis Features (Including Top 15 Features Iliz r l l ifi r ri

(continuación)(continuation)

Las características procedentes de CDX2, p-catenina, CD1a y NF-kB p65 no se seleccionaron debido a una clasificación baja basada en los valores p. Se examinó la tasa de descubrimiento falso (FDR, por sus siglas en inglés) durante el proceso de selección de características para controlar los posibles errores de probabilidad debido a múltiples pruebas. La FDR para las 17 características principales seleccionadas durante el proceso de desarrollo del clasificador fue de 0,025 %. Por lo tanto, la probabilidad de que una característica en el conjunto de 17 características se seleccionara al azar era insignificante. Se seleccionó la medición más significativa para cada una de las 17 características de análisis de imágenes seleccionadas basadas en la regresión logística condicional univariante y se usó en la construcción de modelos predictivos. Las principales características/mediciones de análisis de imágenes 3, 6, 9, 12, 15 y 17 basadas en valores p de la regresión logística condicional se ajustaron utilizando los parámetros de centro y ajuste procedentes del conjunto de capacitación. La suma ponderada (por coeficientes del modelo de Cox univariantes) se calculó para producir una puntuación de riesgo. El 98 % de las puntuaciones brutas variaron entre -10 y 10. Se realizó un ajuste para garantizar que la puntuación de riesgo variara de 0-10 utilizando la siguiente fórmula:Traits from CDX2, p-catenin, CD1a, and NF-kB p65 were not selected due to a low ranking based on p-values. The false discovery rate (FDR) was examined during the feature selection process to control for possible probability errors due to multiple tests. The FDR for the 17 main characteristics selected during the classifier development process was 0.025%. Therefore, the probability that a feature in the set of 17 features was randomly selected was negligible. The most significant measure was selected for each of the 17 selected image analysis characteristics based on univariate conditional logistic regression and used in the construction of predictive models. The main image analysis characteristics / measurements 3, 6, 9, 12, 15 and 17 based on p-values from the conditional logistic regression were fitted using the center and fit parameters from the training set. The weighted sum (by univariate Cox model coefficients) was calculated to produce a risk score. 98% of the raw scores ranged from -10 to 10. An adjustment was made to ensure that the risk score ranged from 0-10 using the following formula:

Usando las puntuaciones de riesgo generadas por estos clasificadores a través de la LOOCV, Los índices C para las características principales 3, 6, 9, 12, 15 y 17 fueron 0,674, 0,672, 0,716, 0,755, 0,797 y 0,792, respectivamente, demostrando que el modelo de mejor rendimiento se basó en 15 características/mediciones de análisis de imágenes. Las 15 características/mediciones procedieron de p53, HER2, K20, COX2, CD68, HIF-1a, p16INK4A, AMACR, CD45RO y morfología nuclear e incluyeron múltiples características de análisis de imágenes procedentes de biomarcadores individuales (Tabla 5). Se incluye un diagrama de flujo que detalla las etapas para desarrollar el clasificador (FIG. 5). Los patrones de expresión de los biomarcadores en los que se basa el clasificador de 15 características se muestran en la FIG. 1 para pacientes con progresión representativos. AUROC (área bajo la curva de rendimiento diagnóstico) para el clasificador de 15 características fue de 0,872 en pacientes de las cuatro instituciones (FIG. 2, Panel A), 0,842 en pacientes estadounidenses y 0,870 en pacientes de AMC, lo que indica una alta precisión de pronóstico.Using the risk scores generated by these classifiers through the LOOCV, the C indices for the main characteristics 3, 6, 9, 12, 15 and 17 were 0.674, 0.672, 0.716, 0.755, 0.797 and 0.792, respectively, showing that the best performing model was based on 15 image analysis features / measurements. The 15 features / measurements were derived from p53, HER2, K20, COX2, CD68, HIF-1a, p16INK4A, AMACR, CD45RO, and nuclear morphology and included multiple image analysis features from individual biomarkers (Table 5). A flow chart detailing the steps to develop the classifier is included (FIG. 5). The expression patterns of the biomarkers on which the feature classifier is based are shown in FIG. 1 for representative progression patients. AUROC (area under the diagnostic performance curve) for the 15-feature classifier was 0.872 in patients from the four institutions (FIG. 2, Panel A), 0.842 in US patients, and 0.870 in AMC patients, indicating high forecast accuracy.
Se eligieron dos valores de corte para producir un clasificador de 3 niveles que estratificaba a los pacientes en grupos de riesgo bajo, intermedio y alto. Los gráficos de Kaplan-Meier (KM) de la probabilidad de progresión a los 5 años a HGD/EAC en pacientes puntuados como de riesgo bajo, intermedio y alto demostraron que el clasificador estratificó pacientes con progresión a partir de pacientes sin progresión en todas las instituciones combinadas y en pacientes de EE.UU. y de AMC por separado (Figura 2, Paneles B-D). Los HR fueron 4,19 (IC del 95 % 1,52, 11,57) para riesgo intermedio frente a bajo y 14,73 (IC del 95% 6,55, 33,16) para riesgo alto frente a bajo. Tanto las pruebas del orden logarítmico como las de puntuación mostraron que las 3 clases de riesgo previstas por el clasificador tenían un riesgo diferente de progresión a HGD/EAC (p < 0,0001).Two cutoffs were chosen to produce a 3-level classifier that stratified patients into low, intermediate, and high risk groups. Kaplan-Meier (KM) plots of the 5-year probability of progression to HGD / CAD in patients scored as low, intermediate and high risk demonstrated that the classifier stratified patients with progression from patients without progression in all institutions combined and in US and AMC patients separately (Figure 2, BD Panels). The HRs were 4.19 (95% CI 1.52, 11.57) for intermediate versus low risk and 14.73 (95% CI 6.55, 33.16) for high versus low risk. Both log-order and scoring tests showed that the 3 risk classes predicted by the classifier had a different risk of progression to HGD / CAD (p <0.0001).
Los cambios moleculares y celulares capturados por el clasificador de 15 características se ilustran en la FIG. 3, que compara imágenes de endoscopia, imágenes de biopsia de BE teñidas con H&E e imágenes de mareaje de fluorescencia multiplexado de los 9 biomarcadores en los que se basa el clasificador en un paciente con progresión (FIG. 3, Paneles A-C) y un paciente sin progresión (FIG. 3, Paneles D-F). Las imágenes de endoscopia para ambos pacientes mostraron BE sin lesiones visibles aparentes (FIG. 3, Panel A y Panel D). Las biopsias de ambos pacientes se confirmaron como ND por un patólogo subespecialista Gl (FIG. 3B y E). El clasificador de 15 características puntuó el paciente con progresión de alto riesgo debido a múltiples cambios moleculares y celularesThe molecular and cellular changes captured by the feature classifier are illustrated in FIG. 3, which compares endoscopy images, H&E-stained BE biopsy images, and multiplexed fluorescence labeling images of the 9 biomarkers on which the classifier is based in a patient with progression (FIG. 3, Panels AC) and a patient without progression (FIG. 3, DF Panels). Endoscopy images for both patients showed BE without apparent visible lesions (FIG. 3, Panel A and Panel D). Biopsies from both patients were confirmed as NA by a Gl subspecialty pathologist (FIG. 3B and E). The 15-feature classifier scored the patient with high-risk progression due to multiple molecular and cellular changes
20 twenty
(FIG. 3, Panel C), que incluía la sobreexpresión de p53, HER2/neu y COX-2 e infiltración por macrófagos, linfocitos de memoria y células estromales que expresan HIF-1a. El paciente sin progresión se puntuó como de bajo riesgo debido a la ausencia de características de alto riesgo (FIG. 3, Panel F).(FIG. 3, Panel C), which included overexpression of p53, HER2 / neu and COX-2 and infiltration by macrophages, memory lymphocytes and stromal cells expressing HIF-1a. The patient without progression was scored as low risk due to the absence of high risk features (FIG. 3, Panel F).
En modelos de Cox multivariante en los que la progresión a HGD/EAC se evaluó primero en relación con variables clínicas solamente, luego, en relación con las clases de riesgo previstas añadidas a las variables clínicas, las clases de riesgo intermedio y de alto riesgo proporcionaron un poder de pronóstico que era independiente del diagnóstico del patólogo (tanto generalista como subespecialista Gl), longitud del segmento, edad, sexo y porcentaje de células que sobreexpresan p53 (Tabla 6). El diagnóstico del subespecialista y la edad también fueron variables independientes significativas. Sin embargo, la edad media fue mayor en pacientes con progresión que en pacientes sin progresión (Tabla 3). La magnitud de los HR indicó que las clases de riesgo previstas proporcionaron un poder de pronóstico más fuerte que las variables clínicas (Tabla 6). Se observaron resultados similares cuando se evaluó la puntuación de riesgo de 15 características como una variable continua (Tabla 7).In multivariate Cox models in which progression to HGD / CAD was assessed first in relation to clinical variables only, then in relation to predicted risk classes added to clinical variables, intermediate and high risk classes provided a prognostic power that was independent of the pathologist's diagnosis (both generalist and gl subspecialty), segment length, age, sex, and percentage of cells overexpressing p53 (Table 6). The subspecialist's diagnosis and age were also significant independent variables. However, the mean age was higher in patients with progression than in patients without progression (Table 3). The magnitude of the HRs indicated that the predicted risk classes provided stronger prognostic power than the clinical variables (Table 6). Similar results were observed when the risk score of 15 characteristics was evaluated as a continuous variable (Table 7).
Tabla 6. Comparación del rendimiento predictivo de las clases de riesgo previstas por la prueba frente a las v ri l líni n l n n i i n i n n BETable 6. Comparison of the predictive performance of the risk classes predicted by the test versus the v ri l líni n l n n i i n i n n BE

(continuación)(continuation)

Tabla 7. Comparación del rendimiento predictivo de la puntuación de riesgo como una variable continua fr n l vri l líni n l n n i i nTable 7. Comparison of the predictive performance of the risk score as a continuous variable fr n l vri l líni n l n n i i n

Rendimiento del clasificador de 15 características en el conjunto de validación independiente: La prueba definida prospectivamente se evaluó luego en el conjunto de validación independiente de pacientes con BE (Tabla 3). El análisis ROC mostró que la prueba especificada previamente predijo el riesgo de progresión a los 5 años a HGD/EAC con AUROC de 0,804 en pacientes de las cuatro instituciones (FIG. 4, Panel A), 0,860 en pacientes estadounidenses y 0,717 en pacientes de AMC. El análisis de KM demostró que el clasificador de 15 características podía distinguir pacientes con progresión de incidentes de pacientes sin progresión en el conjunto de validación completo de pacientes y en pacientes de EE.UU. y AMC por separado (FIG. 4, Paneles B-D), validando de forma independiente el rendimiento del clasificador de 15 características que se observó en el conjunto de capacitación. Los HR fueron 2,45 (IC del 95 % 0,99, 6,07) para la comparación del grupo de riesgo intermedio frente al de riesgo bajo y 9,42 (IC del 95 % 4,61, 19,24) (FIG. 4, Panel E), para el grupo de riesgo alto frente al de riesgo bajo (p < 0,0001 para las pruebas del orden logarítmico y de puntuación). La probabilidad de progresión a HGD/EAC a los 5 años aumentó continuamente a medida que aumentaba la puntuación de riesgo de 15 características (FIG. 4, Panel F). El NPV y el PPV ajustados por prevalencia basados en la progresión a los 5 años a HGD/EAC para el clasificador de 15 características en el conjunto de validación fueron 0,98 y 0,26 utilizando las tasas de progresión informadas anteriormente. Las proporciones ajustadas por prevalencia de pacientes con puntuación de riesgo bajo, intermedio y alto según la prueba fueron 77 %, 15 % y 8 %, respectivamente.Performance of the 15-feature classifier in the independent validation set: The prospectively defined test was then evaluated in the independent validation set of patients with BE (Table 3). ROC analysis showed that the pre-specified test predicted the 5-year risk of progression to HGD / CEA with AUROC of 0.804 in patients from all four institutions (FIG. 4, Panel A), 0.860 in US patients, and 0.717 in patients from AMC. The KM analysis demonstrated that the 15-feature classifier was able to distinguish patients with progression from incidents from patients without progression in the full validation set of patients and in US and AMC patients separately (FIG. 4, BD Panels) , independently validating the performance of the 15-characteristic classifier that was observed in the training set. The HRs were 2.45 (95% CI 0.99, 6.07) for the comparison of the intermediate-risk group versus the low-risk group and 9.42 (95% CI 4.61, 19.24) ( FIG. 4, Panel E), for the high risk group versus the low risk group (p <0.0001 for the logarithmic order and scoring tests). The probability of progression to HGD / CAD at 5 years increased continuously as the risk score for 15 characteristics increased (FIG. 4, Panel F). The prevalence-adjusted NPV and PPV based on 5-year progression to HGD / CAD for the 15-feature classifier in the validation set were 0.98 and 0.26 using previously reported progression rates. The prevalence-adjusted proportions of patients with low, intermediate, and high risk scores according to the test were 77%, 15%, and 8%, respectively.
Los modelos de Cox multivariante que evaluaron un modelo reducido con variables clínicas únicamente y un modelo completo con el clasificador de 15 características añadido en el conjunto de validación mostraron que la clase de alto riesgo proporcionó un poder de pronóstico que era independiente del diagnóstico del patólogo general y del subespecialista Gl, longitud del segmento, edad, género y porcentaje de células que sobreexpresan p53 (Tabla 8A). Aunque los cocientes de riesgo sugieren una asociación de la variable p53 con el riesgo de progresión, los valores de p para la variable p53 en las regresiones de Cox (tanto sin la prueba de predicción de riesgos como con la prueba de predicción de riesgos) no fueron estadísticamente significativos, lo que indica que el efecto de la variable p53 no se puede distinguir de la posibilidad aleatoria independientemente del valor de los cocientes de riesgo. El diagnóstico del subespecialista Gl mostró poder pronóstico cuando se evaluó solo; sin embargo, ya no era estadísticamente significativo cuando las clases de riesgo previstas se añadieron al modelo de Cox (Tabla 8B). Se observaron resultados similares cuando se evaluó la puntuación de riesgo como una variable continua (Tabla 9).Multivariate Cox models that evaluated a reduced model with only clinical variables and a full model with the 15-feature classifier added in the validation set showed that the high-risk class provided prognostic power that was independent of the general pathologist's diagnosis. and from subspecialist Gl, segment length, age, gender, and percentage of cells overexpressing p53 (Table 8A). Although the hazard ratios suggest an association of the variable p53 with the risk of progression, the p values for the variable p53 in the Cox regressions (both without the risk prediction test and with the risk prediction test) do not they were statistically significant, indicating that the effect of the variable p53 cannot be distinguished from the random possibility regardless of the value of the hazard ratios. The diagnosis of the subspecialist Gl showed prognostic power when it was evaluated alone; however, it was no longer statistically significant when the predicted risk classes were added to the Cox model (Table 8B). Similar results were observed when the risk score was evaluated as a continuous variable (Table 9).
Tabla 8. Rendimiento pronóstico de clases de riesgo frente a variables clínicas en un conjunto de validación in n i n i n n BETable 8. Prognostic performance of risk classes against clinical variables in a validation set in n i n i n n BE

(continuación)(continuation)

Tabla 9. Comparación del rendimiento predictivo de la puntuación de riesgo como una variable continua fr n l vri l líni n l n n vli i nTable 9. Comparison of the predictive performance of the risk score as a continuous variable fr n l vri l líni n l n n vli i n

(continuación)(continuation)
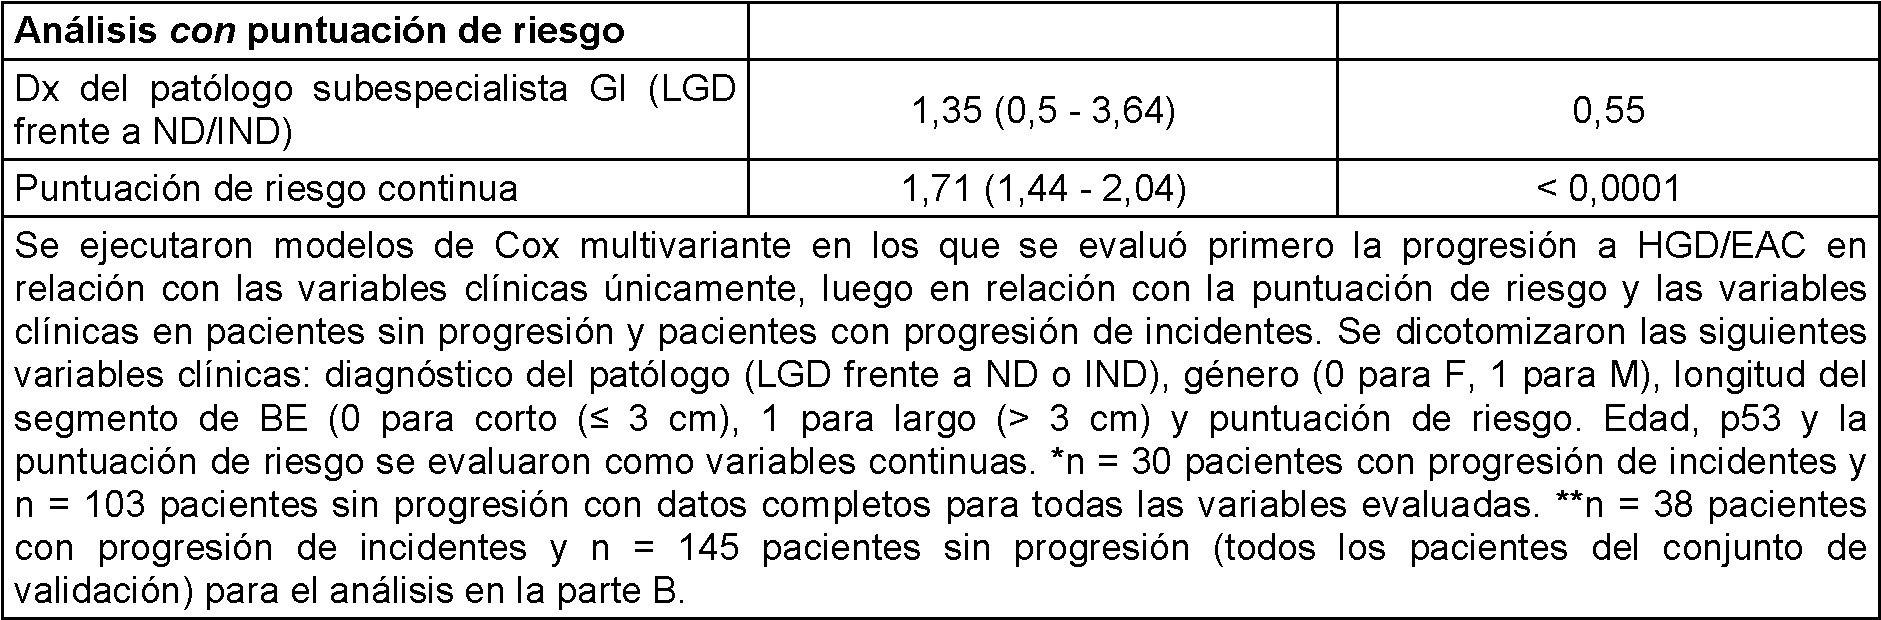
Debate: Utilizando un diseño de estudio de casos y controles anidado, se ha desarrollado y validado de forma independiente una nueva prueba multivariante que predice el riesgo futuro de progresión a HGD/EAC en pacientes con BE. La prueba produce una puntuación de riesgo que se puede utilizar como un variable independiente continua para estimar el riesgo de progresión a los 5 años a HGD/EAC. La prueba incorpora una estratificación de riesgo de 3 niveles para clasificar a los pacientes como de riesgo bajo, intermedio o alto de progresión. Hubo una gran diferencia en la tasa de progresión entre los pacientes con puntuaciones de bajo riesgo y aquellos con puntuaciones de alto riesgo. El grupo de pacientes de alto riesgo previsto tenía un riesgo 9,4 veces mayor de desarrollar HGD/EAC en comparación con el grupo de bajo riesgo. Adicionalmente, las clases de riesgo proporcionaron información predictiva independiente que superó a los factores de riesgo tradicionales, incluyendo el diagnóstico original del patólogo general y también el diagnóstico del patólogo Gl experto. Los análisis de Cox multivariante mostraron que el género masculino y la longitud del segmento no proporcionaron poder de pronóstico. Sin embargo, los casos y controles se emparejaron según el género y, cuando fue posible, la longitud del segmento. De manera importante, la prueba demostró una estratificación del riesgo que era independiente de variables clínicas tradicionales en una cohorte independiente de pacientes con BE.Discussion: Using a nested case-control study design, a new multivariate test has been developed and independently validated that predicts the future risk of progression to HGD / CAD in patients with BE. The test produces a risk score that can be used as a continuous independent variable to estimate the risk of progression at 5 years to HGD / CAD. The test incorporates a 3-level risk stratification to classify patients as low, intermediate, or high risk of progression. There was a large difference in the rate of progression between patients with low-risk scores and those with high-risk scores. The predicted high-risk group of patients had a 9.4 times higher risk of developing HGD / CAD compared to the low-risk group. Additionally, the risk classes provided independent predictive information that outperformed traditional risk factors, including the original diagnosis from the general pathologist and also the diagnosis from the expert Gl pathologist. Multivariate Cox analyzes showed that male gender and segment length did not provide prognostic power. However, cases and controls were matched according to gender and, where possible, segment length. Importantly, the test demonstrated risk stratification that was independent of traditional clinical variables in an independent cohort of BE patients.
El enfoque de patología de sistemas tisulares desarrollado y validado en este estudio puede proporcionar a los patólogos información que complementa el análisis histológico y proporcionar a los gastroenterólogos, otros proveedores y pacientes una puntuación de riesgo individualizada para guiar la toma de decisiones sobre la frecuencia de la vigilancia y las terapias. El clasificador de 3 niveles identifica a los pacientes con muy bajo riesgo de progresar a HGD/EAC dentro de los 5 años. Si se valida más, este hallazgo sugiere que la frecuencia de vigilancia endoscópica en este grupo de pacientes puede extenderse posiblemente a 5 años. El clasificador también identifica a los pacientes con riesgo muy alto de progresión. Las guías clínicas actuales recomiendan la intervención con terapia ablativa endoscópica para HGD confirmada y existe una creciente evidencia que respalda la terapia ablativa para LGD confirmada. Los pacientes identificados como de alto riesgo por el clasificador incluyeron pacientes con LGD, IND y ND confirmados por un patólogo Gl experto. La validación independiente de este enfoque de predicción de riesgo proporciona un posible apoyo para extender la terapia ablativa a pacientes con EB con IND y ND mediante la identificación objetiva de múltiples cambios moleculares y celulares indicativos de progresión futura. La patología estándar es cualitativa y propensa a la variación entre observadores, incluso entre subespecialistas Gl. El enfoque descrito en el presente documento es cuantitativo, objetivo y superó tanto el diagnóstico generalista como el diagnóstico del subespecialista Gl. Si bien el enfoque de prueba descrito en el presente documento inicialmente añadiría costes a la vigilancia de los pacientes con BE, existe el posible compensatorio de reducir los costes de atención médica futuros debido a la menor frecuencia de vigilancia endoscópica en pacientes de bajo riesgo y al tratamiento endoscópico temprano para prevenir la progresión maligna en pacientes de alto riesgo.The tissue systems pathology approach developed and validated in this study can provide pathologists with information that complements histological analysis and provide gastroenterologists, other providers, and patients with an individualized risk score to guide decision-making on the frequency of examination. surveillance and therapies. The 3-level classifier identifies patients at very low risk of progressing to HGD / CAD within 5 years. If further validated, this finding suggests that the frequency of endoscopic surveillance in this group of patients may possibly extend to 5 years. The classifier also identifies patients at very high risk of progression. Current clinical guidelines recommend intervention with endoscopic ablative therapy for confirmed HGD and there is growing evidence to support ablative therapy for confirmed LGD. Patients identified as high-risk by the classifier included patients with LGD, IND, and ND confirmed by an expert Gl pathologist. Independent validation of this risk prediction approach provides potential support for extending ablative therapy to BE patients with IND and DN by objective identification of multiple molecular and cellular changes indicative of future progression. Standard pathology is qualitative and prone to inter-observer variation, even among Gl subspecialists. The approach described in this document is quantitative, objective, and surpassed both the general diagnosis and the subspecialty Gl diagnosis. While the trial approach described in this document would initially add costs to the surveillance of patients with BE, there is a potential trade-off of reducing future healthcare costs due to the lower frequency of endoscopic surveillance in low-risk patients and the early endoscopic treatment to prevent malignant progression in high-risk patients.
Las limitaciones de este estudio incluyen la naturaleza retrospectiva de la cohorte, lo que puede dar como resultado un sesgo de selección y un tamaño de muestra limitado. Sin embargo, un estudio prospectivo más amplio no habría sido factible para la capacitación y la validación inicial del clasificador de riesgo debido a la muy baja prevalencia de progresión de la enfermedad en BE. El estudio carecía de revisión patológica central, aunque todos los casos fueron revisados por un único patólogo subespecialista Gl en cada una de las instituciones estadounidenses. La cohorte retrospectiva incluyó pacientes en vigilancia en múltiples centros, lo que impidió la estandarización de los protocolos de fijación y almacenamiento de biopsias. Sin embargo, todas las biopsias se obtuvieron durante la vigilancia endoscópica y, por lo tanto, reflejan muestras de BE de rutina que requieren una evaluación de riesgos. Si bien la patología digital ha ganado terreno en los últimos años, el uso de imágenes y análisis de imágenes en los laboratorios de anatomía patológica sigue siendo limitado. El enfoque descrito en el presente documento podría implementarse en un laboratorio clínico central de referencia capaz de ofrecer servicios de patología anatómica y equipado con la instrumentación de imagen necesaria, el programa informático de análisis de imágenes, y personal técnico especializado en patología digital.Limitations of this study include the retrospective nature of the cohort, which may result in selection bias and a limited sample size. However, a larger prospective study would not have been feasible for training and initial validation of the risk classifier due to the very low prevalence of disease progression in BE. The study lacked a central pathology review, although all cases were reviewed by a single Gl subspecialty pathologist at each of the US institutions. The retrospective cohort included patients under surveillance at multiple centers, which prevented the standardization of protocols for fixation and storage of biopsies. However, all biopsies were obtained during endoscopic surveillance and therefore reflect routine BE specimens that require risk assessment. While digital pathology has gained ground in recent years, the use of imaging and image analysis in pathology laboratories remains limited. The approach described herein could be implemented in a central clinical reference laboratory capable of offering anatomical pathology services and equipped with the necessary imaging instrumentation, image analysis software, and technical personnel specialized in digital pathology.
Muchos biomarcadores se han mostrado prometedores para la predicción de riesgos en BE, incluyendo biomarcadores como p53 y AMACR que se evaluaron en este estudio. A pesar de los grandes esfuerzos realizados, hasta la fecha no se han validado ni traducido en la práctica clínica biomarcadores para la predicción de riesgos. Los desafíos para la predicción de riesgos incluyen la heterogeneidad genética y no genética en tejidos y la consiguiente necesidad de evaluar múltiples rutas de carcinogénesis. El papel de los componentes epiteliales y estromales en la carcinogénesis sugiere que un enfoque de biología de sistemas para patología anatómica puede superar las limitaciones de estudios anteriores. Aunque los biomarcadores tales como p53 se han mostrado prometedores en la predicción de riesgos, no todos los pacientes tienen anomalías de p53 detectables en la etapa previa a la progresión y un subconjunto de pacientes sin progresión también presenta anomalías de p53. Aunque el BSG recomienda el IHC p53 como ayuda de diagnóstico, no es suficiente como biomarcador único para la predicción de riesgos. Los métodos utilizados para detectar y puntuar biomarcadores también han obstaculizado su implementación. Los métodos de patología tradicionales tienen una utilidad limitada en la evaluación de múltiples biomarcadores debido a las dificultades para manejar múltiples pruebas de IHC en biopsias de BE limitadas, variación del observador y los desafíos de integrar manualmente datos morfológicos y biomarcadores en un pronóstico. La prueba que se desarrolló y validó en este estudio representa una mejora considerable sobre las variables clínicas y los biomarcadores individuales evaluados por IHC para proporcionar una predicción de riesgos individualizada. Este enfoque de prueba ayuda a la patología mediante la medición objetiva de múltiples anomalías moleculares y celulares que pueden preceder a los cambios morfológicos epiteliales evaluados por patólogos. La puntuación de riesgo validada en este estudio identifica que los pacientes con EB de alto riesgo tienen pérdida de supresión tumoral, pérdida del control del ciclo celular, angiogénesis estromal, patrones alterados de infiltración de células inmunitarias, aumento de la inflamación y anomalías morfológicas, que son indicadores tempranos de progresión. El clasificador utiliza múltiples características de análisis de imágenes extraídas del mismo biomarcador para capturar diferentes patrones de expresión (Tabla 5). Por ejemplo, p53 está mutado con frecuencia en BE y, aunque algunas mutaciones conducen a la acumulación de proteína p53, otros conducen a la pérdida de la proteína p53. Mediante la evaluación de las intensidades medias y sumatorias y también de las intensidades en grupos de núcleos extraídos mediante un programa informático de análisis de imágenes, el clasificador multivariante tiene como objetivo cuantificar múltiples patrones de anomalías de p53 en una manera objetiva y estandarizada. El clasificador multivariante también incorpora características de análisis de imágenes basadas en microambientes que capturan anomalías localizadas tales como sobreexpresión focal de AMACR y grupos de células que sobreexpresan HIF-1a. El perfil de expresión génica, los enfoques de secuenciación del ADN y los enfoques moleculares para evaluar mutaciones y metilación de ADN también se han aplicado a las pruebas de diagnóstico y pronóstico en BE. Si bien estas tecnologías han ayudado al descubrimiento de biomarcadores y son prometedoras en la predicción de riesgos, tienen la desventaja de requerir la digestión de tejidos, lo que da como resultado la pérdida de morfología y relaciones espaciales entre biomarcadores, que puede ser relevante para los resultados del paciente. Adicionalmente, las pruebas específicas que utilizan estas tecnologías genómicas no se han validado de forma independiente en BE.Many biomarkers have shown promise for risk prediction in BE, including biomarkers such as p53 and AMACR that were evaluated in this study. Despite the great efforts made, to date no biomarkers for risk prediction have been validated or translated into clinical practice. The challenges for risk prediction include genetic and non-genetic heterogeneity in tissues and the consequent need to evaluate multiple pathways of carcinogenesis. The role of epithelial and stromal components in carcinogenesis suggests that a systems biology approach to anatomical pathology can overcome the limitations of previous studies. Although biomarkers such as p53 have shown promise in predicting risk, not all patients have detectable p53 abnormalities in the pre-progression stage, and a subset of patients without progression also have p53 abnormalities. Although the BSG recommends IHC p53 as a diagnostic aid, it is not sufficient as a single biomarker for risk prediction. The methods used to detect and score biomarkers have also hampered their implementation. Traditional pathology methods have limited utility in the evaluation of multiple biomarkers due to the difficulties of handling multiple IHC tests in limited BE biopsies, observer variation, and the challenges of manually integrating morphological and biomarker data into a prognosis. The test that was developed and validated in this study represents a considerable improvement over the clinical variables and individual biomarkers assessed by IHC to provide individualized risk prediction. This testing approach aids pathology by objective measurement of multiple molecular and cellular abnormalities that may precede pathologist-assessed epithelial morphological changes. The risk score validated in this study identifies that high-risk EB patients have loss of tumor suppression, loss of cell cycle control, stromal angiogenesis, altered patterns of immune cell infiltration, increased inflammation, and morphological abnormalities, which they are early indicators of progression. The classifier uses multiple image analysis features extracted from the same biomarker to capture different expression patterns (Table 5). For example, p53 is frequently mutated in BE, and while some mutations lead to accumulation of p53 protein, others lead to loss of p53 protein. By evaluating the mean and summative intensities and also the intensities in groups of nuclei extracted using an image analysis computer program, the multivariate classifier aims to quantify multiple patterns of p53 abnormalities in an objective and standardized manner. The multivariate classifier also incorporates microenvironment-based image analysis features that capture localized abnormalities such as focal AMACR overexpression and clumps of cells that overexpress HIF-1a. Gene expression profiling, DNA sequencing approaches, and molecular approaches to assess mutations and DNA methylation have also been applied to diagnostic and prognostic tests in BE. While these technologies have aided biomarker discovery and show promise in risk prediction, they have the disadvantage of requiring tissue digestion, resulting in the loss of morphology and spatial relationships between biomarkers, which may be relevant to biomarkers. patient results. Additionally, the specific tests using these genomic technologies have not been independently validated in BE.
Además de las ventajas de la plataforma de tecnología de prueba de sistemas de tejidos, este estudio se vio reforzado por el uso de una cohorte diversa de pacientes de cuatro instituciones de gran volumen. Una presentación adicional de la cohorte fue la exclusión de pacientes con HGD/EAC prevalente, permitiendo el desarrollo de una prueba que predice la progresión de incidentes. Adicionalmente, la prueba se validó en un conjunto independiente de pacientes con BE. El ensayo se puede realizar en secciones de bloques FFPE que se toman para la vigilancia endoscópica de rutina.In addition to the advantages of the tissue systems testing technology platform, this study was enhanced by the use of a diverse cohort of patients from four high-volume institutions. An additional presentation of the cohort was the exclusion of patients with prevalent HGD / CAD, allowing the development of a test that predicts the progression of incidents. Additionally, the test was validated in an independent set of BE patients. The assay can be performed on FFPE block sections that are taken for routine endoscopic surveillance.
En resumen, el enfoque de patología de sistemas tisulares validado en este estudio cuantifica múltiples procesos epiteliales y estromales y predice mejor el riesgo de progresión a HGD/EAC en pacientes con BE que las variables clínicas, incluyendo el diagnóstico patológico. Este enfoque de patología de sistemas tisulares proporciona la oportunidad de mejorar la histología cualitativa actual como un método cuantitativo para estratificar el riesgo de EB en pacientes de alto riesgo que pueden beneficiarse del tratamiento y pacientes de bajo riesgo en los que se pueden extender los intervalos de vigilancia.In summary, the tissue systems pathology approach validated in this study quantifies multiple epithelial and stromal processes and better predicts the risk of progression to HGD / CAD in patients with BE than clinical variables, including pathological diagnosis. This approach to tissue systems pathology provides the opportunity to improve current qualitative histology as a quantitative method for stratifying the risk of BE in high-risk patients who may benefit from treatment and low-risk patients in whom intervals of surveillance.
EJEMPLO 2. Antecedentes: Existe una necesidad de herramientas mejoradas para detectar displasia de alto grado (HGD) prevalente y adenocarcinoma de esófago (EAC) en pacientes en programas de vigilancia endoscópica para el esófago de Barrett (BE).EXAMPLE 2. Background: There is a need for improved tools to detect prevalent high-grade dysplasia (HGD) and esophageal adenocarcinoma (CAD) in patients in endoscopic surveillance programs for Barrett's esophagus (BE).
Objetivo: En un estudio anterior, un clasificador multivariante, basado en un enfoque de análisis de tejidos que detecta múltiples cambios moleculares y celulares en biopsias de BE antes de la progresión, se desarrolló para predecir el riesgo futuro de progresión en BE. Este estudio tuvo como objetivo determinar si el clasificador multivariante podría detectar un efecto de campo asociado con HGD y EAC prevalentes en biopsias con diagnóstico de metaplasia intestinal no displásica (ND), indefinido para displasia (IND) o displasia de bajo grado (LGD) de pacientes con BE.Objective: In a previous study, a multivariate classifier, based on a tissue analysis approach that detects multiple molecular and cellular changes in BE biopsies prior to progression, was developed to predict future risk of BE progression. This study aimed to determine if the multivariate classifier could detect a field effect associated with HGD and CAD prevalent in biopsies with a diagnosis of non-dysplastic intestinal metaplasia (ND), indefinite for dysplasia (IND) or low-grade dysplasia (LGD) of patients with BE.
Métodos: Se realizó un estudio de casos y controles anidado para desarrollar y validar un clasificador para estratificar el riesgo de pacientes con BE basado en una plataforma de imágenes que cuantifica múltiples variables epiteliales, estromales y morfométricas en biopsias de BE. Se recopilaron datos de una cohorte multicéntrica de pacientes en programas de vigilancia endoscópica en 4 instituciones en Estados Unidos o Europa. En un estudio anterior se desarrolló un clasificador multivariante en un conjunto de capacitación de biopsias de BE ND, IND y LGD previas a la progresión de pacientes que progresaron a HGD/EAC en s 1 año (n = 41) y biopsias iniciales de controles sin progresión emparejados (n = 142). Las secciones de biopsia se inmunomarcaron con fluorescencia para un grupo de 14 biomarcadores epiteliales y estromales, se obtuvieron imágenes y se analizaron mediante programa informático de análisis de imágenes para extraer biomarcadores cuantitativos y características morfométricas. En el conjunto de capacitación se seleccionó un clasificador de 3 niveles basado en 15 características cuantitativas procedentes de 9 biomarcadores y morfología. En el estudio presentado en el presente documento, el clasificador de 3 niveles seleccionado se evaluó en un conjunto de validación independiente de biopsias de BE con diagnósticos de ND, IND o LGD de pacientes que tenían un diagnóstico de HGD o EAC en < 1 año (casos prevalentes, n = 30) y controles sin progresión emparejados (n = 145).Methods: A nested case-control study was conducted to develop and validate a classifier to stratify the risk of BE patients based on an imaging platform that quantifies multiple epithelial, stromal, and morphometric variables in BE biopsies. Data were collected from a multicenter cohort of patients in endoscopic surveillance programs at 4 institutions in the United States or Europe. In a previous study, a multivariate classifier was developed in a biopsy training set of BE ND, IND, and LGD pre-progression of patients who progressed to HGD / CAD in s 1 year (n = 41) and baseline biopsies of matched progression-free controls (n = 142). Biopsy sections were fluorescently immunostained for a pool of 14 epithelial and stromal biomarkers, imaged and analyzed by image analysis software to extract quantitative biomarkers and morphometric characteristics. In the training set, a 3-level classifier was selected based on 15 quantitative characteristics from 9 biomarkers and morphology. In the study presented here, the selected 3-level classifier was evaluated in an independent validation set of BE biopsies with diagnoses of ND, IND, or LGD from patients who had a diagnosis of HGD or CAD in <1 year ( prevalent cases, n = 30) and matched progression-free controls (n = 145).
Resultados: El clasificador detectó múltiples cambios moleculares y celulares en biopsias de BE ND, IND y LGD de pacientes con prevalencia de HGD o EAC. El clasificador de 3 niveles estratificó a los pacientes en clases de riesgo bajo, intermedio y alto en el conjunto de validación independiente de casos prevalentes y pacientes sin progresión (cociente de riesgo 23,18; intervalo de confianza del 95 % 8,57-62,73 para BE de riesgo alto frente a riesgo bajo, p < 0,0001 (FIG. 6)). Las clases de riesgo previstas por el clasificador también proporcionaron información de pronóstico independiente que superó el diagnóstico patológico proporcionado por patólogos generalistas y subespecialistas gastrointestinales (Tabla 10).Results: The classifier detected multiple molecular and cellular changes in BE ND, IND and LGD biopsies from patients with prevalence of HGD or CAD. The 3-level classifier stratified patients into low, intermediate and high risk classes in the independent validation set of prevalent cases and patients without progression (hazard ratio 23.18; 95% confidence interval 8.57-62 .73 for high-risk vs. low-risk BE, p <0.0001 (FIG. 6)). The risk classes predicted by the classifier also provided independent prognostic information that exceeded the pathological diagnosis provided by generalist and subspecialty gastrointestinal pathologists (Table 10).
Tabla 10. Rendimiento de clases de riesgo previstas por la prueba frente al diagnóstico patológico en la r ifi i n i n n BE n H DEA r v l n rir i n n BE in r r i n.Table 10. Performance of risk classes predicted by the test against pathological diagnosis in r ifi i n i n n BE n H DEA r v l n rir i n n BE in r r i n.

Conclusiones: Una prueba de patología de sistemas tisulares predice mejor la presencia de HGD y EAC prevalentes en BE que las variables clínico-patológicas, y puede mejorar la histología como método de diagnóstico objetivo para identificar pacientes que requieren intervención terapéutica. Los resultados indican que los cambios moleculares y celulares asociados con la transformación maligna en BE pueden extenderse más allá de áreas con HGD o EAC definitivo y pueden detectare como un efecto de campo mediante la prueba de patología de sistemas tisulares. Conclusions: A tissue system pathology test better predicts the presence of HGD and CAD prevalent in BE than clinicopathological variables, and can improve histology as an objective diagnostic method to identify patients requiring therapeutic intervention. The results indicate that the molecular and cellular changes associated with malignant transformation into BE can extend beyond areas with definitive HGD or CAD and can be detected as a field effect by tissue systems pathology testing.
EJEMPLO 3. Antecedentes: Existe una necesidad de herramientas mejoradas para detectar displasia de alto grado (HGD) y adenocarcinoma de esófago (EAC) en pacientes con esófago de Barrett (BE). En trabajos anteriores, se demostró que un clasificador de 3 niveles predijo el riesgo de progresión de incidentes en BE. El presente objetivo fue determinar si este clasificador de riesgo podría detectar un efecto de campo en biopsias no displásicas (ND), indefinidas para displasia (IND) o displasia de bajo grado (LGD) a partir de pacientes con BE con HGD/EAC prevalente. EXAMPLE 3. Background: There is a need for improved tools to detect high-grade dysplasia (HGD) and adenocarcinoma of the esophagus (CAD) in patients with Barrett's esophagus (BE). In previous work, it was shown that a 3-level classifier predicted the risk of incident progression in BE. The present objective was to determine if this risk classifier could detect a field effect in non-dysplastic (ND), undefined biopsies for dysplasia (IND) or low-grade dysplasia (LGD) from BE patients with prevalent HGD / CAD.
Métodos: Se realizó un estudio de casos y controles multiinstitucional para evaluar un clasificador de riesgo desarrollado previamente que se basa en características de imagen cuantitativas procedentes de 9 biomarcadores y morfología, y predice el riesgo de HGD/EAC en pacientes con BE. El clasificador de riesgo se evaluó en biopsias ND, IND y LGD de pacientes con BE diagnosticados con HGD/EAC en endoscopia repetida (casos prevalentes, n = 30, mediana de tiempo hasta el diagnóstico de HGD/EAC 140,5 días) y en pacientes sin progresión (controles, n = 145, mediana del tiempo de vigilancia libre de HGD/EAC 2.015 días). Methods: A multi-institutional case-control study was conducted to evaluate a previously developed risk classifier that is based on quantitative imaging characteristics from 9 biomarkers and morphology, and predicts the risk of HGD / CAD in BE patients. The risk classifier was evaluated in ND, IND and LGD biopsies of patients with BE diagnosed with HGD / CAD in repeated endoscopy (prevalent cases, n = 30, median time to diagnosis of HGD / CAD 140.5 days) and in patients without progression (controls, n = 145, median HGD / EAC-free surveillance time 2,015 days).
Resultados: El clasificador de riesgo estratificó los casos prevalentes y los pacientes sin progresión en clases de riesgo bajo, intermedio y alto (cociente de posibilidades, 46,0; intervalo de confianza del 95 %, 14,86-169 (alto riesgo frente a bajo riesgo); p < 0,0001). El clasificador también proporcionó información de pronóstico independiente que superó al diagnóstico del subespecialista y generalista. Results: The risk classifier stratified prevalent cases and patients without progression into low, intermediate and high risk classes (odds ratio, 46.0; 95% confidence interval, 14.86-169 (high risk vs. low risk); p <0.0001). The classifier also provided independent prognostic information that outperformed the subspecialist and generalist diagnosis.
Conclusión: Una prueba de patología de sistemas tisulares predice mejor la prevalencia de HGD/EAC en pacientes con BE que las variables patológicas. Los resultados indican que cambios moleculares y celulares asociados con la transformación maligna en BE se pueden detectar como un efecto de campo utilizando la prueba. Conclusion: A tissue systems pathology test better predicts the prevalence of HGD / CAD in patients with BE than pathological variables. The results indicate that molecular and cellular changes associated with malignant transformation into BE can be detected as a field effect using the test.
IntroducciónIntroduction
El esófago de Barrett (BE) es un precursor del adenocarcinoma de esófago (EAC), que es el tipo de cáncer de más rápido crecimiento por incidencia en EE.UU. con tasas de supervivencia a 5 años de un 18 % (1). El EAC se puede prevenir si la displasia se detecta y se trata temprano con terapias de erradicación endoscópica tales como ablación por radiofrecuencia (RFA) y/o la resección endoscópica de la mucosa (EMR) (2-4). Las pautas actuales del American College of Gastroenterology (ACG) recomiendan la vigilancia por endoscopia con biopsias a intervalos determinados por el diagnóstico patológico (5). El diagnóstico de displasia en BE está limitado por la naturaleza aleatoria del muestreo endoscópico, que pueden pasar por alto áreas displásicas y por variación entre observadores (6). Si bien endoscopistas expertos pueden detectar lesiones sutiles que contienen displasia de alto grado (HGD) y EAC en centros de gran volumen, el reconocimiento de lesiones sutiles es más desafiante en el entorno comunitario (7). Estas limitaciones pueden dar como resultado endoscopias repetidas y diagnósticos tardíos de HGD y EAC (8). Barrett's esophagus (BE) is a precursor to adenocarcinoma of the esophagus (CAD), which is the fastest growing cancer by incidence in the US with 5-year survival rates of 18% (1). CAD can be prevented if dysplasia is detected and treated early with endoscopic eradication therapies such as radiofrequency ablation (RFA) and / or endoscopic mucosal resection (EMR) (2-4). Current American College of Gastroenterology (ACG) guidelines recommend endoscopic surveillance with biopsies at intervals determined by pathologic diagnosis (5). The diagnosis of dysplasia in BE is limited by the random nature of endoscopic sampling, which may miss dysplastic areas, and by inter-observer variation (6). While skilled endoscopists can detect subtle lesions containing high-grade dysplasia (HGD) and CAD in high-volume centers, the recognition of subtle lesions is more challenging in the community setting (7). These limitations can result in repeated endoscopies and late diagnoses of HGD and CAD (8).
Se ha descrito un efecto de campo en muchos tipos diferentes de cáncer, incluso en EAC (9, 10). La displasia y el EAC pueden ser multifocales en BE. Se han encontrado las mismas mutaciones y metilación anómala de ADN en múltiples niveles y en grandes campos en BE (11, 12), lo que indica cancerización de campo. Un campo preneoplásico que rodea una HGD o EAC puede parecer histológicamente no displásico (ND) o displasia de bajo grado (LGD), pero exhibe cambios moleculares y celulares asociados con la transformación maligna. La detección de anomalías en este campo ampliado puede superar las limitaciones del muestreo aleatorio y los diagnósticos subjetivos, permitiendo un diagnóstico más temprano de HGD y EAC.A field effect has been described in many different types of cancer, including CAD (9, 10). Dysplasia and CAD can be multifocal in BE. The same mutations and abnormal DNA methylation have been found at multiple levels and in large fields in BE (11, 12), indicating field cancerization. A preneoplastic field surrounding a HGD or CAD may appear histologically nondysplastic (ND) or low-grade dysplasia (LGD), but exhibits molecular and cellular changes associated with malignant transformation. Detection of abnormalities in this expanded field can overcome the limitations of random sampling and subjective diagnoses, allowing earlier diagnosis of HGD and CAD.
Se han evaluado muchos biomarcadores en BE (13-16) y la British Society of Gastroenterology (BSG) recomienda la inmunohistoquímica (IHC) de p53 para ayudar al diagnóstico de displasia (17). Sin embargo, no se han validado biomarcadores para detectar de forma fiable el efecto de campo o las anomalías asociadas con la displasia prevalente y el EAC en BE. Se ha demostrado que un enfoque de patología de sistemas tisulares basado en una plataforma de imágenes que cuantifica tanto anomalías epiteliales como estromales ayuda a distinguir la HGD de BE no displásico con atipia reactiva (18, 19). También se ha demostrado que este enfoque de imágenes predice la progresión de incidentes en BE, mediante la cuantificación objetiva de características moleculares y celulares que preceden cambios morfológicos definitivos (20) (FIG. 7). El ensayo emplea mareaje de inmunofluorescencia multiplexado de 9 biomarcadores epiteliales y estromales en secciones a partir de biopsias fijadas con formalina e incluidas en parafina (FFPE). Se obtienen imágenes de los portaobjetos marcados con fluorescencia mediante escaneo de fluorescencia de portaobjetos completo, y el programa informático de análisis de imágenes automatizado extrae datos cuantitativos de expresión y localización de los biomarcadores y la morfología. La etapa final utiliza un clasificador multivariante para integrar los datos del análisis de imágenes cuantitativo en puntuaciones individualizadas que se correlacionan con el riesgo de HGD/EAC (FIG. 7 (20)). Esto puede tener aplicaciones en la detección de cambios moleculares y celulares en el campo preneoplásico expandido asociado con HGD/EAC. El objetivo de este estudio fue determinar si este ensayo puede detectar anomalías indicativas de un efecto de campo en biopsias ND, indefinidas para displasia (IND) y LGD de pacientes con BE con HGD/EAC prevalente.Many biomarkers have been evaluated in BE (13-16) and the British Society of Gastroenterology (BSG) recommends immunohistochemistry (IHC) of p53 to aid in the diagnosis of dysplasia (17). However, biomarkers have not been validated to reliably detect field effect or abnormalities associated with prevalent dysplasia and CAD in BE. An imaging platform-based approach to tissue systems pathology that quantifies both epithelial and stromal abnormalities has been shown to help distinguish HGD from nondysplastic BE with reactive atypia (18, 19). This imaging approach has also been shown to predict the progression of incidents in BE, by objective quantification of molecular and cellular characteristics that precede definitive morphological changes (20) (FIG. 7). The assay employs multiplexed immunofluorescence marking of 9 epithelial and stromal biomarkers in sections from formalin-fixed and paraffin-embedded (FFPE) biopsies. Fluorescence-labeled slides are imaged by full-slide fluorescence scanning, and the automated image analysis software extracts quantitative biomarker localization and expression data and morphology. The final stage uses a multivariate classifier to integrate the data from the quantitative image analysis into individualized scores that correlate with the risk of HGD / CAD (FIG. 7 (20)). This may have applications in detecting molecular and cellular changes in the expanded preneoplastic field associated with HGD / EAC. The aim of this study was to determine whether this assay can detect abnormalities indicative of a field effect in ND, undefined for dysplasia (IND) and LGD biopsies from BE patients with prevalent HGD / CAD.
Materiales y métodosMaterials and methods
Diseño del estudio y pacientesStudy design and patients
Se construyó un estudio de casos y controles que utilizó una cohorte multicéntrica de pacientes con BE con datos de resultados clínicos de cuatro instituciones de alto volumen (Geisinger Health System, Universidad de Pittsburgh, Universidad de Pensilvania y Academic Medical Center (AMC), Amsterdam, Holanda). Se recuperaron casos de BE con ND, IND o LGD confirmado por un patólogo subespecialista gastrointestinal (Gl) (J.M.D., J.L., N.C.J.). Para pacientes con múltiples niveles de biopsia tomados en la misma endoscopia, se seleccionó la biopsia con mayor diagnóstico determinado por un patólogo subespecialista Gl (LGD fue el diagnóstico más alto, luego IND y ND fue el más bajo). Para pacientes con múltiples niveles de biopsia con el mismo diagnóstico, el patólogo de cada institución seleccionó un bloque representativo con suficiente tejido para análisis. Los criterios de inclusión fueron la disponibilidad de bloques de tejido y datos clínico-patológicos, y la confirmación de metaplasia intestinal por un subespecialista Gl. Los criterios de exclusión fueron la calidad insuficiente de tejido (evaluada por un patólogo) y el uso de fijador de Bouin o azul de metileno en el procesamiento de la muestra que puede interferir con el inmunomarcaje de fluorescencia. Los casos fueron pacientes que tenían HGD/EAC en la endoscopia repetida en < 1 año (n = 23) o tenían antecedentes de HGD/EAC tratados, volvieron a ND, IND o LGD y tuvieron HGD/EAC en endoscopia repetida (n = 7) (casos prevalentes, n = 30 en total). Se incluyeron casos prevalentes con y sin antecedentes previos, como se describió anteriormente, ya que ambos subgrupos de pacientes pueden albergar HGD o EAC temprano que pueden ser difíciles de reconocer durante la endoscopia. Los controles sin progresión no mostraron HGD/EAC en la endoscopia repetida y tuvieron una mediana de tiempo de vigilancia libre de HGD/EAC de 5,6 años (n = 145). Los elementos de información recopilados fueron: fecha de recogida del caso, diagnóstico patológico original y diagnóstico del subespecialista Gl para el caso probado en este estudio, fecha y diagnóstico original de cada biopsia de vigilancia, criterio de valoración de la progresión (HGD/EAC), tiempo de vigilancia libre de HGD/EAC (tiempo entre el caso probado y el diagnóstico de HGD/EAC o el último seguimiento), edad, sexo y longitud del segmento (cm) y clase de segmento (corto s 3 cm, largo > 3 cm). El estudio fue aprobado por las juntas de revisión institucional de cada institución.A case-control study was constructed using a multicenter cohort of BE patients with clinical outcome data from four high-volume institutions (Geisinger Health System, University of Pittsburgh, University of Pennsylvania, and Academic Medical Center (AMC), Amsterdam, Holland). Cases of BE with ND, IND or LGD confirmed by a gastrointestinal (Gl) subspecialty pathologist (JMD, JL, NCJ) were recovered. For patients with multiple levels of biopsy taken at the same endoscopy, the biopsy with the highest diagnosis determined by a Gl subspecialty pathologist was selected (LGD was the highest diagnosis, then IND and ND was the lowest). For patients with multiple levels of biopsy with the same diagnosis, the pathologist at each institution selected a representative block with enough tissue for analysis. The inclusion criteria were the availability of tissue blocks and clinicopathological data, and the confirmation of intestinal metaplasia by a Gl subspecialist. Exclusion criteria were insufficient tissue quality (assessed by a pathologist) and the use of Bouin's fixative or methylene blue in sample processing which may interfere with fluorescence immunostaining. The cases were patients who had HGD / CAD on repeat endoscopy in <1 year (n = 23) or had a history of treated HGD / CAD, returned to ND, IND or LGD and had HGD / CAD on repeat endoscopy (n = 7 ) (prevalent cases, n = 30 in total). Prevalent cases with and without prior history were included, as described above, as both subgroups of patients may harbor HGD or early CAD that can be difficult to recognize during endoscopy. Controls without progression showed no HGD / CAD on repeat endoscopy and had a median HGD / CAD-free surveillance time of 5.6 years (n = 145). The information elements collected were: date of collection of the case, original pathological diagnosis and diagnosis of the Gl subspecialist for the case tested in this study, date and original diagnosis of each surveillance biopsy, endpoint of progression (HGD / EAC) , HGD / CAD free surveillance time (time between the tested case and the diagnosis of HGD / CAD or the last follow-up), age, sex and segment length (cm) and segment class (short s 3 cm, long> 3 cm). The study was approved by the institutional review boards of each institution.
Inmunomarcaje por fluorescenciaFluorescence immunostaining
Se tiñeron secciones de 5 pm de biopsias de BE FFPE con H&E mediante métodos histológicos estándar. K20, p16INK4a, AMACR, p53, HER2/neu, CD68, COX-2, HIF-1ay CD45RO se marcaron mediante inmunofluorescencia multiplexada de acuerdo con los métodos descritos anteriormente (19). Los biomarcadores se multiplexaron en subgrupos de 3 anticuerpos primarios por portaobjetos detectados a través de anticuerpos secundarios conjugados con Alexa Fluor-488, -555 y -647 y Hoechst-33342 para marcar el ADN (Life Technologies, Carlsbad, California). Imágenes de portaobjetos completas5 pm sections of BE FFPE biopsies were stained with H&E by standard histological methods. K20, p16INK4a, AMACR, p53, HER2 / neu, CD68, COX-2, HIF-1a, and CD45RO were labeled by multiplexed immunofluorescence according to the methods previously described (19). Biomarkers were multiplexed into subsets of 3 primary antibodies per slide detected via Alexa Fluor-488, -555 and -647 conjugated secondary antibodies and Hoechst-33342 to label DNA (Life Technologies, Carlsbad, California). Complete slide images
Se tomaron imágenes de portaobjetos teñidos con H&E con un aumento de 20x en un escáner de patología digital NanoZoomer (Hamamatsu Photonics, KK, Japón). Se obtuvieron imágenes de portaobjetos inmunomarcados con fluorescencia utilizando un procedimiento operativo estándar con un aumento de 20x en un ScanScope FL (Leica BioSystems, Vista, CA) como se describió anteriormente (19).H&E stained slides were imaged at 20x magnification on a NanoZoomer digital pathology scanner (Hamamatsu Photonics, KK, Japan). Fluorescence immunolabelled slides were imaged using standard operating procedure at 20x magnification on a ScanScope FL (Leica BioSystems, Vista, CA) as previously described (19).
Análisis de imágenesImage analysis
Se analizaron imágenes de fluorescencia de portaobjetos completos utilizando la plataforma de análisis de imágenes TissueCypher™ (Cernostics, Inc., Pittsburgh, PA), que utiliza algoritmos automatizados de análisis de imágenes de tejidos para segmentar objetos basados en células y estructuras de tejidos (por ejemplo, compartimentos epiteliales y estromales) para permitir la recopilación de datos de características de morfología y biomarcadores cuantitativos y contextúales. Los algoritmos de análisis de imágenes se han descrito en detalle anteriormente (19). Las 15 características empleadas por el clasificador de riesgo (Tabla 2, (20)) se extrajeron de las imágenes de tejidos de portaobjetos completos de fluorescencia.Fluorescence images of whole slides were analyzed using the TissueCypher ™ image analysis platform (Cernostics, Inc., Pittsburgh, PA), which uses automated tissue image analysis algorithms to segment cell-based objects and tissue structures (e.g. example, epithelial and stromal compartments) to allow data collection of morphology characteristics and quantitative and contextual biomarkers. Image analysis algorithms have been described in detail previously (19). The 15 characteristics employed by the risk classifier (Table 2, (20)) were extracted from the tissue images of full fluorescence slides.
Análisis estadísticosStatistical analysis
En un estudio previo se desarrolló un clasificador de predicción de riesgo para la predicción de la progresión de incidentes a HGD/EAC (FIG. 7 (20)). En este estudio, se probó la hipótesis de que los pacientes en la clase de alto riesgo pronosticado tienen un riesgo significativamente mayor de presencia de HGD/EAC prevalente que los pacientes en la clase de riesgo bajo pronosticado. También se probó la hipótesis de que las clases de riesgo proporcionarían información de pronóstico independiente y más sólida más allá de la del diagnóstico patológico (patólogo subespecialista Gl o generalista). Los cálculos del tamaño de la muestra indicaron que se requirió un total de 43 pacientes (incluyendo los casos prevalentes y sin progresión) para asegurar un poder de un 80 % para detectar una diferencia significativa de un 50 % en el riesgo de HGD/EAC prevalente entre los clasificados como de alto riesgo frente a de bajo riesgo, a un nivel de significancia de 0,05. Todos los parámetros del ensayo fueron especificados previamente, incluyendo las 15 características/mediciones de análisis de imágenes, parámetros de escala, el modelo clasificador y los valores de corte definidos en el estudio anterior (20). Se calculó la puntuación de riesgo y la clase de riesgo (bajo, intermedio o alto) para cada caso.In a previous study, a risk prediction classifier was developed to predict the progression of incidents to HGD / CAD (FIG. 7 (20)). In this study, we tested the hypothesis that patients in the predicted high-risk class have a significantly higher risk of prevalent HGD / CAD than patients in the predicted low-risk class. The hypothesis that risk classes would provide independent and more robust prognostic information beyond that of pathological diagnosis (Gl subspecialty or general pathologist) was also tested. Sample size calculations indicated that a total of 43 patients (including prevalent and progression-free cases) were required to ensure 80% power to detect a significant 50% difference in the risk of prevalent HGD / CAD among those classified as high risk versus low risk, at a significance level of 0.05. All trial parameters were previously specified, including the 15 image analysis characteristics / measurements, scale parameters, the classifier model, and cutoff values defined in the previous study (20). The risk score and the risk class (low, intermediate or high) were calculated for each case.
Las curvas de rendimiento diagnóstico (curvas ROC) se trazaron basándose en el resultado binario del diagnóstico posterior de HGD/EAC (casos) frente a sin progresión de la enfermedad (control) y las puntuaciones de riesgo continuo de la prueba. También se trazaron curvas ROC para el porcentaje de células que sobreexpresan p53 (determinado por el programa informático de análisis de imágenes como se describió anteriormente (19)). La comparación con p53 se realizó ya que el BSG recomienda el IHC p53 para ayudar en el diagnóstico de displasia (17). Se utilizó regresión logística para evaluar la significancia de la asociación de los grupos de riesgo pronosticados como variable independiente con el diagnóstico posterior de HGD/EAC prevalente o no como variable dependiente. A partir de la regresión logística se calcularon los cocientes de posibilidades (OR) con un IC del 95 % que miden la fuerza de la asociación entre los grupos de riesgo previstos y el diagnóstico posterior de HGD/EAC. Diagnostic performance curves (ROC curves) were plotted based on the binary outcome of the subsequent diagnosis of HGD / CAD (cases) versus no disease progression (control) and the continuous risk scores of the test. ROC curves were also plotted for the percentage of cells overexpressing p53 (determined by the image analysis computer program as previously described (19)). The comparison with p53 was made since the BSG recommends the IHC p53 to aid in the diagnosis of dysplasia (17). Logistic regression was used to evaluate the significance of the association of the risk groups predicted as an independent variable with the subsequent diagnosis of HGD / CAD prevalent or not as a dependent variable. From the logistic regression, the odds ratios (OR) with a 95% CI were calculated, which measure the strength of the association between the predicted risk groups and the subsequent diagnosis of HGD / CAD.
Comparación del rendimiento del clasificador frente al diagnóstico patológico: Se realizó una regresión logística multivariante y una regresión de Cox multivariante para comparar el rendimiento de las clases de riesgo producidas por el clasificador frente al diagnóstico patológico por un generalista o subespecialista Gl incluida como la variable independiente, en la predicción del diagnóstico posterior de HGD/EAC incluido como variable dependiente. El diagnóstico patológico fue dicotomizado: LGD frente a ND e IND combinados. Los casos de IND y ND se combinaron debido al tamaño de muestra limitado del subconjunto de IND (2 casos sin progresión y 1 prevalente tenían un diagnóstico del subespecialista de IND). Comparison of the performance of the classifier against the pathological diagnosis: A multivariate logistic regression and a multivariate Cox regression were performed to compare the performance of the risk classes produced by the classifier against the pathological diagnosis by a generalist or subspecialist Gl included as the independent variable , in the prediction of the subsequent diagnosis of HGD / CAD included as a dependent variable. The pathological diagnosis was dichotomized: LGD versus ND and IND combined. IND and ND cases were combined due to the limited sample size of the IND subset (2 cases without progression and 1 prevalent had a diagnosis from the IND subspecialist).
ResultadosResults
Pacientes:Patients:
La cohorte de casos y controles incluyó biopsias con diagnóstico de ND (n = 13), IND (n = 1) o LGD (n = 16) de 30 pacientes con BE con HGD o EAC (casos prevalentes, mediana de tiempo hasta el diagnóstico de HGD/EAC 140,5 días, IQR 56, 241) y 145 muestras de pacientes de control emparejados con datos de resultados clínicos que no muestran progresión de la enfermedad (ND n = 138, IND n = 2, LGD n = 5, tiempo medio de vigilancia libre de HGD/EAC 2.015 días, IQR 1.498, 3.111). 22/30 casos prevalentes se diagnosticaron con HGD y 8/30 fueron diagnosticados con EAC en la endoscopia repetida (Tabla 11). Los pacientes control eran de una cohorte evaluada en un estudio previo (20), mientras que los casos prevalentes no se habían evaluado previamente. La mayoría de los pacientes eran hombres, y una mayor proporción de pacientes con HGD/EAC eran hombres (93,3 %) y tenían EB de segmento largo (63,3 %) en comparación con pacientes sin progresión (78,6 % eran hombres, 50,3 % tenían segmento largo ), lo cual es consistente con los estudios epidemiológicos publicados en EAC (21, 22). Las características clínicas de los pacientes se resumen en la Tabla 11.The case-control cohort included biopsies with a diagnosis of DN (n = 13), IND (n = 1) or LGD (n = 16) of 30 patients with BE with HGD or CAD (prevalent cases, median time to diagnosis of HGD / EAC 140.5 days, IQR 56, 241) and 145 samples from control patients matched with clinical outcome data showing no disease progression (ND n = 138, IND n = 2, LGD n = 5, mean HGD / EAC surveillance time 2015 days, IQR 1,498, 3,111). 22/30 prevalent cases were diagnosed with HGD and 8/30 were diagnosed with CAD on repeat endoscopy (Table 11). Control patients were from a cohort evaluated in a previous study (20), while prevalent cases had not been previously evaluated. Most of the patients were men, and a greater proportion of patients with HGD / CAD were men (93.3%) and had long-segment BE (63.3%) compared to patients without progression (78.6% were men, 50.3% had long segment), which is consistent with epidemiological studies published in EAC (21, 22). The clinical characteristics of the patients are summarized in Table 11.
Rendimiento del clasificador de riesgo de 15 características en la estratificación de casos prevalentes de pacientes sin progresión:Performance of the 15-characteristic risk classifier in the stratification of prevalent cases of patients without progression:
El clasificador de riesgo de 15 características especificado previamente se evaluó en el conjunto de biopsias BE de casos prevalentes y pacientes sin progresión. El análisis ROC basado en el resultado binario (diagnóstico posterior de HGD/EAC frente a ninguna progresión de la enfermedad) y las puntuaciones de riesgo continuo mostraron que el clasificador tenía la capacidad de distinguir HGD/EAC prevalente de pacientes sin progresión con AUROC de 0,893, mientras que el % de células que sobreexpresan p53 tenía AUROC de 0,594 (Figura 8, Panel A). Se realizaron subanálisis en los subconjuntos de casos prevalentes con y sin antecedentes de HGD o EAC, ya que los casos con antecedentes de HGD/EAC pueden albergar un mayor número de mutaciones y otras anomalías que los casos sin antecedentes. El análisis ROC de los subconjuntos de casos prevalentes con y sin antecedentes de HGD o EAC (n = 7 y 23, respectivamente) mostró que el clasificador tenía un fuerte rendimiento predictivo para distinguir ambos subconjuntos de pacientes sin progresión (AUROC = 0,926 y 0,883, respectivamente). AUROC para las subclases ND/IND y LGD fueron 0,873 y 0,792, respectivamente. Un diagrama de caja y bigotes mostró puntuaciones de riesgo de 15 características más altas en los casos prevalentes frente a pacientes sin progresión (p < 0,0001, Figura 8, Panel B). La regresión logística demostró que el clasificador de 15 características podría estratificar pacientes con riesgos significativamente diferentes de HGD/EAC prevalente; Los OR fueron 46,0 (IC del 95 % 14,86-169, p < 0,0001) para la comparación del grupo de riesgo alto frente a riesgo bajo y 7,67 (IC del 95 % 2,24-28,14, p = 0,001) para el grupo de riesgo intermedio frente al de riesgo bajo (Figura 8, Panel C). El clasificador identificó tanto biopsias no displásicas como LGD de casos prevalentes como de riesgo alto (Figura 8, Panel D). La probabilidad de diagnóstico de HGD/EAC en la endoscopia repetida aumentó continuamente a medida que aumentaba la puntuación de riesgo de 15 características (Figura 8, Panel E). En la regresión logística multivariante en la que el diagnóstico posterior de HGD/EAC se evaluó primero en relación con el diagnóstico patológico solo, luego, en relación con las clases de riesgo previstas añadidas al diagnóstico patológico, la magnitud de los OR indicó que la clase de alto riesgo prevista proporcionó un poder predictivo independiente y más fuerte que el diagnóstico patológico por el generalista o subespecialista Gl en esta cohorte de pacientes (Tabla 12). Se obtuvieron resultados similares con modelos de regresión de Cox multivariante (datos no mostrados).The previously specified 15-characteristic risk classifier was evaluated in the set of BE biopsies from prevalent cases and patients without progression. ROC analysis based on binary outcome (subsequent diagnosis of HGD / CAD versus no disease progression) and continuous risk scores showed that the classifier had the ability to distinguish prevalent HGD / CAD from progression-free patients with AUROC of 0.893 , while the% of cells overexpressing p53 had AUROC of 0.594 (Figure 8, Panel A). Sub-analyzes were performed on subsets of prevalent cases with and without a history of HGD or CAD, as cases with a history of HGD / CAD may harbor a greater number of mutations and other abnormalities than cases without a history. The ROC analysis of the subsets of prevalent cases with and without a history of HGD or CAD (n = 7 and 23, respectively) showed that the classifier had a strong predictive performance to distinguish both subsets of patients without progression (AUROC = 0.926 and 0.883, respectively). AUROC for the ND / IND and LGD subclasses were 0.873 and 0.792, respectively. A box-and-whisker plot showed risk scores of 15 higher characteristics in prevalent cases versus patients without progression (p <0.0001, Figure 8, Panel B). Logistic regression demonstrated that the 15-feature classifier could stratify patients with significantly different risks for prevalent HGD / CAD; The ORs were 46.0 (95% CI 14.86-169, p <0.0001) for the comparison of the high risk versus low risk group and 7.67 (95% CI 2.24-28, 14, p = 0.001) for the intermediate versus low-risk group (Figure 8, Panel C). The classifier identified both non-dysplastic and LGD biopsies from prevalent and high-risk cases (Figure 8, Panel D). The probability of diagnosis of HGD / CAD on repeat endoscopy increased continuously as the risk score for 15 characteristics increased (Figure 8, Panel E). In multivariate logistic regression in which the subsequent diagnosis of HGD / CAD was first assessed in relation to the pathological diagnosis alone, then in relation to the predicted risk classes added to the pathological diagnosis, the magnitude of the ORs indicated that the class Predicted high risk provided an independent and stronger predictive power than pathological diagnosis by the generalist or subspecialist Gl in this cohort of patients (Table 12). Similar results were obtained with multivariate Cox regression models (data not shown).
Los pacientes identificados como de alto riesgo exhibieron múltiples anomalías epiteliales y estromales que se cuantifican mediante las 15 características de análisis de imágenes utilizadas por el clasificador de riesgo. Las anomalías detectadas en las biopsias ND y LGD en pacientes con HGD/EAC prevalente incluyeron sobreexpresión de p53, HER2/neu y COX-2, sobreexpresión focal de AMACR, infiltración de la lámina propia por células CD45RO-positivas, células CD68-positivas y células estromales que expresan HIF-1a (Figura 9). El mayor poder predictivo de las clases de riesgo en comparación con el diagnóstico patológico se ilustró en un paciente con segmento de 2 cm de BE con biopsias disponibles de dos niveles endoscópicos. Las biopsias de 32 cm y 34 cm se diagnosticaron como ND y LGD, respectivamente, por un subespecialista Gl en este estudio, y como ND e IND, respectivamente, por un patólogo general que registró el diagnóstico original. La biopsia repetida 56 días después mostró HGD. Las biopsias de los dos niveles, que se evaluaron con fines ilustrativos, obtuvieron una puntuación de 8,9 y 8,7 (en una escala de 0-10) con la puntuación de riesgo de 15 características, demostrando que estaban presentes cambios moleculares y celulares de alto riesgo similares en ambos niveles de biopsia a pesar del diagnóstico patológico diferente (Figura 10, Paneles A-J). Patients identified as high risk exhibited multiple epithelial and stromal abnormalities that are quantified using the 15 image analysis characteristics used by the risk classifier. Abnormalities detected in ND and LGD biopsies in patients with prevalent HGD / CAD included overexpression of p53, HER2 / neu, and COX-2, focal overexpression of AMACR, infiltration of the lamina propria by CD45RO-positive cells, CD68-positive cells, and stromal cells expressing HIF-1a (Figure 9). The greater predictive power of the risk classes compared to the pathological diagnosis was illustrated in a patient with a 2 cm segment of BE with available biopsies of two endoscopic levels. The 32 cm and 34 cm biopsies were diagnosed as ND and LGD, respectively, by a Gl subspecialist in this study, and as ND and IND, respectively, by a general pathologist who recorded the original diagnosis. The repeat biopsy 56 days later showed HGD. The biopsies of the two levels, which were evaluated for illustrative purposes, obtained a score of 8.9 and 8.7 (on a scale of 0-10) with the risk score of 15 characteristics, demonstrating that molecular changes were present and Similar high-risk cells at both biopsy levels despite different pathological diagnosis (Figure 10, Panels AJ).
DebateDebate
Utilizando un diseño de estudio de casos y controles, se validó un clasificador multivariante que evalúa biopsias ND, IND y LGD para detectar prevalencia de HGD/EAC en pacientes con BE. La prueba integra biomarcadores cuantitativos y datos morfométricos en una puntuación de riesgo e incorpora una estratificación de riesgo de 3 niveles para clasificar pacientes como de riesgo bajo, intermedio o alto de HGD/EAC. El grupo de pacientes de alto riesgo previsto tenía un riesgo 46 veces mayor de HGD/EAC prevalente en comparación con el grupo de bajo riesgo. De manera importante, las clases de riesgo proporcionaron un poder predictivo más fuerte que el diagnóstico del patólogo generalista y Gl experto en esta cohorte de pacientes, y demostraron una alta precisión en la detección de la presencia de HGD/EAC prevalente, incluso en biopsias no displásicas. El ensayo de patología de sistemas tisulares utilizado en este estudio, por lo tanto, puede proporcionar a médicos y pacientes una puntuación individualizada que indique el potencial de HGD/EAC prevalente, que puede ayudar en la toma de decisiones sobre exámenes de vigilancia más rigurosos y terapia endoscópica en pacientes con BE con ND, IND o LGD. Este estudio se vio reforzado por el uso de una cohorte diversa de pacientes de cuatro instituciones de gran volumen en EE.UU. y Europa. El estudio se vio reforzado por la tecnología de ensayo, que evalúa múltiples rutas asociadas con la carcinogénesis, y también es cuantitativa y objetiva. El ensayo se puede realizar en secciones de bloques FFPE y, por tanto, es compatible con la práctica clínica.Using a case-control study design, a multivariate classifier that assesses ND, IND, and LGD biopsies to detect prevalence of HGD / CAD in BE patients was validated. The test integrates quantitative biomarkers and morphometric data into a risk score and incorporates a 3-level risk stratification to classify patients as low, intermediate, or high risk for HGD / CAD. The predicted high-risk group of patients had a 46-fold increased risk of prevalent HGD / CAD compared to the low-risk group. Importantly, the risk classes provided a stronger predictive power than the general pathologist and GL expert diagnosis in this patient cohort, and demonstrated high precision in detecting the presence of prevalent HGD / CAD, even in non-biopsies. dysplastic. The tissue systems pathology assay used in this study can therefore provide clinicians and patients with an individualized score indicating the potential for prevalent HGD / CAD, which can assist in making decisions about more rigorous surveillance examinations and Endoscopic therapy in BE patients with ND, IND or LGD. This study was enhanced by the use of a diverse cohort of patients from four high-volume institutions in the US and Europe. The study was bolstered by assay technology, which assesses multiple pathways associated with carcinogenesis, and is also quantitative and objective. The assay can be performed in FFPE block sections and is therefore compatible with clinical practice.
Los centros de referencia expertos tienen tasas más altas de detección de HGD/EAC y anomalías de las mucosas que los centros comunitarios, pero el reconocimiento de lesiones sutiles que contienen HGD y EAC temprano puede ser un desafío en todos los entornos (7, 23). La vigilancia endoscópica es eficaz cuando se realiza de acuerdo con las guías de práctica, sin embargo, la adherencia a las pautas varía entre entornos (23, 24). La HGD y el EAC temprano pueden pasar por alto por muestreo aleatorio, lo que puede dar como resultado endoscopias repetidas y retrasos en el diagnóstico y tratamiento de HGD y EAC. Un diagnóstico de LGD confirmado por múltiples subespecialistas Gl es una fuerte variable independiente de progresión maligna (25, 26). Sin embargo, la variabilidad entre observadores en el diagnóstico, incluso entre los subespecialistas Gl, ha sido bien documentado (6, 27).Expert referral centers have higher detection rates for HGD / CAD and mucosal abnormalities than community centers, but early recognition of subtle HGD-containing lesions and CAD can be challenging in all settings (7, 23) . Endoscopic surveillance is effective when performed according to practice guidelines, however adherence to guidelines varies between settings (23, 24). HGD and early CAD can be missed by random sampling, which can result in repeated endoscopies and delays in the diagnosis and treatment of HGD and CAD. A diagnosis of LGD confirmed by multiple Gl subspecialists is a strong independent variable of malignant progression (25, 26). However, inter-observer variability in diagnosis, even among Gl subspecialists, has been well documented (6, 27).
A pesar de los grandes esfuerzos para identificar y validar biomarcadores en BE (13-16), ninguno se ha traducido a la práctica para superar las limitaciones del muestreo aleatorio mediante la detección de un efecto de campo. Se ha demostrado que IHC p53 tiene importancia diagnóstica y pronostica en BE (17, 28). Sin embargo, la evaluación de p53 por sí sola no es suficiente ya que no todos los pacientes tienen anomalías detectables en los niveles de proteína p53, y un subconjunto de pacientes que presentan anomalías de p53 no desarrollan HGD o EAC (14, 29). Enfoques moleculares tales como secuenciación de ADN, expresión génica, perfiles de mutación y metilación se han aplicado a las pruebas de diagnóstico y pronóstico en BE (30-32), pero aún no se han evaluado en la detección de anomalías en el campo expandido que rodea a HGD y EAC. Estas tecnologías tienen la desventaja de requerir la digestión de tejidos, dando como resultado la pérdida de información contextual, tal como morfología nuclear y las relaciones espaciales que son relevantes para los resultados del paciente. Otras desventajas incluyen el requisito de muestras frescas congeladas para algunos de estos enfoques genómicos, que es un problema logístico en la práctica clínica, y también la necesidad de una microdisección láser de áreas de tejido basada en una revisión subjetiva para algunos de estos enfoques.Despite great efforts to identify and validate biomarkers in BE (13-16), none have been translated into practice to overcome the limitations of random sampling by detecting a field effect. IHC p53 has been shown to have diagnostic and prognostic significance in BE (17, 28). However, evaluation of p53 alone is not sufficient as not all patients have detectable abnormalities in p53 protein levels, and a subset of patients with abnormalities of p53 do not develop HGD or CAD (14, 29). Molecular approaches such as DNA sequencing, gene expression, mutation and methylation profiling have been applied to diagnostic and prognostic tests in BE (30-32), but have not yet been evaluated in the detection of abnormalities in the expanded field that surrounds HGD and EAC. These technologies have the disadvantage of requiring tissue digestion, resulting in the loss of contextual information, such as nuclear morphology and spatial relationships that are relevant to patient outcomes. Other disadvantages include the requirement for fresh frozen samples for some of these genomic approaches, which is a logistical problem in clinical practice, and also the need for a laser microdissection of tissue areas based on subjective review for some of these approaches.
El clasificador de riesgo evaluado en este estudio identifica a los pacientes que tienen HGD/EAC prevalente, a pesar de recibir un diagnóstico patológico de ND, IND o LGD. Las anomalías cualificadas por el ensayo incluyen pérdida de supresión tumoral, pérdida del control del ciclo celular, cambios morfológicos, aumento de la inflamación, angiogénesis estromal y patrones alterados de infiltración de células inmunitarias (20). Si se valida en estudios adicionales, este hallazgo sugiere que la detección objetiva de múltiples anomalías moleculares y celulares en el campo preneoplásico de BE podría superar algunas de las limitaciones del muestreo endoscópico aleatorio y el diagnóstico patológico, y permitir la detección más temprana de HGD/EAC en todos los entornos de la práctica. Se requieren estudios adicionales para evaluar el rendimiento del ensayo en biopsias de diferentes niveles endoscópicos. Pruebas ex vivo tales como esta también pueden complementar técnicas endoscópicas más nuevas, tales como la endomicroscopía láser volumétrica (33), proporcionando análisis cuantitativos y objetivos de las rutas implicadas en la transformación maligna.The risk classifier evaluated in this study identifies patients who have prevalent HGD / CAD, despite receiving a pathological diagnosis of ND, IND, or LGD. Assay-qualified abnormalities include loss of tumor suppression, loss of cell cycle control, morphological changes, increased inflammation, stromal angiogenesis, and altered patterns of immune cell infiltration (20). If validated in further studies, this finding suggests that the objective detection of multiple molecular and cellular abnormalities in the preneoplastic field of BE could overcome some of the limitations of random endoscopic sampling and pathological diagnosis, and allow earlier detection of HGD / EAC in all practice settings. Additional studies are required to evaluate the performance of the assay on biopsies at different endoscopic levels. Ex vivo tests such as this can also complement newer endoscopic techniques, such as volumetric laser endomicroscopy (33), providing quantitative and objective analysis of the pathways involved in malignant transformation.
Se reconoce fácilmente las limitaciones de este estudio, que incluyen la naturaleza retrospectiva del estudio, el diseño del estudio de cohortes de casos y controles en el que la proporción de casos prevalentes no era representativa de la población general, y el pequeño número de casos prevalentes disponibles, como se refleja en los amplios intervalos de confianza que se informan. Además, se requerirán estudios más amplios para validar los presente hallazgos. Sin embargo, los grandes estudios prospectivos son un desafío en BE debido a la baja prevalencia de progresión maligna. El conjunto de biopsias y pacientes fue heterogéneo; las biopsias tenían diagnósticos de ND, IND y LGD, 22/30 pacientes tenían HGD prevalente, mientras que 8/30 tenían EAC prevalente, y los intervalos entre la biopsia probada y la endoscopia repetida que demostraba HGD/EAC eran variables. En este estudio se evaluaron biopsias de un solo nivel de endoscopia y se requieren estudios adicionales con biopsias de múltiples niveles de endoscopia de pacientes con lesiones sutiles que contienen HGD o EAC temprano. La cohorte de este estudio incluyó pacientes en vigilancia en múltiples centros en EE.UU. y Europa durante un amplio período de tiempo, lo que impidió la estandarización de variables preanalíticas. Sin embargo, las biopsias reflejan muestras de rutina que requieren una evaluación de riesgos precisa.The limitations of this study are readily recognized, including the retrospective nature of the study, the case-control cohort study design in which the proportion of prevalent cases was not representative of the general population, and the small number of prevalent cases. available, as reflected by the wide confidence intervals that are reported. Furthermore, larger studies will be required to validate the present findings. However, large prospective studies are challenging in BE due to the low prevalence of malignant progression. The set of biopsies and patients was heterogeneous; the biopsies had diagnoses of ND, IND and LGD, 22/30 patients had prevalent HGD, while 8/30 had prevalent CAD, and the intervals between the proven biopsy and the repeat endoscopy demonstrating HGD / CAD were variable. Endoscopic single-level biopsies were evaluated in this study and further studies are required with endoscopic multi-level biopsies from patients with subtle lesions containing HGD or early CAD. The cohort of this study included patients under surveillance at multiple centers in the US and Europe for a long period of time, which prevented the standardization of preanalytical variables. However, the biopsies reflect samples that require an accurate risk assessment.
El ensayo requiere instrumentación y un programa informático que no podrían integrarse fácilmente en los laboratorios de patología actuales, que apenas están comenzando a adoptar la patología digital. El ensayo se ha desplegado en un laboratorio central de referencia equipado con los recursos necesarios, que permite a los médicos de los centros de referencia de expertos y los centros comunitarios solicitar el ensayo. Los portaobjetos sin teñir se pueden enviar al laboratorio de referencia, se realiza el ensayo y el laboratorio proporciona un informe clínico al médico que lo solicita y al patólogo que lo envía. El proceso de prueba tarda aproximadamente 3 días hábiles. El enfoque de prueba se sumaría ¡nicialmente al coste de la vigilancia de BE. Sin embargo, las pruebas de predicción de riesgo pueden dar como resultado el ahorro de costes en pacientes de alto riesgo mediante la reducción de endoscopias repetidas y el tiempo del patólogo requerido para diagnosticar HGD/EAC, permitiendo una intervención más temprana con terapias endoscópicas para reducir la incidencia y la mortalidad por EAC. En pacientes de bajo riesgo existe la posibilidad de reducir los costes futuros mediante la extensión de los intervalos de vigilancia (34, 35). Si bien es factible analizar biopsias de múltiples niveles en BE de segmento largo, esto puede añadir un coste significativo en un subconjunto de pacientes, lo que puede superar el posible ahorro de costes al reducir las endoscopias innecesarias o intervenir temprano para prevenir la progresión.The assay requires instrumentation and software that could not be easily integrated into today's pathology laboratories, which are just beginning to embrace digital pathology. The trial has been deployed in a well-equipped central reference laboratory, allowing clinicians at expert referral centers and community centers to order the trial. The unstained slides can be sent to the reference laboratory, the assay is performed, and the laboratory provides a clinical report to the requesting physician and the submitting pathologist. The testing process takes approximately 3 business days. The trial approach would initially add to the cost of BE surveillance. However, risk prediction tests can result in cost savings in high-risk patients by reducing repeat endoscopies and the pathologist time required to diagnose HGD / CAD, allowing earlier intervention with endoscopic therapies to reduce incidence and mortality from CAD. In low-risk patients there is the possibility of reducing future costs by extending the surveillance intervals (34, 35). While it is feasible to analyze multilevel biopsies in long segment BEs, this can add significant cost in a subset of patients, which may outweigh potential cost savings by reducing unnecessary endoscopies or intervening early to prevent progression.
En resumen, el ensayo de patología de sistemas tisulares examinado en este estudio cuantifica objetivamente múltiples procesos epiteliales y estromales que predicen la prevalencia de HGD/EAC en pacientes con BE. El ensayo puede mejorar los métodos histológicos actuales para permitir una detección más temprana de HGD/EAC, lo que facilitará intervenciones terapéuticas más tempranas y eficaces.In summary, the tissue systems pathology assay examined in this study objectively quantifies multiple epithelial and stromal processes that predict the prevalence of HGD / CAD in BE patients. The trial may improve current histological methods to allow earlier detection of HGD / CAD, which will facilitate earlier and more effective therapeutic interventions.
BIBLIOGRAFÍA PARA EL EJEMPLO 3BIBLIOGRAPHY FOR EXAMPLE 3
1. Cáncer Facts & Figures 2016, American Cáncer Society.1. Cancer Facts & Figures 2016, American Cancer Society.
2. Bulsiewicz WJ, Kim HP, Dellon ES, Cotton CC, Pasricha S, Madanick RD, et al. Safety and efficacy of endoscopic mucosal therapy with radiofrequency ablation for patients with neoplastic Barrett's esophagus. Clin Gastroenterol Hepatol. 2013; 11:636-42.2. Bulsiewicz WJ, Kim HP, Dellon ES, Cotton CC, Pasricha S, Madanick RD, et al. Safety and efficacy of endoscopic mucosal therapy with radiofrequency ablation for patients with neoplastic Barrett's esophagus. Clin Gastroenterol Hepatol. 2013; 11: 636-42.
3. Pasricha S, Bulsiewicz WJ, Hathorn KE, Komanduri S, Muthusamy VR, Rothstein Rl, et al. Durability and predictors of successful radiofrequency ablation for Barrett's esophagus. Clin Gastroentero1Hepatol. 12:1840-7 e1.3. Pasricha S, Bulsiewicz WJ, Hathorn KE, Komanduri S, Muthusamy VR, Rothstein Rl, et al. Durability and predictors of successful radiofrequency ablation for Barrett's esophagus. Clin Gastroentero1Hepatol. 12: 1840-7 e1.
4. Phoa KN, van Vilsteren FG, Weusten BL, Bisschops R, Schoon EJ, Ragunath K, et al. Radiofrequency ablation vs endoscopio surveillance for patients with Barrett esophagus and low-grade dysplasia: a randomized clinical trial. JAMA. 2014;311:1209-17.4. Phoa KN, van Vilsteren FG, Weusten BL, Bisschops R, Schoon EJ, Ragunath K, et al. Radiofrequency ablation vs endoscope surveillance for patients with Barrett esophagus and low-grade dysplasia: a randomized clinical trial. JAMA. 2014; 311: 1209-17.
5. Shaheen NJ, Falk GW, lyer PG, Gerson LB. ACG Clinical Guideline: Diagnosis and Management of Barrett's Esophagus. Am J Gastroenterol. 2015;111:30-50.5. Shaheen NJ, Falk GW, lyer PG, Gerson LB. ACG Clinical Guideline: Diagnosis and Management of Barrett's Esophagus. Am J Gastroenterol. 2015; 111: 30-50.
6. Montgomery E, Bronner MP, Goldblum JR, Greenson JK, Haber MM, Hart J, et al. Reproducibility of the diagnosis of dysplasia in Barrett esophagus: a reaffirmation. Hum Pathol. 2001;32:368-78.6. Montgomery E, Bronner MP, Goldblum JR, Greenson JK, Haber MM, Hart J, et al. Reproducibility of the diagnosis of dysplasia in Barrett esophagus: a reaffirmation. Hum Pathol. 2001; 32: 368-78.
7. SchoLvinck D, Van Der Meulen K, Bergman JJ, Weusten BL. Detection of Lesions in Dysplastic Barrett's Esophagus: Are Expert Endoscopists Doing a Better Job Than Community Endoscopists? Gastrointestinal Endoscopy. 2015;81:AB139.7. SchoLvinck D, Van Der Meulen K, Bergman JJ, Weusten BL. Detection of Lesions in Dysplastic Barrett's Esophagus: Are Expert Endoscopists Doing a Better Job Than Community Endoscopists? Gastrointestinal Endoscopy. 2015; 81: AB139.
8. Visrodia K, Singh S, Krishnamoorthi R, Ahlquist DA, Wang KK, lyer PG, et al. Magnitude of Missed Esophageal Adenocarcinoma After Barrett's Esophagus Diagnosis: A Systematic Review and Meta-analysis. Gastroenterology. 150:599-607 el. 8. Visrodia K, Singh S, Krishnamoorthi R, Ahlquist DA, Wang KK, lyer PG, et al. Magnitude of Missed Esophageal Adenocarcinoma After Barrett's Esophagus Diagnosis: A Systematic Review and Meta-analysis. Gastroenterology. 150: 599-607 el.
9. Tabor MP, Brakenhoff RH, van Houten VM, Kummer JA, Snel MH, Snijders PJ, et al. Persistence of genetically altered fields in head and neck cáncer patients: biological and clinical implications. Clin Cáncer Res. 2001;7:1523-32.9. Tabor MP, Brakenhoff RH, van Houten VM, Kummer JA, Snel MH, Snijders PJ, et al. Persistence of genetically altered fields in head and neck cancer patients: biological and clinical implications. Clin Cancer Res. 2001; 7: 1523-32.
10. Braakhuis BJ, Tabor MP, Kummer JA, Leemans CR, Brakenhoff RH. A genetic explanation of Slaughter's concept of field cancerization: evidence and clinical implications. Cáncer Res. 2003;63:1727-30.10. Braakhuis BJ, Tabor MP, Kummer JA, Leemans CR, Brakenhoff RH. A genetic explanation of Slaughter's concept of field cancerization: evidence and clinical implications. Cancer Res. 2003; 63: 1727-30.
11. Prevo LJ, Sánchez CA, Galipeau PC, Reid BJ. p53-mutant clones and field effects in Barrett's esophagus. Cáncer Res. 1999;59:4784-7.11. Prevo LJ, Sánchez CA, Galipeau PC, Reid BJ. p53-mutant clones and field effects in Barrett's esophagus. Cancer Res. 1999; 59: 4784-7.
12. Eads CA, Lord RV, Kurumboor SK, Wickramasinghe K, Skinner ML, Long TI, et al. Fields of aberrant CpG island hypermethylation in Barrett's esophagus and associated adenocarcinoma Cáncer Res. 2000;60:5021-6.12. Eads CA, Lord RV, Kurumboor SK, Wickramasinghe K, Skinner ML, Long TI, et al. Fields of aberrant CpG island hypermethylation in Barrett's esophagus and associated adenocarcinoma Cancer Res. 2000; 60: 5021-6.
13. Barrett MT, Sánchez CA, Galipeau PC, Neshat K, Emond M, Reid BJ. Allelic loss of 9p21 and mutation of the CDKN2/pl6 gene develop as early lesions during neoplastic progression in Barrett's esophagus. Oncogene.13. Barrett MT, Sánchez CA, Galipeau PC, Neshat K, Emond M, Reid BJ. Allelic loss of 9p21 and mutation of the CDKN2 / pl6 gene develop as early lesions during neoplastic progression in Barrett's esophagus. Oncogene.
1996;13:1867-73.1996; 13: 1867-73.
14. Bird-Lieberman EL, Dunn JM, Coleman HG, Lao-Sirieix P, Oukrif D, Moore CE, et al. Population-based study reveáis new risk-stratification biomarker panel for Barrett's esophagus. Gastroenterology. 2012;143:927-35 e3.14. Bird-Lieberman EL, Dunn JM, Coleman HG, Lao-Sirieix P, Oukrif D, Moore CE, et al. Population-based study review new risk-stratification biomarker panel for Barrett's esophagus. Gastroenterology. 2012; 143: 927-35 e3.
15. Kastelein F, Biermann K, Steyerberg EW, Verheij J, Kalisvaart M, Looijenga LH, et al. Aberrant p53 protein expression is associated with an increased risk of neoplastic progression in patients with Barrett's oesophagus. Gut. 2012;62:1676-83.15. Kastelein F, Biermann K, Steyerberg EW, Verheij J, Kalisvaart M, Looijenga LH, et al. Aberrant p53 protein expression is associated with an increased risk of neoplastic progression in patients with Barrett's oesophagus. Gut. 2012; 62: 1676-83.
16. Kastelein F, Biermann K, Steyerberg EW, Verheij J, Kalisvaart M, Looijenga LH, et al. Valué of alphamethylacyl-CoA racemase immunochemistry for predicting neoplastic progression in Barrett's oesophagus. Histopathology. 2013;63:630-9.16. Kastelein F, Biermann K, Steyerberg EW, Verheij J, Kalisvaart M, Looijenga LH, et al. Valué of alphamethylacyl-CoA racemase immunochemistry for predicting neoplastic progression in Barrett's oesophagus. Histopathology. 2013; 63: 630-9.
17. Fitzgerald RC, di Pietro M, Ragunath K, Ang Y, Kang JY, Watson P, et al. British Society of Gastroenterology guidelines on the diagnosis and management of Barrett's oesophagus. Gut. 2014;63:7-42. 17. Fitzgerald RC, di Pietro M, Ragunath K, Ang Y, Kang JY, Watson P, et al. British Society of Gastroenterology guidelines on the diagnosis and management of Barrett's esophagus. Gut. 2014; 63: 7-42.
18. Gough A, Lezon T, Faeder J, Chennubhotla C, Murphy R, Critchley-Thorne R, et al. High Content Analysis And Cellular And Tissue Systems Biology: A Bridge Between Cáncer Cell Biology And Tissue-Based Diagnostics. En: Mendelsohn J, Howley PM, Israel MA, Gray JW, Thompson CB, editors. The Molecular Basis of Cáncer 4a Edición 4a ed. Nueva York: Elsevier; 2014.18. Gough A, Lezon T, Faeder J, Chennubhotla C, Murphy R, Critchley-Thorne R, et al. High Content Analysis And Cellular And Tissue Systems Biology: A Bridge Between Cancer Cell Biology And Tissue-Based Diagnostics. In: Mendelsohn J, Howley PM, Israel MA, Gray JW, Thompson CB, editors. The Molecular Basis of Cancer 4th Edition 4th ed. New York: Elsevier; 2014.
19. Prichard JW, Davison JM, Campbell BB, Repa KA, Reese LM, Nguyen XM, et al. TissueCypher: A Systems Biology Approach to Anatomic Pathology. Journal of Pathology Informatics. 2015;6:48.19. Prichard JW, Davison JM, Campbell BB, Repa KA, Reese LM, Nguyen XM, et al. TissueCypher: A Systems Biology Approach to Anatomic Pathology. Journal of Pathology Informatics. 2015; 6: 48.
20. Critchley-Thorne RJ, Duits LC, Prichard JW, Davison JM, Jobe BA, Campbell BB, et al. A Tissue Systems Pathology Assay for High-Risk Barrett's Esophagus. Cáncer Epidemiol Biomarkers Prev. 2016;25:958-68.20. Critchley-Thorne RJ, Duits LC, Prichard JW, Davison JM, Jobe BA, Campbell BB, et al. A Tissue Systems Pathology Assay for High-Risk Barrett's Esophagus. Cancer Epidemiol Biomarkers Prev. 2016; 25: 958-68.
21. Mathieu LN, Kanarek NF, Tsai HL, Rudin CM, Brock MV. Age and sex differences in the incidence of esophageal adenocarcinoma: results from the Surveillance, Epidemiology, and End Results (SEER) Registry (1973-2008). Dis Esophagus. 2013;27:757-63.21. Mathieu LN, Kanarek NF, Tsai HL, Rudin CM, Brock MV. Age and sex differences in the incidence of esophageal adenocarcinoma: results from the Surveillance, Epidemiology, and End Results (SEER) Registry (1973-2008). Dis Esophagus. 2013; 27: 757-63.
22. Weston AP, Badr AS, Hassanein RS. Prospective multivariate analysis of clinical, endoscopio, and histological factors predictive of the development of Barrett's multifocal high-grade dysplasia or adenocarcinoma. Am J Gastroenterol. 1999;94:3413-9.22. Weston AP, Badr AS, Hassanein RS. Prospective multivariate analysis of clinical, endoscopio, and histological factors predictive of the development of Barrett's multifocal high-grade dysplasia or adenocarcinoma. Am J Gastroenterol. 1999; 94: 3413-9.
23. Abrams JA, Kapel RC, Lindberg GM, Saboorian MH, Genta RM, Neugut Al, et al. Adherence to biopsy guidelines for Barrett's esophagus surveillance in the community setting in the United States. Clin Gastroenterol Hepatol. 2009;7:736-42; quiz 10.23. Abrams JA, Kapel RC, Lindberg GM, Saboorian MH, Genta RM, Neugut Al, et al. Adherence to biopsy guidelines for Barrett's esophagus surveillance in the community setting in the United States. Clin Gastroenterol Hepatol. 2009; 7: 736-42; maybe 10.
24. Verbeek RE, Leenders M, Ten Kate FJ, van Hillegersberg R, Vleggaar FP, van Baal JW, et al. Surveillance of Barrett's esophagus and mortality from esophageal adenocarcinoma: a population-based cohort study. Am J Gastroenterol. 2014;109:1215-22.24. Verbeek RE, Leenders M, Ten Kate FJ, van Hillegersberg R, Vleggaar FP, van Baal JW, et al. Surveillance of Barrett's esophagus and mortality from esophageal adenocarcinoma: a population-based cohort study. Am J Gastroenterol. 2014; 109: 1215-22.
25. Curvers WL, ten Kate FJ, Krishnadath KK, Visser M, Elzer B, Baak LC, et al. Low-grade dysplasia in Barrett's esophagus: overdiagnosed and underestimated. Am J Gastroenterol. 2010;105:1523-30.25. Curvers WL, ten Kate FJ, Krishnadath KK, Visser M, Elzer B, Baak LC, et al. Low-grade dysplasia in Barrett's esophagus: overdiagnosed and underestimated. Am J Gastroenterol. 2010; 105: 1523-30.
26. Duits LC, Phoa KN, Curvers WL, Ten Kate FJ, Meijer GA, Seldenrijk CA, et al. Barrett's oesophagus patients with low-grade dysplasia can be accurately risk-stratified after histological review by an expert pathology panel. Gut. 2015;64:700-6.26. Duits LC, Phoa KN, Curvers WL, Ten Kate FJ, Meijer GA, Seldenrijk CA, et al. Barrett's esophagus patients with low-grade dysplasia can be accurately risk-stratified after histological review by an expert pathology panel. Gut. 2015; 64: 700-6.
27. Kerkhof M, van Dekken H, Steyerberg EW, Meijer GA, Mulder AH, de Bruine A, et al. Grading of dysplasia in Barrett's oesophagus: substantial interobserver variation between general and gastrointestinal pathologists. Histopathology. 2007;50:920-7.27. Kerkhof M, van Dekken H, Steyerberg EW, Meijer GA, Mulder AH, de Bruine A, et al. Grading of dysplasia in Barrett's oesophagus: substantial interobserver variation between general and gastrointestinal pathologists. Histopathology. 2007; 50: 920-7.
28. Horvath B, Singh P, Xie H, Thota PN, Sun X, Liu X Expression of p53 predicts risk of prevalent and incident advanced neoplasia in patients with Barrett's esophagus and epithelial changes indefinite for dysplasia. Gastroenterol Rep (Oxf). 2015.28. Horvath B, Singh P, Xie H, Thota PN, Sun X, Liu X Expression of p53 predicts risk of prevalent and incident advanced neoplasia in patients with Barrett's esophagus and epithelial changes indefinite for dysplasia. Gastroenterol Rep (Oxf). 2015.
29. Sikkema M, Kerkhof M, Steyerberg EW, Kusters JG, van Strien PM, Looman CW, et al. Aneuploidy and overexpression of K¡67 and p53 as markers for neoplastic progression in Barrett's esophagus: a case-control study. Am J Gastroenterol. 2009;104:2673-80.29. Sikkema M, Kerkhof M, Steyerberg EW, Kusters JG, van Strien PM, Looman CW, et al. Aneuploidy and overexpression of K¡67 and p53 as markers for neoplastic progression in Barrett's esophagus: a case-control study. Am J Gastroenterol. 2009; 104: 2673-80.
30. Jin Z, Cheng Y, Gu W, Zheng Y, Sato F, Mori Y, et al. A multicenter, double-blinded validation study of methylation biomarkers for progression prediction in Barrett's esophagus. Cáncer Res. 2009;69:4112-5.30. Jin Z, Cheng Y, Gu W, Zheng Y, Sato F, Mori Y, et al. A multicenter, double-blinded validation study of methylation biomarkers for progression prediction in Barrett's esophagus. Cancer Res. 2009; 69: 4112-5.
31. Eluri S, Brugge WR, Daglilar ES, Jackson SA, Styn MA, Callenberg KM, et al. The Presence of Genetic Mutations at Key Loci Predicts Progression to Esophageal Adenocarcinoma in Barrett's Esophagus. Am J Gastroenterol. 2015;110:828-34.31. Eluri S, Brugge WR, Daglilar ES, Jackson SA, Styn MA, Callenberg KM, et al. The Presence of Genetic Mutations at Key Loci Predicts Progression to Esophageal Adenocarcinoma in Barrett's Esophagus. Am J Gastroenterol. 2015; 110: 828-34.
32. Del Portillo A, Lagaña SM, Yao Y, Uehara T, Jhala N, Ganguly T, et al. Evaluation of Mutational Testing of Preneoplastic Barrett's Mucosa by Next-Generation Sequencing of Formalin-Fixed, Paraffin-Embedded Endoscopic Samples for Detection of Concurrent Dysplasia and Adenocarcinoma in Barrett's Esophagus. J Mol Diagn. 2015; 17:412-9.32. Del Portillo A, Lagaña SM, Yao Y, Uehara T, Jhala N, Ganguly T, et al. Evaluation of Mutational Testing of Preneoplastic Barrett's Mucosa by Next-Generation Sequencing of Formalin-Fixed, Paraffin-Embedded Endoscopic Samples for Detection of Concurrent Dysplasia and Adenocarcinoma in Barrett's Esophagus. J Mol Diagn. 2015; 17: 412-9.
33. Evans JA, Poneros JM, Bouma BE, Bressner J, Halpem EF, Shishkov M, et al. Optical coherence tomography to ¡dentify intramucosal carcinoma and high-grade dysplasia in Barrett's esophagus. Clin Gastroentero1Hepatol.33. Evans JA, Poneros JM, Bouma BE, Bressner J, Halpem EF, Shishkov M, et al. Optical coherence tomography to dentify intramucosal carcinoma and high-grade dysplasia in Barrett's esophagus. Clin Gastroentero1Hepatol.
2006;4:38-43.2006; 4: 38-43.
34. Hao J, Snyder SR, Pitcavage J, Critchley-Thorne RJ. A Cost-effectiveness analysis of a test that predicts risk of malignant progression in Barrett's esophagus. 21st Annual International Society for Pharmacoeconomics and Outcomes Research Meeting. Washington DC 2016.34. Hao J, Snyder SR, Pitcavage J, Critchley-Thorne RJ. A Cost-effectiveness analysis of a test that predicts risk of malignant progression in Barrett's esophagus. 21st Annual International Society for Pharmacoeconomics and Outcomes Research Meeting. Washington DC 2016.
35. Gordon LG, Mayne GC, Hirst NG, Bright T, Whiteman DC, Watson DI. Cost-effectiveness of endoscopic surveillance of non-dysplastic Barrett's esophagus. Gastrointest Endose. 2014;79:242-56 e6.35. Gordon LG, Mayne GC, Hirst NG, Bright T, Whiteman DC, Watson DI. Cost-effectiveness of endoscopic surveillance of non-dysplastic Barrett's esophagus. Gastrointest Egando. 2014; 79: 242-56 e6.

(continuación)(continuation)


(continuación)(continuation)

Si bien las realizaciones se han descrito con referencias a realizaciones de ejemplo de las mismas, los expertos en la materia entenderán que se pueden realizar varios cambios en la forma y los detalles y que están dentro del alcance de lo que se describe y reivindica en el presente documento. While embodiments have been described with references to exemplary embodiments thereof, it will be understood by those skilled in the art that various changes in shape and detail can be made and are within the scope of what is described and claimed therein. present document.
Claims (14)
Applications Claiming Priority (2)
| Application Number | Priority Date | Filing Date | Title |
|---|---|---|---|
| US201562260010P | 2015-11-25 | 2015-11-25 | |
| PCT/US2016/063482 WO2017091658A1 (en) | 2015-11-25 | 2016-11-23 | Methods of predicting progression of barrett's esophagus |
Publications (1)
| Publication Number | Publication Date |
|---|---|
| ES2831754T3 true ES2831754T3 (en) | 2021-06-09 |
Family
ID=58763606
Family Applications (2)
| Application Number | Title | Priority Date | Filing Date |
|---|---|---|---|
| ES16869219T Active ES2831754T3 (en) | 2015-11-25 | 2016-11-23 | Methods to predict the progression of Barrett's esophagus |
| ES20184506T Active ES2931924T3 (en) | 2015-11-25 | 2016-11-23 | Methods to detect malignant transformation of Barrett's esophagus |
Family Applications After (1)
| Application Number | Title | Priority Date | Filing Date |
|---|---|---|---|
| ES20184506T Active ES2931924T3 (en) | 2015-11-25 | 2016-11-23 | Methods to detect malignant transformation of Barrett's esophagus |
Country Status (7)
| Country | Link |
|---|---|
| US (2) | US10962544B2 (en) |
| EP (3) | EP4152001A1 (en) |
| AU (2) | AU2016359685B2 (en) |
| CA (1) | CA3006356A1 (en) |
| ES (2) | ES2831754T3 (en) |
| IL (2) | IL259561B (en) |
| WO (1) | WO2017091658A1 (en) |
Families Citing this family (3)
| Publication number | Priority date | Publication date | Assignee | Title |
|---|---|---|---|---|
| CA2830501C (en) | 2011-03-17 | 2023-10-17 | Cernostics, Inc. | Systems and compositions for diagnosing barrett's esophagus and methods of using the same |
| ES2831754T3 (en) | 2015-11-25 | 2021-06-09 | Cernostics Inc | Methods to predict the progression of Barrett's esophagus |
| WO2024039692A1 (en) * | 2022-08-16 | 2024-02-22 | The Regents Of The University Of California | Chromosome 9p24 loss and gain predicts resistance and benefit of immune checkpoint inhibitors |
Family Cites Families (65)
| Publication number | Priority date | Publication date | Assignee | Title |
|---|---|---|---|---|
| AU1791192A (en) | 1991-04-05 | 1992-11-02 | Pattern Recognition | Direct data base analysis, forecasting and diagnosis method |
| US6025128A (en) | 1994-09-29 | 2000-02-15 | The University Of Tulsa | Prediction of prostate cancer progression by analysis of selected predictive parameters |
| CA2227895C (en) | 1995-10-11 | 2012-07-17 | Luminex Corporation | Multiplexed analysis of clinical specimens apparatus and methods |
| US5989835A (en) | 1997-02-27 | 1999-11-23 | Cellomics, Inc. | System for cell-based screening |
| US6103479A (en) | 1996-05-30 | 2000-08-15 | Cellomics, Inc. | Miniaturized cell array methods and apparatus for cell-based screening |
| US6059724A (en) | 1997-02-14 | 2000-05-09 | Biosignal, Inc. | System for predicting future health |
| US7117098B1 (en) | 1997-02-27 | 2006-10-03 | Cellomics, Inc. | Machine-readable storage medium for analyzing distribution of macromolecules between the cell membrane and the cell cytoplasm |
| US6727071B1 (en) | 1997-02-27 | 2004-04-27 | Cellomics, Inc. | System for cell-based screening |
| US7853411B2 (en) | 1997-02-27 | 2010-12-14 | Cellomics, Inc. | System for cell-based screening |
| US6759206B1 (en) | 1997-02-27 | 2004-07-06 | Cellomics, Inc. | System for cell-based screening |
| DE69839501D1 (en) | 1997-02-27 | 2008-06-26 | Cellomics Inc | System for screening biological cells |
| US6416959B1 (en) | 1997-02-27 | 2002-07-09 | Kenneth Giuliano | System for cell-based screening |
| US6259807B1 (en) | 1997-05-14 | 2001-07-10 | Applied Imaging Corp. | Identification of objects of interest using multiple illumination schemes and finding overlap of features in corresponding multiple images |
| US6324479B1 (en) | 1998-05-08 | 2001-11-27 | Rosetta Impharmatics, Inc. | Methods of determining protein activity levels using gene expression profiles |
| US6218122B1 (en) | 1998-06-19 | 2001-04-17 | Rosetta Inpharmatics, Inc. | Methods of monitoring disease states and therapies using gene expression profiles |
| IL142636A0 (en) | 1998-10-30 | 2002-03-10 | Cellomics Inc | A system for cell-based screening |
| US20030228565A1 (en) | 2000-04-26 | 2003-12-11 | Cytokinetics, Inc. | Method and apparatus for predictive cellular bioinformatics |
| AU4847100A (en) | 1999-05-14 | 2000-12-05 | Cytokinetics, Inc. | Method and apparatus for predictive cellular bioinformatics |
| US6986993B1 (en) | 1999-08-05 | 2006-01-17 | Cellomics, Inc. | System for cell-based screening |
| EP1283904A2 (en) | 1999-11-03 | 2003-02-19 | Oncotech, Inc. | Cancer diagnosis using cell-sorting and gene-expression-profiles |
| US20010039015A1 (en) | 2000-01-21 | 2001-11-08 | Edward Sauter | Nipple aspirate fluid specific microarrays |
| US6763307B2 (en) | 2000-03-06 | 2004-07-13 | Bioseek, Inc. | Patient classification |
| US20020012931A1 (en) | 2000-03-27 | 2002-01-31 | Waldman Scott A. | High specificity marker detection |
| AU2001251034A1 (en) | 2000-03-31 | 2001-10-15 | Gene Logic, Inc | Gene expression profiles in esophageal tissue |
| CA2414626A1 (en) | 2000-07-04 | 2002-01-10 | Bioimage A/S | A method for extracting quantitative information relating to interactions between cellular components |
| AU2001294872A1 (en) | 2000-09-28 | 2002-04-08 | Cellomics, Inc. | Methods and reagents for live-cell gene expression quantification |
| AU2002303150A1 (en) | 2001-03-26 | 2002-10-08 | Cellomics, Inc. | Methods for determining the organization of a cellular component of interest |
| US7219016B2 (en) | 2001-04-20 | 2007-05-15 | Yale University | Systems and methods for automated analysis of cells and tissues |
| US20040043436A1 (en) | 2001-09-21 | 2004-03-04 | Antonia Vlahou | Biomarkers of transitional cell carcinoma of the bladder |
| US7274809B2 (en) | 2002-08-29 | 2007-09-25 | Perceptronix Medical, Inc. And British Columbia Cancer Agency | Computerized methods and systems related to the detection of malignancy-associated changes (MAC) to detect cancer |
| US7801361B2 (en) | 2002-10-15 | 2010-09-21 | Definiens Ag | Analyzing pixel data using image, thematic and object layers of a computer-implemented network structure |
| BR0316232A (en) | 2002-11-12 | 2005-10-04 | Becton Dickinson Co | Methods for determining sepsis status, predicting the onset of sepsis, and diagnosing systemic inflammatory response syndrome in an individual |
| WO2004076643A2 (en) | 2003-02-27 | 2004-09-10 | Immunivest Corporation | CIRCULATING TUMOR CELLS (CTC’s): EARLY ASSESSMENT OF TIME TO PROGRESSION SURVIVAL AND RESPONSE TO THERAPY IN METASTATIC CANCER PATIENTS |
| EP1625394A4 (en) | 2003-04-23 | 2008-02-06 | Bioseek Inc | Methods for analysis of biological dataset profiles |
| US7505948B2 (en) | 2003-11-18 | 2009-03-17 | Aureon Laboratories, Inc. | Support vector regression for censored data |
| US7461048B2 (en) | 2003-07-21 | 2008-12-02 | Aureon Laboratories, Inc. | Systems and methods for treating, diagnosing and predicting the occurrence of a medical condition |
| US7483554B2 (en) | 2003-11-17 | 2009-01-27 | Aureon Laboratories, Inc. | Pathological tissue mapping |
| US20050136509A1 (en) | 2003-09-10 | 2005-06-23 | Bioimagene, Inc. | Method and system for quantitatively analyzing biological samples |
| US7760927B2 (en) | 2003-09-10 | 2010-07-20 | Bioimagene, Inc. | Method and system for digital image based tissue independent simultaneous nucleus cytoplasm and membrane quantitation |
| WO2005091203A2 (en) | 2004-03-12 | 2005-09-29 | Aureon Laboratories, Inc. | Systems and methods for treating, diagnosing and predicting the occurrence of a medical condition |
| WO2006020627A1 (en) | 2004-08-11 | 2006-02-23 | Aureon Laboratories, Inc. | Systems and methods for automated diagnosis and grading of tissue images |
| CA2580937C (en) | 2004-09-22 | 2016-02-02 | Tripath Imaging, Inc. | Methods and computer program products for analysis and optimization of marker candidates for cancer prognosis |
| EP1645881A1 (en) | 2004-10-05 | 2006-04-12 | DKFZ Deutsches Krebsforschungszentrum | Screening process for the detection and characterization of protein-protein-interactions in vivo by fluorescence cross correlation spectroscopy |
| US20060159325A1 (en) | 2005-01-18 | 2006-07-20 | Trestle Corporation | System and method for review in studies including toxicity and risk assessment studies |
| US7537894B2 (en) | 2005-03-02 | 2009-05-26 | The University Of Chicago | Methods and kits for monitoring Barrett's metaplasia |
| US20070019854A1 (en) | 2005-05-10 | 2007-01-25 | Bioimagene, Inc. | Method and system for automated digital image analysis of prostrate neoplasms using morphologic patterns |
| US7599893B2 (en) | 2005-10-13 | 2009-10-06 | Aureon Laboratories, Inc. | Methods and systems for feature selection in machine learning based on feature contribution and model fitness |
| GB0521521D0 (en) | 2005-10-21 | 2005-11-30 | Medical Res Council | Diagnostic methods and kits |
| GB2433986A (en) | 2006-01-09 | 2007-07-11 | Cytokinetics Inc | Granularity analysis in cellular phenotypes |
| WO2008018905A2 (en) | 2006-01-17 | 2008-02-14 | Cellumen, Inc. | Method for predicting biological systems responses |
| AU2007211085A1 (en) | 2006-01-27 | 2007-08-09 | Tripath Imaging, Inc. | Methods for identifying patients with an increased likelihood of having ovarian cancer and compositions therefor |
| US20090317836A1 (en) | 2006-01-30 | 2009-12-24 | The Scripps Research Institute | Methods for Detection of Circulating Tumor Cells and Methods of Diagnosis of Cancer in Mammalian Subject |
| EP2032982B1 (en) | 2006-05-05 | 2012-08-29 | Yale University | Use of subcellular localization profiles as prognostic or predictive indicators |
| CA2652562C (en) | 2006-05-17 | 2015-05-12 | Cellumen, Inc. | Method for automated tissue analysis |
| US7706591B2 (en) | 2006-07-13 | 2010-04-27 | Cellomics, Inc. | Neuronal profiling |
| US7811778B2 (en) | 2006-09-06 | 2010-10-12 | Vanderbilt University | Methods of screening for gastrointestinal cancer |
| EP2095119A2 (en) | 2006-11-10 | 2009-09-02 | Cellumen, Inc. | Protein-protein interaction biosensors and methods of use thereof |
| US9758833B2 (en) | 2008-02-19 | 2017-09-12 | The Johns Hopkins University | Methods for predicting esophageal adenocarcinoma (EAC) |
| EP2419010A4 (en) | 2009-04-18 | 2012-12-12 | Univ Michigan | Targeted detection of dysplasia in barrett's esophagus with a novel fluorescence-labeled polypeptide |
| EP2524059A4 (en) | 2010-01-13 | 2013-11-20 | Caris Life Sciences Luxembourg Holdings | Detection of gastrointestinal disorders |
| AU2011237669B2 (en) | 2010-04-06 | 2016-09-08 | Caris Life Sciences Switzerland Holdings Gmbh | Circulating biomarkers for disease |
| JP2013540995A (en) * | 2010-08-18 | 2013-11-07 | カリス ライフ サイエンシズ ルクセンブルク ホールディングス エス.アー.エール.エル. | Circulating biomarkers for disease |
| CA2830501C (en) * | 2011-03-17 | 2023-10-17 | Cernostics, Inc. | Systems and compositions for diagnosing barrett's esophagus and methods of using the same |
| EP2758544B1 (en) | 2011-09-23 | 2017-10-18 | Academisch Medisch Centrum | Materials and methods for prognosis of progression of barrett's esophagus |
| ES2831754T3 (en) | 2015-11-25 | 2021-06-09 | Cernostics Inc | Methods to predict the progression of Barrett's esophagus |
-
2016
- 2016-11-23 ES ES16869219T patent/ES2831754T3/en active Active
- 2016-11-23 EP EP22184193.5A patent/EP4152001A1/en active Pending
- 2016-11-23 EP EP16869219.2A patent/EP3380840B1/en active Active
- 2016-11-23 EP EP20184506.2A patent/EP3786640B1/en active Active
- 2016-11-23 CA CA3006356A patent/CA3006356A1/en active Pending
- 2016-11-23 AU AU2016359685A patent/AU2016359685B2/en active Active
- 2016-11-23 WO PCT/US2016/063482 patent/WO2017091658A1/en active Application Filing
- 2016-11-23 ES ES20184506T patent/ES2931924T3/en active Active
- 2016-11-23 US US15/778,403 patent/US10962544B2/en active Active
-
2018
- 2018-05-23 IL IL259561A patent/IL259561B/en active IP Right Grant
-
2020
- 2020-06-04 IL IL275126A patent/IL275126B/en active IP Right Grant
-
2021
- 2021-03-12 US US17/200,260 patent/US20220034894A1/en active Pending
-
2023
- 2023-02-06 AU AU2023200590A patent/AU2023200590A1/en active Pending
Also Published As
| Publication number | Publication date |
|---|---|
| IL275126A (en) | 2020-07-30 |
| IL259561B (en) | 2020-06-30 |
| AU2016359685B2 (en) | 2022-12-22 |
| WO2017091658A1 (en) | 2017-06-01 |
| US20220034894A1 (en) | 2022-02-03 |
| EP3380840A1 (en) | 2018-10-03 |
| CA3006356A1 (en) | 2017-06-01 |
| EP3786640A1 (en) | 2021-03-03 |
| IL259561A (en) | 2018-07-31 |
| ES2931924T3 (en) | 2023-01-04 |
| EP3786640B1 (en) | 2022-08-24 |
| EP3380840A4 (en) | 2019-06-26 |
| US20180348226A1 (en) | 2018-12-06 |
| AU2016359685A1 (en) | 2018-06-14 |
| AU2023200590A1 (en) | 2023-03-09 |
| IL275126B (en) | 2021-05-31 |
| EP4152001A1 (en) | 2023-03-22 |
| US10962544B2 (en) | 2021-03-30 |
| EP3380840B1 (en) | 2020-08-19 |
Similar Documents
| Publication | Publication Date | Title |
|---|---|---|
| US11221333B2 (en) | Systems and compositions for diagnosing Barrett's esophagus and methods of using the same | |
| Shapiro et al. | Raman molecular imaging: a novel spectroscopic technique for diagnosis of bladder cancer in urine specimens | |
| Redston et al. | Abnormal TP53 predicts risk of progression in patients with Barrett’s esophagus regardless of a diagnosis of dysplasia | |
| Critchley-Thorne et al. | A tissue systems pathology assay for high-risk Barrett's esophagus | |
| US20220034894A1 (en) | Methods of predicting progression of barrett's esophagus | |
| US20180074075A1 (en) | Biomarker for barrett's oesophagus | |
| Critchley-Thorne et al. | A tissue systems pathology test detects abnormalities associated with prevalent high-grade dysplasia and esophageal cancer in Barrett's esophagus | |
| Booth et al. | Barrett’s esophagus: a review of diagnostic criteria, clinical surveillance practices and new developments | |
| Di Pietro et al. | Autofluorescence-directed confocal endomicroscopy in combination with a three-biomarker panel can inform management decisions in Barrett’s esophagus | |
| Odze | Update on the diagnosis and treatment of Barrett esophagus and related neoplastic precursor lesions | |
| Li et al. | Confocal endomicroscopy and cyst fluid molecular analysis: comprehensive evaluation of pancreatic cysts | |
| Kearns et al. | Diagnosis and management of pancreatic cystic neoplasms | |
| Noia et al. | Rapid diagnosis of mucinous cystic pancreatic lesions by on-site cyst fluid glucometry | |
| US20200057069A1 (en) | Methods for single-cell prostate tissue classification and prediction of cancer progression | |
| US20180136215A1 (en) | Epithelial quantitation of histologically normal prostate tissue predicts the presence of cancer in tissue biopsies | |
| US11391737B2 (en) | Methods to predict progression of Barrett's Esophagus to high grade dysplasia esophageal adenocarcinoma | |
| US20150168409A1 (en) | Method for determining if a subject has an increased likelihood of high grade dysplasia or esophageal adenocarcinoma |