EP4579488A1 - Erzeugung analytischer berichte - Google Patents
Erzeugung analytischer berichte Download PDFInfo
- Publication number
- EP4579488A1 EP4579488A1 EP24222131.5A EP24222131A EP4579488A1 EP 4579488 A1 EP4579488 A1 EP 4579488A1 EP 24222131 A EP24222131 A EP 24222131A EP 4579488 A1 EP4579488 A1 EP 4579488A1
- Authority
- EP
- European Patent Office
- Prior art keywords
- attributes
- visual indicator
- report
- analytical
- visual
- Prior art date
- Legal status (The legal status is an assumption and is not a legal conclusion. Google has not performed a legal analysis and makes no representation as to the accuracy of the status listed.)
- Pending
Links
Images







Classifications
-
- G—PHYSICS
- G06—COMPUTING OR CALCULATING; COUNTING
- G06F—ELECTRIC DIGITAL DATA PROCESSING
- G06F16/00—Information retrieval; Database structures therefor; File system structures therefor
- G06F16/90—Details of database functions independent of the retrieved data types
- G06F16/93—Document management systems
-
- G—PHYSICS
- G06—COMPUTING OR CALCULATING; COUNTING
- G06Q—INFORMATION AND COMMUNICATION TECHNOLOGY [ICT] SPECIALLY ADAPTED FOR ADMINISTRATIVE, COMMERCIAL, FINANCIAL, MANAGERIAL OR SUPERVISORY PURPOSES; SYSTEMS OR METHODS SPECIALLY ADAPTED FOR ADMINISTRATIVE, COMMERCIAL, FINANCIAL, MANAGERIAL OR SUPERVISORY PURPOSES, NOT OTHERWISE PROVIDED FOR
- G06Q10/00—Administration; Management
- G06Q10/10—Office automation; Time management
-
- G—PHYSICS
- G06—COMPUTING OR CALCULATING; COUNTING
- G06Q—INFORMATION AND COMMUNICATION TECHNOLOGY [ICT] SPECIALLY ADAPTED FOR ADMINISTRATIVE, COMMERCIAL, FINANCIAL, MANAGERIAL OR SUPERVISORY PURPOSES; SYSTEMS OR METHODS SPECIALLY ADAPTED FOR ADMINISTRATIVE, COMMERCIAL, FINANCIAL, MANAGERIAL OR SUPERVISORY PURPOSES, NOT OTHERWISE PROVIDED FOR
- G06Q10/00—Administration; Management
- G06Q10/06—Resources, workflows, human or project management; Enterprise or organisation planning; Enterprise or organisation modelling
- G06Q10/063—Operations research, analysis or management
- G06Q10/0639—Performance analysis of employees; Performance analysis of enterprise or organisation operations
- G06Q10/06393—Score-carding, benchmarking or key performance indicator [KPI] analysis
-
- G—PHYSICS
- G06—COMPUTING OR CALCULATING; COUNTING
- G06F—ELECTRIC DIGITAL DATA PROCESSING
- G06F40/00—Handling natural language data
- G06F40/10—Text processing
- G06F40/166—Editing, e.g. inserting or deleting
-
- G—PHYSICS
- G06—COMPUTING OR CALCULATING; COUNTING
- G06F—ELECTRIC DIGITAL DATA PROCESSING
- G06F40/00—Handling natural language data
- G06F40/10—Text processing
- G06F40/166—Editing, e.g. inserting or deleting
- G06F40/174—Form filling; Merging
-
- G—PHYSICS
- G06—COMPUTING OR CALCULATING; COUNTING
- G06Q—INFORMATION AND COMMUNICATION TECHNOLOGY [ICT] SPECIALLY ADAPTED FOR ADMINISTRATIVE, COMMERCIAL, FINANCIAL, MANAGERIAL OR SUPERVISORY PURPOSES; SYSTEMS OR METHODS SPECIALLY ADAPTED FOR ADMINISTRATIVE, COMMERCIAL, FINANCIAL, MANAGERIAL OR SUPERVISORY PURPOSES, NOT OTHERWISE PROVIDED FOR
- G06Q30/00—Commerce
- G06Q30/02—Marketing; Price estimation or determination; Fundraising
- G06Q30/0201—Market modelling; Market analysis; Collecting market data
- G06Q30/0202—Market predictions or forecasting for commercial activities
-
- G—PHYSICS
- G06—COMPUTING OR CALCULATING; COUNTING
- G06Q—INFORMATION AND COMMUNICATION TECHNOLOGY [ICT] SPECIALLY ADAPTED FOR ADMINISTRATIVE, COMMERCIAL, FINANCIAL, MANAGERIAL OR SUPERVISORY PURPOSES; SYSTEMS OR METHODS SPECIALLY ADAPTED FOR ADMINISTRATIVE, COMMERCIAL, FINANCIAL, MANAGERIAL OR SUPERVISORY PURPOSES, NOT OTHERWISE PROVIDED FOR
- G06Q40/00—Finance; Insurance; Tax strategies; Processing of corporate or income taxes
- G06Q40/12—Accounting
- G06Q40/125—Finance or payroll
Definitions
- Analytical reports are widely used in organizations for various purposes. For instance, analytical reports may be used for analysis of an organization's finances. Analytical reports may also be used for analysis of performance of an organization's operations. Analytical reports may also be used for analysis of market trends, new products, preference of consumers, etc. Examples of analytical reports may include audit reports, reports for Food and Drug Administration (FDA) approval, product sales reports, etc. Apart from providing analytical data associated with an organization in textual form, the analytical report may also include visual representations of the analytical data in the form of charts or graphs.
- FDA Food and Drug Administration
- An analytical report is a document that may include one or more visual indicators that graphically represent analytical data relevant to the purpose of the analytical report.
- a visual indicator may include, but are not limited to, a chart, a graph, a dashboard, etc.
- the dashboard may further include one or more charts or graphs.
- each analytical report may include multiple sub-sections or chapters, with each chapter having one or more visual indicators.
- the analytical report may include multiple visual indicators representing sales data of a product of an enterprise.
- the analytical report may include multiple chapters, such as chapters depicting an organization's sales data in different regions, chapters depicting sales data for different products of the organization, and chapters focusing on sales and revenue of different departments of the organization.
- Each such chapter may include text as well as combinations of visual indicators, such as dashboards, to represent sales data for the different regions or the different products.
- the analytical report is manually prepared by one or more individuals. While the individuals use different business intelligence (BI) tools as source for the one or more visual indicators, the user needs to manually identify, select, and associate different visual indicators with different chapters of the analytical report.
- Manual preparation of the analytical report is a time consuming and tedious task consuming a lot of processing resources.
- an individual preparing the analytical report may have to configure and customize various visual indicators before finalizing one or more visual indicators to be used in the analytical report. This may lead to wastage of manual and processing resources that are consumed for generating and analysing various visual indicators which eventually may not even be used in the analytical report.
- the analytical report is required to represent the analytical data in a manner which is easy to understand so that any decision based on the analytical data can be easily made.
- the analytical report is the product sales report
- an individual referring the product sales report should be able to easily make a decision, based on the represented sales data, about changing or maintaining a supply rate of the product to a region of the plurality of regions.
- the user preparing the analytical report is not able to find the most suitable visual indicators for incorporating in the analytical report, the user may settle on any visual indicator according to their understanding and skill.
- the user must be a professional skilled in preparing the analytical report.
- the quality of the analytical report is highly dependent on the skill level of the user, which is not desirable as different individuals may have varying skill levels, thereby, affecting the quality of the analytical report.
- the analytical report may have analytical data associated with an organization.
- Each of the one or more chapters may comprise at least a subset of the analytical data.
- the present subject matter facilitates in automated identification, selection, and allocation of one or more visual indicators to different chapters of the analytical report.
- a first set of attributes corresponding to the analytical report may be analyzed to identify a set of visual indicators associated with the analytical report.
- the visual indicators may provide graphical representations of the analytical data present in the analytical report.
- the present subject matter uses the first set of attributes, a second set of attributes corresponding to the chapter, and a third set of attributes corresponding to each visual indicator of the set of visual indicators, for determining at least one visual indicator, from the set of visual indicators, for representing the subset of the analytical data within the chapter.
- the first set of attributes, the second set of attributes, and the third set of attributes may be processed by a visual indicator allocation model to determine the at least one visual indicator.
- the visual indicator allocation model may be trained using one or more historical analytical reports. For each chapter of the analytical report, the at least one visual indicator may be incorporated into the chapter to generate a final analytical report.
- the first set of attributes, the second set of attributes, and the third set of attributes may be processed based on an association mapping generated by the visual indicator allocation model.
- the association mapping may indicate a relationship between the chapters, the visual indicators, and the analytical report.
- the first set of attributes, the second set of attributes, and the third set of attributes may be processed based on a probability score corresponding to each visual indicator of the set of visual indicators.
- the probability score may indicate a probability of the visual indicator occurring in the chapter of the analytical report.
- a pre-assigned weighted score may be determined for each attribute of the first set of attributes, the second set of attributes, and the third set of attributes.
- the pre-assigned weighted score may indicate comparative weightage of the attribute for computing the probability score.
- the probability score corresponding to each visual indicator may be computed taking the pre-assigned weighted score of each attribute into consideration.
- the association mapping or the probability score corresponding to each visual indicator may be analyzed to determine at least one visual indicator for representing the subset of the analytical data within the chapter.
- the at least one visual indicator selected for the different chapters may be subsequently incorporated into the chapters to generate a final analytical report.
- the described approaches thus automatically identify and assign at least one visual indicator to each chapter of the analytical report without a need for an input from a user. Therefore, an analytical report may be easily and quickly generated without wasting processing resources.
- the described approaches significantly reduce the power consumed by an electronic device for generation of the analytical report, thereby increasing the battery life of the electronic device.
- the described approaches are not dependent on the skill level of an individual.
- the probability of the visual indicator occurring in the chapter is calculated based on the statistical analysis of the one or more attributes corresponding to the analytical report, the chapters, and the visual indicators. Therefore, the interconnection between the visual indicators and the chapters is accurately identified.
- the described approaches take into consideration the context of the analytical report and the chapters of the analytical report. As a result, a final analytical report, including desired visual indicators may be generated, which is easy to understand and comprehend.
- FIG. 1 illustrates a communication environment 100 implementing a system 102 for generating an analytical report, according to an example.
- the analytical report may have analytical data associated with an organization.
- the analytical report may include one or more chapters with each of the one or more chapters comprising at least a subset of the analytical data.
- a commercial company may be the organization and a product sales report may be the the analytical report about sales of products sold by the organization.
- the product sales report may include multiple visual indicators representing sales data of the products. The visual indicators may provide graphical representation of the analytical data present in the analytical report.
- the analytical report may further include multiple chapters describing different aspects or details of the product sales.
- the analytical report may include chapters depicting the sales data in different regions, chapters depicting sales for different products of the organization, and chapters focusing on sales and revenue of different departments of the organization.
- Each such chapter may include combinations of text and visual indicators, such as dashboards, to represent the sales data for the different regions or the different products.
- the communication environment 100 may further include a business intelligence (BI) tool server 104 and a report generating application server 106.
- the system 102 may be a device, such as an electronic device, that may be operated by a user for generating the analytical report. Examples of the electronic device may include, but are not limited to, a laptop, a desktop, a tablet computer, and a smart phone.
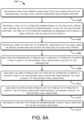
- the instructions 812 may further cause the processor(s) 802, in one example, to obtain a pre-assigned weighted score for each attribute of the first set of attributes, the second set of attributes, and the third set of attributes corresponding to each visual indicator of the set of visual indicators.
- the pre-assigned weighted score may be obtained in a similar manner as explained with reference to blocks 712 of FIG. 7A .
Landscapes
- Engineering & Computer Science (AREA)
- Business, Economics & Management (AREA)
- Theoretical Computer Science (AREA)
- Strategic Management (AREA)
- Human Resources & Organizations (AREA)
- Physics & Mathematics (AREA)
- General Physics & Mathematics (AREA)
- Entrepreneurship & Innovation (AREA)
- Accounting & Taxation (AREA)
- Finance (AREA)
- Development Economics (AREA)
- General Business, Economics & Management (AREA)
- Economics (AREA)
- Marketing (AREA)
- Data Mining & Analysis (AREA)
- General Engineering & Computer Science (AREA)
- Operations Research (AREA)
- Tourism & Hospitality (AREA)
- Quality & Reliability (AREA)
- Computational Linguistics (AREA)
- Audiology, Speech & Language Pathology (AREA)
- Game Theory and Decision Science (AREA)
- Artificial Intelligence (AREA)
- Educational Administration (AREA)
- Health & Medical Sciences (AREA)
- General Health & Medical Sciences (AREA)
- Databases & Information Systems (AREA)
- Technology Law (AREA)
- Management, Administration, Business Operations System, And Electronic Commerce (AREA)
Applications Claiming Priority (1)
| Application Number | Priority Date | Filing Date | Title |
|---|---|---|---|
| US18/395,781 US20250209421A1 (en) | 2023-12-26 | 2023-12-26 | Analytical report generation |
Publications (1)
| Publication Number | Publication Date |
|---|---|
| EP4579488A1 true EP4579488A1 (de) | 2025-07-02 |
Family
ID=93925391
Family Applications (1)
| Application Number | Title | Priority Date | Filing Date |
|---|---|---|---|
| EP24222131.5A Pending EP4579488A1 (de) | 2023-12-26 | 2024-12-20 | Erzeugung analytischer berichte |
Country Status (3)
| Country | Link |
|---|---|
| US (1) | US20250209421A1 (de) |
| EP (1) | EP4579488A1 (de) |
| CN (1) | CN120218692A (de) |
Family Cites Families (6)
| Publication number | Priority date | Publication date | Assignee | Title |
|---|---|---|---|---|
| US8458247B2 (en) * | 2010-07-30 | 2013-06-04 | Nbcuniversal Media, Llc | System and method for generating web analytic reports |
| US20140372427A1 (en) * | 2013-06-13 | 2014-12-18 | Sap Portals Israel Ltd | Real-time analytic report analysis and retrieval framework |
| US9292625B2 (en) * | 2013-09-23 | 2016-03-22 | Sap Se | Dynamic determination of pattern type and chart type for visual analytics |
| US11295257B2 (en) * | 2018-04-17 | 2022-04-05 | International Business Machines Corporation | Cognitive prioritization for report generation |
| US11842337B1 (en) * | 2018-09-21 | 2023-12-12 | Worldpay, Llc | Methods and systems for data analytics for payment facilitators using internet-connected devices |
| WO2022103963A1 (en) * | 2020-11-13 | 2022-05-19 | 4I Analytics, Inc. | Systems and methods for report data analytics |
-
2023
- 2023-12-26 US US18/395,781 patent/US20250209421A1/en active Pending
-
2024
- 2024-11-25 CN CN202411693946.0A patent/CN120218692A/zh active Pending
- 2024-12-20 EP EP24222131.5A patent/EP4579488A1/de active Pending
Non-Patent Citations (1)
| Title |
|---|
| MASSON DAMIEN ET AL: "Charagraph: Interactive Generation of Charts for Realtime Annotation of Data-Rich Paragraphs", PROCEEDINGS OF THE WORKSHOP ON CONTEXT-AWARE MOVIE RECOMMENDATION, ACM, 2 PENN PLAZA, SUITE 701 NEW YORK NY 10121-0701 USA, 19 April 2023 (2023-04-19), pages 1 - 18, XP059087458, ISBN: 978-1-4503-3000-8, DOI: 10.1145/3544548.3581091 * |
Also Published As
| Publication number | Publication date |
|---|---|
| US20250209421A1 (en) | 2025-06-26 |
| CN120218692A (zh) | 2025-06-27 |
Similar Documents
| Publication | Publication Date | Title |
|---|---|---|
| US11514379B2 (en) | Work assignment queue elimination | |
| US8457984B2 (en) | System for evaluating potential claim outcomes using related historical data | |
| US9935893B2 (en) | Systems and methods for dynamically allocating computing tasks to computer resources in a distributed processing environment | |
| CN112860997A (zh) | 医疗资源推荐方法、装置、设备及存储介质 | |
| US20150269508A1 (en) | Method And Apparatus For Configuring A Task List | |
| EP2273448A1 (de) | Vorrichtung und Verfahren zur Ursachenanalyseunterstützung | |
| US11604802B2 (en) | Computer network controlled data orchestration system and method for data aggregation, normalization, for presentation, analysis and action/decision making | |
| US12200042B2 (en) | Command center | |
| US9785634B2 (en) | Integration and combination of random sampling and document batching | |
| US20140298343A1 (en) | Method and system for scheduling allocation of tasks | |
| US10896407B2 (en) | Cognitive adaptation to user behavior for personalized automatic processing of events | |
| EP3462390A1 (de) | Systeme für automatisierte profilerstellung, skillset-identifikation und service-ticket-routing | |
| US10599956B2 (en) | Automatic picture classifying system and method in a dining environment | |
| CN105321137A (zh) | 解读请求管理系统、解读请求管理设备及其控制方法 | |
| US11822965B2 (en) | Machine learning task compartmentalization and classification | |
| US10332622B2 (en) | Method, apparatus, and computer program product for facilitating query initiation and query response | |
| US11347789B1 (en) | Randomized compliant searching | |
| EP3867833A1 (de) | Echtzeit-arbeitsablaufverfolgung | |
| US12288009B2 (en) | Apparatus and method for option data object performance prediction and modeling | |
| US20250209421A1 (en) | Analytical report generation | |
| US20220382608A1 (en) | Methods and systems for determining stopping point | |
| EP3173990A1 (de) | Ereignisvorhersagesystem und -verfahren | |
| US9798814B2 (en) | Computer systems and computer-implemented methods for providing training content to a user | |
| US20160035045A1 (en) | Identifying occupation of a professional using profile and social data | |
| US20230307100A1 (en) | Information processing apparatus, information processing system, and information processing method |
Legal Events
| Date | Code | Title | Description |
|---|---|---|---|
| PUAI | Public reference made under article 153(3) epc to a published international application that has entered the european phase |
Free format text: ORIGINAL CODE: 0009012 |
|
| STAA | Information on the status of an ep patent application or granted ep patent |
Free format text: STATUS: REQUEST FOR EXAMINATION WAS MADE |
|
| 17P | Request for examination filed |
Effective date: 20241220 |
|
| AK | Designated contracting states |
Kind code of ref document: A1 Designated state(s): AL AT BE BG CH CY CZ DE DK EE ES FI FR GB GR HR HU IE IS IT LI LT LU LV MC ME MK MT NL NO PL PT RO RS SE SI SK SM TR |