EP4560579A1 - Display control device, display method, and display program - Google Patents
Display control device, display method, and display program Download PDFInfo
- Publication number
- EP4560579A1 EP4560579A1 EP24212442.8A EP24212442A EP4560579A1 EP 4560579 A1 EP4560579 A1 EP 4560579A1 EP 24212442 A EP24212442 A EP 24212442A EP 4560579 A1 EP4560579 A1 EP 4560579A1
- Authority
- EP
- European Patent Office
- Prior art keywords
- data
- range
- measurement
- display
- analysis
- Prior art date
- Legal status (The legal status is an assumption and is not a legal conclusion. Google has not performed a legal analysis and makes no representation as to the accuracy of the status listed.)
- Pending
Links
Images




Classifications
-
- G—PHYSICS
- G06—COMPUTING OR CALCULATING; COUNTING
- G06T—IMAGE DATA PROCESSING OR GENERATION, IN GENERAL
- G06T11/00—Two-dimensional [2D] image generation
- G06T11/20—Drawing from basic elements
-
- G—PHYSICS
- G06—COMPUTING OR CALCULATING; COUNTING
- G06F—ELECTRIC DIGITAL DATA PROCESSING
- G06F3/00—Input arrangements for transferring data to be processed into a form capable of being handled by the computer; Output arrangements for transferring data from processing unit to output unit, e.g. interface arrangements
- G06F3/01—Input arrangements or combined input and output arrangements for interaction between user and computer
- G06F3/048—Interaction techniques based on graphical user interfaces [GUI]
- G06F3/0481—Interaction techniques based on graphical user interfaces [GUI] based on specific properties of the displayed interaction object or a metaphor-based environment, e.g. interaction with desktop elements like windows or icons, or assisted by a cursor's changing behaviour or appearance
-
- G—PHYSICS
- G06—COMPUTING OR CALCULATING; COUNTING
- G06T—IMAGE DATA PROCESSING OR GENERATION, IN GENERAL
- G06T11/00—Two-dimensional [2D] image generation
- G06T11/20—Drawing from basic elements
- G06T11/23—Drawing from basic elements using straight lines or curves
-
- G—PHYSICS
- G06—COMPUTING OR CALCULATING; COUNTING
- G06F—ELECTRIC DIGITAL DATA PROCESSING
- G06F3/00—Input arrangements for transferring data to be processed into a form capable of being handled by the computer; Output arrangements for transferring data from processing unit to output unit, e.g. interface arrangements
- G06F3/01—Input arrangements or combined input and output arrangements for interaction between user and computer
- G06F3/048—Interaction techniques based on graphical user interfaces [GUI]
- G06F3/0481—Interaction techniques based on graphical user interfaces [GUI] based on specific properties of the displayed interaction object or a metaphor-based environment, e.g. interaction with desktop elements like windows or icons, or assisted by a cursor's changing behaviour or appearance
- G06F3/0482—Interaction with lists of selectable items, e.g. menus
-
- G—PHYSICS
- G06—COMPUTING OR CALCULATING; COUNTING
- G06F—ELECTRIC DIGITAL DATA PROCESSING
- G06F3/00—Input arrangements for transferring data to be processed into a form capable of being handled by the computer; Output arrangements for transferring data from processing unit to output unit, e.g. interface arrangements
- G06F3/01—Input arrangements or combined input and output arrangements for interaction between user and computer
- G06F3/048—Interaction techniques based on graphical user interfaces [GUI]
- G06F3/0484—Interaction techniques based on graphical user interfaces [GUI] for the control of specific functions or operations, e.g. selecting or manipulating an object, an image or a displayed text element, setting a parameter value or selecting a range
- G06F3/04847—Interaction techniques to control parameter settings, e.g. interaction with sliders or dials
-
- G—PHYSICS
- G06—COMPUTING OR CALCULATING; COUNTING
- G06T—IMAGE DATA PROCESSING OR GENERATION, IN GENERAL
- G06T7/00—Image analysis
- G06T7/60—Analysis of geometric attributes
-
- G—PHYSICS
- G06—COMPUTING OR CALCULATING; COUNTING
- G06T—IMAGE DATA PROCESSING OR GENERATION, IN GENERAL
- G06T2200/00—Indexing scheme for image data processing or generation, in general
- G06T2200/24—Indexing scheme for image data processing or generation, in general involving graphical user interfaces [GUIs]
-
- G—PHYSICS
- G06—COMPUTING OR CALCULATING; COUNTING
- G06T—IMAGE DATA PROCESSING OR GENERATION, IN GENERAL
- G06T2207/00—Indexing scheme for image analysis or image enhancement
- G06T2207/10—Image acquisition modality
- G06T2207/10028—Range image; Depth image; 3D point clouds
Definitions
- the present invention relates to a display control device, a display method, and a display program.
- JP 2020-038514 A describes a configuration for preprocessing data before analyzing the data.
- the present invention provides a display control device with which a preprocessing method suitable for pieces of measurement data is selected in response to a user's instruction.
- a display control device includes a processor configured to cause a display device to display a data image indicating a visualized measurement range of analysis target data and a range image indicating a visualized analysis range of the analysis target data in a juxtaposed or superimposed fashion in which directions of the visualized measurement range and the visualized analysis range agree with each other; and perform a predetermined analysis in an analysis range.
- the display control device causes the display device to display the data image and the analysis range of the data in the juxtaposed or superimposed fashion in which the directions indicating the ranges agree with each other.
- the description "the directions indicating the ranges agree with each other” means that the directions of extension and contraction of the data image that changes depending on values and the analysis range agree with each other.
- the term "display in the juxtaposed fashion” includes display of items side by side and display of items vertically.
- the term “display in the superimposed fashion” includes display of a base image and a superimposed image by synthesis and display of the superimposed image that pops up on the base image.
- the processor may be configured to cause the display device to display a plurality of the data images and the range image in the juxtaposed or superimposed fashion in which the directions of the visualized measurement ranges and the visualized analysis range agree with each other.
- the display device displays the data images and the analysis range of the data in the juxtaposed or superimposed fashion in which the directions indicating the ranges agree with each other.
- the display device displays the data images and the analysis range of the data in the juxtaposed or superimposed fashion in which the directions indicating the ranges agree with each other.
- the processor may be configured to cause the display device to further display a setting screen for a data processing method in the juxtaposed or superimposed fashion, the data processing method being method of causing the visualized measurement range to agree with the visualized analysis range.
- the display device further displays, in the juxtaposed or superimposed fashion, the setting screen for the data processing method for causing the measurement range of the data to agree with the analysis range of the data.
- the data processing method can be set while checking the data image and the analysis range of the data.
- the processor may be configured to cause the display device to display the data image before being processed by the data processing method and the data image after being processed by the data processing method in the juxtaposed or superimposed fashion in which the direction of the visualized measurement range of the data image before being processed by the data processing method and the direction of the visualized measurement range of the data image after being processed by the data processing method agree with each other.
- the display device displays the data images before and after being processed in the juxtaposed or superimposed fashion in which the directions indicating the ranges agree with each other.
- the change in the range of the data due to processing can be displayed visually.
- the processor may be configured to determine the data processing method to be recommended for use based on at least one of the analysis target data and a history of the processing methods selected by a user; and cause the display device to display the determined data processing method.
- the display control device determines the processing method to be recommended for use based on at least one of the data and the history of the processing methods selected by the user, and causes the display device to display the processing method. For example, a trained model is generated by performing machine learning based on past processing methods determined for the analysis target data, and the recommended processing method is determined by inputting data to be processed to the generated trained model. With the display control device, it is possible to propose a processing method suitable for the analysis target data.
- a display method to be performed by a computer includes causing a display device to display a data image indicating a visualized measurement range of analysis target data and a range image indicating a visualized analysis range of the analysis target data in a juxtaposed or superimposed fashion in which directions of the visualized measurement range and the visualized analysis range agree with each other; and performing a predetermined analysis in an analysis range.
- the display device displays the data image and the analysis range of the data in the juxtaposed or superimposed fashion in which the directions indicating the ranges agree with each other.
- a preprocessing method suitable for measurement data can be selected in response to a user's instruction.
- a display program causes a computer to perform a process of causing a display device to display a data image that indicating a visualized measurement range of analysis target data and a range image indicating a visualized analysis range of the analysis target data in a juxtaposed or superimposed fashion in which directions of the visualized measurement range and the visualized analysis range agree with each other; and performing a predetermined analysis in an analysis range.
- a display program to be executed by a computer causes the computer to perform a process including causing a display device to display to display the data image and the analysis range of the data in the juxtaposed or superimposed fashion in which the directions indicating the ranges agree with each other.
- a preprocessing method suitable for measurement data can be selected in response to a user's instruction.
- a preprocessing method suitable for pieces of measurement data can be selected in response to the user's instruction.
- FIG. 1 shows a display system 10 of the present embodiment.
- the display system 10 of the present embodiment checks the ranges of pieces of measurement data serving as analysis target data, and processes the pieces of measurement data.
- processing refers to data processing. Specifically, the “processing” includes extending, contracting, interpolating, and shifting data.
- the interpolation includes known interpolation methods such as linear interpolation and spline interpolation in addition to a method of interpolating data with a specified value.
- the display system 10 of the present embodiment includes a control device 20 serving as a display control device, an information processing device 22, measurement devices 24, and a display device 26.
- the control device 20 includes a central processing unit (CPU) 20A, a read only memory (ROM) 20B, a random access memory (RAM) 20C, a storage 20D, a communication interface (I/F) 20E, and an input/output I/F 20F.
- CPU central processing unit
- ROM read only memory
- RAM random access memory
- storage 20D a storage 20D
- I/F communication interface
- I/F 20F input/output I/F 20F.
- the CPU 20A, the ROM 20B, the RAM 20C, the storage 20D, the communication I/F 20E, and the input/output I/F 20F are connected to communicate with each other via a bus 20G.
- the CPU 20A is a central processing unit that executes various programs and controls each part. That is, the CPU 20A reads a program from the ROM 20B or the storage 20D, and executes the program using the RAM 20C as a working area.
- the ROM 20B stores various programs and various types of data. As shown in FIG. 2 , the ROM 20B of the present embodiment stores a display program 100 and setting data 110. The display program 100 and the setting data 110 may be stored in the storage 20D.
- the display program 100 causes the display device 26 to display measurement data to be processed, and also performs data processing described later.
- the setting data 110 is referenced when processing measurement data described later. Specifically, the setting data 110 stores setting values such as an analysis range necessary for processing instructions, whether to extend or contract the measurement data, a method for shifting the measurement data, and a method for interpolating the measurement data.
- the RAM 20C temporarily stores programs or data as a working area.
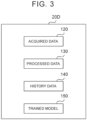
- the storage 20D is a hard disk drive (HDD) or a solid state drive (SSD), and stores various programs and various types of data. As shown in FIG. 3 , the storage 20D of the present embodiment stores acquired data 120, processed data 130, history data 140 serving as a history of processing methods, and a trained model 150. The acquired data 120, the processed data 130, the history data 140, and the trained model 150 may be stored in the ROM 20B.
- HDD hard disk drive
- SSD solid state drive
- the acquired data 120 stores measurement data transferred from the information processing device 22, measurement data acquired from the measurement device 24, etc.
- the measurement data stored in the acquired data 120 is waveform data, time series data, etc.
- the measurement data stored in the acquired data 120 is, for example, analysis data obtained by X-ray diffraction (XRD) or an electrocardiogram.
- the processed data 130 stores measurement data obtained after processing the measurement data in the data processing described later.
- the history data 140 stores information on a history of processing methods selected by users for individual pieces of measurement data. Specifically, the history data 140 stores the type of excess or deficiency of a measurement range of measurement data relative to an analysis range, the proportion of each type of excess or deficiency in the measurement data, and a processing method specified by a user.
- the type of excess or deficiency includes excess or deficiency of the measurement range of the measurement data relative to the analysis range, and a direction of the excess or deficiency of the data (e.g., right or left when a data range is plotted on the horizontal axis).
- the trained model 150 is trained based on the history data 140.
- the trained model 150 is a trained model that has undergone machine learning using, as training data, the history of processing methods for the individual pieces of measurement data acquired by an acquisition unit 240 described later. For example, when information including a measurement range of measurement data and an analysis range is input, the trained model 150 outputs a recommended processing method for the measurement data.
- the communication I/F 20E is an interface for communicating with external devices. Specifically, the communication I/F 20E of the present embodiment communicates with the information processing device 22 and a plurality of measurement devices 24.
- the information processing device 22 communicates bidirectionally with the control device 20.
- the information processing device 22 of the present embodiment transmits, to the control device 20, measurement data acquired from the measurement device 24 that communicates with the information processing device 22.
- the input/output I/F 20F is an interface for connecting to an input/output device. Specifically, the input/output I/F 20F of the present embodiment is connected to the display device 26. The display device 26 may be connected directly to the bus 20G.
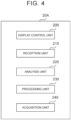
- the control device 20 of the present embodiment functions as a display control unit 200, a reception unit 210, an analysis unit 220, a processing unit 230, and the acquisition unit 240 by the CPU 20A executing the display program 100.
- the display control unit 200 has a function of displaying images and screens related to the processing of measurement data. Specifically, the display control unit 200 causes the display device 26 to display images and screens related to the processing of measurement data.
- the display control unit 200 displays, for example, a measurement image 300 as a data image indicating a visualized measurement range of the measurement data, a range image 310 indicating a visualized analysis range, and a check screen 400 for checking the measurement image 300 and the range image 310 (see FIG. 5 ).
- the display control unit 200 also displays an instruction screen 500 (see FIG. 7 ) for a processing method for the measurement data, a measurement image 301 (see FIG. 8 ) showing the measurement data before processing, and a processed image 302 (see FIG. 8 ) showing the measurement data after processing.
- the display control unit 200 of the present embodiment displays the measurement image 300 and the range image 310 in a juxtaposed or superimposed fashion so that the directions indicating the ranges agree with each other.
- the display control unit 200 displays the check screen 400 and the instruction screen 500 in a juxtaposed or superimposed fashion.
- the display control unit 200 displays the measurement image 301 and the processed image 302 in a juxtaposed or superimposed fashion so that the directions indicating the ranges agree with each other.
- the description "the directions indicating the ranges agree with each other” means that the directions of extension and contraction of the images that change depending on values, that is, the axis directions of values indicating the measurement data or the analysis range (see “reference axis 406" described later), agree with each other.
- the measurement image 300 and the range image 310 as well as the measurement image 301 and processed image 302 displayed on the check screen 400 are extended or contracted in the same direction.
- the lateral direction is the "direction indicating the range" (see FIGS. 5 , 6 , 8 , and 9 ).
- the reception unit 210 has a function of receiving an analysis range.
- the reception unit 210 receives, for example, an analysis range input by a user.
- the reception unit 210 also has a function of receiving processing instructions. Specifically, the reception unit 210 receives setting values of a processing method determined on the instruction screen 500. For example, the reception unit 210 receives setting values of whether to extend or contract the measurement data, a method for shifting the measurement data, and a method for interpolating the measurement data.
- the analysis range and the processing instructions received by the reception unit 210 are applied to the setting data 110 in the ROM 20B and reflected in the history data 140 in the storage 20D.
- the analysis unit 220 analyzes whether the measurement range of the measurement data is excessive or insufficient relative to the analysis range. Specifically, the analysis unit 220 analyzes excess or deficiency of the measurement range of the measurement data relative to the analysis range, and a direction of the excess or deficiency of the data.
- the analysis unit 220 analyzes the proportion of the excess or deficiency of the measurement range of the measurement data relative to the analysis range. Specifically, the analysis unit 220 analyzes the proportion of the excess or deficiency of the measurement range of the measurement data relative to the analysis range to the entire measurement range of the measurement data before processing.
- the analysis unit 220 reflects the analyzed information in the history data 140.
- the processing unit 230 has a function of processing the measurement data. As the data processing, the processing unit 230 of the present embodiment processes the measurement data based on a processing instruction received by the reception unit 210. The processing unit 230 reflects the processed data 130 obtained after processing the measurement data in the storage 20D.
- the acquisition unit 240 has a function of acquiring the measurement data. Specifically, the acquisition unit 240 acquires the measurement data from the information processing device 22 or the measurement device 24. The acquisition unit 240 reflects the acquired measurement data in the acquired data 120 in the storage 20D. The acquisition unit 240 acquires all the pieces of measurement data to be analyzed from the acquired data 120 in the storage 20D at the start of the data processing described later.
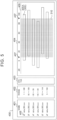
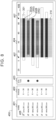
- FIGS. 5 to 9 Transition of screens during the data processing described later that is executed by the control device 20 of the present embodiment will be described with reference to FIGS. 5 to 9 .
- the screens in FIGS. 5 to 9 are displayed on the display device 26.
- the check screen 400 is a screen for checking the measurement ranges of the pieces of measurement data to be analyzed.
- the check screen 400 of the present embodiment includes a name field 401 including file names for identifying the pieces of measurement data and check boxes 405 for selecting files, a range field 402 showing ranges of measurement of the pieces of measurement data, a status field 403 showing statuses as to whether processing is necessary for the pieces of measurement data, and a measurement image field 404 showing a plurality of measurement images 300.
- check screen 400 An example of the check screen 400 shown in FIG. 5 will be described below.
- analysis range is described as "8 to 90".
- file names "data_001.csv”, “data_002.csv”, “data_003.csv”, “data_004.csv”, “data_005.csv”, and “data_006.csv” are displayed vertically.
- the check boxes 405 are displayed at the left of the file names. All the check boxes 405 in FIG. 5 are displayed with check marks, which means that all the files are selected for processing.
- the reference axis 406 indicating a reference of the measurement range, a plurality of measurement images 300A, the range image 310, and position images 407 showing the positions of upper and lower limits of the analysis range are displayed.
- the reference axis 406 is a straight line indicating the axis of values represented by the measurement images 300A and the range image 310, and extends at the upper part of the measurement image field 404 along an extension and contraction direction of the measurement images 300A and the range image 310.
- the reference axis 406 is displayed as the horizontal axis in the measurement image field 404.
- the measurement image 300A is a measurement image 300 showing the measurement data in each file with its measurement range displayed in the form of a horizontal rectangle.
- the extension and contraction directions of the measurement images 300A are displayed in the rows indicating the files to agree with the direction of the reference axis 406.
- the range image 310 is a rectangular image showing the analysis range, and is transparently superimposed on the measurement images 300A.
- the extension and contraction direction of the range image 310 agrees with the direction of the reference axis 406.
- the position image 407 is displayed as an image of an inverted triangle on the reference axis 406.
- the position images 407 are displayed at the positions corresponding to the upper and lower limits of the range shown by the range image 310.
- the range image 310 may be juxtaposed to the measurement images 300A as a bar-shaped figure having a length corresponding to the analysis range or as a figure having arrows at both ends and having a length corresponding to the analysis range.
- the range image 310 may be displayed as straight lines or dashed lines extending vertically downward from the positions of the upper and lower limits of the analysis range on the reference axis 406 indicating the reference of the measurement range.
- the range image 310 may be transparently superimposed on the measurement images 300A as an image that fills in the areas outside the analysis range.
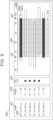
- the CPU 20A causes the check screen 400 to display an indication as to whether the measurement range of the measurement data is insufficient relative to the analysis range. Differences from FIG. 5 will be described below.
- the other configuration is the same as that in FIG. 5 , and detailed description thereof will be omitted.
- a mark indicating the need to process the measurement data is displayed in the row indicating the target file in the status field 403 in FIG. 6 .
- the measurement range is insufficient relative to the analysis range of 8 to 90. Therefore, the mark indicating the need to process the measurement data is displayed.
- a highlight is displayed in the measurement image field 404.
- the highlight is displayed as a blue image at a portion of the measurement image 300A that overlaps the analysis range.
- the instruction screen 500 is a screen for instruction on a processing method for the measurement data.
- the instruction screen 500 of the present embodiment includes an instruction field 501 for inputting an instruction on a processing method, and a measurement image field 502 showing a measurement image 300B.
- the measurement image 300B is a measurement image 300 showing the measurement data in the form of a graph (X-axis: measurement range, Y-axis: measurement value).
- the instruction screen 500 is superimposed on the check screen 400 in the form of a dialog window.
- the instruction screen 500 need not essentially be superimposed on the check screen 400, and the dialog window showing the instruction screen 500 may be moved to display the instruction screen 500 and the check screen 400 without an overlap.
- the instruction screen 500 described below is displayed when processing the measurement data in the file "data_001.csv”.
- the number of pieces of measurement data in the processing target file with a check mark in the check box 405 and numerical values indicating the analysis range are displayed in the upper left area of the instruction screen 500. Specifically, the number of pieces of measurement data to be processed is "6" and the analysis range is "8 to 90".
- a check box for determining whether to extend or contract the measurement data, an input field for inputting a method for shifting the measurement data, and an input field for inputting a value to be used for data interpolation in the measurement data are displayed.
- the input field for inputting a method for shifting the measurement data includes a pull-down menu for selecting "right” or "left” indicating the direction of the X-axis that is the direction of the analysis range shown by the range image 310, and an input field for inputting a value on the X-axis.
- the input field for interpolation of the measurement data includes an input field for inputting any measurement value that fills in a missing part of the data at the left end, and an input field for inputting any measurement value that fills in a missing part of the data at the right end.
- the measurement image 300B showing the measurement data in the file "data_001.csv" and the range image 310 are displayed.
- the range image 310 is transparently superimposed on the measurement image 300B.
- the measurement image 300B may be displayed while being changed to an image showing the processed measurement data (so-called preview display) in accordance with the input processing instruction.
- a cancellation button 503 and a confirmation button 504 are provided in the upper right area of the instruction screen 500.
- the user can cancel the processing instruction by clicking the cancellation button 503.
- the user can confirm the processing instruction by clicking the confirmation button 504.
- the CPU 20A receives the processing instruction.
- the measurement data in the file "data_001.csv” is processed in accordance with the input instruction.
- the CPU 20A refreshes the instruction screen 500 based on the measurement data in the file "data_002.csv”, and receives a processing instruction. That is, the CPU 20A sequentially refreshes the instruction screen 500 for the pieces of measurement data in all the files with check marks in the check boxes 405, and receives processing instructions.
- the CPU 20A After the CPU 20A receives the processing instructions for the pieces of measurement data in all the files with check marks in the check boxes 405, the CPU 20A erases the instruction screen 500 and displays the check screen 400 updated based on the pieces of processed measurement data. When there is a file in which the analysis range does not agree with the measurement range of the processed measurement data, the CPU 20A displays the check screen 400 as shown in FIG. 8 .
- check screen 400 shown in FIG. 8 An example of the check screen 400 shown in FIG. 8 will be described below. Differences from FIG. 6 will be described below. The other configuration is the same as that in FIG. 6 , and detailed description thereof will be omitted.
- the measurement ranges of the pieces of processed measurement data are displayed.
- numerical values "8 to 90" corresponding to the measurement range of the processed measurement data in the file "data_001.csv” are displayed in the row indicating that file.
- "17 to 84" corresponding to "data_002.csv” and “data_004.csv” and “8 to 90” corresponding to "data_003.csv", "data_005.csv”, and "data_006.csv” are similarly displayed in the rows indicating these files.
- the measurement images 301 showing the measurement ranges of the pieces of measurement data before processing, the processed images 302 showing the measurement ranges of the pieces of measurement data after processing, and the range image 310 are displayed.
- the measurement image 301 corresponds to the measurement image 300A represented by a dashed line.
- the processed image 302 is superimposed on the measurement image 301.
- the processed images 302 include a processed image 302A showing a case where the measurement range after processing agrees with the analysis range, and a processed image 302B showing a case where the measurement range after processing does not agree with the analysis range.
- the processed image 302A is a blue image
- the processed image 302B is a dark gray image.
- the CPU 20A displays the instruction screen 500 again.
- the instruction screen 500 may be displayed only for the files in which the analysis range does not agree with the measurement ranges.
- the CPU 20A displays the check screen 400 as shown in FIG. 9 .
- check screen 400 shown in FIG. 9 An example of the check screen 400 shown in FIG. 9 will be described below. Differences from FIG. 8 will be described below. The other configuration is the same as that in FIG. 8 , and detailed description thereof will be omitted.
- the mark indicating the need to process the measurement data is not displayed in the status field 403.
- a mark indicating that the measurement range agrees with the analysis range may be displayed.
- the CPU 20A ends the screen transition in the data processing described later. Then, the CPU 20A performs a predetermined analysis based on the processed data 130 including the pieces of measurement data after processing. The CPU 20A learns the processing instructions from the user.
- FIG. 10 is a flowchart showing a flow of the data processing for the measurement data according to the present embodiment.
- the process in the control device 20 is implemented by the CPU 20A functioning as the display control unit 200, the reception unit 210, the analysis unit 220, the processing unit 230, and the acquisition unit 240.
- step S 100 of FIG. 10 the CPU 20A acquires all pieces of measurement data to be analyzed.
- the CPU 20A acquires all the pieces of measurement data to be analyzed from the acquired data 120 stored in the storage 20D.
- step S 101 the CPU 20A receives an analysis range.
- the CPU 20A receives a range "8 to 90" input by a user.
- step S102 the CPU 20A analyzes whether the measurement range of each piece of measurement data is excessive or insufficient relative to the analysis range. Specifically, the CPU 20A analyzes whether the measurement range of each piece of measurement data is excessive or insufficient relative to the analysis range, the direction of the excess or deficiency of the data, and the proportion of the excess or deficiency.
- step S103 the CPU 20A superimposes an image showing the analysis range on a plurality of images showing the measurement ranges. Specifically, the CPU 20A synthesizes the range image 310 on the measurement images 300A (see FIGS. 5 and 6 ).
- step S104 the CPU 20A determines whether there is an excess or deficiency of the measurement ranges relative to the analysis range. When the CPU 20A determines that there is an excess or deficiency (S104: YES), the CPU 20A proceeds to step S105. When the CPU 20A determines that there is no excess or deficiency (S104: NO), the CPU 20A proceeds to step S109.
- step S105 the CPU 20A displays the instruction screen 500 for processing the excessive or insufficient measurement data. Specifically, the CPU 20A superimposes the instruction screen 500 on the check screen 400 (see FIG. 7 ). For example, the CPU 20A displays the instruction screen 500 as a dialog window.
- step S106 the CPU 20A receives a processing instruction. Specifically, the CPU 20A receives data input by the user in the instruction field 501 of the instruction screen 500. The CPU 20A applies the received processing instruction to the setting data 110 in the ROM 20B and reflects the processing instruction in the history data 140 in the storage 20D.
- step S107 the CPU 20A processes the measurement data in accordance with details of the instruction. Specifically, the CPU 20A processes the measurement data in the file with a check mark in the check box 405 in accordance with the processing instruction received in step S106. The CPU 20A stores the processed measurement data in the processed data 130 in the storage 20D.
- step S108 the CPU 20A superimposes an image showing the measurement range after processing on the image showing the measurement range before processing. Specifically, the CPU 20A superimposes the processed image 302 on the measurement image 301 (see FIG. 8 ). The CPU 20A returns to step S102.
- step S109 the CPU 20A performs a predetermined analysis. Specifically, the CPU 20A performs the predetermined analysis using the processed data 130 in which the analysis range agrees with the measurement ranges of the pieces of measurement data.
- step S110 the CPU 20A determines whether a processing instruction has been received. Specifically, the CPU 20A determines whether a processing instruction has been received in step S106. When the CPU 20A determines that a processing instruction has been received (step S110: YES), the CPU 20A proceeds to step S111. When the CPU 20A determines that no processing instruction has been received (step S110: NO), the CPU 20A ends the data processing.
- step S111 the CPU 20A learns the processing instruction. Specifically, the CPU 20A retrains the trained model 150 using the processing instruction received from the user. For example, the CPU 20A retrains the trained model 150 using the history data 140 in which the processing instruction is reflected. The CPU 20A ends the data processing.
- the display control unit 200 displays the measurement images 300 and the range image 310 in a superimposed fashion so that the directions indicating the ranges agree with each other.
- the display control unit 200 may display a plurality of measurement images 300 and the range image 310 in a superimposed fashion.
- the analysis unit 220 analyzes whether the measurement range is excessive or insufficient relative to the analysis range. When there is an excess or deficiency, the display control unit 200 superimposes the instruction screen 500 for instruction on processing of the measurement data on the check screen 400 as a dialog window.
- the display control unit 200 displays the measurement image 301 showing the measurement range before processing and the processed image 302 showing the measurement range after processing in a superimposed fashion so that the directions showing the ranges agree with each other.
- the control device 20 of the present embodiment causes the display device 26 to display the measurement image 300 and the range image 310 in a juxtaposed or superimposed fashion so that the directions indicating the ranges agree with each other.
- a processing method suitable for the measurement data can be selected in response to the user's instruction.
- the display device 26 displays a plurality of measurement images 300 and the range image 310 in a juxtaposed or superimposed fashion so that the directions indicating the ranges agree with each other.
- the display device 26 further displays, in a juxtaposed or superimposed fashion, the instruction screen 500 for a data processing method that causes the measurement range of the measurement data to agree with the analysis range.
- the measurement data processing method can be set while checking the measurement image 300 and the range image 310.
- the display device 26 further displays the measurement image 301 and the processed image 302 in a juxtaposed or superimposed fashion so that the directions indicating the ranges agree with each other.
- the change in the range of the measurement data due to processing can be displayed visually.
- the control device 20 of the present embodiment displays the measurement data measured by the measurement device 24 and performs data processing as necessary.
- the present invention is not limited to this, and the control device 20 may display data having a range even if it is not measured data, and may process the data as necessary. Examples of the data having a range include price data, evaluation data, and statistical data. These pieces of data may be acquired by being transmitted from the information processing device 22, an external server (not shown), etc.
- the processing method in the control device 20 of the present embodiment is not limited to the method described in the above embodiment.
- Examples of the processing method include a processing method in which data in a range exceeding the analysis range is deleted from the measurement range of the measurement data, and a processing method in which the data in the excessive range is moved to an insufficient range.
- the data interpolation includes not only filling in missing parts of the data at the right and left ends, but also filling in a missing part in the middle of the data.
- the control device 20 of the present embodiment displays the mark indicating the need to process the measurement data when the measurement range of the measurement data is insufficient relative to the analysis range (see FIG. 6 ).
- the present invention is not limited to this, and the control device 20 may display the mark indicating the need to process the measurement data when the measurement range of the measurement data is excessive relative to the analysis range.
- the control device 20 of the present embodiment highlights the portion of the measurement image 300A that overlaps the analysis range when the measurement range of the measurement data is sufficient relative to the analysis range (see FIG. 6 ).
- the present invention is not limited to this, and the control device 20 may highlight the measurement image 300A when the measurement range of the measurement data agrees with the analysis range.
- the control device 20 of the present embodiment issues processing instructions individually for the pieces of measurement data to be processed (see FIG. 7 ).
- the present invention is not limited to this, and the control device 20 may issue a processing instruction collectively for all the pieces of measurement data to be processed.
- the control device 20 of the present embodiment retrains the trained model 150 using the history data 140 stored in the storage 20D.
- the present invention is not limited to this, and a trained model that has been trained by online learning may be retrained using the processing instruction received in step S106 (see FIG. 10 ).
- the online learning refers to sequentially retraining and improving a trained model using new training data alone.
- the retraining device is not limited to the control device 20, but an external device such as the information processing device 22 may be used.
- the trained model 150 of the present embodiment outputs a processing method for the measurement data when information including the measurement range of the measurement data and the analysis range is input.
- the present invention is not limited to this, and the information input to the trained model 150 may include, for example, information on the category, purpose, frequency of occurrence, evaluation, or reliability of the measurement data.
- the display system 10 of the present embodiment includes one information processing device 22, one measurement device 24 that communicates with the information processing device 22, and one display device 26, but the present invention is not limited to this.
- the display system 10 may include a plurality of information processing devices 22, a plurality of measurement devices 24, and a plurality of display devices 26. Two measurement devices 24 that communicate with the communication I/F 20E are illustrated, but the present invention is not limited to this. Three or more measurement devices 24 may be provided.
- the check box 405 with a check mark indicates that the item is selected as a processing target (see FIG. 5 ).
- the present invention is not limited to this, and the check box 405 with a check mark may indicate that the item is selected as an analysis target.
- the control device 20 of the present embodiment performs analysis using the processed data 130 including the measurement data after processing.
- the present invention is not limited to this, and the control device 20 may perform analysis using unprocessed measurement data when the analysis range and the measurement range of the measurement data agree with each other from the beginning.
- the control device 20 of the present embodiment displays a plurality of measurement images 300A arranged vertically, and superimposes the range image 310 on the measurement images 300A (see FIG. 5 ).
- the control device 20 superimposes the instruction screen 500 on the check screen 400 in the form of a dialog window, and superimposes the range image 310 on the measurement image 300B (see FIG. 7 ).
- the control device 20 displays a plurality of measurement images 301 arranged vertically, superimposes the processed images 302 on the measurement images 301, and superimposes the range image 310 on the measurement images 301 (see FIG. 8 ).
- the display method is not limited to these methods. With the reference axis 406 set along the up-down direction, the control device 20 may display the above images or screens side by side.
- the control device 20 may display the above images or screens in a superimposed fashion by synthesizing or popping up the images or screens.
- the display in a superimposed fashion includes not only constant display by synthesis, but also temporary display by pop-up
- a control device 20 of a second embodiment differs from that of the first embodiment in that the control device 20 presents a recommended processing method for the measurement data to be analyzed. Differences from the first embodiment will be described below.
- the other configuration is the same as that in the above embodiment, and detailed description thereof will be omitted.
- control device 20 of the present embodiment further includes a determination unit 250 in addition to the display control unit 200, the reception unit 210, the analysis unit 220, the processing unit 230, and the acquisition unit 240 by the CPU 20A executing the display program 100.
- the display control unit 200 of the present embodiment has a function of displaying the instruction screen 500 in a state in which the setting values have been input. Specifically, the display control unit 200 displays the instruction screen 500 in a state in which the setting values of a processing method determined by the determination unit 250 described later have been input.
- the determination unit 250 has a function of determining a recommended processing method. Specifically, the determination unit 250 determines a processing method output from the trained model 150 as the recommended processing method for the measurement data.
- FIG. 12 is a flowchart showing a flow of a determination process for determining a recommended processing method.
- the determination process is, for example, performed between steps S102 and S103 (see FIG. 10 ).
- step S200 of FIG. 12 the CPU 20A acquires the types of excess or deficiency of the pieces of measurement data. Specifically, the CPU 20A acquires information obtained through the analysis in step S102 (see FIG. 10 ) as to whether the measurement range of each piece of measurement data is excessive or insufficient relative to the analysis range, and about the direction of the excess or deficiency of the data.
- step S201 the CPU 20A acquires the proportion of the excess or deficiency of each piece of measurement data. Specifically, the CPU 20A acquires information obtained through the analysis in step S102 (see FIG. 10 ) about the proportion of the excess or deficiency of the measurement range of each piece of measurement data relative to the analysis range.
- step S202 the CPU 20A inputs the acquired pieces of information and the analysis range to the trained model 150. Specifically, the CPU 20A inputs the pieces of information acquired in steps S200 and S201 and the analysis range received in step S101 (see FIG. 10 ) to the trained model 150 stored in the storage 20D.
- step S203 the CPU 20A acquires a processing method output from the trained model 150. Specifically, the CPU 20A acquires a processing method for each piece of measurement data.
- step S204 the CPU 20A determines the acquired processing method as the processing method for the measurement data. Specifically, the CPU 20A determines each processing method acquired in step S203 as the recommended processing method for each piece of measurement data. The CPU 20A ends the determination process. After the determination process has ended, the CPU 20A displays, in step S105 (see FIG. 10 ), the instruction screen 500 in a state in which the setting values of the determined processing method have been input.
- the CPU 20A displays the instruction screen 500 according to the second embodiment in step S105 (see FIG. 10 ).
- FIG. 13 An example of the instruction screen 500 shown in FIG. 13 will be described below. Differences from FIG. 7 will be described below. The other configuration is the same as that in FIG. 7 , and detailed description thereof will be omitted.
- the setting values of the processing method determined in step S204 are displayed in an input state. That is, the recommended processing method has already been input.
- a check mark is put in the check box as to whether to extend or contract the measurement data, alignment of the "left" end with “8” is input as the shift of the measurement data, and filling in both the right and left ends with "0" is input as the interpolation of the measurement data.
- White characters on a black background indicate the input state and do not show the actual display.
- a measurement image 300B showing the measurement data when the processing method determined in step S204 (see FIG. 12 ) is applied is displayed in the measurement image field 502.
- a measurement image 300B before the processing method is applied may be displayed.
- the control device 20 of the second embodiment determines a processing method to be recommended for use based on the measurement data to be analyzed and the trained model 150 trained from the history data 140.
- the control device 20 causes the display device 26 to display the determined processing method in a state in which the processing method has been input to the instruction screen 500.
- control device 20 of the second embodiment determines the processing method to be recommended for use based on the measurement data and the history data 140, and causes the display device 26 to display the processing method.
- the control device 20 of the second embodiment determines the processing method to be recommended for use based on the measurement data and the history data 140, and causes the display device 26 to display the processing method.
- the trained model 150 is trained by the control device 20.
- the present invention is not limited to this, and the trained model 150 may be trained by an external device (e.g., the information processing device 22) connected to the control device 20.
- the information processing device 22 acquires the history data 140 from the control device 20 and trains the trained model 150 based on the history data 140.
- the information processing device 22 provides the trained model 150 to the control device 20.
- the providing method may be a method of transmitting the trained model 150 itself to the control device 20, or a method of storing the trained model 150 in the information processing device 22 and transmitting only the output result of the trained model 150 to the control device 20.
- a processing method output by inputting information including the measurement data and the analysis range to the trained model 150 is presented to the user.
- the present invention is not limited to this, and the control device 20 may refer to the history data 140 and present, to the user, a frequently selected processing method, a previously set processing method, etc. as the recommended processing method. That is, the control device 20 determines the processing method to be recommended for use based on the trained model 150 trained from the history data 140 without using the measurement data to be analyzed.
- the control device 20 of the second embodiment determines the recommended processing method for each piece of measurement data.
- the present invention is not limited to this, and the control device 20 may determine a recommended processing method for collectively processing all the pieces of measurement data.
- Examples of the recommended processing method for collectively processing all the pieces of measurement data include a method of selecting a processing method with the highest commonality from among the processing methods recommended for the individual pieces of measurement data, and a method of determining a processing method based on the history of processing methods used when collectively processing the pieces of data.
- Various processes performed by the CPU 20A reading and executing software (programs) in each of the above embodiments may be performed by various processors other than the CPU.
- the processors in this case include a programmable logic device (PLD) such as a field-programmable gate array (FPGA) having a circuit configuration that can be changed after manufacture, and a dedicated electric circuit such as an application specific integrated circuit (ASIC) that is a processor having a circuit configuration designed exclusively to perform a specific process.
- PLD programmable logic device
- FPGA field-programmable gate array
- ASIC application specific integrated circuit
- the above processes may be performed by one of the various processors or by a combination of two or more processors of the same or different types (e.g., a plurality of FPGAs or a combination of a CPU and an FPGA). More specifically, each of the hardware structures of the various processors is an electric circuit that combines circuit elements such as semiconductor elements.
- the programs have been described as being stored (installed) in advance in a non-transitory computer-readable recording medium.
- the display program 100 in the control device 20 is stored in advance in the ROM 20B.
- the present invention is not limited to this, and each program may be provided by being recorded on a non-transitory recording medium such as a compact disc read only memory (CD-ROM), a digital versatile disc read only memory (DVD-ROM), or a universal serial bus (USB) memory.
- the program may be downloaded from an external device via a network.
Landscapes
- Engineering & Computer Science (AREA)
- Theoretical Computer Science (AREA)
- Physics & Mathematics (AREA)
- General Physics & Mathematics (AREA)
- General Engineering & Computer Science (AREA)
- Human Computer Interaction (AREA)
- Geometry (AREA)
- Computer Vision & Pattern Recognition (AREA)
- User Interface Of Digital Computer (AREA)
Abstract
A display control device (20) includes a processor (20A) configured to: cause a display device (26) to display a data image (300) indicating a visualized measurement range of analysis target data (120) and a range image (310) indicating a visualized analysis range of the analysis target data (120) in a juxtaposed or superimposed fashion in which directions of the visualized measurement range and the visualized analysis range agree with each other; and perform a predetermined analysis in an analysis range.
Description
- The present invention relates to a display control device, a display method, and a display program.
-
Japanese Unexamined Patent Application Publication No. 2020-038514 JP 2020-038514 A - When analyzing pieces of measurement data of a sample, it may be necessary to align the measurement ranges of the pieces of measurement data. In this case, it is necessary to preprocess the pieces of measurement data. In the configuration of
JP 2020-038514 A - The present invention provides a display control device with which a preprocessing method suitable for pieces of measurement data is selected in response to a user's instruction.
- A display control device according to a first aspect of the present invention includes a processor configured to cause a display device to display a data image indicating a visualized measurement range of analysis target data and a range image indicating a visualized analysis range of the analysis target data in a juxtaposed or superimposed fashion in which directions of the visualized measurement range and the visualized analysis range agree with each other; and perform a predetermined analysis in an analysis range.
- The display control device according to the first aspect of the present invention causes the display device to display the data image and the analysis range of the data in the juxtaposed or superimposed fashion in which the directions indicating the ranges agree with each other. Thus, it is possible to visually display an excess or deficiency of the range of the analysis target data relative to the analysis range. The description "the directions indicating the ranges agree with each other" means that the directions of extension and contraction of the data image that changes depending on values and the analysis range agree with each other. The term "display in the juxtaposed fashion" includes display of items side by side and display of items vertically. The term "display in the superimposed fashion" includes display of a base image and a superimposed image by synthesis and display of the superimposed image that pops up on the base image. With the display control device, a preprocessing method suitable for measurement data can be selected in response to a user's instruction.
- In the above aspect, the processor may be configured to cause the display device to display a plurality of the data images and the range image in the juxtaposed or superimposed fashion in which the directions of the visualized measurement ranges and the visualized analysis range agree with each other.
- In the display control device according to the above aspect, the display device displays the data images and the analysis range of the data in the juxtaposed or superimposed fashion in which the directions indicating the ranges agree with each other. Thus, it is possible to visually display a list of excesses or deficiencies of the ranges of the pieces of analysis target data relative to the analysis range.
- In the above aspect, the processor may be configured to cause the display device to further display a setting screen for a data processing method in the juxtaposed or superimposed fashion, the data processing method being method of causing the visualized measurement range to agree with the visualized analysis range.
- In the display control device according to the above aspect, the display device further displays, in the juxtaposed or superimposed fashion, the setting screen for the data processing method for causing the measurement range of the data to agree with the analysis range of the data. Thus, the data processing method can be set while checking the data image and the analysis range of the data.
- In the above aspect, the processor may be configured to cause the display device to display the data image before being processed by the data processing method and the data image after being processed by the data processing method in the juxtaposed or superimposed fashion in which the direction of the visualized measurement range of the data image before being processed by the data processing method and the direction of the visualized measurement range of the data image after being processed by the data processing method agree with each other.
- In the display control device according to the above aspect, the display device displays the data images before and after being processed in the juxtaposed or superimposed fashion in which the directions indicating the ranges agree with each other. Thus, the change in the range of the data due to processing can be displayed visually.
- In the above aspect, the processor may be configured to determine the data processing method to be recommended for use based on at least one of the analysis target data and a history of the processing methods selected by a user; and cause the display device to display the determined data processing method.
- The display control device according to the above aspect determines the processing method to be recommended for use based on at least one of the data and the history of the processing methods selected by the user, and causes the display device to display the processing method. For example, a trained model is generated by performing machine learning based on past processing methods determined for the analysis target data, and the recommended processing method is determined by inputting data to be processed to the generated trained model. With the display control device, it is possible to propose a processing method suitable for the analysis target data.
- A display method to be performed by a computer according to a second aspect of the present invention includes causing a display device to display a data image indicating a visualized measurement range of analysis target data and a range image indicating a visualized analysis range of the analysis target data in a juxtaposed or superimposed fashion in which directions of the visualized measurement range and the visualized analysis range agree with each other; and performing a predetermined analysis in an analysis range.
- In the display method according to the second aspect of the present invention, the display device displays the data image and the analysis range of the data in the juxtaposed or superimposed fashion in which the directions indicating the ranges agree with each other. Thus, it is possible to visually display an excess or deficiency of the range of the analysis target data relative to the analysis range. Thus, a preprocessing method suitable for measurement data can be selected in response to a user's instruction.
- A display program according to a third aspect of the present invention causes a computer to perform a process of causing a display device to display a data image that indicating a visualized measurement range of analysis target data and a range image indicating a visualized analysis range of the analysis target data in a juxtaposed or superimposed fashion in which directions of the visualized measurement range and the visualized analysis range agree with each other; and performing a predetermined analysis in an analysis range.
- A display program to be executed by a computer according to the third aspect of the present invention causes the computer to perform a process including causing a display device to display to display the data image and the analysis range of the data in the juxtaposed or superimposed fashion in which the directions indicating the ranges agree with each other. Thus, it is possible to visually display an excess or deficiency of the range of the analysis target data relative to the analysis range. Thus, a preprocessing method suitable for measurement data can be selected in response to a user's instruction.
- According to the present invention, a preprocessing method suitable for pieces of measurement data can be selected in response to the user's instruction.
- Features, advantages, and technical and industrial significance of exemplary embodiments of the invention will be described below with reference to the accompanying drawings, in which like signs denote like elements, and wherein:
-
FIG. 1 is a block diagram showing the hardware configuration of a display system according to a first embodiment; -
FIG. 2 is a block diagram showing the configuration of a ROM according to the first embodiment; -
FIG. 3 is a block diagram showing the configuration of a storage according to the first embodiment; -
FIG. 4 is a block diagram showing the functional configuration of a CPU according to the first embodiment; -
FIG. 5 is a first diagram showing an outline of a check screen according to the first embodiment; -
FIG. 6 is a second diagram showing the outline of the check screen according to the first embodiment; -
FIG. 7 shows an outline of an instruction screen according to the first embodiment; -
FIG. 8 is a third diagram showing the outline of the check screen according to the first embodiment; -
FIG. 9 is a fourth diagram showing the outline of the check screen according to the first embodiment; -
FIG. 10 is a flowchart showing a flow of data processing according to the first embodiment; -
FIG. 11 is a block diagram showing the functional configuration of a CPU according to a modification of a second embodiment; -
FIG. 12 is a flowchart showing a flow of a determination process according to the modification of the second embodiment; and -
FIG. 13 shows an outline of a check screen according to the modification of the second embodiment. -
FIG. 1 shows adisplay system 10 of the present embodiment. Thedisplay system 10 of the present embodiment checks the ranges of pieces of measurement data serving as analysis target data, and processes the pieces of measurement data. - In the present embodiment, "processing" refers to data processing. Specifically, the "processing" includes extending, contracting, interpolating, and shifting data. The interpolation includes known interpolation methods such as linear interpolation and spline interpolation in addition to a method of interpolating data with a specified value.
- As shown in
FIG. 1 , thedisplay system 10 of the present embodiment includes acontrol device 20 serving as a display control device, aninformation processing device 22,measurement devices 24, and adisplay device 26. - The
control device 20 includes a central processing unit (CPU) 20A, a read only memory (ROM) 20B, a random access memory (RAM) 20C, astorage 20D, a communication interface (I/F) 20E, and an input/output I/F 20F. TheCPU 20A, theROM 20B, theRAM 20C, thestorage 20D, the communication I/F 20E, and the input/output I/F 20F are connected to communicate with each other via abus 20G. - The
CPU 20A is a central processing unit that executes various programs and controls each part. That is, theCPU 20A reads a program from theROM 20B or thestorage 20D, and executes the program using theRAM 20C as a working area. - The
ROM 20B stores various programs and various types of data. As shown inFIG. 2 , theROM 20B of the present embodiment stores adisplay program 100 and settingdata 110. Thedisplay program 100 and the settingdata 110 may be stored in thestorage 20D. - The
display program 100 causes thedisplay device 26 to display measurement data to be processed, and also performs data processing described later. - The setting
data 110 is referenced when processing measurement data described later. Specifically, the settingdata 110 stores setting values such as an analysis range necessary for processing instructions, whether to extend or contract the measurement data, a method for shifting the measurement data, and a method for interpolating the measurement data. - As shown in
FIG. 1 , theRAM 20C temporarily stores programs or data as a working area. - The
storage 20D is a hard disk drive (HDD) or a solid state drive (SSD), and stores various programs and various types of data. As shown inFIG. 3 , thestorage 20D of the present embodiment stores acquireddata 120, processeddata 130,history data 140 serving as a history of processing methods, and a trainedmodel 150. The acquireddata 120, the processeddata 130, thehistory data 140, and the trainedmodel 150 may be stored in theROM 20B. - The acquired
data 120 stores measurement data transferred from theinformation processing device 22, measurement data acquired from themeasurement device 24, etc. Specifically, the measurement data stored in the acquireddata 120 is waveform data, time series data, etc. The measurement data stored in the acquireddata 120 is, for example, analysis data obtained by X-ray diffraction (XRD) or an electrocardiogram. - The processed
data 130 stores measurement data obtained after processing the measurement data in the data processing described later. - The
history data 140 stores information on a history of processing methods selected by users for individual pieces of measurement data. Specifically, thehistory data 140 stores the type of excess or deficiency of a measurement range of measurement data relative to an analysis range, the proportion of each type of excess or deficiency in the measurement data, and a processing method specified by a user. The type of excess or deficiency includes excess or deficiency of the measurement range of the measurement data relative to the analysis range, and a direction of the excess or deficiency of the data (e.g., right or left when a data range is plotted on the horizontal axis). - The trained
model 150 is trained based on thehistory data 140. Specifically, the trainedmodel 150 is a trained model that has undergone machine learning using, as training data, the history of processing methods for the individual pieces of measurement data acquired by anacquisition unit 240 described later. For example, when information including a measurement range of measurement data and an analysis range is input, the trainedmodel 150 outputs a recommended processing method for the measurement data. - As shown in
FIG. 1 , the communication I/F 20E is an interface for communicating with external devices. Specifically, the communication I/F 20E of the present embodiment communicates with theinformation processing device 22 and a plurality ofmeasurement devices 24. - The
information processing device 22 communicates bidirectionally with thecontrol device 20. In response to a request from thecontrol device 20, theinformation processing device 22 of the present embodiment transmits, to thecontrol device 20, measurement data acquired from themeasurement device 24 that communicates with theinformation processing device 22. - The input/output I/
F 20F is an interface for connecting to an input/output device. Specifically, the input/output I/F 20F of the present embodiment is connected to thedisplay device 26. Thedisplay device 26 may be connected directly to thebus 20G. - As shown in
FIG. 4 , thecontrol device 20 of the present embodiment functions as adisplay control unit 200, areception unit 210, ananalysis unit 220, aprocessing unit 230, and theacquisition unit 240 by theCPU 20A executing thedisplay program 100. - The
display control unit 200 has a function of displaying images and screens related to the processing of measurement data. Specifically, thedisplay control unit 200 causes thedisplay device 26 to display images and screens related to the processing of measurement data. Thedisplay control unit 200 displays, for example, ameasurement image 300 as a data image indicating a visualized measurement range of the measurement data, arange image 310 indicating a visualized analysis range, and acheck screen 400 for checking themeasurement image 300 and the range image 310 (seeFIG. 5 ). Thedisplay control unit 200 also displays an instruction screen 500 (seeFIG. 7 ) for a processing method for the measurement data, a measurement image 301 (seeFIG. 8 ) showing the measurement data before processing, and a processed image 302 (seeFIG. 8 ) showing the measurement data after processing. - The
display control unit 200 of the present embodiment displays themeasurement image 300 and therange image 310 in a juxtaposed or superimposed fashion so that the directions indicating the ranges agree with each other. Thedisplay control unit 200 displays thecheck screen 400 and theinstruction screen 500 in a juxtaposed or superimposed fashion. Thedisplay control unit 200 displays themeasurement image 301 and the processedimage 302 in a juxtaposed or superimposed fashion so that the directions indicating the ranges agree with each other. The description "the directions indicating the ranges agree with each other" means that the directions of extension and contraction of the images that change depending on values, that is, the axis directions of values indicating the measurement data or the analysis range (see "reference axis 406" described later), agree with each other. In the present embodiment, themeasurement image 300 and therange image 310 as well as themeasurement image 301 and processedimage 302 displayed on thecheck screen 400 are extended or contracted in the same direction. In thecheck screen 400 of the present embodiment, the lateral direction is the "direction indicating the range" (seeFIGS. 5 ,6 ,8 , and9 ). - The
reception unit 210 has a function of receiving an analysis range. Thereception unit 210 receives, for example, an analysis range input by a user. - The
reception unit 210 also has a function of receiving processing instructions. Specifically, thereception unit 210 receives setting values of a processing method determined on theinstruction screen 500. For example, thereception unit 210 receives setting values of whether to extend or contract the measurement data, a method for shifting the measurement data, and a method for interpolating the measurement data. - The analysis range and the processing instructions received by the
reception unit 210 are applied to the settingdata 110 in theROM 20B and reflected in thehistory data 140 in thestorage 20D. - The
analysis unit 220 analyzes whether the measurement range of the measurement data is excessive or insufficient relative to the analysis range. Specifically, theanalysis unit 220 analyzes excess or deficiency of the measurement range of the measurement data relative to the analysis range, and a direction of the excess or deficiency of the data. - The
analysis unit 220 analyzes the proportion of the excess or deficiency of the measurement range of the measurement data relative to the analysis range. Specifically, theanalysis unit 220 analyzes the proportion of the excess or deficiency of the measurement range of the measurement data relative to the analysis range to the entire measurement range of the measurement data before processing. - The
analysis unit 220 reflects the analyzed information in thehistory data 140. - The
processing unit 230 has a function of processing the measurement data. As the data processing, theprocessing unit 230 of the present embodiment processes the measurement data based on a processing instruction received by thereception unit 210. Theprocessing unit 230 reflects the processeddata 130 obtained after processing the measurement data in thestorage 20D. - The
acquisition unit 240 has a function of acquiring the measurement data. Specifically, theacquisition unit 240 acquires the measurement data from theinformation processing device 22 or themeasurement device 24. Theacquisition unit 240 reflects the acquired measurement data in the acquireddata 120 in thestorage 20D. Theacquisition unit 240 acquires all the pieces of measurement data to be analyzed from the acquireddata 120 in thestorage 20D at the start of the data processing described later. - Transition of screens during the data processing described later that is executed by the
control device 20 of the present embodiment will be described with reference toFIGS. 5 to 9 . The screens inFIGS. 5 to 9 are displayed on thedisplay device 26. - When the data processing is started, all the pieces of measurement data to be analyzed are acquired, and the analysis range is received in the
control device 20, theCPU 20A displays thecheck screen 400 as shown inFIG. 5 . Thecheck screen 400 is a screen for checking the measurement ranges of the pieces of measurement data to be analyzed. Thecheck screen 400 of the present embodiment includes aname field 401 including file names for identifying the pieces of measurement data and checkboxes 405 for selecting files, arange field 402 showing ranges of measurement of the pieces of measurement data, astatus field 403 showing statuses as to whether processing is necessary for the pieces of measurement data, and ameasurement image field 404 showing a plurality ofmeasurement images 300. - An example of the
check screen 400 shown inFIG. 5 will be described below. In the present embodiment, the analysis range is described as "8 to 90". - In the
name field 401, file names "data_001.csv", "data_002.csv", "data_003.csv", "data_004.csv", "data_005.csv", and "data_006.csv" are displayed vertically. Thecheck boxes 405 are displayed at the left of the file names. All thecheck boxes 405 inFIG. 5 are displayed with check marks, which means that all the files are selected for processing. - In the
range field 402, numerical values "1 to 100" corresponding to the measurement range of the measurement data in the file "data_001.csv" are displayed in a row indicating that file. In therange field 402, "10 to 109" corresponding to "data_002.csv", "-10 to 89" corresponding to "data_003.csv", "-15 to 84" corresponding to "data_004.csv", "15 to 114" corresponding to "data_005.csv", and "5 to 104" corresponding to "data_006.csv" are similarly displayed in rows indicating these files. - In the
measurement image field 404, thereference axis 406 indicating a reference of the measurement range, a plurality ofmeasurement images 300A, therange image 310, andposition images 407 showing the positions of upper and lower limits of the analysis range are displayed. Thereference axis 406 is a straight line indicating the axis of values represented by themeasurement images 300A and therange image 310, and extends at the upper part of themeasurement image field 404 along an extension and contraction direction of themeasurement images 300A and therange image 310. In the present embodiment, thereference axis 406 is displayed as the horizontal axis in themeasurement image field 404. Numerical values (-20, 0, 20, 40, 60, 80, 100) indicating values of the measurement range are displayed at equal intervals along thereference axis 406. The numerical values vary depending on the physical quantity, ratio, proportion, etc. of the measurement data. Themeasurement image 300A is ameasurement image 300 showing the measurement data in each file with its measurement range displayed in the form of a horizontal rectangle. The extension and contraction directions of themeasurement images 300A are displayed in the rows indicating the files to agree with the direction of thereference axis 406. Therange image 310 is a rectangular image showing the analysis range, and is transparently superimposed on themeasurement images 300A. The extension and contraction direction of therange image 310 agrees with the direction of thereference axis 406. Theposition image 407 is displayed as an image of an inverted triangle on thereference axis 406. Theposition images 407 are displayed at the positions corresponding to the upper and lower limits of the range shown by therange image 310. - The
range image 310 may be juxtaposed to themeasurement images 300A as a bar-shaped figure having a length corresponding to the analysis range or as a figure having arrows at both ends and having a length corresponding to the analysis range. Therange image 310 may be displayed as straight lines or dashed lines extending vertically downward from the positions of the upper and lower limits of the analysis range on thereference axis 406 indicating the reference of the measurement range. Therange image 310 may be transparently superimposed on themeasurement images 300A as an image that fills in the areas outside the analysis range. - Although nothing is displayed in the
status field 403 inFIG. 5 , description will be given in conjunction withFIG. 6 . - As shown in
FIG. 6 , theCPU 20A causes thecheck screen 400 to display an indication as to whether the measurement range of the measurement data is insufficient relative to the analysis range. Differences fromFIG. 5 will be described below. The other configuration is the same as that inFIG. 5 , and detailed description thereof will be omitted. - When the measurement range of the measurement data is insufficient relative to the analysis range, a mark indicating the need to process the measurement data is displayed in the row indicating the target file in the
status field 403 inFIG. 6 . In each of the files "data_002.csv" to "data_005.csv", the measurement range is insufficient relative to the analysis range of 8 to 90. Therefore, the mark indicating the need to process the measurement data is displayed. - When the measurement range of the measurement data is sufficient relative to the analysis range, a highlight is displayed in the
measurement image field 404. For example, the highlight is displayed as a blue image at a portion of themeasurement image 300A that overlaps the analysis range. - As shown in
FIG. 7 , when the measurement range of the measurement data is excessive or insufficient relative to the analysis range, theCPU 20A displays theinstruction screen 500 as a setting screen. Theinstruction screen 500 is a screen for instruction on a processing method for the measurement data. Theinstruction screen 500 of the present embodiment includes aninstruction field 501 for inputting an instruction on a processing method, and ameasurement image field 502 showing ameasurement image 300B. Themeasurement image 300B is ameasurement image 300 showing the measurement data in the form of a graph (X-axis: measurement range, Y-axis: measurement value). Theinstruction screen 500 is superimposed on thecheck screen 400 in the form of a dialog window. Theinstruction screen 500 need not essentially be superimposed on thecheck screen 400, and the dialog window showing theinstruction screen 500 may be moved to display theinstruction screen 500 and thecheck screen 400 without an overlap. - An example of the
instruction screen 500 shown inFIG. 7 will be described below. Theinstruction screen 500 described below is displayed when processing the measurement data in the file "data_001.csv". - As shown in
FIG. 7 , the number of pieces of measurement data in the processing target file with a check mark in thecheck box 405 and numerical values indicating the analysis range are displayed in the upper left area of theinstruction screen 500. Specifically, the number of pieces of measurement data to be processed is "6" and the analysis range is "8 to 90". - In the
instruction field 501, a check box for determining whether to extend or contract the measurement data, an input field for inputting a method for shifting the measurement data, and an input field for inputting a value to be used for data interpolation in the measurement data are displayed. The input field for inputting a method for shifting the measurement data includes a pull-down menu for selecting "right" or "left" indicating the direction of the X-axis that is the direction of the analysis range shown by therange image 310, and an input field for inputting a value on the X-axis. The input field for interpolation of the measurement data includes an input field for inputting any measurement value that fills in a missing part of the data at the left end, and an input field for inputting any measurement value that fills in a missing part of the data at the right end. - In the
measurement image field 502, themeasurement image 300B showing the measurement data in the file "data_001.csv" and therange image 310 are displayed. Therange image 310 is transparently superimposed on themeasurement image 300B. Themeasurement image 300B may be displayed while being changed to an image showing the processed measurement data (so-called preview display) in accordance with the input processing instruction. - A
cancellation button 503 and aconfirmation button 504 are provided in the upper right area of theinstruction screen 500. The user can cancel the processing instruction by clicking thecancellation button 503. The user can confirm the processing instruction by clicking theconfirmation button 504. - When the user clicks the
confirmation button 504, theCPU 20A receives the processing instruction. Thus, the measurement data in the file "data_001.csv" is processed in accordance with the input instruction. Next, theCPU 20A refreshes theinstruction screen 500 based on the measurement data in the file "data_002.csv", and receives a processing instruction. That is, theCPU 20A sequentially refreshes theinstruction screen 500 for the pieces of measurement data in all the files with check marks in thecheck boxes 405, and receives processing instructions. - After the
CPU 20A receives the processing instructions for the pieces of measurement data in all the files with check marks in thecheck boxes 405, theCPU 20A erases theinstruction screen 500 and displays thecheck screen 400 updated based on the pieces of processed measurement data. When there is a file in which the analysis range does not agree with the measurement range of the processed measurement data, theCPU 20A displays thecheck screen 400 as shown inFIG. 8 . - An example of the
check screen 400 shown inFIG. 8 will be described below. Differences fromFIG. 6 will be described below. The other configuration is the same as that inFIG. 6 , and detailed description thereof will be omitted. - In the
range field 402 inFIG. 8 , the measurement ranges of the pieces of processed measurement data are displayed. In therange field 402, numerical values "8 to 90" corresponding to the measurement range of the processed measurement data in the file "data_001.csv" are displayed in the row indicating that file. In therange field 402, "17 to 84" corresponding to "data_002.csv" and "data_004.csv" and "8 to 90" corresponding to "data_003.csv", "data_005.csv", and "data_006.csv" are similarly displayed in the rows indicating these files. - In each of the files "data_002.csv" and "data_005.csv", the measurement range is insufficient relative to the analysis range. Therefore, the mark indicating the need to process the measurement data is displayed in the
status field 403. - In the
measurement image field 404, themeasurement images 301 showing the measurement ranges of the pieces of measurement data before processing, the processedimages 302 showing the measurement ranges of the pieces of measurement data after processing, and therange image 310 are displayed. Themeasurement image 301 corresponds to themeasurement image 300A represented by a dashed line. The processedimage 302 is superimposed on themeasurement image 301. The processedimages 302 include a processedimage 302A showing a case where the measurement range after processing agrees with the analysis range, and a processedimage 302B showing a case where the measurement range after processing does not agree with the analysis range. The processedimage 302A is a blue image, and the processedimage 302B is a dark gray image. - Since the measurement ranges of the pieces of measurement data are insufficient relative to the analysis range, the
CPU 20A displays theinstruction screen 500 again. Theinstruction screen 500 may be displayed only for the files in which the analysis range does not agree with the measurement ranges. - When the processing instructions are received and the analysis range agrees with the measurement ranges of all the pieces of measurement data, the
CPU 20A displays thecheck screen 400 as shown inFIG. 9 . - An example of the
check screen 400 shown inFIG. 9 will be described below. Differences fromFIG. 8 will be described below. The other configuration is the same as that inFIG. 8 , and detailed description thereof will be omitted. - In the
range field 402, "8 to 90" indicating the range of the processed measurement data in each file is displayed. This range agrees with the analysis range. - Since there is no excess or deficiency of the measurement ranges of all the pieces of measurement data relative to the analysis range, the mark indicating the need to process the measurement data is not displayed in the
status field 403. A mark indicating that the measurement range agrees with the analysis range may be displayed. - The
CPU 20A ends the screen transition in the data processing described later. Then, theCPU 20A performs a predetermined analysis based on the processeddata 130 including the pieces of measurement data after processing. TheCPU 20A learns the processing instructions from the user. -
FIG. 10 is a flowchart showing a flow of the data processing for the measurement data according to the present embodiment. The process in thecontrol device 20 is implemented by theCPU 20A functioning as thedisplay control unit 200, thereception unit 210, theanalysis unit 220, theprocessing unit 230, and theacquisition unit 240. - In
step S 100 ofFIG. 10 , theCPU 20A acquires all pieces of measurement data to be analyzed. For example, theCPU 20A acquires all the pieces of measurement data to be analyzed from the acquireddata 120 stored in thestorage 20D. - In
step S 101, theCPU 20A receives an analysis range. For example, theCPU 20A receives a range "8 to 90" input by a user. - In step S102, the
CPU 20A analyzes whether the measurement range of each piece of measurement data is excessive or insufficient relative to the analysis range. Specifically, theCPU 20A analyzes whether the measurement range of each piece of measurement data is excessive or insufficient relative to the analysis range, the direction of the excess or deficiency of the data, and the proportion of the excess or deficiency. - In step S103, the
CPU 20A superimposes an image showing the analysis range on a plurality of images showing the measurement ranges. Specifically, theCPU 20A synthesizes therange image 310 on themeasurement images 300A (seeFIGS. 5 and6 ). - In step S104, the
CPU 20A determines whether there is an excess or deficiency of the measurement ranges relative to the analysis range. When theCPU 20A determines that there is an excess or deficiency (S104: YES), theCPU 20A proceeds to step S105. When theCPU 20A determines that there is no excess or deficiency (S104: NO), theCPU 20A proceeds to step S109. - In step S105, the
CPU 20A displays theinstruction screen 500 for processing the excessive or insufficient measurement data. Specifically, theCPU 20A superimposes theinstruction screen 500 on the check screen 400 (seeFIG. 7 ). For example, theCPU 20A displays theinstruction screen 500 as a dialog window. - In step S106, the
CPU 20A receives a processing instruction. Specifically, theCPU 20A receives data input by the user in theinstruction field 501 of theinstruction screen 500. TheCPU 20A applies the received processing instruction to the settingdata 110 in theROM 20B and reflects the processing instruction in thehistory data 140 in thestorage 20D. - In step S107, the
CPU 20A processes the measurement data in accordance with details of the instruction. Specifically, theCPU 20A processes the measurement data in the file with a check mark in thecheck box 405 in accordance with the processing instruction received in step S106. TheCPU 20A stores the processed measurement data in the processeddata 130 in thestorage 20D. - In step S108, the
CPU 20A superimposes an image showing the measurement range after processing on the image showing the measurement range before processing. Specifically, theCPU 20A superimposes the processedimage 302 on the measurement image 301 (seeFIG. 8 ). TheCPU 20A returns to step S102. - In step S109, the
CPU 20A performs a predetermined analysis. Specifically, theCPU 20A performs the predetermined analysis using the processeddata 130 in which the analysis range agrees with the measurement ranges of the pieces of measurement data. - In step S110, the
CPU 20A determines whether a processing instruction has been received. Specifically, theCPU 20A determines whether a processing instruction has been received in step S106. When theCPU 20A determines that a processing instruction has been received (step S110: YES), theCPU 20A proceeds to step S111. When theCPU 20A determines that no processing instruction has been received (step S110: NO), theCPU 20A ends the data processing. - In step S111, the
CPU 20A learns the processing instruction. Specifically, theCPU 20A retrains the trainedmodel 150 using the processing instruction received from the user. For example, theCPU 20A retrains the trainedmodel 150 using thehistory data 140 in which the processing instruction is reflected. TheCPU 20A ends the data processing. - In the
control device 20 of the present embodiment, when theacquisition unit 240 acquires all the pieces of measurement data to be analyzed and thereception unit 210 receives the analysis range, thedisplay control unit 200 displays themeasurement images 300 and therange image 310 in a superimposed fashion so that the directions indicating the ranges agree with each other. Thedisplay control unit 200 may display a plurality ofmeasurement images 300 and therange image 310 in a superimposed fashion. Theanalysis unit 220 analyzes whether the measurement range is excessive or insufficient relative to the analysis range. When there is an excess or deficiency, thedisplay control unit 200 superimposes theinstruction screen 500 for instruction on processing of the measurement data on thecheck screen 400 as a dialog window. When theprocessing unit 230 processes the measurement data in accordance with a processing instruction, thedisplay control unit 200 displays themeasurement image 301 showing the measurement range before processing and the processedimage 302 showing the measurement range after processing in a superimposed fashion so that the directions showing the ranges agree with each other. - As described above, the
control device 20 of the present embodiment causes thedisplay device 26 to display themeasurement image 300 and therange image 310 in a juxtaposed or superimposed fashion so that the directions indicating the ranges agree with each other. Thus, it is possible to visually display an excess or deficiency of the range of the measurement data to be analyzed relative to the analysis range. Accordingly, a processing method suitable for the measurement data can be selected in response to the user's instruction. Thedisplay device 26 displays a plurality ofmeasurement images 300 and therange image 310 in a juxtaposed or superimposed fashion so that the directions indicating the ranges agree with each other. Thus, it is possible to visually display a list of excesses or deficiencies of the ranges of the pieces of measurement data to be analyzed relative to the analysis range. Thedisplay device 26 further displays, in a juxtaposed or superimposed fashion, theinstruction screen 500 for a data processing method that causes the measurement range of the measurement data to agree with the analysis range. Thus, the measurement data processing method can be set while checking themeasurement image 300 and therange image 310. Thedisplay device 26 further displays themeasurement image 301 and the processedimage 302 in a juxtaposed or superimposed fashion so that the directions indicating the ranges agree with each other. Thus, the change in the range of the measurement data due to processing can be displayed visually. - The
control device 20 of the present embodiment displays the measurement data measured by themeasurement device 24 and performs data processing as necessary. However, the present invention is not limited to this, and thecontrol device 20 may display data having a range even if it is not measured data, and may process the data as necessary. Examples of the data having a range include price data, evaluation data, and statistical data. These pieces of data may be acquired by being transmitted from theinformation processing device 22, an external server (not shown), etc. - The processing method in the
control device 20 of the present embodiment is not limited to the method described in the above embodiment. Examples of the processing method include a processing method in which data in a range exceeding the analysis range is deleted from the measurement range of the measurement data, and a processing method in which the data in the excessive range is moved to an insufficient range. The data interpolation includes not only filling in missing parts of the data at the right and left ends, but also filling in a missing part in the middle of the data. - The
control device 20 of the present embodiment displays the mark indicating the need to process the measurement data when the measurement range of the measurement data is insufficient relative to the analysis range (seeFIG. 6 ). However, the present invention is not limited to this, and thecontrol device 20 may display the mark indicating the need to process the measurement data when the measurement range of the measurement data is excessive relative to the analysis range. - The
control device 20 of the present embodiment highlights the portion of themeasurement image 300A that overlaps the analysis range when the measurement range of the measurement data is sufficient relative to the analysis range (seeFIG. 6 ). However, the present invention is not limited to this, and thecontrol device 20 may highlight themeasurement image 300A when the measurement range of the measurement data agrees with the analysis range. - The
control device 20 of the present embodiment issues processing instructions individually for the pieces of measurement data to be processed (seeFIG. 7 ). However, the present invention is not limited to this, and thecontrol device 20 may issue a processing instruction collectively for all the pieces of measurement data to be processed. - The
control device 20 of the present embodiment retrains the trainedmodel 150 using thehistory data 140 stored in thestorage 20D. However, the present invention is not limited to this, and a trained model that has been trained by online learning may be retrained using the processing instruction received in step S106 (seeFIG. 10 ). The online learning refers to sequentially retraining and improving a trained model using new training data alone. The retraining device is not limited to thecontrol device 20, but an external device such as theinformation processing device 22 may be used. - The trained
model 150 of the present embodiment outputs a processing method for the measurement data when information including the measurement range of the measurement data and the analysis range is input. However, the present invention is not limited to this, and the information input to the trainedmodel 150 may include, for example, information on the category, purpose, frequency of occurrence, evaluation, or reliability of the measurement data. - As shown in
FIG. 1 , thedisplay system 10 of the present embodiment includes oneinformation processing device 22, onemeasurement device 24 that communicates with theinformation processing device 22, and onedisplay device 26, but the present invention is not limited to this. Thedisplay system 10 may include a plurality ofinformation processing devices 22, a plurality ofmeasurement devices 24, and a plurality ofdisplay devices 26. Twomeasurement devices 24 that communicate with the communication I/F 20E are illustrated, but the present invention is not limited to this. Three ormore measurement devices 24 may be provided. - In the
check screen 400 of the present embodiment, thecheck box 405 with a check mark indicates that the item is selected as a processing target (seeFIG. 5 ). However, the present invention is not limited to this, and thecheck box 405 with a check mark may indicate that the item is selected as an analysis target. - The
control device 20 of the present embodiment performs analysis using the processeddata 130 including the measurement data after processing. However, the present invention is not limited to this, and thecontrol device 20 may perform analysis using unprocessed measurement data when the analysis range and the measurement range of the measurement data agree with each other from the beginning. - The
control device 20 of the present embodiment displays a plurality ofmeasurement images 300A arranged vertically, and superimposes therange image 310 on themeasurement images 300A (seeFIG. 5 ). Thecontrol device 20 superimposes theinstruction screen 500 on thecheck screen 400 in the form of a dialog window, and superimposes therange image 310 on themeasurement image 300B (seeFIG. 7 ). Thecontrol device 20 displays a plurality ofmeasurement images 301 arranged vertically, superimposes the processedimages 302 on themeasurement images 301, and superimposes therange image 310 on the measurement images 301 (seeFIG. 8 ). However, the display method is not limited to these methods. With thereference axis 406 set along the up-down direction, thecontrol device 20 may display the above images or screens side by side. Thecontrol device 20 may display the above images or screens in a superimposed fashion by synthesizing or popping up the images or screens. The display in a superimposed fashion includes not only constant display by synthesis, but also temporary display by pop-up. - A
control device 20 of a second embodiment differs from that of the first embodiment in that thecontrol device 20 presents a recommended processing method for the measurement data to be analyzed. Differences from the first embodiment will be described below. The other configuration is the same as that in the above embodiment, and detailed description thereof will be omitted. - As shown in
FIG. 11 , thecontrol device 20 of the present embodiment further includes adetermination unit 250 in addition to thedisplay control unit 200, thereception unit 210, theanalysis unit 220, theprocessing unit 230, and theacquisition unit 240 by theCPU 20A executing thedisplay program 100. - The
display control unit 200 of the present embodiment has a function of displaying theinstruction screen 500 in a state in which the setting values have been input. Specifically, thedisplay control unit 200 displays theinstruction screen 500 in a state in which the setting values of a processing method determined by thedetermination unit 250 described later have been input. - The
determination unit 250 has a function of determining a recommended processing method. Specifically, thedetermination unit 250 determines a processing method output from the trainedmodel 150 as the recommended processing method for the measurement data. -
FIG. 12 is a flowchart showing a flow of a determination process for determining a recommended processing method. The determination process is, for example, performed between steps S102 and S103 (seeFIG. 10 ). - In step S200 of
FIG. 12 , theCPU 20A acquires the types of excess or deficiency of the pieces of measurement data. Specifically, theCPU 20A acquires information obtained through the analysis in step S102 (seeFIG. 10 ) as to whether the measurement range of each piece of measurement data is excessive or insufficient relative to the analysis range, and about the direction of the excess or deficiency of the data. - In step S201, the
CPU 20A acquires the proportion of the excess or deficiency of each piece of measurement data. Specifically, theCPU 20A acquires information obtained through the analysis in step S102 (seeFIG. 10 ) about the proportion of the excess or deficiency of the measurement range of each piece of measurement data relative to the analysis range. - In step S202, the
CPU 20A inputs the acquired pieces of information and the analysis range to the trainedmodel 150. Specifically, theCPU 20A inputs the pieces of information acquired in steps S200 and S201 and the analysis range received in step S101 (seeFIG. 10 ) to the trainedmodel 150 stored in thestorage 20D. - In step S203, the
CPU 20A acquires a processing method output from the trainedmodel 150. Specifically, theCPU 20A acquires a processing method for each piece of measurement data. - In step S204, the
CPU 20A determines the acquired processing method as the processing method for the measurement data. Specifically, theCPU 20A determines each processing method acquired in step S203 as the recommended processing method for each piece of measurement data. TheCPU 20A ends the determination process. After the determination process has ended, theCPU 20A displays, in step S105 (seeFIG. 10 ), theinstruction screen 500 in a state in which the setting values of the determined processing method have been input. - As shown in
FIG. 13 , theCPU 20A displays theinstruction screen 500 according to the second embodiment in step S105 (seeFIG. 10 ). - An example of the
instruction screen 500 shown inFIG. 13 will be described below. Differences fromFIG. 7 will be described below. The other configuration is the same as that inFIG. 7 , and detailed description thereof will be omitted. - In the
instruction field 501, the setting values of the processing method determined in step S204 (seeFIG. 12 ) are displayed in an input state. That is, the recommended processing method has already been input. In the example ofFIG. 13 , a check mark is put in the check box as to whether to extend or contract the measurement data, alignment of the "left" end with "8" is input as the shift of the measurement data, and filling in both the right and left ends with "0" is input as the interpolation of the measurement data. White characters on a black background indicate the input state and do not show the actual display. - A
measurement image 300B showing the measurement data when the processing method determined in step S204 (seeFIG. 12 ) is applied is displayed in themeasurement image field 502. Ameasurement image 300B before the processing method is applied may be displayed. - The
control device 20 of the second embodiment determines a processing method to be recommended for use based on the measurement data to be analyzed and the trainedmodel 150 trained from thehistory data 140. Thecontrol device 20 causes thedisplay device 26 to display the determined processing method in a state in which the processing method has been input to theinstruction screen 500. - As described above, the
control device 20 of the second embodiment determines the processing method to be recommended for use based on the measurement data and thehistory data 140, and causes thedisplay device 26 to display the processing method. Thus, it is possible to display the processing method suitable for the measurement data to be analyzed. - In the
control device 20 of the second embodiment, the trainedmodel 150 is trained by thecontrol device 20. However, the present invention is not limited to this, and the trainedmodel 150 may be trained by an external device (e.g., the information processing device 22) connected to thecontrol device 20. When the trainedmodel 150 is trained by theinformation processing device 22, theinformation processing device 22 acquires thehistory data 140 from thecontrol device 20 and trains the trainedmodel 150 based on thehistory data 140. Theinformation processing device 22 provides the trainedmodel 150 to thecontrol device 20. The providing method may be a method of transmitting the trainedmodel 150 itself to thecontrol device 20, or a method of storing the trainedmodel 150 in theinformation processing device 22 and transmitting only the output result of the trainedmodel 150 to thecontrol device 20. - In the
control device 20 of the second embodiment, a processing method output by inputting information including the measurement data and the analysis range to the trainedmodel 150 is presented to the user. However, the present invention is not limited to this, and thecontrol device 20 may refer to thehistory data 140 and present, to the user, a frequently selected processing method, a previously set processing method, etc. as the recommended processing method. That is, thecontrol device 20 determines the processing method to be recommended for use based on the trainedmodel 150 trained from thehistory data 140 without using the measurement data to be analyzed. - The
control device 20 of the second embodiment determines the recommended processing method for each piece of measurement data. However, the present invention is not limited to this, and thecontrol device 20 may determine a recommended processing method for collectively processing all the pieces of measurement data. Examples of the recommended processing method for collectively processing all the pieces of measurement data include a method of selecting a processing method with the highest commonality from among the processing methods recommended for the individual pieces of measurement data, and a method of determining a processing method based on the history of processing methods used when collectively processing the pieces of data. - Various processes performed by the
CPU 20A reading and executing software (programs) in each of the above embodiments may be performed by various processors other than the CPU. Examples of the processors in this case include a programmable logic device (PLD) such as a field-programmable gate array (FPGA) having a circuit configuration that can be changed after manufacture, and a dedicated electric circuit such as an application specific integrated circuit (ASIC) that is a processor having a circuit configuration designed exclusively to perform a specific process. The above processes may be performed by one of the various processors or by a combination of two or more processors of the same or different types (e.g., a plurality of FPGAs or a combination of a CPU and an FPGA). More specifically, each of the hardware structures of the various processors is an electric circuit that combines circuit elements such as semiconductor elements. - In each of the above embodiments, the programs have been described as being stored (installed) in advance in a non-transitory computer-readable recording medium. For example, the
display program 100 in thecontrol device 20 is stored in advance in theROM 20B. However, the present invention is not limited to this, and each program may be provided by being recorded on a non-transitory recording medium such as a compact disc read only memory (CD-ROM), a digital versatile disc read only memory (DVD-ROM), or a universal serial bus (USB) memory. The program may be downloaded from an external device via a network. - The process flow described in each of the above embodiments is also one example, and unnecessary steps may be omitted, new steps may be added, or the process order may be changed without departing from the spirit of the invention.
Claims (7)
- A display control device (20) comprising a processor (20A) configured to:cause a display device (26) to display a data image (300) indicating a visualized measurement range of analysis target data (120) and a range image (310) indicating a visualized analysis range of the analysis target data (120) in a juxtaposed or superimposed fashion in which directions of the visualized measurement range and the visualized analysis range agree with each other; andperform a predetermined analysis in an analysis range.
- The display control device (20) according to claim 1, wherein the processor (20A) is configured to cause the display device (26) to display a plurality of the data images (300) and the range image (310) in the juxtaposed or superimposed fashion in which the directions of the visualized measurement ranges and the visualized analysis range agree with each other.
- The display control device (20) according to claim 1 or 2, wherein the processor (20A) is configured to cause the display device (26) to further display a setting screen (500) for a data processing method in the juxtaposed or superimposed fashion, the data processing method being method of causing the visualized measurement range to agree with the visualized analysis range (310).
- The display control device (20) according to claim 3, wherein the processor (20A) is configured to cause the display device (26) to display the data image (300) before being processed by the data processing method and the data image (302) after being processed by the data processing method in the juxtaposed or superimposed fashion in which the direction of the visualized measurement range of the data image (300) before being processed by the data processing method and the direction of the visualized measurement range of the data image (302) after being processed by the data processing method agree with each other.
- The display control device (20) according to claim 3, wherein the processor (20A) is configured to:determine the data processing method to be recommended for use based on at least one of the analysis target data (120) and a history of the processing methods selected by a user; andcause the display device (26) to display the determined data processing method.
- A display method to be performed by a computer, the display method comprising:causing a display device to display a data image (300) indicating a visualized measurement range of analysis target data (120) and a range image (310) indicating a visualized analysis range of the analysis target data (120) in a juxtaposed or superimposed fashion in which directions of the visualized measurement range and the visualized analysis range agree with each other; andperforming a predetermined analysis in an analysis range.
- A display program (100) to be executed by a computer, the display program (100) causing the computer to perform a process comprising:causing a display device (26) to display a data image (300) that indicating a visualized measurement range of analysis target data (120) and a range image (310) indicating a visualized analysis range of the analysis target data (120) in a juxtaposed or superimposed fashion in which directions of the visualized measurement range and the visualized analysis range agree with each other; andperforming a predetermined analysis in an analysis range.
Applications Claiming Priority (1)
| Application Number | Priority Date | Filing Date | Title |
|---|---|---|---|
| JP2023199395A JP2025085487A (en) | 2023-11-24 | 2023-11-24 | Display control device, display method, and display program |
Publications (1)
| Publication Number | Publication Date |
|---|---|
| EP4560579A1 true EP4560579A1 (en) | 2025-05-28 |
Family
ID=93520681
Family Applications (1)
| Application Number | Title | Priority Date | Filing Date |
|---|---|---|---|
| EP24212442.8A Pending EP4560579A1 (en) | 2023-11-24 | 2024-11-12 | Display control device, display method, and display program |
Country Status (4)
| Country | Link |
|---|---|
| US (1) | US20250173926A1 (en) |
| EP (1) | EP4560579A1 (en) |
| JP (1) | JP2025085487A (en) |
| CN (1) | CN120045098A (en) |
Citations (2)
| Publication number | Priority date | Publication date | Assignee | Title |
|---|---|---|---|---|
| US20140040009A1 (en) * | 2012-08-01 | 2014-02-06 | Microsoft Corporation | Providing and filtering keyword stacks |
| JP2020038514A (en) | 2018-09-05 | 2020-03-12 | キヤノン株式会社 | Learning data generating device, learning data generating method, and program |
Family Cites Families (5)
| Publication number | Priority date | Publication date | Assignee | Title |
|---|---|---|---|---|
| JP2001061075A (en) * | 1999-08-23 | 2001-03-06 | Canon Inc | Image processing method, apparatus and recording medium |
| JP2010128853A (en) * | 2008-11-28 | 2010-06-10 | Cores:Kk | Time-series data processing program |
| JP6171152B2 (en) * | 2012-05-28 | 2017-08-02 | ピーアンドダブリューソリューションズ株式会社 | Information processing apparatus, method, and program |
| JP7345282B2 (en) * | 2019-06-03 | 2023-09-15 | キヤノン株式会社 | Image processing device, image processing method and program |
| JP6701421B1 (en) * | 2019-08-28 | 2020-05-27 | 株式会社 日立産業制御ソリューションズ | Data three-dimensional visualization method, data three-dimensional visualization program, and data three-dimensional visualization system |
-
2023
- 2023-11-24 JP JP2023199395A patent/JP2025085487A/en active Pending
-
2024
- 2024-10-31 CN CN202411538391.2A patent/CN120045098A/en active Pending
- 2024-11-06 US US18/938,546 patent/US20250173926A1/en active Pending
- 2024-11-12 EP EP24212442.8A patent/EP4560579A1/en active Pending
Patent Citations (2)
| Publication number | Priority date | Publication date | Assignee | Title |
|---|---|---|---|---|
| US20140040009A1 (en) * | 2012-08-01 | 2014-02-06 | Microsoft Corporation | Providing and filtering keyword stacks |
| JP2020038514A (en) | 2018-09-05 | 2020-03-12 | キヤノン株式会社 | Learning data generating device, learning data generating method, and program |
Non-Patent Citations (2)
| Title |
|---|
| CELEBIC BOBAN ET AL: "Using Green KPIs for Large IT Infrastructures' Energy and Cost Optimization", 2015 3RD INTERNATIONAL CONFERENCE ON FUTURE INTERNET OF THINGS AND CLOUD, IEEE, 24 August 2015 (2015-08-24), pages 645 - 650, XP032798351, [retrieved on 20151019], DOI: 10.1109/FICLOUD.2015.86 * |
| USER MANUAL: "GNU Image Manipulation Program", 27 July 2011 (2011-07-27), XP055272608, Retrieved from the Internet <URL:https://web.archive.org/web/20120320235634/http://gimp.linux.it/www/meta/gimp-en.pdf> * |
Also Published As
| Publication number | Publication date |
|---|---|
| CN120045098A (en) | 2025-05-27 |
| JP2025085487A (en) | 2025-06-05 |
| US20250173926A1 (en) | 2025-05-29 |
Similar Documents
| Publication | Publication Date | Title |
|---|---|---|
| KR102422220B1 (en) | Data processing method, data processing device, and computer readable recording medium with data processing program recorded thereon | |
| KR101050813B1 (en) | Server devices and recording media | |
| US20200118364A1 (en) | Protocol conversion device and vehicle diagnostic system | |
| CN113065538A (en) | Pressure sensor detection method, device and equipment based on image recognition | |
| US20250060242A1 (en) | Systems and Methods for Determining a Weight Rating of a Transporter | |
| US11415602B2 (en) | Method for operating an oscilloscope as well as oscilloscope | |
| US10289474B2 (en) | Fixing system, server, terminal device, fixing method, and recording medium | |
| EP4560579A1 (en) | Display control device, display method, and display program | |
| EP1348969A2 (en) | Electronic test system | |
| US20210041859A1 (en) | Data processing device, data processing method and program | |
| US20240386755A1 (en) | Vehicle | |
| US10657626B2 (en) | Image processing apparatus, image processing system, and recording medium | |
| CN111971664B (en) | Learning processing device, data analysis device, analysis mode selection method, and analysis mode selection program | |
| US11514384B2 (en) | Productivity improvement support system and productivity improvement support method | |
| US20220107299A1 (en) | Information processing apparatus for visualizing collected data by graph, control method thereof, and storage medium | |
| JP7069076B2 (en) | Information processing equipment, information processing systems, and programs | |
| WO2022215446A1 (en) | Image determination device, image determination method, and program | |
| JP5597166B2 (en) | Plant monitoring device | |
| JPH08190575A (en) | Inspection teaching apparatus and method | |
| JP6485882B2 (en) | Work equipment system | |
| JP7172919B2 (en) | Process control system and process control method | |
| CN114067984B (en) | Precision management assistance method, system, device and storage medium containing corresponding program | |
| US11537117B2 (en) | Method for setting alarm levels for a machine | |
| JPH11212630A (en) | Plant data analyzer | |
| JP3690858B2 (en) | Displaying measurement data |
Legal Events
| Date | Code | Title | Description |
|---|---|---|---|
| PUAI | Public reference made under article 153(3) epc to a published international application that has entered the european phase |
Free format text: ORIGINAL CODE: 0009012 |
|
| STAA | Information on the status of an ep patent application or granted ep patent |
Free format text: STATUS: REQUEST FOR EXAMINATION WAS MADE |
|
| 17P | Request for examination filed |
Effective date: 20241126 |
|
| AK | Designated contracting states |
Kind code of ref document: A1 Designated state(s): AL AT BE BG CH CY CZ DE DK EE ES FI FR GB GR HR HU IE IS IT LI LT LU LV MC ME MK MT NL NO PL PT RO RS SE SI SK SM TR |