EP4550384A1 - Measurement device and mass spectrometer - Google Patents
Measurement device and mass spectrometer Download PDFInfo
- Publication number
- EP4550384A1 EP4550384A1 EP23830765.6A EP23830765A EP4550384A1 EP 4550384 A1 EP4550384 A1 EP 4550384A1 EP 23830765 A EP23830765 A EP 23830765A EP 4550384 A1 EP4550384 A1 EP 4550384A1
- Authority
- EP
- European Patent Office
- Prior art keywords
- noise
- measurement
- analysis result
- measurement device
- memory resource
- Prior art date
- Legal status (The legal status is an assumption and is not a legal conclusion. Google has not performed a legal analysis and makes no representation as to the accuracy of the status listed.)
- Pending
Links
Images




Classifications
-
- H—ELECTRICITY
- H01—ELECTRIC ELEMENTS
- H01J—ELECTRIC DISCHARGE TUBES OR DISCHARGE LAMPS
- H01J49/00—Particle spectrometers or separator tubes
- H01J49/0027—Methods for using particle spectrometers
- H01J49/0036—Step by step routines describing the handling of the data generated during a measurement
Definitions
- the present invention relates to a measurement device and a mass spectrometer.
- measurement devices such as a mass spectrometer are used in various life sciences.
- a mass spectrometer that detects a measurement signal output from a measurement unit and performs component analysis on a sample is indispensable for drug discovery and drug testing in medical and pharmaceutical fields.
- PTL 1 is a related art in the present technical field.
- PTL discloses a unit for improving discrimination between a signal waveform and noise by preventing a waveform of a detection signal for an ion species of the same m/z from having a shape in which a plurality of peaks are connected due to the spread of the ion species having the same mass-to-charge ratio (m/z) during flight and a response time of a microchannel plate (MCP) in an ion analyzer.
- MCP microchannel plate
- PTL 1 discloses noise reduction for a specific noise, but does not disclose identifying a noise source among a plurality of noises.
- Noise that degrades an S/N ratio of the measurement unit includes, in addition to a detection signal of a sensor in the measurement unit other than the detection target, thermal noise at an environmental temperature, and the like, noise generated from another electrical device in the measurement device on which the measurement unit is mounted, and external noise entering from the outside of the measurement device.
- Examples of an electrical device in the measurement device that generates the noise include a switching power supply and a digital circuit.
- Examples of the external noise entering from the outside of the measurement device include other measurement device provided close to the measurement device, communication radio waves, and broadcast radio waves.
- the noise superimposed on the measurement unit from such a large number of noise sources changes according to an operating environment of the measurement device, and there are situations in which noise that deviates from an assumed noise component and an assumed noise amount is superimposed on the measurement unit, degrading the S/N ratio and making it difficult to perform normal measurement.
- noise that deviates from an assumed noise component and an assumed noise amount is superimposed on the measurement unit, degrading the S/N ratio and making it difficult to perform normal measurement.
- it is necessary to check one device location in which normal measurement is performed one by one, and it takes a lot of time to identify a defective location.
- the invention has been made to solve the above problem, and an object of the invention is to make it possible to estimate a range of an abnormal portion that is a noise source of noise superimposed on a detection signal of a measurement device.
- One example of the invention is a measurement device including: a measurement unit configured to measure a measurement target and output a measurement signal; a detector configured to detect the measurement signal and output a detection signal; an analysis processing unit configured to calculate and output an analysis result from the detection signal; an analysis result display configured to display the analysis result; a device control module configured to control the measurement unit and output a control signal; and an abnormality detection module configured to detect noise in the measurement device.
- the abnormality detection module stores an enable interval of each of the components of the measurement device into a memory resource, and determines, for each of the components of the measurement device, whether the noise is mixed in based on the corresponding enable interval stored in the memory resource and the analysis result from the analysis processing unit.
- the invention by making it possible to estimate a range of an abnormal portion based on an analysis result, it is possible to shorten a time for identifying a defective location of the measurement device and to reduce a maintenance time.
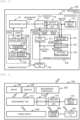
- FIG. 1 is a configuration block diagram of a measurement device according to the present embodiment.
- a measurement device 100 includes a device module 110 that measures a measurement target and displays a result, an abnormality detection module 120 that determines a noise source of noise flowing in during measurement of the measurement device, and a control PC 116.
- the device module 110 includes a measurement unit 111 that measures the measurement target and outputs a measurement signal, a device control module 112 that controls the measurement unit 111, a detector 113 that detects the measurement signal and outputs a detection signal, an analysis processing unit 114 that calculates and outputs an analysis result based on the detection signal, and an analysis result display 115 that displays the analysis result.
- the device control module 112 transmits a control signal to the measurement unit 111 by a control operation based on a communication signal of the control PC 116.
- the analysis result display 115 may be included in the control PC 116.
- the device control module 112 includes, for example, a power supply 204 that supplies power to components that are some or all of the units and modules constituting the measurement device 100, a driver 201 that drives the measurement unit 111, a measurement controller 203 that controls the driver 201, a monitor 202 that monitors an operation state of the measurement unit 111, and a communication device 205 that communicates with the control PC 116.
- a power supply 204 that supplies power to components that are some or all of the units and modules constituting the measurement device 100
- a driver 201 that drives the measurement unit 111
- a measurement controller 203 that controls the driver 201
- a monitor 202 that monitors an operation state of the measurement unit 111
- a communication device 205 that communicates with the control PC 116.
- the abnormality detection module 120 is software processing for achieving various functions by a CPU executing operation programs for achieving the various functions, and is shown as a functional block diagram in FIG. 1 .
- the abnormality detection module 120 includes a sync selector 121, a syn determination unit 122, a noise matcher 123, and a matching result display 124.
- the sync selector 121 has a memory resource described later that stores enable intervals, which are operating periods of some or all of the components in the measurement device 100, and outputs a detection control signal to the detector 113 at an operating period of the enable interval of the component designated by a selection signal input from the control PC 116.
- the syn determination unit 122 outputs a syn determination result from an analysis result and an analysis period signal output from the analysis processing unit 114.
- the noise matcher 123 outputs matching results which are noise sources estimated based on the syn determination result and the selection signal.
- the matching result display 124 displays the matching results from the noise matcher 123.
- the matching result display 124 may be included in the control PC 116.
- the noise superimposed on the analysis result is roughly classified into internal noise derived from components which are all units and modules included in the measurement device and external noise derived from outside of the measurement device.
- FIG. 2 is a diagram showing the noise source in the measurement device.
- the internal noise is, for example, noise transmitted from the 204 to the measurement unit 111 and noise transmitted from the communication device 205 to the detector 113.
- the external noise is, for example, a wireless portable device disposed in the vicinity of the measurement device 100.
- the transmission of the noise includes both conduction in which the noise is transmitted by flowing through a metal portion such as each module or a cover of the measurement device 100 and propagation in which a radio wave is transmitted within space.
- the measurement device 100 implements noise countermeasures so that each noise does not affect the analysis result. For example, it is possible to shield external noise by forming the cover of the measurement device 100 into an electromagnetic wave shielding structure, shield noise from each unit or module by accommodating the detector 113 in the electromagnetic wave shielding structure, and reduce power supply noise by inserting a ferrite core into a power supply cable connecting the power supply and each unit or module.
- effects of the noise countermeasures may be reduced or lost, and the noise may be superimposed on the analysis result. For example, this occurs at the time of replacement of a periodically replaceable component in maintenance or at the time of replacement of a failed module.
- the following work is performed, which is to open the cover of the measurement device, disconnect the various cables connected to a target module, remove the old module, install a new module, connect the various cables to the new module, and close the cover of the measurement device.
- the effect of the noise countermeasures is reduced or lost.
- FIG. 3 shows an example of an analysis result when the effect of the noise countermeasures is reduced or lost.
- an analysis result 301 indicates a normal analysis result
- an analysis result 302 indicates an analysis result when noise 303 having a periodic pulse shape is superimposed.
- the abnormality detection module 120 functions as a noise determination unit for displaying an estimated noise source on the matching result display 124.
- FIG. 4 is a diagram showing an operation principle of the sync selector 121 in the abnormality detection module 120 according to the present embodiment.
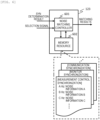
- the sync selector 121 includes a memory resource 401 and a detection control signal generator 402, and switches the detection control signal for controlling a detection timing of the detector 113 based on the selection signal input from the control PC 116.
- the memory resource 401 stores the enable intervals, that is, drive periods, of some or all of the components that are the units or the modules included in the measurement device 100. For example, it is an enable interval of the measurement controller 203, an enable interval of the monitor 202, and an enable interval of the communication device 205.
- the sync selector 121 enables the detector 113 to perform a detection operation in a period same as the components selected by the control PC 116.
- the detector 113 outputs the detection signal, which is a result obtained by detecting the measurement signal in synchronization with the detection control signal input from the sync selector 121, and a detection period signal, which is a detection control signal, to the analysis processing unit 114.
- the analysis processing unit 114 processes the input detection signal and outputs the analysis result to the analysis result display 115 and the syn determination unit 122.
- the input detection period signal is output to the syn determination unit 122 as the analysis period signal.
- An analysis result A is time series data of M points as in the following Formula (1).
- [Formula 1] A T 1 , T 2 , T 3 , ... , T M
- step S151 the time-series analysis result A is divided by the analysis period signal.
- N M/L
- the time series data obtained by dividing the analysis result into N based on the analysis period is expressed by the following Formula (2).
- a 1 T 1 , T 2 , T 3 , ... , T L
- a 2 T 1 + L , T 2 + L , T 3 + L , ... , T 2 L
- a 3 T 1 + 2 L , T 2 + 2 L , T 3 + 2 L , ... , T 3 L ⁇
- a N T 1 + N ⁇ 1 L , T 2 + N ⁇ 1 L , T 3 + N ⁇ 1 L , ... , T NL
- enhancement spectrum data and baseline spectrum data after statistical calculation for enhancing the components of the enable interval are calculated.
- step S152 the enhancement spectrum data is first calculated by calculating an ensemble average of the N-divided analysis results, and time series data TA of the ensemble average is obtained as in the following Formula (3) .
- TA TA 1 , TA 2 , TA 3 , ... , TA L
- step S153 the time series data of the ensemble average is converted into a frequency component to obtain enhancement spectrum data SS as in the following Formula (5).
- FFT discrete Fourier transform
- the frequency component synchronized with the analysis period signal maintains the same intensity as the analysis result, the frequency component randomly generated with respect to the analysis period signal attenuates by ⁇ N, and the frequency component of a signal having periodicity on a time axis generated non-synchronously with the analysis period signal attenuates by less than ⁇ N.
- step S154 the baseline spectrum data is first converted into frequency components by frequency analysis of A 1 to A N , which are N-divided analysis results, as in the following Formula (6).
- the conversion into the frequency component uses the calculation same as that of the frequency analysis used in the enhancement spectrum data.
- step S155 the ensemble average of A 1 to A N subjected to the frequency analysis is calculated, thereby obtaining base spectrum data BS as in the following Formula (7) .
- BS BS 1 , BS 2 , BS 3 , ... , BS L / 2
- Each point of the base spectrum data BS is calculated by the following Formula (8).
- the frequency component included in the base spectrum data is an average intensity of the N-divided analysis results regardless of the synchronization with the analysis period signal in the frequency component included in the analysis result.
- the synchronization with the analysis period signal can be determined by comparing the intensity of each frequency component of the enhancement spectrum data SS and the base spectrum data BS. At this time, a value obtained by multiplying the intensity of each frequency component of the enhancement spectrum data SS by ⁇ N is compared with the intensity of each frequency component of the base spectrum data BS.
- the frequency component of the analysis result synchronized with the analysis period signal can be estimated as a noise frequency component derived from the enable interval selected by the control PC.
- the frequency component of the analysis result that is not synchronized with the analysis period signal can be estimated not to be the noise frequency component derived from the enable interval selected by the control PC.
- step S157 it is determined whether the processing is completed at all frequencies, and if not completed, the processing of step S156 is repeated until the processing is completed.
- noise frequency components are listed for each enable interval stored in the memory resource 401 of the sync selector 121.
- the noise information is stored for each noise frequency component of each enable interval.
- the noise information may include radio frequency band information and modulation information.
- the noise information includes, for example, a module name of a noise source, an identification number of a cable or a connector, and a process number of a maintenance manual in which a work process when a noise countermeasure is performed is described.
- a work method for taking measures against noise may be displayed.
- the matching result display 124 in the abnormality detection module 120 displays the matching results input from the noise matcher 123 to an operator.
- an alert may be issued by a buzzer or a lamp from the measurement device.
- a timing of displaying the matching results and a timing of issuing the alert may be immediately after the matching results are input or may be set by the operator.
- the operator may set a type of the matching result to be displayed in advance, and only the matching result to be displayed may be displayed.
- a memory resource may be provided, and the matching result may be stored as log information in the memory resource at the time of display.
- the present embodiment it is possible to estimate the noise source to be superimposed on the analysis result in all the components which are the units and the modules provided in the measurement device assumed to be the noise source. Accordingly, it is possible to provide a measurement device capable of reducing a work time for identifying the noise source and reducing a maintenance time.
- Embodiment 1 a method for estimating the noise source by storing the enable intervals of the assumed components which are all of the units and modules in the memory resource of the sync selector and determining the synchronization with the internal noise superimposed on the analysis result is described.
- a noise determination method for noise flowing from the outside of the measurement device will be described.
- the processing in the syn determination unit 122 in Embodiment 1 is executed for all enable intervals stored in the memory resource 401 to determine the synchronization of the noise superimposed on the analysis result in all the units and modules stored in the memory resource 401.
- the noise matching controller 601 of the noise matcher 123 refers to the stored syn determination result for each selection signal, and when there is a frequency component that is asynchronous with all enable intervals in the frequency components of the noise superimposed on the analysis result, the frequency component is determined to be the external noise, and the noise information of the external noise stored in the memory resource 602 is output as the matching result.
- the frequency component determined to be synchronized with one or more enable intervals is set as the internal noise, and the noise information is output as the matching result.
- FIG. 7 shows an example of a result of determination obtained by the noise determination method according to the present embodiment.
- an upper analysis result 700 is an example in which a relative intensity is a constant value of 100% in a normal analysis result, and the external noise is superimposed on the internal noise to indicate a rectangular wave shape.
- Examples of results obtained by obtaining the frequency components of the internal noise and the external noise by the noise determination method according to the present embodiment are shown in the middle and bottom parts of FIG. 7 .
- Reference numeral 701 in the middle part denotes the internal noise
- reference numeral 702 in the lower part denotes the external noise.
- the relative intensity [dB] is based on the intensity of a normal analysis result (0 dB), and indicates a frequency intensity of the base spectrum data BS.
- the frequency component displayed by the internal noise 701 is noise due to the communication signal between the control PC 116 and the communication device in the device control module 112, and the frequency component displayed by the external noise 702 is noise entering from the outside of the measurement device using an antenna which is a test facility of EMC. From this, it can be confirmed that the internal noise and the external noise can be determined.
- the present embodiment it is possible to determine the noise source of the noise flowing from the outside of the assumption device and superimposed on the analysis result, and it is possible to shorten a work time for identifying the noise source.
- Embodiments 1 and 2 the method for estimating the noise source of the noise superimposed on the analysis result in the measurement device is described.
- a method for estimating the noise source of noise superimposed on the analysis result in a mass spectrometer will be described as a specific example of a measurement device.
- FIG. 8 is a configuration block diagram of a mass spectrometer 800 according to the present embodiment.
- the components same as those in FIG. 1 are denoted by the same reference numerals, and description thereof is omitted.
- FIG. 8 is different from FIG. 1 in that the measurement unit 111 is replaced with a mass spectrometry unit 900.
- the mass spectrometry unit 900 includes an ion source 901 that ionizes a sample to be analyzed sent from a preprocessing unit, a convergence unit 902 that converges an ionized sample 910, a separation unit 903 that passes only an ionized sample to be detected by filtering the converged ionized sample according to a mass-to-charge ratio, and a fluorescent unit 904 that causes the ionized sample passing through the separation unit to collide with a conversion die node 909, convert the ionized sample into an electron 911 according to an amount of the ionized sample, and output a photon according to an amount of the electron by causing the electron 911 to enter a scintillator 905.
- the detector 113 outputs an electrical signal corresponding to the photon output from the fluorescent unit 904.
- the abnormality detection module 120 stores, in the memory resource 401 of the sync selector 121, all the enable intervals that can be the noise sources of the components that are the units and the modules mounted in the mass spectrometer 800, and thus, as described in Embodiments 1 and 2, the synchronization of the noise superimposed on the analysis result can be determined and the noise source can be estimated.
- the frequency component of the noise superimposed on the analysis result includes the frequency component not synchronized with all the enable intervals, the frequency component can be determined to be the external noise.
- a mass spectrometer capable of estimating a noise source to be superimposed on an analysis result in all of components which are units or modules provided in the mass spectrometer assumed to be a noise source, reducing a work time for identifying the noise source, and reducing a maintenance time.
- Embodiments of the invention are described, and according to the invention, a work time for identifying a noise source can be shortened, thereby making it possible to reduce a maintenance time, and an effect of improving productivity and reducing personnel cost is achieved. Therefore, the invention contributes to achieving high levels of economic productivity through technological improvement and innovation in order to achieve the Sustainable Development Goals (SDGs), particularly in goal 8, "Decent work and economic growth".
- SDGs Sustainable Development Goals
- the invention is not limited to the embodiments described above, and includes various modifications.
- the above-described embodiments have been described in detail to facilitate understanding of the invention, and the invention is not necessarily limited to those including all the configurations described above.
- a part of a configuration of a certain embodiment can be replaced with a configuration of another embodiment, and the configuration of another embodiment can be added to the configuration of a certain embodiment.
- a part of a configuration in each embodiment may also be added to, deleted from, or replaced with another configuration.
Landscapes
- Chemical & Material Sciences (AREA)
- Analytical Chemistry (AREA)
- Other Investigation Or Analysis Of Materials By Electrical Means (AREA)
- Electron Tubes For Measurement (AREA)
- Measurement Of Mechanical Vibrations Or Ultrasonic Waves (AREA)
Abstract
Description
- The present invention relates to a measurement device and a mass spectrometer.
- In recent years, measurement devices such as a mass spectrometer are used in various life sciences. In particular, a mass spectrometer that detects a measurement signal output from a measurement unit and performs component analysis on a sample is indispensable for drug discovery and drug testing in medical and pharmaceutical fields.
- For example,
PTL 1 is a related art in the present technical field. PTL discloses a unit for improving discrimination between a signal waveform and noise by preventing a waveform of a detection signal for an ion species of the same m/z from having a shape in which a plurality of peaks are connected due to the spread of the ion species having the same mass-to-charge ratio (m/z) during flight and a response time of a microchannel plate (MCP) in an ion analyzer. - PTL 1:
JP2019-114528A -
PTL 1 discloses noise reduction for a specific noise, but does not disclose identifying a noise source among a plurality of noises. - In particular, when a measurement device that obtains a measurement signal by identifying a noise component and improving a signal intensity of a detection target, there are the following problems. Noise that degrades an S/N ratio of the measurement unit includes, in addition to a detection signal of a sensor in the measurement unit other than the detection target, thermal noise at an environmental temperature, and the like, noise generated from another electrical device in the measurement device on which the measurement unit is mounted, and external noise entering from the outside of the measurement device. Examples of an electrical device in the measurement device that generates the noise include a switching power supply and a digital circuit. Examples of the external noise entering from the outside of the measurement device include other measurement device provided close to the measurement device, communication radio waves, and broadcast radio waves.
- The noise superimposed on the measurement unit from such a large number of noise sources changes according to an operating environment of the measurement device, and there are situations in which noise that deviates from an assumed noise component and an assumed noise amount is superimposed on the measurement unit, degrading the S/N ratio and making it difficult to perform normal measurement. For example, there are situations in which when a portable wireless communication device is provided in the vicinity of the measurement device, or when a device cover is detached and attached again during maintenance of the measurement device, the attachment of the device cover is insufficient, a radio wave shielding effect assumed for the device cover is reduced, and when a connector of a cable is detached and attached, the attachment is insufficient. When such a situation occurs, it is necessary to check one device location in which normal measurement is performed one by one, and it takes a lot of time to identify a defective location.
- The invention has been made to solve the above problem, and an object of the invention is to make it possible to estimate a range of an abnormal portion that is a noise source of noise superimposed on a detection signal of a measurement device.
- One example of the invention is a measurement device including: a measurement unit configured to measure a measurement target and output a measurement signal; a detector configured to detect the measurement signal and output a detection signal; an analysis processing unit configured to calculate and output an analysis result from the detection signal; an analysis result display configured to display the analysis result; a device control module configured to control the measurement unit and output a control signal; and an abnormality detection module configured to detect noise in the measurement device. The abnormality detection module stores an enable interval of each of the components of the measurement device into a memory resource, and determines, for each of the components of the measurement device, whether the noise is mixed in based on the corresponding enable interval stored in the memory resource and the analysis result from the analysis processing unit.
- According to the invention, by making it possible to estimate a range of an abnormal portion based on an analysis result, it is possible to shorten a time for identifying a defective location of the measurement device and to reduce a maintenance time.
-
- [
FIG. 1] FIG. 1 is a configuration block diagram of a measurement device according toEmbodiment 1. - [
FIG. 2] FIG. 2 is a diagram showing a noise source in the measurement device. - [
FIG. 3] FIG. 3 is a diagram showing an example of noise superimposed on an analysis result obtained by the measurement device. - [
FIG. 4] FIG. 4 is a diagram showing an operation principle of a sync selector inEmbodiment 1. - [
FIG. 5] FIG. 5 is a processing flowchart of a syn determination unit inEmbodiment 1. - [
FIG. 6] FIG. 6 is a diagram showing an operation principle of a noise matcher inEmbodiment 1. - [
FIG. 7] FIG. 7 is a diagram showing an example of a result of determination obtained by a noise determination method according to Embodiment 2. - [
FIG. 8] FIG. 8 is a configuration block diagram of a mass spectrometer according to Embodiment 2. - Hereinafter, embodiments of the invention will be described with reference to the drawings.
-
FIG. 1 is a configuration block diagram of a measurement device according to the present embodiment. InFIG. 1 , ameasurement device 100 includes adevice module 110 that measures a measurement target and displays a result, anabnormality detection module 120 that determines a noise source of noise flowing in during measurement of the measurement device, and acontrol PC 116. - The
device module 110 includes ameasurement unit 111 that measures the measurement target and outputs a measurement signal, adevice control module 112 that controls themeasurement unit 111, adetector 113 that detects the measurement signal and outputs a detection signal, ananalysis processing unit 114 that calculates and outputs an analysis result based on the detection signal, and ananalysis result display 115 that displays the analysis result. Thedevice control module 112 transmits a control signal to themeasurement unit 111 by a control operation based on a communication signal of thecontrol PC 116. Here, theanalysis result display 115 may be included in thecontrol PC 116. - The
device control module 112 includes, for example, apower supply 204 that supplies power to components that are some or all of the units and modules constituting themeasurement device 100, adriver 201 that drives themeasurement unit 111, ameasurement controller 203 that controls thedriver 201, amonitor 202 that monitors an operation state of themeasurement unit 111, and acommunication device 205 that communicates with thecontrol PC 116. - The
abnormality detection module 120 is software processing for achieving various functions by a CPU executing operation programs for achieving the various functions, and is shown as a functional block diagram inFIG. 1 . InFIG. 1 , theabnormality detection module 120 includes async selector 121, asyn determination unit 122, anoise matcher 123, and amatching result display 124. Thesync selector 121 has a memory resource described later that stores enable intervals, which are operating periods of some or all of the components in themeasurement device 100, and outputs a detection control signal to thedetector 113 at an operating period of the enable interval of the component designated by a selection signal input from the control PC 116. Thesyn determination unit 122 outputs a syn determination result from an analysis result and an analysis period signal output from theanalysis processing unit 114. The noise matcher 123 outputs matching results which are noise sources estimated based on the syn determination result and the selection signal. Thematching result display 124 displays the matching results from thenoise matcher 123. Thematching result display 124 may be included in the control PC 116. - Next, the noise superimposed on the analysis result and the noise source will be described. The noise superimposed on the analysis result is roughly classified into internal noise derived from components which are all units and modules included in the measurement device and external noise derived from outside of the measurement device.
-
FIG. 2 is a diagram showing the noise source in the measurement device. InFIG. 2 , the internal noise is, for example, noise transmitted from the 204 to themeasurement unit 111 and noise transmitted from thecommunication device 205 to thedetector 113. The external noise is, for example, a wireless portable device disposed in the vicinity of themeasurement device 100. Here, the transmission of the noise includes both conduction in which the noise is transmitted by flowing through a metal portion such as each module or a cover of themeasurement device 100 and propagation in which a radio wave is transmitted within space. - The
measurement device 100 implements noise countermeasures so that each noise does not affect the analysis result. For example, it is possible to shield external noise by forming the cover of themeasurement device 100 into an electromagnetic wave shielding structure, shield noise from each unit or module by accommodating thedetector 113 in the electromagnetic wave shielding structure, and reduce power supply noise by inserting a ferrite core into a power supply cable connecting the power supply and each unit or module. - However, during the operation of the
measurement device 100, effects of the noise countermeasures may be reduced or lost, and the noise may be superimposed on the analysis result. For example, this occurs at the time of replacement of a periodically replaceable component in maintenance or at the time of replacement of a failed module. In such a case, the following work is performed, which is to open the cover of the measurement device, disconnect the various cables connected to a target module, remove the old module, install a new module, connect the various cables to the new module, and close the cover of the measurement device. At this time, when loosening of the cable and connector, contact failure of the cover of the measurement device, or the like occurs, the effect of the noise countermeasures is reduced or lost. -
FIG. 3 shows an example of an analysis result when the effect of the noise countermeasures is reduced or lost. InFIG. 3 , ananalysis result 301 indicates a normal analysis result, and ananalysis result 302 indicates an analysis result whennoise 303 having a periodic pulse shape is superimposed. When theanalysis result 302 is generated after the replacement of the periodically replaceable component in the maintenance or the replacement of the failed module, in the related art, a lot of work time is required because a work of checking again whether there is an error in contents of the work at the time of the replacement is generated and a work of checking one by one whether there is no problem in the replaced periodically replaceable component or replacement module is generated. - Next, a method for estimating a noise source of noise superimposed on an analysis result by the
abnormality detection module 120 according to the present embodiment will be described. When theanalysis result 302 shown inFIG. 3 is generated, theabnormality detection module 120 functions as a noise determination unit for displaying an estimated noise source on thematching result display 124. -
FIG. 4 is a diagram showing an operation principle of thesync selector 121 in theabnormality detection module 120 according to the present embodiment. InFIG. 4 , thesync selector 121 includes amemory resource 401 and a detectioncontrol signal generator 402, and switches the detection control signal for controlling a detection timing of thedetector 113 based on the selection signal input from thecontrol PC 116. Thememory resource 401 stores the enable intervals, that is, drive periods, of some or all of the components that are the units or the modules included in themeasurement device 100. For example, it is an enable interval of themeasurement controller 203, an enable interval of themonitor 202, and an enable interval of thecommunication device 205. Thesync selector 121 enables thedetector 113 to perform a detection operation in a period same as the components selected by thecontrol PC 116. - In
FIG. 1 , thedetector 113 outputs the detection signal, which is a result obtained by detecting the measurement signal in synchronization with the detection control signal input from thesync selector 121, and a detection period signal, which is a detection control signal, to theanalysis processing unit 114. Theanalysis processing unit 114 processes the input detection signal and outputs the analysis result to theanalysis result display 115 and thesyn determination unit 122. The input detection period signal is output to thesyn determination unit 122 as the analysis period signal. -
FIG. 5 is a processing flowchart of thesyn determination unit 122 in theabnormality detection module 120 according to the present embodiment. Thesyn determination unit 122 outputs, based on the input analysis result and the analysis period signal, a frequency component of the analysis result and a syn determination result which is information on synchronization between the frequency component and the analysis period signal. Hereinafter, a method for calculating and determining the frequency component and the synchronization will be described with reference toFIG. 5 . - An analysis result A is time series data of M points as in the following Formula (1).
[Formula 1]
- In step S151, the time-series analysis result A is divided by the analysis period signal. When an analysis period is L and the number obtained by dividing the M points by L is N (N = M/L), the time series data obtained by dividing the analysis result into N based on the analysis period is expressed by the following Formula (2).
[Formula 2]
- Based on the N-divided analysis results, enhancement spectrum data and baseline spectrum data after statistical calculation for enhancing the components of the enable interval are calculated.
- In step S152, the enhancement spectrum data is first calculated by calculating an ensemble average of the N-divided analysis results, and time series data TA of the ensemble average is obtained as in the following Formula (3) .
[Formula 3]
- Each point of the time series data of the ensemble average is calculated by the following Formula (4).
[Formula 4]
- Next, in step S153, the time series data of the ensemble average is converted into a frequency component to obtain enhancement spectrum data SS as in the following Formula (5). For the conversion into the frequency component, for example, FFT (discrete Fourier transform) is used.
[Formula 5]
- By obtaining the enhancement spectrum data based on the above calculation, among the frequency components included in the enhancement spectrum data, the frequency component synchronized with the analysis period signal maintains the same intensity as the analysis result, the frequency component randomly generated with respect to the analysis period signal attenuates by √N, and the frequency component of a signal having periodicity on a time axis generated non-synchronously with the analysis period signal attenuates by less than √N.
- In step S154, the baseline spectrum data is first converted into frequency components by frequency analysis of A1 to AN, which are N-divided analysis results, as in the following Formula (6). The conversion into the frequency component uses the calculation same as that of the frequency analysis used in the enhancement spectrum data.
[Formula 6]
- Next, in step S155, the ensemble average of A1 to AN subjected to the frequency analysis is calculated, thereby obtaining base spectrum data BS as in the following Formula (7) .
[Formula 7]
- Each point of the base spectrum data BS is calculated by the following Formula (8).
[Formula 8]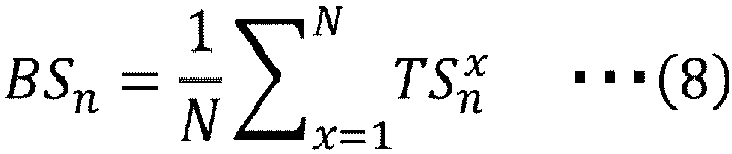
- By obtaining the base spectrum data based on the calculation as described above, the frequency component included in the base spectrum data is an average intensity of the N-divided analysis results regardless of the synchronization with the analysis period signal in the frequency component included in the analysis result.
- Further, in step S156, the synchronization with the analysis period signal can be determined by comparing the intensity of each frequency component of the enhancement spectrum data SS and the base spectrum data BS. At this time, a value obtained by multiplying the intensity of each frequency component of the enhancement spectrum data SS by √N is compared with the intensity of each frequency component of the base spectrum data BS. That is, a frequency component in which a value obtained by multiplying the intensity of the enhancement spectrum data SS by √N is larger than the intensity of the base spectrum data BS can be determined as a frequency component synchronized with the analysis period signal, and a frequency component in which a value obtained by multiplying the intensity of the enhancement spectrum data SS by √N is equal to or smaller than the intensity of the base spectrum data BS can be determined as a frequency component not synchronized with the analysis period signal.
- The frequency component of the analysis result synchronized with the analysis period signal can be estimated as a noise frequency component derived from the enable interval selected by the control PC. The frequency component of the analysis result that is not synchronized with the analysis period signal can be estimated not to be the noise frequency component derived from the enable interval selected by the control PC.
- In step S157, it is determined whether the processing is completed at all frequencies, and if not completed, the processing of step S156 is repeated until the processing is completed.
-
FIG. 6 is a diagram showing an operation principle of thenoise matcher 123 in theabnormality detection module 120 according to the present embodiment. InFIG. 6 , thenoise matcher 123 matches noise data stored in amemory resource 602 using anoise matching controller 601 based on the frequency component determined to be synchronized with the analysis period signal and the selection signal input from thecontrol PC 116, and outputs corresponding noise information as a matching result. - As shown in
FIG. 6 , in the noise data stored in thememory resource 602, for example, noise frequency components are listed for each enable interval stored in thememory resource 401 of thesync selector 121. The noise information is stored for each noise frequency component of each enable interval. The noise information may include radio frequency band information and modulation information. - The noise information includes, for example, a module name of a noise source, an identification number of a cable or a connector, and a process number of a maintenance manual in which a work process when a noise countermeasure is performed is described. In addition, a work method for taking measures against noise may be displayed.
- The matching
result display 124 in theabnormality detection module 120 displays the matching results input from thenoise matcher 123 to an operator. At the time of display, an alert may be issued by a buzzer or a lamp from the measurement device. A timing of displaying the matching results and a timing of issuing the alert may be immediately after the matching results are input or may be set by the operator. In addition, the operator may set a type of the matching result to be displayed in advance, and only the matching result to be displayed may be displayed. A memory resource may be provided, and the matching result may be stored as log information in the memory resource at the time of display. - By performing the
noise matcher 123 for all the enable intervals stored in thememory resource 401, it is possible to determine the synchronization of the noise superimposed on the analysis result in all the modules stored in thememory resource 401. - As described above, according to the present embodiment, it is possible to estimate the noise source to be superimposed on the analysis result in all the components which are the units and the modules provided in the measurement device assumed to be the noise source. Accordingly, it is possible to provide a measurement device capable of reducing a work time for identifying the noise source and reducing a maintenance time.
- In
Embodiment 1, a method for estimating the noise source by storing the enable intervals of the assumed components which are all of the units and modules in the memory resource of the sync selector and determining the synchronization with the internal noise superimposed on the analysis result is described. In the present embodiment, a noise determination method for noise flowing from the outside of the measurement device will be described. - An abnormality detection module as a noise determination unit in the present embodiment has a structure same as that of the abnormality detection module in
Embodiment 1. However, the information of the enable interval stored in thememory resource 401 of thesync selector 121 stores all assumed noise sources in the measurement device. In addition, thememory resource 602 of thenoise matcher 123 stores noise information of assumed external noise, and thenoise matching controller 601 includes a unit for storing the type of the selection signal subjected to the noise determination and the syn determination result. - In the method for determining the noise flowing from the outside of the measurement device, first, the processing in the
syn determination unit 122 inEmbodiment 1 is executed for all enable intervals stored in thememory resource 401 to determine the synchronization of the noise superimposed on the analysis result in all the units and modules stored in thememory resource 401. Next, thenoise matching controller 601 of thenoise matcher 123 refers to the stored syn determination result for each selection signal, and when there is a frequency component that is asynchronous with all enable intervals in the frequency components of the noise superimposed on the analysis result, the frequency component is determined to be the external noise, and the noise information of the external noise stored in thememory resource 602 is output as the matching result. In addition, in the frequency component of the noise superimposed on the analysis result, the frequency component determined to be synchronized with one or more enable intervals is set as the internal noise, and the noise information is output as the matching result. -
FIG. 7 shows an example of a result of determination obtained by the noise determination method according to the present embodiment. InFIG. 7 , anupper analysis result 700 is an example in which a relative intensity is a constant value of 100% in a normal analysis result, and the external noise is superimposed on the internal noise to indicate a rectangular wave shape. Examples of results obtained by obtaining the frequency components of the internal noise and the external noise by the noise determination method according to the present embodiment are shown in the middle and bottom parts ofFIG. 7 .Reference numeral 701 in the middle part denotes the internal noise, andreference numeral 702 in the lower part denotes the external noise. Here, the relative intensity [dB] is based on the intensity of a normal analysis result (0 dB), and indicates a frequency intensity of the base spectrum data BS. The frequency component displayed by theinternal noise 701 is noise due to the communication signal between thecontrol PC 116 and the communication device in thedevice control module 112, and the frequency component displayed by theexternal noise 702 is noise entering from the outside of the measurement device using an antenna which is a test facility of EMC. From this, it can be confirmed that the internal noise and the external noise can be determined. - As described above, according to the present embodiment, it is possible to determine the noise source of the noise flowing from the outside of the assumption device and superimposed on the analysis result, and it is possible to shorten a work time for identifying the noise source.
- In
Embodiments 1 and 2, the method for estimating the noise source of the noise superimposed on the analysis result in the measurement device is described. In the present embodiment, a method for estimating the noise source of noise superimposed on the analysis result in a mass spectrometer will be described as a specific example of a measurement device. -
FIG. 8 is a configuration block diagram of amass spectrometer 800 according to the present embodiment. InFIG. 8 , the components same as those inFIG. 1 are denoted by the same reference numerals, and description thereof is omitted.FIG. 8 is different fromFIG. 1 in that themeasurement unit 111 is replaced with amass spectrometry unit 900. - In
FIG. 8 , themass spectrometry unit 900 includes anion source 901 that ionizes a sample to be analyzed sent from a preprocessing unit, aconvergence unit 902 that converges an ionizedsample 910, aseparation unit 903 that passes only an ionized sample to be detected by filtering the converged ionized sample according to a mass-to-charge ratio, and afluorescent unit 904 that causes the ionized sample passing through the separation unit to collide with aconversion die node 909, convert the ionized sample into anelectron 911 according to an amount of the ionized sample, and output a photon according to an amount of the electron by causing theelectron 911 to enter ascintillator 905. Thedetector 113 outputs an electrical signal corresponding to the photon output from thefluorescent unit 904. - The
abnormality detection module 120 stores, in thememory resource 401 of thesync selector 121, all the enable intervals that can be the noise sources of the components that are the units and the modules mounted in themass spectrometer 800, and thus, as described inEmbodiments 1 and 2, the synchronization of the noise superimposed on the analysis result can be determined and the noise source can be estimated. - When the frequency component of the noise superimposed on the analysis result includes the frequency component not synchronized with all the enable intervals, the frequency component can be determined to be the external noise.
- As described above, according to the present embodiment, it is possible to provide a mass spectrometer capable of estimating a noise source to be superimposed on an analysis result in all of components which are units or modules provided in the mass spectrometer assumed to be a noise source, reducing a work time for identifying the noise source, and reducing a maintenance time.
- Embodiments of the invention are described, and according to the invention, a work time for identifying a noise source can be shortened, thereby making it possible to reduce a maintenance time, and an effect of improving productivity and reducing personnel cost is achieved. Therefore, the invention contributes to achieving high levels of economic productivity through technological improvement and innovation in order to achieve the Sustainable Development Goals (SDGs), particularly in
goal 8, "Decent work and economic growth". - The invention is not limited to the embodiments described above, and includes various modifications. For example, the above-described embodiments have been described in detail to facilitate understanding of the invention, and the invention is not necessarily limited to those including all the configurations described above. A part of a configuration of a certain embodiment can be replaced with a configuration of another embodiment, and the configuration of another embodiment can be added to the configuration of a certain embodiment. A part of a configuration in each embodiment may also be added to, deleted from, or replaced with another configuration.
-
- 100: measurement device
- 110: device module
- 111: measurement unit
- 112: device control module
- 113: detector
- 114: analysis processing unit
- 115: analysis result display
- 116: control PC
- 120: abnormality detection module
- 121: sync selector
- 122: syn determination unit
- 123: noise matcher
- 124: matching result display
- 201: driver
- 202: monitor
- 203: measurement controller
- 204: power supply
- 205: communication device
- 301, 302, 700: analysis result
- 303: noise
- 401, 602: memory resource
- 402: detection control signal generator
- 601: noise matching controller
- 701: internal noise
- 702: external noise
- 800: mass spectrometer
- 900: mass spectrometry unit
Claims (6)
- A measurement device comprising:a measurement unit configured to measure a measurement target and output a measurement signal;a detector configured to detect the measurement signal and output a detection signal;an analysis processing unit configured to calculate and output an analysis result from the detection signal;an analysis result display configured to display the analysis result;a device control module configured to control the measurement unit and output a control signal; andan abnormality detection module configured to detect noise in the measurement device, whereinthe abnormality detection module stores an enable interval of each of the components of the measurement device into a memory resource, and determines, for each of the components of the measurement device, whether the noise is mixed in based on the corresponding enable interval stored in the memory resource and the analysis result from the analysis processing unit.
- The measurement device according to claim 1, wherein
the abnormality detection moduledetermines, for each of the components of the measurement device, synchronization between the corresponding enable interval stored in the memory resource and a frequency component of the analysis result,determines, when there is a frequency component among frequency components of the noise superimposed on the analysis result which is asynchronous with all of the enable intervals stored in the memory resource, the frequency component to be external noise, and determines a frequency component that is synchronous with one or more of the enable intervals stored in the memory resource to be internal noise, andoutputs noise information of the determined external noise or internal noise as a matching result from a second memory resource in which noise information of assumed external noise and internal noise is stored. - The measurement device according to claim 2, whereinthe determination of the synchronization is performed by comparing baseline spectrum data with enhancement spectrum data obtained by statistical calculation that enhances components of the enable intervals,the baseline spectrum data is spectrum data generated by performing frequency analysis on the analysis result and then performing ensemble average calculation, andthe enhancement spectrum data is spectrum data generated by dividing the analysis result into a plurality of sections at the enable intervals, then performing the ensemble average calculation, and then performing the frequency analysis.
- The measurement device according to claim 2, wherein
the abnormality detection module is allowed to select a timing of outputting the noise information as the matching result and a type of the output, and to issue an alert using a buzzer or a lamp. - The measurement device according to claim 2, wherein
the noise information includes frequency information and modulation information. - A mass spectrometer comprising:a measurement unit configured to measure a measurement target and output a measurement signal;a detector configured to detect the measurement signal and output a detection signal;an analysis processing unit configured to calculate and output an analysis result from the detection signal;an analysis result display configured to display the analysis result;a device control module configured to control the measurement unit and output a control signal, the measurement unit includes an ion source, a convergence unit, a separation unit, and a fluorescent unit,; andan abnormality detection module configured to detect noise in the mass spectrometer, whereinthe abnormality detection moduledetermines, for each of the components of the mass spectrometer, synchronization between an enable interval of the corresponding component of the mass spectrometer stored in a memory resource and a frequency component of the analysis result,determines, when there is a frequency component among frequency components of the noise superimposed on the analysis result which is asynchronous with all of the enable intervals stored in the memory resource, the frequency component to be external noise, and determines a frequency component that is synchronous with one or more of the enable intervals stored in the memory resource to be internal noise, andoutputs noise information of the determined external noise or internal noise as a matching result from a second memory resource in which noise information of assumed external noise and internal noise is stored.
Applications Claiming Priority (2)
| Application Number | Priority Date | Filing Date | Title |
|---|---|---|---|
| JP2022104041A JP7799569B2 (en) | 2022-06-28 | 2022-06-28 | Measurement device and mass spectrometer |
| PCT/JP2023/014169 WO2024004311A1 (en) | 2022-06-28 | 2023-04-06 | Measurement device and mass spectrometer |
Publications (2)
| Publication Number | Publication Date |
|---|---|
| EP4550384A1 true EP4550384A1 (en) | 2025-05-07 |
| EP4550384A4 EP4550384A4 (en) | 2026-07-08 |
Family
ID=89381979
Family Applications (1)
| Application Number | Title | Priority Date | Filing Date |
|---|---|---|---|
| EP23830765.6A Pending EP4550384A4 (en) | 2022-06-28 | 2023-04-06 | MEASURING DEVICE AND MASS SPECTROMETER |
Country Status (5)
| Country | Link |
|---|---|
| US (1) | US20260196455A1 (en) |
| EP (1) | EP4550384A4 (en) |
| JP (1) | JP7799569B2 (en) |
| CN (1) | CN119054043A (en) |
| WO (1) | WO2024004311A1 (en) |
Families Citing this family (1)
| Publication number | Priority date | Publication date | Assignee | Title |
|---|---|---|---|---|
| JP2025110514A (en) | 2024-01-16 | 2025-07-29 | セイコーエプソン株式会社 | Medium transport device and recording device |
Family Cites Families (4)
| Publication number | Priority date | Publication date | Assignee | Title |
|---|---|---|---|---|
| US7321847B1 (en) * | 2006-05-05 | 2008-01-22 | Analytica Of Branford, Inc. | Apparatus and methods for reduction of coherent noise in a digital signal averager |
| JP2016109770A (en) | 2014-12-03 | 2016-06-20 | シャープ株式会社 | Electronics |
| JP6517520B2 (en) | 2015-01-27 | 2019-05-22 | ラピスセミコンダクタ株式会社 | Monitoring device, ion implantation device, and monitoring method |
| JP7035946B2 (en) | 2017-12-20 | 2022-03-15 | 株式会社島津製作所 | Ion analyzer |
-
2022
- 2022-06-28 JP JP2022104041A patent/JP7799569B2/en active Active
-
2023
- 2023-04-06 US US18/863,752 patent/US20260196455A1/en active Pending
- 2023-04-06 EP EP23830765.6A patent/EP4550384A4/en active Pending
- 2023-04-06 CN CN202380035500.6A patent/CN119054043A/en active Pending
- 2023-04-06 WO PCT/JP2023/014169 patent/WO2024004311A1/en not_active Ceased
Also Published As
| Publication number | Publication date |
|---|---|
| JP2024004391A (en) | 2024-01-16 |
| JP7799569B2 (en) | 2026-01-15 |
| CN119054043A (en) | 2024-11-29 |
| WO2024004311A1 (en) | 2024-01-04 |
| EP4550384A4 (en) | 2026-07-08 |
| US20260196455A1 (en) | 2026-07-09 |
Similar Documents
| Publication | Publication Date | Title |
|---|---|---|
| CN109581309B (en) | Automatic test system for active radar interference device | |
| EP3474029A1 (en) | Load abnormality detection device | |
| US11038587B2 (en) | Method and apparatus for locating fault cause, and storage medium | |
| US8212572B2 (en) | Electromagnetic compatibility multi-carrier immunity testing system and method | |
| EP3492938A1 (en) | Electric motor diagnosis device | |
| US20120112925A1 (en) | Apparatus and method for monitoring status of satellite transponder using statistical analysis of telemetry data | |
| KR20140067653A (en) | Apparatus and method of partial discharge analysing for diagnosisng partial discharge detector | |
| KR101738076B1 (en) | Partial discharge remote diagnosis system for displaying reliability of partial discharge diagnosis | |
| EP2637029A1 (en) | A method and apparatus for measuring radio-frequency energy | |
| CN101876935B (en) | Debugging program monitoring method and device | |
| CN107121602A (en) | Vehicle-mounted central control system interference source finding method | |
| JP7799569B2 (en) | Measurement device and mass spectrometer | |
| CN116430110A (en) | Current synchronous acquisition method, system, terminal equipment and storage medium | |
| KR20220166319A (en) | motor diagnostics | |
| CN117269653A (en) | Microcomputer relay protection tester and testing method thereof | |
| CN118226170A (en) | Electromagnetic compatibility test method, device, equipment and storage medium | |
| EP3948632B1 (en) | Application and product realization of darpa lads capabilities to legacy avionics | |
| CN116074216A (en) | Test method and test device for vehicle-mounted Ethernet physical layer and cloud server | |
| US6697014B1 (en) | Synergistic method for assessing an electromagnetic radiating tube system | |
| US20050217794A1 (en) | Semiconductor manufacturing apparatus and method for assisting monitoring and analysis of the same | |
| US11782079B2 (en) | System and method for analyzing an electronic device | |
| US11348775B2 (en) | Mass spectrometry data processing program | |
| CN116087757A (en) | Radio frequency board test system, test method, electronic equipment and storage medium | |
| EP3833089A1 (en) | Automated narrow peak interference severity estimation | |
| JP2014016195A (en) | Electromagnetic interference noise measuring method |
Legal Events
| Date | Code | Title | Description |
|---|---|---|---|
| STAA | Information on the status of an ep patent application or granted ep patent |
Free format text: STATUS: THE INTERNATIONAL PUBLICATION HAS BEEN MADE |
|
| PUAI | Public reference made under article 153(3) epc to a published international application that has entered the european phase |
Free format text: ORIGINAL CODE: 0009012 |
|
| STAA | Information on the status of an ep patent application or granted ep patent |
Free format text: STATUS: REQUEST FOR EXAMINATION WAS MADE |
|
| 17P | Request for examination filed |
Effective date: 20241021 |
|
| AK | Designated contracting states |
Kind code of ref document: A1 Designated state(s): AL AT BE BG CH CY CZ DE DK EE ES FI FR GB GR HR HU IE IS IT LI LT LU LV MC ME MK MT NL NO PL PT RO RS SE SI SK SM TR |
|
| DAV | Request for validation of the european patent (deleted) | ||
| DAX | Request for extension of the european patent (deleted) | ||
| A4 | Supplementary search report drawn up and despatched |
Effective date: 20260605 |
|
| RIC1 | Information provided on ipc code assigned before grant |
Ipc: H01J 49/00 20060101AFI20260529BHEP Ipc: H01J 49/26 20060101ALI20260529BHEP |