EP4546261A2 - Automatisierte tumoridentifizierung und segmentierung mit medizinischen bildern - Google Patents
Automatisierte tumoridentifizierung und segmentierung mit medizinischen bildern Download PDFInfo
- Publication number
- EP4546261A2 EP4546261A2 EP25163330.1A EP25163330A EP4546261A2 EP 4546261 A2 EP4546261 A2 EP 4546261A2 EP 25163330 A EP25163330 A EP 25163330A EP 4546261 A2 EP4546261 A2 EP 4546261A2
- Authority
- EP
- European Patent Office
- Prior art keywords
- tumor
- subject
- organ
- segmentation
- image
- Prior art date
- Legal status (The legal status is an assumption and is not a legal conclusion. Google has not performed a legal analysis and makes no representation as to the accuracy of the status listed.)
- Pending
Links
Images


Classifications
-
- G—PHYSICS
- G06—COMPUTING OR CALCULATING; COUNTING
- G06T—IMAGE DATA PROCESSING OR GENERATION, IN GENERAL
- G06T7/00—Image analysis
- G06T7/0002—Inspection of images, e.g. flaw detection
- G06T7/0012—Biomedical image inspection
- G06T7/0014—Biomedical image inspection using an image reference approach
- G06T7/0016—Biomedical image inspection using an image reference approach involving temporal comparison
-
- A—HUMAN NECESSITIES
- A61—MEDICAL OR VETERINARY SCIENCE; HYGIENE
- A61B—DIAGNOSIS; SURGERY; IDENTIFICATION
- A61B5/00—Measuring for diagnostic purposes; Identification of persons
- A61B5/48—Other medical applications
- A61B5/4848—Monitoring or testing the effects of treatment, e.g. of medication
-
- G—PHYSICS
- G06—COMPUTING OR CALCULATING; COUNTING
- G06T—IMAGE DATA PROCESSING OR GENERATION, IN GENERAL
- G06T7/00—Image analysis
- G06T7/0002—Inspection of images, e.g. flaw detection
- G06T7/0012—Biomedical image inspection
-
- G—PHYSICS
- G06—COMPUTING OR CALCULATING; COUNTING
- G06T—IMAGE DATA PROCESSING OR GENERATION, IN GENERAL
- G06T7/00—Image analysis
- G06T7/10—Segmentation; Edge detection
- G06T7/11—Region-based segmentation
-
- G—PHYSICS
- G06—COMPUTING OR CALCULATING; COUNTING
- G06T—IMAGE DATA PROCESSING OR GENERATION, IN GENERAL
- G06T7/00—Image analysis
- G06T7/10—Segmentation; Edge detection
- G06T7/12—Edge-based segmentation
-
- G—PHYSICS
- G06—COMPUTING OR CALCULATING; COUNTING
- G06T—IMAGE DATA PROCESSING OR GENERATION, IN GENERAL
- G06T7/00—Image analysis
- G06T7/10—Segmentation; Edge detection
- G06T7/136—Segmentation; Edge detection involving thresholding
-
- G—PHYSICS
- G06—COMPUTING OR CALCULATING; COUNTING
- G06T—IMAGE DATA PROCESSING OR GENERATION, IN GENERAL
- G06T7/00—Image analysis
- G06T7/60—Analysis of geometric attributes
- G06T7/62—Analysis of geometric attributes of area, perimeter, diameter or volume
-
- G—PHYSICS
- G06—COMPUTING OR CALCULATING; COUNTING
- G06T—IMAGE DATA PROCESSING OR GENERATION, IN GENERAL
- G06T7/00—Image analysis
- G06T7/70—Determining position or orientation of objects or cameras
-
- G—PHYSICS
- G06—COMPUTING OR CALCULATING; COUNTING
- G06T—IMAGE DATA PROCESSING OR GENERATION, IN GENERAL
- G06T2207/00—Indexing scheme for image analysis or image enhancement
- G06T2207/10—Image acquisition modality
- G06T2207/10072—Tomographic images
- G06T2207/10081—Computed x-ray tomography [CT]
-
- G—PHYSICS
- G06—COMPUTING OR CALCULATING; COUNTING
- G06T—IMAGE DATA PROCESSING OR GENERATION, IN GENERAL
- G06T2207/00—Indexing scheme for image analysis or image enhancement
- G06T2207/10—Image acquisition modality
- G06T2207/10072—Tomographic images
- G06T2207/10088—Magnetic resonance imaging [MRI]
-
- G—PHYSICS
- G06—COMPUTING OR CALCULATING; COUNTING
- G06T—IMAGE DATA PROCESSING OR GENERATION, IN GENERAL
- G06T2207/00—Indexing scheme for image analysis or image enhancement
- G06T2207/20—Special algorithmic details
- G06T2207/20021—Dividing image into blocks, subimages or windows
-
- G—PHYSICS
- G06—COMPUTING OR CALCULATING; COUNTING
- G06T—IMAGE DATA PROCESSING OR GENERATION, IN GENERAL
- G06T2207/00—Indexing scheme for image analysis or image enhancement
- G06T2207/20—Special algorithmic details
- G06T2207/20076—Probabilistic image processing
-
- G—PHYSICS
- G06—COMPUTING OR CALCULATING; COUNTING
- G06T—IMAGE DATA PROCESSING OR GENERATION, IN GENERAL
- G06T2207/00—Indexing scheme for image analysis or image enhancement
- G06T2207/20—Special algorithmic details
- G06T2207/20081—Training; Learning
-
- G—PHYSICS
- G06—COMPUTING OR CALCULATING; COUNTING
- G06T—IMAGE DATA PROCESSING OR GENERATION, IN GENERAL
- G06T2207/00—Indexing scheme for image analysis or image enhancement
- G06T2207/20—Special algorithmic details
- G06T2207/20084—Artificial neural networks [ANN]
-
- G—PHYSICS
- G06—COMPUTING OR CALCULATING; COUNTING
- G06T—IMAGE DATA PROCESSING OR GENERATION, IN GENERAL
- G06T2207/00—Indexing scheme for image analysis or image enhancement
- G06T2207/30—Subject of image; Context of image processing
- G06T2207/30004—Biomedical image processing
- G06T2207/30096—Tumor; Lesion
Definitions
- RECIST Solid Tumors
- an annotator is to manually (e.g., by a radiologist) identify up to five target lesions and up to 10 non-target lesions.
- the annotator is to identify the perimeter of each target lesion in each scan where a cross-section of the target lesion is depicted, and records cross-sectional diameters for each target lesion.
- a quantitative metric e.g., sum of longest diameters
- Non-target lesions are assessed qualitatively, indicating whether the non-target lesion is observed in the scan(s), and if there are unequivocal changes.
- Scans can be collected at multiple time points, and metrics for the target and non-target lesions can be determined for each time point. Changes in the metrics over a time period can then be used to assess a degree to which a disease is progressing and/or being effectively treated.
- RECIST includes several limitations. Namely, the method does not account for an entire disease "burden” since RECIST very frequently only measures a small subset (e.g., less than 5-10) of tumors for each subject. The technique is unable to precisely assess disease progression and/or a treatment efficacy for subjects with cancer that has metastasized to include a large number of lesions (e.g., more than 5 lesions), given that sizes of only up to 5 tumors are tracked. Furthermore, there is also inconsistency in the selection of target lesions due to variability of lesion selections, which causes significant intra- and inter-reader variability leading to differing assessments of tumor burden even within the same subject.
- a different set of lesions may (e.g., inadvertently) be identified across different time points.
- Many tumors can additionally often have a heterogeneous appearance on CT and vary by location, size, and shape.
- lung lesions may be of cavitary or calcified type and bone metastases may (for example) take Lytic (destroys skeletal tissue) or Blastic (abnormal bone growth) form, where each lesion type is associated with different structural and visual appearance, such that due to the high variability in lesions, it is difficult to assess a stage of disease and/or each lesion of said lesion type without obtaining a full read.
- Lytic diestroys skeletal tissue
- Blastic abnormal bone growth
- the present disclosure attempts to solve at least the above limitations by providing an automated method of tumor detection and measurement that is both consistent and accounts for an entire disease burden of a subject.
- Techniques described herein disclose a method for the identification and segmentation of biological objects using one or more medical images.
- a computer-implemented method where at least one or more medical images of a subject are accessed.
- the one or more medical images are inputted into a detection network to generate one or more masks that identifies a set of regions within the one or more images.
- the detection network predicts that each region of the set of regions identified in the one or more masks includes a depiction of a tumor within the subject.
- the region of the one or more medical images is processed using a tumor segmentation network to generate one or more tumor segmentation boundaries for the tumor present within the subject.
- An organ, within which at least part of the tumor is located is determined for each tumor of the one or more tumors and by using a plurality of organ-specific segmentation networks.
- An output is then generated based on the one or more tumor segmentation boundaries and the organ locations.
- another computer-implemented method where one or more medical images of a subject is accessed.
- a set of organ locations for a set of tumor lesions present in the one or more medical images is also accessed.
- the one or more medical images and the set of organ locations are inputted into a network associated with one of a plurality of therapeutic treatments to generate a score representing whether the subject is a good candidate for a particular treatment relative to other prior subjects who have received that treatment.
- the score is then returned for evaluation of the subject and the viability of each treatment of the plurality of treatments.
- a system includes one or more data processors and a non-transitory computer readable storage medium containing instructions which, when executed on the one or more data processors, cause the one or more data processors to perform part or all of one or more methods disclosed herein.
- a computer-program product is provided that is tangibly embodied in a non-transitory machine-readable storage medium and that includes instructions configured to cause one or more data processors to perform part or all of one or more methods disclosed herein.
- Recent image analysis efforts have focused on developing automated algorithms that can aid the radiologist's workflow by performing tumor detection and segmentation.
- Recent methods focus on detecting and/or segmenting RECIST lesions in a single axial CT section. These recent efforts are limited due to segmentation of tumors only on a single slice, or in a single organ (e.g. in the lung) for tumor screening, as opposed to advanced stage subjects that will suffer from a higher and more variable tumor burden.
- a first neural network can be used to detect, for each image in the image the image scan, each region that includes a depiction of a particular type of biological object (e.g., a tumor).
- the first neural network i.e., an bounding-box detection neural network
- the first neural network may be configured to define each region as a bounding box that includes the depicted biological object and potentially a padding of a predefined size (e.g., such that a width of the box is defined to be an estimated maximum width of the biological-object depiction plus two times the padding).
- the first neural network can be configured to process image scans with an individual focus (e.g., to define regions for each individual image) but using a scan depicting a slice above an individual scan and another scan depicting a slice below the individual scan to provide context.
- a second neural network (e.g., a segmentation neural network) can be configured to process smaller portions of the image scan to segment individual objects. More specifically, one or more cropped portions of the image(s) processed by the first neural network can be input to the second neural network. Each cropped portion may correspond to a bounding box defined for a particular image. The cropped portion may have an area that is (for example) equal to an area of the bounding box or an area that is equal to the area of the bounding box plus padding.
- the second neural network may be configured to receive corresponding portions from other images representing adjacent slices.
- the second neural network can include a convolutional and/or three-dimensional neural network, such as a UNet.
- An output of the second neural network can identify, for each box, a set of pixels that are estimated to correspond to a circumference or area of a cross section of the object cross-section depicted in the image.
- the object segmentations are aligned and/or smoothed across images. Three-dimensional representations of individual objects may then be obtained.
- a neural network (e.g., the first neural network, the second neural network or another neural network) can be configured to estimate an environment of the object.
- the network may output a probability that the biological object is within a subject's lung, liver, bone, mediastinum or other location.
- the probabilities may be independently assessed (e.g., and the probabilities then need not sum to 1 across the various probabilities).
- Predicting the context may facilitate segmentation, alignment and/or other processing.
- a particular type of biological object e.g., tumor
- an environment prediction may inform what types of image features are used to generate object segmentation and/or perform other image processing.
- the network outputs an estimated probability of the image truly depicting an object of a particular type.
- a third neural network can determine an environment of the biological objects by performing a second segmentation of locations of interest within the images.
- the third neural network may output segmentations (e.g., in the form of 2-dimensional and/or 3-dimensional masks) of a lung, a liver, a kidney, and/or another location corresponding to a subject.
- a third neural network may be trained to segment a single location of interest, and additional neural networks may be configured to segment additional locations of interest.
- a third neural network may output segmentations for a lung, a fourth neural network may output segmentations for a liver, and a fifth neural network may output segmentations for a kidney.
- one or more object-specific statistics can be generated to characterize each estimated object depiction.
- the one or more object-specific statistics can include (for example) an area, longest dimension length or circumference length.
- One or more scan-specific statistics can be generated for each scan.
- a scan-specific statistic can include (for example) a number of objects detected per scan, a statistic based on a number of objects detected per scan (e.g., an average, median or maximum), a statistic based on object-specific statistics (e.g., an average, median or maximum) or a statistic based on a volume of objects detected across each scan (e.g., an average, median or maximum).
- Subject-level statistics may further be generated for a given subject, such as (for example) a total number of objects detected across all scans (e.g., associated with the given subject), a sum of longest dimension length of objects detected across all scans, and/or a cumulative volume of objects detected across all scans.
- the scan-specific, object-specific statistics, and/or subject-level statistics can be output.
- statistics can be stored in association with a time point and subject identifier. The statistics can then be tracked and compared over time to estimate a degree to which a medical condition is progressing, an efficacy of a given treatment and/or a prognosis for a given subject.
- a "whole-body imaging” refers to collecting a set of images that collectively depict a whole body of a subject.
- the set of images may include images associated with virtual "slices" spanning from a first end (e.g., anterior end) to a second end (e.g., posterior end) of the subject.
- the set of images may include virtual slices at least a brain region, a chest region, an abdominal region, and a pelvic region of the subject.
- an "image stack” refers to a set of images that depict a set of adjacent virtual slices.
- the set of images may be associated with (for example) different depths.
- the image stack may include (for example) at least 2 images or at least 3 images.
- the image stack may include a bottom image, middle image and top image, where a depth associated with the middle image is between the depths of the bottom and top images.
- the bottom and top images may be used to provide contextual information relevant to processing of the middle image.
- a "biological object” refers to a biological structure and/or one or more regions of interest associated with the biological structure.
- exemplary biological structures may include one or more biological cells, organs, and/or tissues of a subject.
- An object may include (but is not limited to) either these identified biological structures and/or similar structures within or connected to the identified biological structures (e.g., a plurality of tumorous cells and/or tissues identified within a larger body of normal cells, an organ and/or a tissue of a subject).
- a "mask” refers to an image or other data file that represents a surface area of a detected object or other region of interest.
- a mask may include pixels of nonzero intensity to indicate one or more regions of interest (e.g., one or more detected objects) and pixels of zero intensity to indicate background.
- a "binary mask” refers to a mask in which each pixel value is set to one of two values (e.g., 0 or 1). Zero intensity values can indicate that corresponding pixels are part of a background, and non-zero intensity values (e.g., values of 1) can indicate that corresponding pixels are part of a region of interest.
- a "3D mask” refers to a complete surface area of an object within a 3-dimensional image. Multiple binary masks of an object may be combined in order to form a 3D mask. The 3D mask may additionally provide information about an object's or other region of interest's volume, density, and position in space.
- Segmentation refers to determining a location and shape of an object or region of interest within an (2-dimensional or 3-dimensional) image or other data file. Segmentation may involve determining a set of pixels that depict an area or perimeter of the object within the image. Segmentation may involve generating a binary mask for an object. Segmentation may further involve processing multiple binary masks corresponding to the object in order to generate a 3D mask of the object.
- a “segmentation boundary” refers to an estimated perimeter of an object within an image.
- a segmentation boundary may be generated during a segmentation process where features of the image are analyzed to determine locations of the edges of the object.
- the segmentation boundary may further be represented by a binary mask.
- a “treatment” refers to a prescribing or administering a therapy, medication and/or radiation and/or prescribing or performing a surgical procedure with an aim of treating a medical condition (e.g., to slow progression of the medical condition, to stop progression of the medical condition, to reduce a severity and/or extent of the medical condition, and/or to cure the medical condition).
- FIG. 1A illustrates an exemplary interaction system for using collecting and processing medical images in order to using a multi-stage neural-network platform.
- the interaction system is specifically configured to locate and segment depictions of tumor biological structures and organs within the medical images.
- One or more imaging systems 101 can be used to generate one or more sets of medical images 102 (e.g., CT, MRI, and/or x-ray images).
- Imaging system(s) 101 can be configured to iteratively adjust a focus and/or position as multiple images are collected, such that each image in a set of images is associated with a different depth, position and/or perspective relative to other images in the set.
- Imaging system 201 can include a light source (e.g., a motorized and/or x-ray source), a light detector (e.g., camera), a lens, an objective, a filter, a magnet, shim coils (e.g., to correct inhomogeneities in the magnetic field), a gradient system (e.g., to localize a magnetic-resonance signal) and/or an RF system (e.g., to excite a sample and detect a resulting nuclear magnetic resonance signal).
- a light source e.g., a motorized and/or x-ray source
- a light detector e.g., camera
- a lens e.g., an objective, a filter, a magnet, shim coils (e.g., to correct inhomogeneities in the magnetic field)
- a gradient system e.g., to localize a magnetic-resonance signal
- an RF system e.g., to excite a sample
- Each set of images 102 can correspond to an imaging session, session date and subject.
- the subject can include a human or animal subject.
- the subject may have been diagnosed with a particular disease (e.g., cancer) and/or have one or more tumors.
- Each set of images 102 can depict an interior of a corresponding subject.
- each image depicts at least a region of interest of the subject (e.g., one or more organs, a chest region, an abdominal region, and/or a pelvic region).
- Each image of the set of images 102 may additionally have a same viewing angle, such that each depicts a plane that is parallel to other planes depicted in other images in the set.
- each of the set of images may correspond to a different distance along an axis that is non-parallel to (e.g., perpendicular to) the plane.
- the set of images 102 may correspond to a set of horizontal virtual slices that correspond to different positions along an anterior-posterior axis of the subject.
- the set of images 102 may be (e.g., collectively or individually) pre-processed.
- pre-processing can include normalizing pixel intensities, aligning images to each other or to another reference point/image, cropping images to a uniform size, and/or adjusting a contrast to differentiate between light and dark pixels.
- the set of images 102 may be processed to generate a 3-dimensional (3D) image structure.
- the 3D image structure may then be used to generate another set of images that correspond to a different angle for virtual slices.
- Some medical images collected by at least one of imaging system(s) 101 can include training images that are to be included in a training data set to train one or more neural networks (e.g., a bounding-box detection network and a segmentation network). Training images may be associated with other subjects as compared to a subject for which the trained network(s) are used.
- a bounding-box detection network e.g., a bounding-box detection network and a segmentation network.
- Each training image can have one or more characteristics of the medical images 102 described herein and can be associated with annotation data that indicates whether and/or where the image depicts a tumor and/or an organ.
- annotation data an image collected by imaging system 101 can be availed to (e.g., transmitted to) an annotator device 103.
- the image may be presented at annotator device 103, and an annotator user (e.g., such as a radiologist) may provide input using (for example) a mouse, track pad, stylus and/or keyboard that indicates (for example) whether the image depicts any tumor (or organ of one or more particular types); a number of tumors depicted in the image; a number of tumors that are being annotated (e.g., outlined) by the annotator; a perimeter of each of one or more tumors and/or organ of one or more particular types.
- an annotator user e.g., such as a radiologist
- an annotator user may provide input using (for example) a mouse, track pad, stylus and/or keyboard that indicates (for example) whether the image depicts any tumor (or organ of one or more particular types); a number of tumors depicted in the image; a number of tumors that are being annotated (e.g., outlined) by the annotator; a perimeter of
- Annotator device 103 may translate the input into (for example) label data 104.
- Each label data set can be associated with a corresponding image data set.
- Label data 104 can indicate whether an image contains a tumor and/or one or more particular types of organs. Label data 104 can further indicate where the tumor(s) and/or organs are located within the image by identifying spatial features (e.g., a perimeter and/or an area) of the tumor(s) and/or organs.
- label data 104 may include a set of coordinates that identify coordinates associated with a perimeter of each of a set of depicted tumors.
- label data 104 may include an indication as to which pixels (or voxels) in a training image correspond to a perimeter and/or area of the depicted tumor.
- label data 104 may (but need not) identify spatial features of all tumors, organs, and/or other biological objects depicted within the training image. For example, if a training image depicts 10 tumors, label data 104 may identify a perimeter for each of the 10 tumors, or for just 2 of the depicted tumors. In such cases, the incomplete subset of objects may (but need not) be selected based on a predefined selection criteria. For example, an annotator user may have been instructed to only mark depictions of tumors that meet a threshold tumor length and/or a threshold tumor volume and/or within a region of interest (e.g., within one or more specific organs).
- Label data 104 may further identify a tumor classification, which may represent a type, a location, and/or size of a tumor as identified based on input from an annotator. For example, a particular label may indicate that a depicted tumor is within a region of an image 102 as corresponding to a specific organ (e.g., a liver). Label data 104 may further include a probability that a particular label actually corresponds to a tumor or an organ of interest. Probability values can be calculated based on a tumor length, a tumor volume, a location with the subject, and/or a number of annotation users that identify the particular label as corresponding to a tumor or organ.
- a tumor classification which may represent a type, a location, and/or size of a tumor as identified based on input from an annotator. For example, a particular label may indicate that a depicted tumor is within a region of an image 102 as corresponding to a specific organ (e.g., a liver). Label data 104 may further include
- Label data 104 can be used to train one or more neural networks to detect, for each image in the image scan, each region that includes a depiction of a tumor or organ.
- Trained neural networks may be configured to delineate each region identified as including the depicted tumor or organ by processing image scans with an individual focus (e.g., to define specific regions for each individual image) using image stacks corresponding to each of the respective scans.
- a neural network processing system 120 can be configured to receive one or more sets of images 102 and corresponding label data 104. Each image of the one or more sets of images may initially be preprocessed by a preprocessing controller 105. For example, one or images depicting different regions of a subject may be stitched in order to generate an aggregated image depicting all of the different regions. In some instances, an aggregated image depicts a "whole body" view of a subject. As another example, one or more images may be scaled and/or cropped to a predefined size.
- one or more images may be aligned to another image included within the set or to a reference image (e.g., using an alignment marking in the image, a correlation-based technique, or an entropy-based technique).
- pixel intensities of one or more images may be adjusted via normalization or standardization methods. In some instances, the sets of images 102 do not undergo any preprocessing techniques.
- the preprocessed image(s) may be availed to a bounding-box detection controller 106, which can control and/or perform all of the functions and operations of a bounding-box detection network, as described herein.
- the bounding-box detection network may be a convolutional neural network, a de-convolutional neural network, or a three-dimensional neural network, that is configured to identify a region (e.g., bounding box) within the set of images 102 that includes a depiction of a tumor. Regions identified by the bounding-box detection neural network may include one or more rectangular or hyperrectangular regions.
- Bounding-box detection controller 106 can use the training images and corresponding annotations to train the bounding-box detection network to learn a set of detection parameters 107.
- Detection parameters 107 can include weights between nodes in a convolutional network.
- a penalty function may be set to introduce penalties when part of a detected bounding box fails to fully include a depiction of a tumor and/or when padding between a further horizontal and/or vertical point is less than a lower threshold and/or greater than an upper threshold.
- a penalty function is configured to penalize for boundary boxes that are larger or smaller than a predefined zoom range.
- a penalty function may include a focal loss.
- Focal loss (as defined in Lin, T.Y., Goyal, P., Girshick, R., He, K., Dollar, P. "Focal loss for dense object detection.”
- Training may be conducted and/or the bounding-box detection network can be defined using one or more fixed hyperparameters.
- hyperparameters can include a learning rate, number of nodes per layer, number of layers, etc.
- the bounding-box detection network can detect one or more bounding boxes 108 corresponding to potential tumor depictions within each of the images 102. Detection of a boundary box may include using an image stack for each image in order to locate a bounding box. For example, if 100 images were collected during a particular imaging session (sequentially numbered in accordance with imaging depth), an image stack can be defined to include a sixth image, seventh image and eighth image when detecting boundary boxes within the seventh image. The image stack may include more than one adjacent images in one or more directions (e.g., so as to include the third through eleventh images when detecting boundary boxes within the seventh image).
- the features are used to provide contextual information when determining whether and/or where one or more regions include a tumor and/or organ(s).
- the features can include three-dimensional features that extend across images within an image stack. For example, if a feature (e.g., a learned feature) is present in a similar location(s) throughout an entire image stack (e.g., a combination of a top virtual slice, a bottom virtual slice, and a central virtual slice), the bounding-box detection network may determine that the image region corresponding to (e.g., that includes) the feature represents a bounding box for a tumor.
- a feature e.g., a learned feature
- the bounding-box detection network may determine that the image region corresponding to (e.g., that includes) the feature represents a bounding box for a tumor.
- the bounding-box detection network may determine that the image region corresponding to the feature corresponds to background (i.e. any biological structure other than a tumor) of the image and does not indicate a bounding-box.
- the bounding-box detection network may additionally assign a probability value to each detected bounding box. If the probability value for a bounding box does not exceed a threshold, the bounding box may be discarded as background.
- the bounding-box detection network may further process each detected bounding box 108, such that the margins of the bounding box include at least an amount of padding (e.g., 10px, 15px, or another suitable amount) from each edge of the region corresponding to the tumor.
- the amount padding is predefined (e.g., so as to generate an initial box that intersects with pixels furthest to the left, top, right and bottom of the detected object depiction and extend the box using a predefined padding or until an image boundary is encountered).
- varying degrees of padding are added so as to maintain uniform bounding-box sizes.
- Bounding-box data 108 may include a definition of each bounding box (e.g., as two or more corner coordinates, coordinates of one or more edges, etc.) and/or one or more identifiers of a corresponding image or image set (e.g., an identifier of an image, subject, imaging date, etc.).
- a location of a boundary box in one image may relate to a location of a boundary box in another image.
- An image stack may be used to convey this dependence, though other processing may further or alternatively be used.
- an input to the bounding-box detection neural network may include an identification of each of one or more boundary boxes detected from a previously processed image (corresponding to a same imaging session and same subject).
- boundary-box outputs may be post-processed to modify (e.g., translate, resize, delete or add) a boundary-box detection corresponding to one image based on boundary-box detections from one or more other adjacent images.
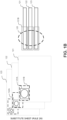
- FIG. 1B shows an exemplary image stack that depicts a set of bounding boxes for a single biological object 125.
- the image stack may include at least at least an image 121, an image 122, and an image 123 with each image of the image stack depicting a different axial perspective of a region of a subject.
- the image stack may include additional images not shown in the figure.
- Each image within the image stack may further include a bounding box delineating a possible location of biological object 125 within the particular image, such that each bounding box may be related to the corresponding bounding box(es) included in the other images within the image stack, because each bounding box identifies a presence of the same biological object 125.
- image 121 contains a bounding box 121A that covers at least a portion of image 121 and image 122 contains a bounding box 122A that covers at least a corresponding portion of image 122, such that bounding box 121A and bounding box 122A are related bounding boxes, and include regions that have been predicted to depict a first possible location and a second possible location of the biological object 125 from a first axial perspective and a second axial perspective, respectively.
- biological object 125 may not be detected within at least a subset (e.g., one or more) of images within the image stack, and the subset of images within the image stack may therefore not include a related bounding box for biological object 125.
- a surface area of bounding box 121A may be less than than a surface area of bounding box 122A, because a greater portion of the biological object 125 is estimated to be located within image 122.
- Locations of each of the related bounding boxes may additionally include one or more variations (e.g., in an x-plane, a y-plane, or both) that account for corresponding locations of the same biological object 125 from one or more different axial perspectives of the images within the image stack.
- bounding-box data 108 may be transmitted to a tumor segmentation controller 109, which can control and/or perform all of the functions or operations of a tumor segmentation network, as described herein.
- the tumor segmentation network may be trained using a training data set of at least the predicted bounding box data determined during training of the bounding-box detection network.
- a set of segmentation parameters 110 e.g. weights
- the tumor segmentation network can be (for example) a neural convolutional neural network or a three-dimensional neural network, that is configured to detect and segment depictions of tumors.
- the tumor segmentation network does not include a neural network and may instead use (for example) a clustering technique (e.g., K-means technique), histogram-based technique, edge-detection technique, region-growing technique and/or graph-partitioning technique.
- the tumor segmentation network may be configured to segment a tumor within each of the detected bounding boxes 108.
- bounding boxes 108 include (for example) one or more portions of the image that correspond to a bounding box(es), or an entirety of the image along with an identification (e.g., vertices' coordinates and/or edge coordinates) of the boundary box associated with the respective image.
- interim processing can be performed to generate a cropped set of images (e.g., referred to herein as detection areas) corresponding only to the region(s) of the images 102 enclosed by a bounding box 108.
- the tumor segmentation network can receive, as input, each corresponding detection area and process the detection areas separately.
- Detection areas may provide an focused view of a target tumor as depicted within FIG. 1B .
- detection areas may be of a predefined size.
- a detection area may include another set of regions adjacent to the region corresponding to a bounding box as additional padding in order to maintain a predefined size of the detection area.
- a bounding box is larger than the predefined size (e.g., 400 pixels or 200 pixels x 200 pixels)
- a region corresponding to a bounding box is partitioned into more than one windows (e.g., of and/or no larger than the predefined size), such that each window corresponds to a separate detection area.
- detection areas corresponding to a single bounding box may include overlapping portions of an image.
- a separate detection area may be defined for each image within the image stack.
- processing of the detection areas is performed by the bounding-box detection network prior to transmitting the bounding-box data 108 to the tumor segmentation controller 109.
- the tumor segmentation controller 109 implements the tumor segmentation network which is configured to further identify and assess features (e.g., variation in pixel intensities) for each detection area to identify a perimeter, set of edges and/or contours corresponding to the tumor.
- the features identified by the tumor segmentation network may have similarities to and/or may be different than features identified by the bounding-box detection network. Though both networks may be trained to identify regions of an image that correspond to a tumor, different features may be useful to detect a relatively small structure as compared to relatively large structure. In some instances, the tumor segmentation network may learn to detect a location of an object by (for example) analyzing pixel intensities, a pixel colors, and/or any other suitable image features.
- the tumor segmentation network may identify an edge of an object by analyzing an image to detect regions having high contrast, large intensity ranges and/or high intensity variations (e.g., as determined by comparing region-specific metrics to a predetermined threshold value).
- the tumor segmentation network may include nodes that correspond to different receptive fields (and thus that analyze representations of different collections of pixels). Thus, the network may learn to detect and use at least some different types of features.
- the tumor segmentation network may utilize the spatial context provided by other images within an image stack to identify the set of edges and/or contours corresponding to the tumor.
- the image stack can include (for example) three images, with a center image being the one in which tumors are to be detected.
- the tumor segmentation network may further generate a 2-dimensional (e.g., binary) tumor mask 110 corresponding to an entire surface area of the tumor within a given detection area using the identified edges and/or contours.
- a tumor mask 110 may be defined to have values of zero across pixels that are not identified as depicting any part of the tumor. Pixels that are identified as depicting a part of the tumor may be assigned a value of one (e.g., for a binary mask) or another value.
- a binary tumor mask 110 is generated for each image in an image stack, such that each binary tumor mask 110 corresponds to a different axial perspective of the tumor.
- a post-processing controller 111 can aggregate the set of binary tumor masks 110 to construct a 3D tumor mask 110 representing the tumor's 3-dimensional positioning and shape.
- the neural network processing system 120 can include an organ segmentation controller 111 configured to implement an organ-specific segmentation network.
- the organ-specific segmentation network can include (for example) a convolutional neural network and/or a three-dimensional neural network.
- Exemplary convolutional neural networks may include a VGG 16, a U-Net, and/or a ResNet18 network.
- the organ-specific segmentation network may be configured to analyze medical images corresponding to a subject and to segment one or more organs depicted within the images.
- each of one or more organ-specific segmentation networks can be configured (e.g., via parameters learned during training) to segment a particular type of organ.
- Exemplary organs of interest may be (for example) a liver, or a lung, or a kidney, or a pancreas, etc..
- the organ-specific segmentation network may be configured to perform a series of convolutions, such as depthwise and pointwise-convolutions, as part of a segmentation process. In such instances, one or more inflations along a particular dimension may further be performed.
- the particular dimension may be a third dimension, a fourth dimension, etc..
- the tumor segmentation network may also apply one or more filters, such as a replicate filter.
- organ segmentation controller 111 can control an organ-specific segmentation network configured to detect a particular type of organ.
- the organ-specific segmentation network can be trained using a training data set that includes training images and annotations that indicate which portions, within each of at least some of the training images, depict the particular type of organ.
- the training data set may be separate from the training data set used by the bounding-box detection network and the tumor segmentation network.
- the training data set can include multiple medical images and corresponding annotations and/or segmentation boundaries (e.g., generated by an annotator device 103) for the particular organ of interest.
- a set of organ segmentation parameters 112 (e.g. weights) may be learned during training.
- pre-processing controller 105 may transmit the same set of medical images 102 to both bounding-box detection controller 106 and organ segmentation controller 111.
- the trained organ-specific segmentation network can be used to process each of a set of images and/or preprocessed images to detect organs.
- Images used for detecting the particular type of organ may be the same as (or different than) the set of images 102 provided to bounding-box detection controller 106, such that the images are provided to organ segmentation controller 111 concurrently.
- the set of images may be divided into multiple (e.g., overlapping) subsets that include 1, 2 or 3 images. For example, subsets may be defined to have three images per subset and a shift of one image per subset.
- the images may undergo preprocessing in order to align the images into a 3D image depicting a "whole body" view of a subject.
- the organ-specific segmentation network can indicate whether a given image depicts a particular type of organ and further identifies a perimeter of a depiction of an organ.
- An output of the organ-specific segmentation network can include an organ mask 113 that (for example) has values of zero for pixels not depicting a particular type of organ and non-zero values for pixels depicting a particular type of organ.
- multiple 2-dimensional organ masks corresponding to different virtual slices (e.g., perspectives) of the organ of interest may be generated. These 2-dimensional organ masks may be aggregated to generate, for each organ, a 3D organ mask.
- Post-processing controller 114 can individually and/or collectively process tumor masks 110 and organ masks 113 to generate statistics and/or descriptors. For example, for each tumor, post-processing controller 114 can identify a volume of the tumor and can further identify whether the tumor is within any organ (and, if so, which type of organ). Post-processing controller 114 can further process (2- or 3-dimensional tumor masks) to calculate subject-level tumor statistics, such as a total tumor volume and/or density for a subject and/or a sum of longest dimensions. In some instances, a sum of longest dimensions may be a sum of longest diameters, such that a longest diameter is calculated for each tumor and summed to form the total sum of longest diameters. In some instances, post-processing controller 114 can identify a percentage of a mass of the tumor in comparison to a mass of the corresponding organ of interest as another exemplary statistic.
- Neural network processing system 120 can output the descriptors and/or statistics to a user device. Further, a representation of one or more tumor masks and/or one or more organ masks may be transmitted. For example, an image may be generated that includes a depiction of an original image with overlays that identify a perimeter of each detected tumor and/or organ for a subject. In some instances, post-processing controller 114 may further process (e.g., or transmit to another model and/or controller for processing) the subject-level tumor statistics to generate a score(s) for a probability of survival using one or more treatment methods.
- post-processing controller 114 may further process (e.g., or transmit to another model and/or controller for processing) the subject-level tumor statistics to generate a score(s) for a probability of survival using one or more treatment methods.
- a first network may be trained to detect brain lesions and other networks can be trained to detect various brain regions, such that it can be determined in which brain region a lesion is located.
- alternative embodiments may replace at least the tumor segmentation network with a different segmentation neural network trained to segment other biological structures within the medical images.
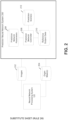
- FIG. 2 illustrates an exemplary prediction neural network system 200 that can use one or more output elements (e.g., organ masks) from the neural network processing system 120 in order to predict a score for a probability of survival of the subject based on an efficacy of a treatment method.
- Efficacy may be determined by one or more characteristics (e.g., such as a progression of disease, measured in terms of tumor volume or density) of the subject prior to administering the treatment method.
- a neural network processing system 120 may avail one or more medical images 202 and organ masks 204 to the prediction neural network system 200.
- Images 202 may be a subset of the same images used by a bounding-box detection network and a tumor segmentation network as discussed in Section III.
- images 202 may additionally include corresponding metrics, such as a count, a volume, and/or a location of tumors.
- Organ masks 204 may additionally include at least one or more organ masks generated by an organ-specific segmentation neural network.
- the neural network processing system 120 may additionally avail tumor masks (not depicted in figure) that had been generated by the tumor segmentation network to the prediction neural network system 200.
- a prediction network controller 206 may be configured to control and/or perform any of the operations, as described herein, of a prediction neural network, which may be a neural network that is different from the bounding-box detection network and the tumor segmentation network described in the neural network processing system 120.
- Prediction network controller 206 can train the prediction neural network to predict survival or mortality rates associated with one or more treatment methods for a subject, using images corresponding to one or more sets of comparable pairs of subjects.
- a pair of subjects may be considered comparable if (for example) a first subject and a second subject have both received a same treatment method and the first subject has a different period of survival after receiving the treatment compared to the second subject.
- a pair of subjects are not considered comparable if the first subject has an first period of survival that is inconclusive, such that the first period of survival was only tracked for a particular time period (e.g., for a length of a clinical trial) but no additional data related to the first period of survival was collected after the particular time period, and the second subject has a second period of survival that is at least after the particular time period for which the first period of survival was tracked. Therefore, not every possible pairing of subjects may be considered comparable.
- Training data elements may include at least one or more input images or metrics (e.g., a cumulative volume for all detected biological objects) associated with each subject of the comparable pairs of subjects and a metric measuring a period of survival for each subject after a treatment has been administered.
- a score and/or rank based on the period of survival for each subject may also be included within the training data elements. Scores and/or ranks may correspond to a likelihood of survival for a subject using the administered treatment.
- Training may utilize a loss function that maximizes a difference in the score during training between the subjects of the pair, such that a first subject is determined as having a best chance of survival using the treatment compared to a second subject.
- Reference subject data 210 may be a database that includes at least an administered treatment method, a period of survival, and one or more subject-level metrics (e.g., a number of tumors, a location of tumors, a SLD or volume of tumors) for each subject of a plurality of reference subjects, such that each subject of the plurality of reference subjects may further include a subject-level statistic such as a rank based on the period of survival for a single subject in comparison to the plurality of reference subjects.
- subject-level metrics e.g., a number of tumors, a location of tumors, a SLD or volume of tumors
- the rank may be a value k ranging from 1 to a total number of subjects within the plurality of reference subjects that predicts a relative mortality risk (e.g., represented as a likelihood that a subject survives after treatment, or an expected period of survival for the subject) for each of the plurality of reference subjects.
- the period of survival for each subject can be measured from either a diagnosis of a disease or a start of a treatment period for the subject. In some instances, at least some of the plurality of reference subjects may be deceased.
- Reference subject data 210 may specifically group reference subjects by the administered treatment method.
- the prediction neural network may select one or more reference subjects that meet the criteria for comparability with the subject of interest from the reference subject data 210 to form at least one or more pair of subjects, such that each pair comprises the subject of interest and a different reference subject.
- the prediction network may then determine a prediction score 212 for the given subject by comparing the subject of interest to each of the selected reference subject(s).
- Prediction score 212 may be any suitable metric (e.g., a percentage or a time period) that indicates a probability and/or length of survival for the subject of interest.
- Comparisons to reference subjects may involve comparing one or more characteristics associated with each reference subject prior to receiving the treatment method to the same characteristics associated with the subject of interest.
- a ranking may be generated for the one or more pairs of subjects, such that a rank value of a subject may indicate the subject's likelihood of survival. For example, a subject with a lowest rank value may be predicted as having a worst likelihood of survival using the treatment method.
- Rank values may be determined from a total tumor count, volume, or density and/or location(s) of tumors for each subject of the one or more pairs of subjects.
- Prediction score 212 may be calculated for the subject of interest based on at least where the subject of interest falls within the ranking in comparison to the reference subjects. It can then be predicted whether and/or to what extent the treatment method may be effective for the subject of interest.
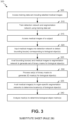
- FIG. 3 illustrates a flowchart of an exemplary process 300 for using a multi-stage neural-network platform to process medical images.
- Process 300 may be performed using one or more computing systems.
- Training elements include a set of medical images (e.g., a CT image) corresponding to a subject and annotation data identifying the presence of biological objects within the set of medical images.
- Annotation data includes a label indicating a presence of a biological object and (if the biological object is present) a general location (e.g., a liver, a kidney, a pancreas, etc.) of the biological object.
- Annotation data may be incomplete, such that the presence of one or more biological objects is not included.
- a medical image may correspond to two or more different sets of annotation data based on annotations from at least two or more radiologists.
- different sets of annotation data corresponding to a same image include discrepancies such as an identification, or lack thereof, of one or more additional biological objects and/or a difference in an annotation size and/or an object perimeter of one or more biological objects.
- the training data set may have been generated using one or more imaging systems and one or more annotation devices as disclosed in Section III.
- a multi-stage neural network platform is trained using the training data set.
- the multi-stage neural network platform can include a boundary-box detection network and a biological structure segmentation network.
- the neural network platform additionally includes one or more organ-specific segmentation networks.
- the bounding-box detection network can be trained to detect bounding boxes for areas corresponding to biological objects.
- training the bounding-box detection network involves defining a bounding box for each region corresponding to a biological object within an image.
- Each of the biological objects can be further labelled in order to indicate that the bounded region corresponds to a given object (e.g., when multiple objects are identified across the set of images.
- a label may also include a location of the biological object within the subject.
- the biological structure segmentation network (which is similar to a tumor segmentation network described in FIG. 1A ) is trained to identify boundaries and a total area of depicted biological objects.
- Training of the segmentation network may include accessing an additional training data set.
- the additional training data set may include all of the training data elements of an initially accessed training data set along with labelled segmentation data generated by a radiologist.
- Labelled segmentation data may include either a binary mask or a 3-dimensional mask of a biological object.
- the segmentation network is trained to further correct false positive (e.g., mislabeling a background region as an object) generated by the detection network.
- Training may further be performed using a pixel-wise cross entropy loss, a Dice coefficient loss, or a compound loss.
- a loss function can be based on (but is not limited to) a mean square error, a median square error, a mean absolute error, and/or an entropy-based error.
- a validation data set may also be accessed to assess a performance of the multiple-stage neural network platform in concurrence with its training.
- the validation data set may be another set of medical images and corresponding annotation data that is separate from the training data set. If a target accuracy is reached for both the identification and segmentation of biological objects within the medical images for the validation data set, the training session may be terminated.
- a set of medical images corresponding to a subject and/or a singular imaging session is accessed.
- the set of medical images may depict a chest region, an abdominal region, and/or a "whole body" region of the subject.
- a first medical image corresponding to a chest region, a second medical image corresponding to an abdominal region, and a third medical image corresponding to a pelvic region may be stitched to generate a fourth medical image corresponding to a "whole body" region of the subject.
- Medical images may be generated using one or more imaging systems as disclosed in Section III.A.
- the one or more imaging systems may be configured to generate images corresponding to different perspectives of a region of the subject.
- multiple medical images may depict distinct virtual slices of a particular region.
- the set of medical images is availed to a bounding-box detection network.
- Each image is analyzed to identify one or more bounding boxes.
- Each bounding box can identify an image region corresponding to a target biological object.
- Analysis of an image may comprise the use of a first virtual slice corresponding to a region and/or a view above the image and a second virtual slice corresponding to a region and/or a view below the image, such that the first virtual slice and the second virtual slice provide additional spatial context for determining a region corresponding to the target biological object.
- a bounding box may include a set of margins (e.g., for example, a padding of 10px) surrounding the identified region corresponding to the target biological object. If more than one region corresponding to a biological object is identified within an image, the bounding-box detection network may identify more than one bounding boxes for the image.
- margins e.g., for example, a padding of 10px
- one or more bounding boxes corresponding to the medical images are availed to a segmentation network.
- the segmentation network can crop the medical images to generate a set of detection areas depicting a zoomed-in view of each region corresponding to a bounding box.
- Detection areas may be assigned a uniform size, such that a detection area may include additional padding along with a region corresponding to a bounding box if the region is smaller than the uniform size.
- the region corresponding to a bounding box may be divided into more than one detection areas.
- a region corresponding to a bounding box may be partitioned into a set of sliding-windows, such that some of the windows include an overlapping subset(s) of the region.
- the biological structure segmentation network can assess image features of the detection area in order to locate a biological object and generate a first binary mask corresponding to the biological object. If multiple bounding boxes are identified for a given image, the biological-structure segmentation network can identify an area within each of the bounding boxes that depicts a corresponding biological object. A binary mask may be generated for each biological object. In some instances, more than one binary mask may be generated for a biological object using images depicting different perspectives of the biological object.
- one or more binary masks corresponding to the same object can be processed (e.g., via post-processing) to generate a 3D mask.
- Each of the one or more binary masks and each 3D mask can correspond to a single biological object.
- multiple 3D masks may be generated for a given subject's imaging session, with each 3D mask corresponding to one of multiple biological objects.
- Processing a set of binary masks can include aggregating the binary masks to form a 3D structure of the object as described in Section III.D.
- the segmentation network may adjust a region of one or more binary masks to account for the overlapping regions and/or elect to not include one or more binary masks that may depict a redundant perspective.
- the medical image (e.g., as accessed from block 315) corresponding to the one or more masks is availed to one or more organ-specific segmentation networks to determine a location of a biological object.
- Each organ-specific segmentation network may correspond to a particular organ of interest (e.g., a liver, a kidney, etc.) and may be trained to identify the particular organ of interest within an image.
- An organ-specific segmentation network may receive and process the set of images to identify a location of a corresponding organ of interest. If the corresponding organ of interest is detected, the network may additionally generate a mask of the corresponding organ.
- the generated organ mask may be a binary mask and/or a 3-dimensional mask.
- one or more masks are analyzed to determine one or more metrics.
- the metric(s) can include a characteristic of the biological object(s).
- the metric(s) can include an object count, a location and/or type of an object, a count of objects for a particular location and/or type, a size of one or more objects, an average size of the objects, a cumulative size of the objects, and/or a number of objects within each of one or more types of tumors.
- the metric(s) include one or more spatial attributes of the object, such as a volume of an object, a length of an object for a longest dimension, and/or a cross-sectional area of an object.
- One or more spatial attributes may further be used to generate subject-level statistics for all objects detected within a given subject.
- Subject-level statistics may include (for example) a cumulative object volume for a given subject, a sum of object lengths for a longest dimension for a given subject (e.g., such as a sum of longest diameters), and/or a cumulative cross-sectional area of detected objects for a given subject.
- a metric is compared to another metric associated with medical images of a same subject collected during a previous imaging date to generate a relative metric (e.g., percentage or absolute change).
- the metric(s) may be output (e.g., transmitted to another device and/or presented to a user).
- the output may then be analyzed by (for example) a medical professional and/or radiologist.
- the metric(s) are output along with a depiction of one or more masks.
- the metric(s) can be used to predict (e.g., at a computing system using one or more stored rules and/or via a user) a diagnosis and/or a treatment efficacy for the subject.
- subject-level statistics such as a cumulative biological-object volume may be used to determine a disease stage (e.g., by determining a range that corresponds to the cumulative volume).
- a relative change in biological-object volume and/or count can be compared to one or more thresholds to estimate whether a current and/or previous treatment was effective.
- the metrics may be used to predict a score for one or more treatment methods based on a probability of survival for a subject calculated by a prediction neural network.
- the score may be predicted using one or more spatial attributes, such as a cumulative object volume and/or a sum of a length of longest dimensions for the object(s).
- one or more scores for a probability of survival may be generated to rank a set of subjects and/or treatments.
- a score for a subject and/or treatment may be compared to one or more scores of another subject(s) and/or another treatment(s) in order to determine the rankings.
- a subject-specific ranking may identify at least one or more subjects with a highest probability of survival for a given treatment relative to other prior subjects that have been administered the given treatment.
- a treatment-specific ranking may identify a treatment(s) with a highest likelihood of success (e.g., survival) for a given subject relative to other treatments.
- the subject-specific ranking and/or the treatment-specific ranking are also returned as output.
- Tumor segmentation from whole body CT scans was carried out using an automated method of detection and segmentation consisting of a bounding-box detection network (discussed in Step 1 below) and tumor segmentation network (discussed in Steps 2-3).
- Step 1 Bounding-Box Detection
- a bounding-box detection network having a RetinaNet architecture (referred to herein as a "detection network”) was used to predict whether regions of a medical image depict a tumor, generate bounding boxes identifying general spatial locations of tumors within the regions of the image, and provide a probability of a site label for each general spatial location depicting a tumor.
- a modification was made from published RetinaNet architectures in that all convolutions were changed to separable convolutions.
- an image stack comprising a set of three consecutive axial CT slices (with no fixed resolution) was used as input for the detection network.
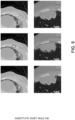
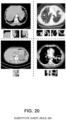
- FIG. 4 illustrates an example set of images depicting (i) a pre-processed whole body scan of a subject; (ii) a bounding box identifying a tumor predicted as corresponding to a Mediastinum site and a bounding box identifying a tumor predicted as corresponding to a Lungs site within an axial slice of a subject; and (iii) a bounding box identifying a tumor predicted as corresponding to a Liver site within another axial slice of a subject.
- the detection network outputted (i) proposal coordinates of bounding boxes which represent the general spatial locations of tumors on the middle axial slice; and (ii) the probability of each site label (Lungs, Mediastinum, Bones, Liver, other) category.
- the outputs were concatenated to have bounding boxes in each slice of the CT scan as shown in FIG. 4 .
- Each of the three consecutive axial CT slices were of size 512x512.
- Training was performed on 48,000 radiologist-annotated images for axial CT slices with bounding boxes around radiologist identified RECIST target and non-target lesions, with corresponding site locations from 1,202 subjects from the IMPower150 clinical trial. Hyperparameters included a batch size 0.16, learning rate 0.01, and use of the optimizer ADAM.
- the detection network was validated on the IMpower131 clinical trial (969 subjects). Lesion-level sensitivity on RECIST reads was 0.94. Voxel-level sensitivity was 0.89.
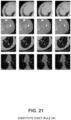
- a tumor segmentation network (e.g., which, for this example, was implemented as a probabilistic U-Net) was used to identify an area within each bounding box identified by the detection network (e.g., and/or portions corresponding to regions within which a mask value was positive and/or equal to 1) that depicts a tumor.
- each of the 6 images correspond to a bounding box identified by the detection network, and each of the outlined areas identify a tumor segmentation as determined using the tumor segmentation network.
- a modification was made from published probabilistic U-Net architectures in that all convolutions were replaced by separable convolutions.
- the tumor segmentation network was configured to average 16 predictions for the area within each bounding box to mimic inter-reader variability and decrease the variance on the predictions. Therefore, each prediction corresponded to a different method or criteria that different radiologists use when annotating (or choosing not to annotate) a same lesion and the 16 average predictions were then used to generate a "consensus" by averaging predictions for each voxel within an image and determining each voxel as a portion of a tumor if the average predictions were larger than .5, or some other threshold value.
- Three axial slices of 0.7x0.7mm size (i.e., 256x256 pixels) were used as input for the tumor segmentation network, such that each of the axial slices correlate to a detected bounding box that has undergone one or more interim pre-processing techniques (e.g., cropping).
- the tumor segmentation network outputted a segmentation of the middle axial slice which identified the area within each bounding box that depicts a tumor.
- the tumor segmentation network was trained on 67,340 images with tumor masks from 1,091 subjects in IMpower150 from volumetric RECIST reads from one radiologist and 2D RECIST.
- Example hyperparameters included a batch size of 4, a learning rate of 0.0001, and use of the optimizer ADAM.
- the example network was validated on IMpower131 (969 subjects; 51,000 256x256 images with 0.7x0.7mm images). A dice score (using the average over 16 predictions from the network) of 0.82 was calculated assuming no false positives in the validation dataset (51,000 images from IMpower131).
- the segmentations outputted from the tumor segmentation network in Step 2 were used to confirm/correct the general spatial locations of tumors proposed by the bounding-box detection network in Step 1.
- a subject's whole body CT scan was taken as input for processing by separate organ segmentation networks.
- the organ segmentation networks consisted of multiple convolutional neural networks.
- Each of the separate organ segmentation networks was trained to perform organ-specific segmentations and return organ masks identifying the locations of the organs in the whole body CT scan.
- Organ-specific segmentation was accomplished by training a different organ segmentation network for each of the organs of interest, for example, right lung, left lung, liver, spleen, kidneys, bones and pancreas.
- Each of the organ-specific segmentation networks had a 3D U-Net architecture that included batch normalization and leaky ReLU activation at each layer.
- the organ-specific segmentation networks for the kidneys, spleen and pancreas used publicly available datasets for training, specifically to complete Kits19 (such as the dataset in Heller, N. et al. "The KiTS19 Challenge Data: 300 Kidney Tumor Cases with Clinical Context, CT Semantic Segmentations, and Surgical Outcomes.” (2019 ), which is hereby incorporated by reference in its entirety for all purposes) for kidneys and medical decathlon for spleen and pancreas (as described in Simpson, A. L. et al. "A large annotated medical image dataset for the development and evaluation of segmentation algorithms.” (2019 ), which is also hereby incorporated by reference in its entirety for all purposes).
- Ground truth for the bone segmentation network was based on morphological operations.
- the input was a 256x256x256 CT volume (of a concatenation of the axial slices from Steps 1-2) resampled to a voxel size of 2x2x2mm.
- the output of each of the organ-specific segmentation networks was an organ mask of the same size for each organ.
- Ground truth for each network was a 256x256x256 corresponding organ mask with same voxel size.
- CT scans, organ-specific segmentation, and the techniques described herein were further used in conjunction with the automated detection and segmentation of tumors to generate a number of other predictions and estimates to assist clinicians in deciding which treatments to prescribe.
- survival chances of a subject were predicted, given each of a number of potential treatments for a given oncology indication, by models according to one of a number of metrics, in terms of overall survival, progression free survival, or other similar metrics.
- the models outputted a ranking of treatments for a given subject to identify the treatment that provided the longest survival time.
- the models outputted a ranking of subjects to identify the subjects likely to experience the longest survival times on a given therapy.
- Input to the network was a CT scan and organ masks (e.g., Liver, Lungs, Kidneys, Bones, Pancreas and Spleen) obtained using one or more organ-specific segmentation networks for both subjects A and B.
- organ-specific segmentations network's architecture was an inflated VGG16, ResNet18, or similar network, with separable convolutions outputting a score vector having N elements (e.g., 1000) for each subject.
- Inflation was generally performed in accordance with the technique described in Carreira, J and Zisserman, A.. "Que Vadis, Action Recognition? A New Model and the Kinetics Dataset" In: CVPR
- Performance for the automated method on the training and test data sets was determined using RECIST and manual annotations of a "whole body" tumor burden. RECIST reads were performed on both data sets as a baseline calculation of a number of lesions and a volume of all lesions identified for each subject.
- FIG. 6A shows a correlation plot comparing a number of lesions derived by RECIST reads (shown on the x-axis of the plot) and a number of lesions determined by the automated detection and segmentation method (shown on the y-axis) for the training data set (IMPower 150).
- FIG. 6B shows another plot comparing a tumor burden (e.g., measured as a total volume of all identified lesions) derived by RECIST (shown on the x-axis of the plot) and a tumor burden for the tumors identified by the automated method (shown on the y-axis of the plot).
- a tumor burden e.g., measured as a total volume of all identified lesions
- FIGs. 7A-7B depict similar correlation plots for the testing data set (IMPower131) with an average number of lesions determined using RECIST reads depicted on the x-axis and a number of lesions determined using the automated method depicted on the y-axis.
- the standard deviation and standard error calculated based on differences between the two techniques' predictions of the number of lesions were 6.05 and 0.24, respectively; and the standard deviation and standard error calculated based on differences between the two techniques' predictions of total lesion volume were 5.22e+01 with a standard error of 2.40, respectively.
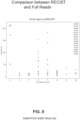
- FIG. 8 depicts a plot where the y-axis corresponds to a number of lesions determined by a radiologist (e.g., for a full read) and the x-axis corresponds to a number of lesions determined by RECIST for a set of subjects.
- Each point in the plot represents a subject within the training data set, for a total of 15 subjects that underwent both full reads and RECIST reads.
- the plot shows little agreement between RECIST and the full reads, as the full reads identify a greater amount of lesions compared to the RECIST reads.
- the standard deviation and standard error calculated based on differences between the two techniques' predictions was 6.64 and a standard error of 0.30.
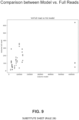
- FIG. 9 depicts a correlation plot between a total lesion volume determined by a full read performed by a radiologist (shown on the y-axis) and a total lesion volume determined by the automated method (shown on the x-axis), such that each point represents a subject within the IMPower150 training data set. As shown in the plots, multiple reads were calculated for each subject from a set of training subjects. FIGs.
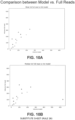
- 10A-10B show plots comparing a mean and median total lesion volume determined by the automated method (shown on the x-axes, respectively) and a mean and median total lesion volume determined by a full read for each subject (shown on the y-axes, respectively). Similar to FIGs. 8-9 , each point in both of the plots represent a subject within the training data set. As depicted in the plots, the automated method generally identified a same or greater volume of lesions than the full reads.
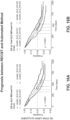
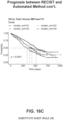
- Prognosis data was also collected for subjects represented in the training and testing data sets, such that a number of identified lesions and a calculated total volume of lesions were used to predict a probability of survival for subjects over a given time period. More specifically, subjects in the training data set were assigned to particular clusters based on various statistics of lesions detected using the RECIST technique, and a survival curve was calculated for each cluster to demonstrate whether various statistics were predictive of survival.
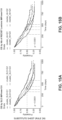
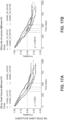
- FIGs. 11A-14B show Kaplan-Meier curves depicting exemplary prognosis data for the training data set.
- FIG. 11A illustrates a probability of survival for subjects that have been clustered based on a SLD calculation for lesions identified by RECIST.
- FIG. 11B illustrates a probability of survival for subjects that have been clustered based on a number of lesions identified by RECIST.
- Y-axes of the plots correspond to the probability of survival and the x-axes correspond to an elapsed time period (e.g., measured in days).
- Clusters were determined such that a first quartile (Q1) corresponds to subjects with a number of lesions and/or a SLD score in the top 25%, a second quartile (Q2) corresponds to subjects within the next 25%, a third quartile (Q3) corresponds to subjects within the following 25%, and a fourth quartile (Q4) corresponds to subjects within the bottom 25%.
- Q1 a first quartile
- Q2 a second quartile
- Q3 corresponds to subjects within the next 25%
- a third quartile (Q3) corresponds to subjects within the following 25%
- a fourth quartile (Q4) corresponds to subjects within the bottom 25%.
- subjects within the first quartile of the diameter sum SLD and subjects within the first quartile of the number of lesions have a lower probability of survival compared to subjects within the fourth quartile.
- the spatial statistics of automatically detected lesions appear to be predictive of survival prognosis.
- FIG. 11C instead shows a Kaplan-Meier curve that illustrates a probability of survival for subjects as determined from the disclosed automated method.
- FIG. 11C shows a plot depicting a probability of survival for subjects over a period of time, as determined by the automated method.
- the subjects were clustered based on a total SLD for an entire tumor burden.
- FIGs 12A-12B further depict plots for probability of survival for subjects based on a total volume and a number of identified lesions as also determined by the automated method. It is evident that a high tumor burden, measured by either a high volume of lesions or a high number of lesions, is correlated to lower probabilities of survival for subjects.
- FIGs. 13A-13B show a set of Kaplan-Meier curves depicting survival percentages for subjects.
- Subject groups were defined based on a volume of lung lesions (shown in the corresponding A plots) and a number of lung lesions (shown in the corresponding B plots).
- survival curves differed across subject groups, suggesting that lesion volume and lesion number were predictive of survival metrics.
- 14A-14B shows a survival percentages for subjects based on the spread of lesions (e.g., metastasis) to lung and bone regions of a subject, respectively. Survival percentages were reported as higher when lesions were not present within either the lung or bone regions for a subject.
- lesions e.g., metastasis
- FIGs. 15A-19 similarly depict Kaplan-Meier curves for exemplary prognosis data pertaining to the testing data set.
- FIGs. 15 , 16 , 17 , and 18 correspond to same label variables (e.g., a y-axis corresponding to a probability of survival and a x-axis corresponding to an elapsed number of days) and methods as FIGs. 10 , 11 , 12 , and 13 , respectively.
- FIG. 19 shows a probability of survival for subjects based on the metastasis of a kidney region for subjects in the test data set.
- the testing data set included different images from a different set of subjects than a training data set and was used to externally validate the results derived from hold-out portions of the training data set.
- the plots depicted in FIGs. 15A-19 depict prognoses for subjects that show greater correlations between a rate of survival and a location(s) and/or total amount or volume of tumors when determined by the automated method in comparison to RECIST or full reads.
- This Implementation uses the automated method of bounding-box detection and tumor segmentation to identify a full three-dimensional tumor burden on whole body diagnostic CT scans in subjects with advanced metastatic disease (i.e. lesions spread across multiple organs).
- the method differs from Implementation 1 in that organ-specific segmentation was not used to identify locations of the segmented tumors or generate organ masks.
- the implemented method was based on the bounding-box detection network implemented as a RetinaNet for detection and tagging of lesions, followed by the tumorsegmentation network implemented as an ensemble of Probabilistic UNets enabling a segmentation of the detected lesions.
- the presented work was developed using 2 multi-site clinical trials with over 84,000 identified RECIST lesions from 2,171 advanced Non-Small Cell Lung Cancer subjects across 364 clinical sites.
- the method accounted for inter-reader variability and heterogeneity of scan acquisitions across hospital sites.
- Tumors identified using the automated bounding-box detection and tumors segmentation techniques described in this disclosure were compared to manually identified RECIST tumors and manually segmented target lesions at the voxel level.
- the fully automatic estimates of baseline tumor burden were compared to radiologists' manual measurements with regard to the prognostic value of tumor burden for subjects' overall survival.
- Results indicate state-of-the-art detection and segmentation performance for the RECIST target lesions on a hold-out set of 969 subjects, comprising over 35,000 tumors. Further, the results indicate that whole body tumor burden may have clinical utility as a prognostic factor of subject's overall survival time.
- the proposed method may be used to streamline tumor assessments in diagnostic radiology workflows, and if further developed, may potentially enable radiologists to assess response to therapy when applied sequentially.
- the detection step utilized a bounding-box detection network, implemented as a RetinaNet, and identified both target- and non-target lesions using bounding boxes and lesion tags.
- RetinaNet uses a single-stage detection approach that provides for very fast object detection. Given that Whole Body CT scans often contain more than 200 axial slices, efficient processing was highly advantageous.
- a tumor segmentation network implemented as a set of probabilistic UNets, produced an ensemble of plausible axial lesion segmentations.
- Probabilistic UNet [8] enables a memory efficient generative segmentation that allows to sample segmentation variants from a low-dimensional latent space. Use of probabilistic UNet for segmentation is further described at Kohl, S., et al. "A probabilistic U-Net for segmentation of ambiguous images.” Advances in Neural Information Processing Systems (NIPS 2018) pp. 6965-6975 (2018 ), which is hereby incorporated by reference in its entirety for all purposes. The probabilistic UNet was thus selected mimic reader-to-reader annotation variability.
- This part of the model allowed for the generation of ensembles that trade-off between inter-reader variability and overall agreement across radiologists' segmentations.
- the post-processing step joined the predicted 2D segmentations to produce unified whole-body 3D tumor masks. Further, post-processing also addressed the variability in image acquisition parameters (which led to different information limits and varying signal-to-noise ratios across scans) encountered in our multi-site dataset. Tumors detected via this automated technique were compared to those detected via a manual technique, where a radiologist outlined select target lesions and marked bounding boxes around non-target lesions.
- tumor location tags were highly imbalanced across organs with lung lesions representing 45% and 40% of the training- and test data sets, respectively, but for which 128 locations accounted for less than 0.5% of tags. Focal loss was used to deal with the class imbalance.
- a RetinaNet with a ResNet-50-FPN was used to detect tumors axially.
- the maximum number of objects per image was set to 32 in the non-maximum suppression and the number of anchors to 9.
- 32 represents an upper bound for the number of tumors that may reasonably be expected within a single axial slice.
- the model was configured to receive as input three axial slices fed as three feature channels. Due to the low prevalence of many tags, classes were simplified to lungs, liver, bones, mediastinum and other locations.
- the RetinaNet was applied sequentially to all axial slices.
- the predicted bounding boxes were expanded to the previous- and next slices to minimize false negatives.
- Varying ⁇ in the training loss allowed provision of different weights to the Kullback-Leibler divergence term in the loss, and hence giving different importance to spanning the latent space of segmentation variants. This parameter allowed the generation of tumor segmentation variants that mimic human reader variability or the generation of consensus segmentations.
- a training dataset was constructed using RECIST target lesions segmentations from 2 radiologists per scan and 3D segmentation for some scans.
- the images were resampled to 0.7x0.7mm in-plane resolution and patches of 256x256x3 pixels were constructed around these lesions.
- the previous and next slices were used as spatial context. Larger patches than the input were adopted, 180x180 pixels of 0.5x0.5mm in-plane resolution. This selection was made, as the data to be assessed represented advanced-stage cancers, where the data depicts many large lesions.
- the dataset consisted of over 84k lesions from a total of 14,205 Diagnostic Computed Tomography scans from two randomized clinical trials. The training and test data were split per trial.
- a first trial (clinical trial NCT02366143, described in Socinski, M.A., et al. "Atezolizumab for First-Line Treatment of Metastatic Nonsquamous NSCLC.”
- N Engl J Med 378, 2288-2301 (2018 ) included 1,202 available advanced stage non-squamous Non-Small Cell Lung Cancer subjects.
- This first-trial dataset was used for training.
- a second trial (clinical trial NCT02367794) included 969 advanced stage squamous Non-Small Cell Lung Cancer subjects and was used as a hold-out set.
- the data was collected across 364 unique sites (238 in training set, 237 for test set), and a total of 27 different radiologists provided annotations.
- the data offers significant subject-, image acquisition-, and inter-reader variability.
- the RetinaNet for tumor detection and tagging was implemented using PyTorch and the ADAM optimizer.
- the ResNet-50-FPN was initialized using an ImageNet pretrained model.
- the learning rate was set 1e -4 and the batch size to 16.
- the network was trained for 416,000 iterations.
- the Probabilistic UNets were implemented using PyTorch and the ADAM optimizer.
- the learning rate was set to 1e-5 and the batch size was set to 4.
- the networks were trained for 50 epochs.
- Detection & Segmentation performance The average lesion and class-level sensitivities per image for detection in Table 2 and Table 1. The sensitivities were obtained with an average of 0.89 "False positives" (FPs) per image. Due to the incompleteness of the RECIST annotations, these FPs may actually be non-annotated lesions. The average of the sensitivities were derived at 0.5, 1, 2 and 4 FPs per image (88.4%) as in Yan, K., et al.: MULAN: Multitask Universal Lesion Analysis Network for Joint Lesion Detection, Tagging, and Segmentation.
- statistics included the average voxel-level sensitivity in the test set and the average error on the estimated longest dimensions of the RECIST lesions.
- the right panel of FIG. 22 shows the Kaplan-Meier plot based on the empirical quartiles of the by-model extracted baseline SLD (for the subjects in the test set).
- the left panel shows the Kaplan-Meier plot based on empirical quartiles for SLD derived by RECIST.
- the results exemplify strong performance of the multi-stage segmentation platform.
- the fully automatic algorithm successfully identified and performed 3D segmentation of tumors on standard diagnostic whole body CT scans.
- the methodology demonstrated strong performance for detection and segmentation compared to a radiologist, and importantly, worked well for tumors in multiple different organs.
- the technique may be a powerful support tool for radiologists by providing initial tumor burden assessments for their review, which should improve accuracy, reproducibility and speed.
- the algorithm generated metrics such as full-body tumor volume (typically too time consuming for radiologists to assess), which may be valuable as a prognostic tool or novel endpoint for clinical trials, as well as providing a more complete view of a subjects' disease for use in clinical radiology practice.
- Some embodiments of the present disclosure include a system including one or more data processors.
- the system includes a non-transitory computer readable storage medium containing instructions which, when executed on the one or more data processors, cause the one or more data processors to perform part or all of one or more methods and/or part or all of one or more processes disclosed herein.
- Some embodiments of the present disclosure include a computer-program product tangibly embodied in a non-transitory machine-readable storage medium, including instructions configured to cause one or more data processors to perform part or all of one or more methods and/or part or all of one or more processes disclosed herein.
- circuits, systems, networks, processes, and other components may be shown as components in block diagram form in order not to obscure the embodiments in unnecessary detail.
- well-known circuits, processes, algorithms, structures, and techniques may be shown without unnecessary detail in order to avoid obscuring the embodiments.
Landscapes
- Engineering & Computer Science (AREA)
- Physics & Mathematics (AREA)
- Theoretical Computer Science (AREA)
- General Physics & Mathematics (AREA)
- Computer Vision & Pattern Recognition (AREA)
- Health & Medical Sciences (AREA)
- General Health & Medical Sciences (AREA)
- Medical Informatics (AREA)
- Life Sciences & Earth Sciences (AREA)
- Quality & Reliability (AREA)
- Radiology & Medical Imaging (AREA)
- Nuclear Medicine, Radiotherapy & Molecular Imaging (AREA)
- Biomedical Technology (AREA)
- Heart & Thoracic Surgery (AREA)
- Veterinary Medicine (AREA)
- Animal Behavior & Ethology (AREA)
- Surgery (AREA)
- Molecular Biology (AREA)
- Geometry (AREA)
- Public Health (AREA)
- Pathology (AREA)
- Biophysics (AREA)
- Apparatus For Radiation Diagnosis (AREA)
- Magnetic Resonance Imaging Apparatus (AREA)
- Image Analysis (AREA)
- Image Processing (AREA)
Applications Claiming Priority (4)
| Application Number | Priority Date | Filing Date | Title |
|---|---|---|---|
| US201962952008P | 2019-12-20 | 2019-12-20 | |
| US202062990348P | 2020-03-16 | 2020-03-16 | |
| EP20807986.3A EP4078510B1 (de) | 2019-12-20 | 2020-10-27 | Automatisierte tumoridentifizierung und segmentierung mit medizinischen bildern |
| PCT/US2020/057542 WO2021126370A1 (en) | 2019-12-20 | 2020-10-27 | Automated tumor identification and segmentation with medical images |
Related Parent Applications (2)
| Application Number | Title | Priority Date | Filing Date |
|---|---|---|---|
| EP20807986.3A Division-Into EP4078510B1 (de) | 2019-12-20 | 2020-10-27 | Automatisierte tumoridentifizierung und segmentierung mit medizinischen bildern |
| EP20807986.3A Division EP4078510B1 (de) | 2019-12-20 | 2020-10-27 | Automatisierte tumoridentifizierung und segmentierung mit medizinischen bildern |
Publications (2)
| Publication Number | Publication Date |
|---|---|
| EP4546261A2 true EP4546261A2 (de) | 2025-04-30 |
| EP4546261A3 EP4546261A3 (de) | 2025-07-16 |
Family
ID=73452323
Family Applications (2)
| Application Number | Title | Priority Date | Filing Date |
|---|---|---|---|
| EP25163330.1A Pending EP4546261A3 (de) | 2019-12-20 | 2020-10-27 | Automatisierte tumoridentifizierung und segmentierung mit medizinischen bildern |
| EP20807986.3A Active EP4078510B1 (de) | 2019-12-20 | 2020-10-27 | Automatisierte tumoridentifizierung und segmentierung mit medizinischen bildern |
Family Applications After (1)
| Application Number | Title | Priority Date | Filing Date |
|---|---|---|---|
| EP20807986.3A Active EP4078510B1 (de) | 2019-12-20 | 2020-10-27 | Automatisierte tumoridentifizierung und segmentierung mit medizinischen bildern |
Country Status (6)
| Country | Link |
|---|---|
| US (1) | US12299890B2 (de) |
| EP (2) | EP4546261A3 (de) |
| JP (1) | JP7757283B2 (de) |
| KR (1) | KR20220117236A (de) |
| CN (1) | CN114830175A (de) |
| WO (1) | WO2021126370A1 (de) |
Families Citing this family (29)
| Publication number | Priority date | Publication date | Assignee | Title |
|---|---|---|---|---|
| CN114830175A (zh) | 2019-12-20 | 2022-07-29 | 基因泰克公司 | 利用医学图像的自动肿瘤识别与分割 |
| US11636592B2 (en) * | 2020-07-17 | 2023-04-25 | International Business Machines Corporation | Medical object detection and identification via machine learning |
| US11580337B2 (en) * | 2020-11-16 | 2023-02-14 | International Business Machines Corporation | Medical object detection and identification |
| IT202100014342A1 (it) * | 2021-06-01 | 2022-12-01 | Martini Paolo Tinazzi | Software per la caratterizzazione di un’immagine bidimensionale ottenuta mediante un esame tramite immagini |
| JP7684006B2 (ja) * | 2021-06-07 | 2025-05-27 | レイセオン カンパニー | 画像内での臓器分割 |
| CN113538530B (zh) * | 2021-07-09 | 2024-03-01 | 深圳市深光粟科技有限公司 | 一种耳部医学图像分割方法、装置、电子设备及存储介质 |
| CN113554642B (zh) * | 2021-08-12 | 2022-03-11 | 北京安德医智科技有限公司 | 对病灶鲁棒的脑区定位方法及装置、电子设备和存储介质 |
| CN114027794B (zh) * | 2021-11-09 | 2023-06-30 | 新乡医学院 | 基于DenseNet网络的病理图像的乳腺癌区域检测方法及系统 |
| WO2023096642A1 (en) | 2021-11-24 | 2023-06-01 | Bluware, Inc. | Interactive qualitative-quantitative live labeling for deep learning artificial intelligence |
| CN114170206B (zh) * | 2021-12-13 | 2023-01-24 | 上海派影医疗科技有限公司 | 兼顾空间信息相关性的乳腺病理图像癌变性质判读方法及装置 |
| WO2023114364A1 (en) * | 2021-12-17 | 2023-06-22 | Bluware, Inc. | Probability cube to probability cube enhancement for deep learning artificial intelligence |
| CN114565761B (zh) * | 2022-02-25 | 2023-01-17 | 无锡市第二人民医院 | 一种基于深度学习的肾透明细胞癌病理图像肿瘤区域的分割方法 |
| TWI839758B (zh) * | 2022-06-20 | 2024-04-21 | 緯創資通股份有限公司 | 醫療影像的處理方法及處理醫療影像的運算裝置 |
| WO2024010882A1 (en) * | 2022-07-06 | 2024-01-11 | The Johns Hopkins University | System and method for coarse-to-fine segmentation of images to detect kidney and renal growths |
| CN115439473B (zh) * | 2022-11-04 | 2023-04-07 | 北京精诊医疗科技有限公司 | 一种基于交互分组注意机制的多期相占位分类方法 |
| US12175679B2 (en) * | 2022-11-29 | 2024-12-24 | Merck Sharp & Dohme Llc | 3D segmentation of lesions in CT images using self-supervised pretraining with augmentation |
| CN120390938A (zh) * | 2022-12-15 | 2025-07-29 | 株式会社Lg化学 | 图像处理装置和方法 |
| CN116188783B (zh) * | 2023-03-02 | 2025-07-29 | 安徽工程大学 | 一种轻量化网络的肺部影像分割模型及方法 |
| CN115919464B (zh) * | 2023-03-02 | 2023-06-23 | 四川爱麓智能科技有限公司 | 肿瘤定位方法、系统、装置及肿瘤发展预测方法 |
| CN116416239B (zh) * | 2023-04-13 | 2024-03-12 | 中国人民解放军海军军医大学第一附属医院 | 胰腺ct图像分类方法、图像分类模型、电子设备及介质 |
| CN116563539A (zh) * | 2023-04-28 | 2023-08-08 | 平安科技(深圳)有限公司 | 肿瘤图像分割方法、装置、设备及计算机可读存储介质 |
| CN116703837B (zh) * | 2023-05-24 | 2024-02-06 | 北京大学第三医院(北京大学第三临床医学院) | 一种基于mri图像的肩袖损伤智能识别方法及装置 |
| EP4475071A1 (de) * | 2023-06-06 | 2024-12-11 | Guerbet | Verfahren zur bestimmung einer wahrscheinlichkeit des vorhandenseins mindestens einer kandidatenläsion in mindestens einem medizinischen bild |
| WO2024263893A1 (en) * | 2023-06-23 | 2024-12-26 | Genentech, Inc. | Machine learning enabled region-specific lesion segmentation |
| CN116758048B (zh) * | 2023-07-06 | 2024-02-27 | 河北大学 | 基于Transformer的PET/CT瘤周特征提取系统及提取方法 |
| KR20250010266A (ko) | 2023-07-12 | 2025-01-21 | 고려대학교 산학협력단 | 교차 모달리티 이미지 변환 및 신경초종/달팽이관 분할 네트워크 프레임워크 |
| WO2025116417A1 (ko) * | 2023-11-29 | 2025-06-05 | 주식회사 엘지화학 | 이미지 처리 장치 및 그의 동작 방법 |
| CN118096773B (zh) * | 2024-04-29 | 2024-08-02 | 东莞市人民医院 | 一种瘤内及瘤周生境分析方法、装置、设备及存储介质 |
| CN119445126B (zh) * | 2025-01-12 | 2025-05-16 | 杭州健培科技有限公司 | 一种肝脏肿瘤分割的方法及装置 |
Family Cites Families (11)
| Publication number | Priority date | Publication date | Assignee | Title |
|---|---|---|---|---|
| JP5395823B2 (ja) * | 2011-02-15 | 2014-01-22 | 富士フイルム株式会社 | 手術支援装置、手術支援方法および手術支援プログラム |
| US11094058B2 (en) * | 2015-08-14 | 2021-08-17 | Elucid Bioimaging Inc. | Systems and method for computer-aided phenotyping (CAP) using radiologic images |
| WO2018082084A1 (zh) * | 2016-11-07 | 2018-05-11 | 中国科学院自动化研究所 | 融合全卷积神经网络和条件随机场的脑肿瘤自动分割方法 |
| EP3714467A4 (de) * | 2017-11-22 | 2021-09-15 | Arterys Inc. | Inhaltsbasiertes wiederauffinden von bildern für die läsionsanalyse |
| US10593051B2 (en) * | 2017-12-20 | 2020-03-17 | International Business Machines Corporation | Medical image registration guided by target lesion |
| US11461891B2 (en) * | 2018-03-06 | 2022-10-04 | Case Western Reserve University | Phenotyping tumor infiltrating lymphocytes on hematoxylin and eosin (HandE) stained tissue images to predict recurrence in lung cancer |
| RU2668699C1 (ru) * | 2018-05-21 | 2018-10-02 | федеральное государственное автономное образовательное учреждение высшего образования "Санкт-Петербургский политехнический университет Петра Великого" (ФГАОУ ВО "СПбПУ") | Интеллектуальный способ диагностики и обнаружения новообразований в легких |
| HUE058907T2 (hu) * | 2018-06-14 | 2022-09-28 | Kheiron Medical Tech Ltd | Második olvasó javaslat |
| US11462325B2 (en) * | 2018-09-29 | 2022-10-04 | Roche Molecular Systems, Inc. | Multimodal machine learning based clinical predictor |
| CN110223287A (zh) * | 2019-06-13 | 2019-09-10 | 首都医科大学北京友谊医院 | 一种可提高乳腺癌早期诊断率的方法 |
| CN114830175A (zh) | 2019-12-20 | 2022-07-29 | 基因泰克公司 | 利用医学图像的自动肿瘤识别与分割 |
-
2020
- 2020-10-27 CN CN202080087958.2A patent/CN114830175A/zh active Pending
- 2020-10-27 KR KR1020227020883A patent/KR20220117236A/ko active Pending
- 2020-10-27 JP JP2022536546A patent/JP7757283B2/ja active Active
- 2020-10-27 WO PCT/US2020/057542 patent/WO2021126370A1/en not_active Ceased
- 2020-10-27 EP EP25163330.1A patent/EP4546261A3/de active Pending
- 2020-10-27 EP EP20807986.3A patent/EP4078510B1/de active Active
-
2022
- 2022-06-16 US US17/842,542 patent/US12299890B2/en active Active
Non-Patent Citations (6)
| Title |
|---|
| HELLER, N. ET AL., THE KITS19 CHALLENGE DATA: 300 KIDNEY TUMOR CASES WITH CLINICAL CONTEXT, CT SEMANTIC SEGMENTATIONS, AND SURGICAL OUTCOMES, 2019 |
| KOHL, S. ET AL.: "A probabilistic U-Net for segmentation of ambiguous images.", ADVANCES IN NEURAL INFORMATION PROCESSING SYSTEMS (NIPS 2018), 2018, pages 6965 - 6975 |
| LIAO, F., LIANG: "Evaluate the malignancy of pulmonary nodules using the 3D deep leaky noisy-or network", IEEE TRANS. NEURAL NETW. LEARN. SYST., vol. 11769, 2019, pages 194 - 202 |
| LIN, T.Y.GOYAL, P.GIRSHICK, R.HE, K.DOLLAR, P.: "Focal loss for dense object detection", JCCV, vol. 2017, 2017, pages 2980 - 2988 |
| SIMPSON, A. L. ET AL., A LARGE ANNOTATED MEDICAL IMAGE DATASET FOR THE DEVELOPMENT AND EVALUATION OF SEGMENTATION ALGORITHMS, 2019 |
| SOCINSKI, M.A. ET AL.: "Atezolizumab for First-Line Treatment of Metastatic Nonsquamous NSCLC", N ENGL J MED, vol. 378, 2018, pages 2288 - 2301, XP055716260, DOI: 10.1056/NEJMoa1716948 |
Also Published As
| Publication number | Publication date |
|---|---|
| CN114830175A (zh) | 2022-07-29 |
| US12299890B2 (en) | 2025-05-13 |
| JP2023507109A (ja) | 2023-02-21 |
| EP4078510A1 (de) | 2022-10-26 |
| US20220319008A1 (en) | 2022-10-06 |
| WO2021126370A1 (en) | 2021-06-24 |
| JP7757283B2 (ja) | 2025-10-21 |
| EP4078510B1 (de) | 2025-04-30 |
| EP4078510C0 (de) | 2025-04-30 |
| EP4546261A3 (de) | 2025-07-16 |
| KR20220117236A (ko) | 2022-08-23 |
Similar Documents
| Publication | Publication Date | Title |
|---|---|---|
| US12299890B2 (en) | Automated tumor identification and segmentation with medical images | |
| CN112529834B (zh) | 病理图像模式在3d图像数据中的空间分布 | |
| US11443433B2 (en) | Quantification and staging of body-wide tissue composition and of abnormal states on medical images via automatic anatomy recognition | |
| NL1024869C2 (nl) | Werkwijze en systeem voor het meten van voor ziekte relevante weefselveranderingen. | |
| Zhou et al. | Automatic multiscale enhancement and segmentation of pulmonary vessels in CT pulmonary angiography images for CAD applications | |
| Ge et al. | Computer‐aided detection of lung nodules: false positive reduction using a 3D gradient field method and 3D ellipsoid fitting | |
| US8335359B2 (en) | Systems, apparatus and processes for automated medical image segmentation | |
| JP2023116486A (ja) | 高速ニューラルネットワークベースの画像セグメント化および放射性医薬品摂取判定のためのシステムおよび方法 | |
| CN113711271A (zh) | 用于通过正电子发射断层摄影进行肿瘤分割的深度卷积神经网络 | |
| US9014456B2 (en) | Computer aided diagnostic system incorporating appearance analysis for diagnosing malignant lung nodules | |
| EP2987114B1 (de) | Verfahren und system zur bestimmung eines phänotyps von neoplasma in einem menschen- oder tierkörper | |
| Xu et al. | Quantifying the margin sharpness of lesions on radiological images for content‐based image retrieval | |
| El-Baz et al. | Appearance analysis for the early assessment of detected lung nodules | |
| Chlebus et al. | Deep learning based automatic liver tumor segmentation in CT with shape-based post-processing | |
| US20080021301A1 (en) | Methods and Apparatus for Volume Computer Assisted Reading Management and Review | |
| US20240303822A1 (en) | Machine-learning based segmentation of biological objects in medical images | |
| Sun et al. | Juxta-vascular nodule segmentation based on flow entropy and geodesic distance | |
| Allapakam et al. | RETRACTED ARTICLE: A hybrid feature pyramid network and Efficient Net-B0-based GIST detection and segmentation from fused CT-PET image | |
| Diciotti et al. | The ${LoG} $ characteristic scale: A consistent measurement of lung nodule size in CT imaging | |
| Nannapaneni et al. | Enhanced Image-based Histopathology Lung Cancer Detection | |
| CN111265234A (zh) | 一种肺部纵膈淋巴结的性质判定方法及系统 | |
| Qian et al. | Knowledge-based automatic detection of multitype lung nodules from multidetector CT studies | |
| Van Ginneken | Computer‐aided diagnosis in thoracic computed tomography | |
| Thaseen et al. | MRI Image Linked Pixel Edge Segmentation with Least Correlated Weight Factor for Lung Tumor Identification Using Machine Learning Technique. | |
| Kunkyab | Radiomics for early detection of tumour recurrence in patients treated with Lung Stereotactic Ablative Radiotherapy (SABR) |
Legal Events
| Date | Code | Title | Description |
|---|---|---|---|
| PUAI | Public reference made under article 153(3) epc to a published international application that has entered the european phase |
Free format text: ORIGINAL CODE: 0009012 |
|
| STAA | Information on the status of an ep patent application or granted ep patent |
Free format text: STATUS: THE APPLICATION HAS BEEN PUBLISHED |
|
| AC | Divisional application: reference to earlier application |
Ref document number: 4078510 Country of ref document: EP Kind code of ref document: P |
|
| AK | Designated contracting states |
Kind code of ref document: A2 Designated state(s): AL AT BE BG CH CY CZ DE DK EE ES FI FR GB GR HR HU IE IS IT LI LT LU LV MC MK MT NL NO PL PT RO RS SE SI SK SM TR |
|
| REG | Reference to a national code |
Ref country code: DE Ref legal event code: R079 Free format text: PREVIOUS MAIN CLASS: G06T0007110000 Ipc: G06T0007000000 |
|
| PUAL | Search report despatched |
Free format text: ORIGINAL CODE: 0009013 |
|
| AK | Designated contracting states |
Kind code of ref document: A3 Designated state(s): AL AT BE BG CH CY CZ DE DK EE ES FI FR GB GR HR HU IE IS IT LI LT LU LV MC MK MT NL NO PL PT RO RS SE SI SK SM TR |
|
| RIC1 | Information provided on ipc code assigned before grant |
Ipc: G06T 7/00 20170101AFI20250606BHEP Ipc: G06T 7/11 20170101ALI20250606BHEP |
|
| STAA | Information on the status of an ep patent application or granted ep patent |
Free format text: STATUS: REQUEST FOR EXAMINATION WAS MADE |
|
| 17P | Request for examination filed |
Effective date: 20251015 |