EP4509618A1 - Refractory material state visualization method, refractory material repair method, and refractory material state visualization device - Google Patents
Refractory material state visualization method, refractory material repair method, and refractory material state visualization device Download PDFInfo
- Publication number
- EP4509618A1 EP4509618A1 EP23827214.0A EP23827214A EP4509618A1 EP 4509618 A1 EP4509618 A1 EP 4509618A1 EP 23827214 A EP23827214 A EP 23827214A EP 4509618 A1 EP4509618 A1 EP 4509618A1
- Authority
- EP
- European Patent Office
- Prior art keywords
- point
- map
- refractory
- distance
- unit
- Prior art date
- Legal status (The legal status is an assumption and is not a legal conclusion. Google has not performed a legal analysis and makes no representation as to the accuracy of the status listed.)
- Pending
Links
Images




Classifications
-
- C—CHEMISTRY; METALLURGY
- C21—METALLURGY OF IRON
- C21B—MANUFACTURE OF IRON OR STEEL
- C21B7/00—Blast furnaces
- C21B7/24—Test rods or other checking devices
-
- C—CHEMISTRY; METALLURGY
- C21—METALLURGY OF IRON
- C21C—PROCESSING OF PIG-IRON, e.g. REFINING, MANUFACTURE OF WROUGHT-IRON OR STEEL; TREATMENT IN MOLTEN STATE OF FERROUS ALLOYS
- C21C5/00—Manufacture of carbon-steel, e.g. plain mild steel, medium carbon steel or cast steel or stainless steel
- C21C5/28—Manufacture of steel in the converter
- C21C5/42—Constructional features of converters
- C21C5/44—Refractory linings
- C21C5/441—Equipment used for making or repairing linings
-
- C—CHEMISTRY; METALLURGY
- C21—METALLURGY OF IRON
- C21C—PROCESSING OF PIG-IRON, e.g. REFINING, MANUFACTURE OF WROUGHT-IRON OR STEEL; TREATMENT IN MOLTEN STATE OF FERROUS ALLOYS
- C21C5/00—Manufacture of carbon-steel, e.g. plain mild steel, medium carbon steel or cast steel or stainless steel
- C21C5/28—Manufacture of steel in the converter
- C21C5/42—Constructional features of converters
- C21C5/46—Details or accessories
- C21C5/4673—Measuring and sampling devices
-
- F—MECHANICAL ENGINEERING; LIGHTING; HEATING; WEAPONS; BLASTING
- F27—FURNACES; KILNS; OVENS; RETORTS
- F27B—FURNACES, KILNS, OVENS OR RETORTS IN GENERAL; OPEN SINTERING OR LIKE APPARATUS
- F27B1/00—Shaft or like vertical or substantially vertical furnaces
- F27B1/10—Details, accessories or equipment specially adapted for furnaces of these types
- F27B1/12—Shells or casings; Supports therefor
-
- F—MECHANICAL ENGINEERING; LIGHTING; HEATING; WEAPONS; BLASTING
- F27—FURNACES; KILNS; OVENS; RETORTS
- F27B—FURNACES, KILNS, OVENS OR RETORTS IN GENERAL; OPEN SINTERING OR LIKE APPARATUS
- F27B1/00—Shaft or like vertical or substantially vertical furnaces
- F27B1/10—Details, accessories or equipment specially adapted for furnaces of these types
- F27B1/28—Arrangements of monitoring devices, of indicators, of alarm devices
-
- F—MECHANICAL ENGINEERING; LIGHTING; HEATING; WEAPONS; BLASTING
- F27—FURNACES; KILNS; OVENS; RETORTS
- F27D—DETAILS OR ACCESSORIES OF FURNACES, KILNS, OVENS OR RETORTS, IN SO FAR AS THEY ARE OF KINDS OCCURRING IN MORE THAN ONE KIND OF FURNACE
- F27D1/00—Casings; Linings; Walls; Roofs
- F27D1/16—Making or repairing linings ; Increasing the durability of linings; Breaking away linings
-
- F—MECHANICAL ENGINEERING; LIGHTING; HEATING; WEAPONS; BLASTING
- F27—FURNACES; KILNS; OVENS; RETORTS
- F27D—DETAILS OR ACCESSORIES OF FURNACES, KILNS, OVENS OR RETORTS, IN SO FAR AS THEY ARE OF KINDS OCCURRING IN MORE THAN ONE KIND OF FURNACE
- F27D21/00—Arrangement of monitoring devices; Arrangement of safety devices
- F27D21/0021—Devices for monitoring linings for wear
-
- G—PHYSICS
- G01—MEASURING; TESTING
- G01N—INVESTIGATING OR ANALYSING MATERIALS BY DETERMINING THEIR CHEMICAL OR PHYSICAL PROPERTIES
- G01N29/00—Investigating or analysing materials by the use of ultrasonic, sonic or infrasonic waves; Visualisation of the interior of objects by transmitting ultrasonic or sonic waves through the object
- G01N29/04—Analysing solids
- G01N29/06—Visualisation of the interior, e.g. acoustic microscopy
-
- G—PHYSICS
- G01—MEASURING; TESTING
- G01N—INVESTIGATING OR ANALYSING MATERIALS BY DETERMINING THEIR CHEMICAL OR PHYSICAL PROPERTIES
- G01N29/00—Investigating or analysing materials by the use of ultrasonic, sonic or infrasonic waves; Visualisation of the interior of objects by transmitting ultrasonic or sonic waves through the object
- G01N29/04—Analysing solids
- G01N29/11—Analysing solids by measuring attenuation of acoustic waves
-
- C—CHEMISTRY; METALLURGY
- C21—METALLURGY OF IRON
- C21C—PROCESSING OF PIG-IRON, e.g. REFINING, MANUFACTURE OF WROUGHT-IRON OR STEEL; TREATMENT IN MOLTEN STATE OF FERROUS ALLOYS
- C21C5/00—Manufacture of carbon-steel, e.g. plain mild steel, medium carbon steel or cast steel or stainless steel
- C21C5/28—Manufacture of steel in the converter
- C21C5/42—Constructional features of converters
- C21C5/44—Refractory linings
- C21C2005/448—Lining wear indicators
-
- G—PHYSICS
- G01—MEASURING; TESTING
- G01N—INVESTIGATING OR ANALYSING MATERIALS BY DETERMINING THEIR CHEMICAL OR PHYSICAL PROPERTIES
- G01N2291/00—Indexing codes associated with group G01N29/00
- G01N2291/02—Indexing codes associated with the analysed material
- G01N2291/023—Solids
- G01N2291/0232—Glass, ceramics, concrete or stone
-
- G—PHYSICS
- G01—MEASURING; TESTING
- G01N—INVESTIGATING OR ANALYSING MATERIALS BY DETERMINING THEIR CHEMICAL OR PHYSICAL PROPERTIES
- G01N2291/00—Indexing codes associated with group G01N29/00
- G01N2291/04—Wave modes and trajectories
- G01N2291/044—Internal reflections (echoes), e.g. on walls or defects
Definitions
- the present invention relates to a refractory state visualization method, a refractory repair method, and a refractory state visualization apparatus.
- An industrial furnace such as a blast furnace has a furnace wall that generally includes a steel shell, an unshaped refractory, and a refractory brick (shaped refractory) in this order from the outside to the inside.
- a refractory brick in a furnace bottom of a blast furnace is ceaselessly exposed to molten iron even during an outage and hence wears significantly. Wear of a refractory brick or generation of cracks in a refractory brick shortens the life of a furnace body.
- Patent Literatures 1 and 2 there have been conventionally proposed methods for measuring the remaining thickness of a refractory brick.
- Patent Literatures 1 and 2 merely measure the remaining thickness of a refractory brick.
- the present invention has been made in view of the foregoing and has an object of visualizing the state of a refractory such as a refractory brick.
- the present inventors found, through an earnest study, that employing the configuration described below enables achievement of the above-mentioned object, and the invention has been completed.
- the present invention provides the following [1] to [4].
- the present invention can visualize the state of a refractory such as a refractory brick.
- state visualization apparatus for a refractory (also simply referred to as “state visualization apparatus”).
- state visualization apparatus covers both a refractory state visualization method and a refractory repair method.
- a furnace wall of a conventional blast furnace has a three layer structure including a steel shell, an unshaped refractory, and a refractory brick (shaped refractory) in this order, most of blast furnaces recently have a cooling stave (CS) structure.
- CS cooling stave
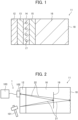
- FIG. 1 is a cross-sectional view showing part of a furnace wall 11 when viewed from an upper side of a CS-structure blast furnace.
- FIG. 1 is a cross-sectional view of the furnace wall 11 constituting a furnace bottom.
- the furnace wall 11 of the CS-structure blast furnace (hereinafter, also simply referred to as "blast furnace") has a five layer structure. That is, the furnace wall 11 includes a steel shell 12, an unshaped refractory 13, a copper plate 14, an unshaped refractory 15, and a refractory brick 16 (shaped refractory) in this order from the outside to the inside (from the left side to the right side in FIG. 1 ).
- a stamp material is suitably used as the unshaped refractory 13 and the unshaped refractory 15.
- a stamp material and a castable refractory can be adopted as the unshaped refractories and are different from each other in composition and installation method.
- a stamp material is made of a carbon material as a main component and is rammed with a rammer
- a castable refractory is made of alumina cement as a main component and is hardened through drying.
- refractory brick 16 As the refractory brick 16, a high alumina brick, a silicon carbide brick, or another conventionally known brick for a blast furnace is used. The refractory brick 16 is exposed to molten iron (not shown) to thereby wear out.
- the copper plate 14 is provided with a plurality of holes 17.
- the blast furnace is cooled by water passing through the holes 17 from the upper side toward the lower side of the blast furnace.
- the remaining thickness of a refractory brick is sometimes estimated by monitoring temperature of the refractory brick with use of a thermocouple and calculating heat transfer based on the temperature.
- a CS-structure blast furnace has the foregoing cooling structure and is thus excellent in heat insulation, it may be difficult to estimate the remaining thickness of a refractory brick through calculation of heat transfer.
- a state visualization apparatus 1 described below is preferably used.
- the state, including the remaining thickness, of a refractory brick can be found accordingly.
- FIG. 2 is a schematic view showing the state visualization apparatus 1 along with the furnace wall 11.
- the state visualization apparatus 1 includes at least an input unit 101, a reception unit 102, and a control unit 103.
- An example thereof is constituted of an impact hammer as the input unit 101, an accelerometer as the reception unit 102, and an amplifier, an oscilloscope and a personal computer (PC) as the control unit 103.
- PC personal computer
- FIG. 3 is a perspective view showing the furnace wall 11 with reception units 102 being attached to the steel shell 12.
- FIG. 3 also omits other constituent members (such as the unshaped refractory 13) of the furnace wall 11 than the steel shell 12 and the refractory brick 16.
- FIG. 3 shows the X axis direction, the Y axis direction, and the Z axis direction.
- the Z axis direction coincides with the thickness direction of the refractory brick 16.
- the reception units 102 i.e., accelerometer, are provided on a surface of the steel shell 12 and are arranged, in one example, at four points (point A1, point A3, point C1, and point C3) on the surface of the steel shell 12 so as to form a rectangular shape as shown in FIG. 3 .
- the surface of the steel shell 12 (at each point at which the reception unit 102 is arranged, for instance) is struck by the input unit 101, i.e., an impact hammer to thereby apply vibration to the furnace wall 11 including the refractory brick 16.
- the input unit 101 i.e., an impact hammer to thereby apply vibration to the furnace wall 11 including the refractory brick 16.
- an elastic wave 21 is input to the furnace wall 11.
- the point, on the surface of the steel shell 12, struck by the input unit 101 may be called “struck point" for convenience.
- the elastic wave 21 propagates though the interior of the furnace wall 11 and is reflected by an end 18 of the refractory brick 16 to thereby turn into a reflection wave 22.
- the reception unit 102 i.e., an accelerometer, receives (detects) this reflection wave 22 as an acceleration signal.
- a point, on the surface of the steel shell 12, at which the reception unit 102 for receiving the reflection wave 22 is arranged may be called “measurement point" for convenience.
- control unit 103 performs when a map (described later) is generated in a case where the measurement point and the struck point are points C1 and A1, respectively.
- the control unit 103 analyzes the acceleration signal received by the reception unit 102 to thereby determine the frequency characteristic.
- the acceleration signal is converted into an amplitude spectrum (frequency spectrum) to thereby determine a resonant frequency (peak frequency).
- conversion model the relationship (hereinafter, also referred to as "conversion model") between the resonant frequency and the thickness of the refractory brick 16 (at reflection position of the elastic wave 21) is preliminarily determined by simulation (e.g., elastic wave propagation simulation) or the like.
- the conversion model is stored in the control unit 103 or an external storage apparatus (not shown) in advance.
- the control unit 103 inputs the resonant frequency determined from the acceleration signal into the conversion model to thereby determine the distance characteristic that indicates the relationship between an amplitude and a distance from the measurement point (point C1).
- FIG. 4 A conceptual diagram of an amplitude spectrum obtained from the reflection wave 22 (acceleration signal) in this case is shown in FIG. 4 .
- FIG. 4 is a conceptual diagram of an amplitude spectrum (measurement point: point C1, struck point: point A1); the vertical axis shows an amplitude (intensity), and the horizontal axis shows a frequency.
- a peak on the low frequency side indicates a peak due to reflection by the end 18, whereas a peak on the high frequency side indicates a peak due to reflection by the crack 19.
- the amplitude spectrum of FIG. 4 is applied to the foregoing conversion model to be thereby converted to a one-dimensional distance characteristic graph (hereinafter, also referred to as "distance characteristic graph") showing the relationship between the amplitude and the distance from the measurement point (distance in Z axis direction).
- distance characteristic graph A conceptual diagram of the distance characteristic graph is shown in FIG. 5 .
- FIG. 5 is a conceptual diagram of the distance characteristic graph (measurement point: point C1, struck point: point A1), and the vertical axis shows an amplitude (intensity), and the horizontal axis shows a distance from the measurement point.
- the number of vibration applications to the furnace wall 11 with use of the input unit 101 may be one, or two or more (for instance, three times).
- the control unit 103 preferably determines a distance characteristic graph based on the acceleration signal for each time.
- the control unit 103 next draws a map based on the distance characteristic graph of FIG. 5 .
- the map is preferably a two-dimensional map or a three-dimensional map.
- heat maps ( FIGS. 6 to 8 ) exemplify the map.
- a heat map is one type of visualization graph which expresses each value of a two-dimensional numerical data (matrix data) as a color or color gradation.
- the map shows likelihood of a reflection position in the refractory brick 16 as described later and is exemplified by the following two types (a) and (b).
- a distance from a measurement point is plotted in the vertical axis and the horizontal axis, and an amplitude (intensity) is drawn in color gradation.
- the amplitude (intensity) may be expressed as a hue.
- the heat map may be a three-dimensional heat map or a two-dimensional heat map of an arbitrary cross section selected by a user of a state visualization apparatus 1A.
- the vertical axis is preferably normalized in each distance characteristic graph.
- the normalization may be carried out by use of the maximum value of the vertical axis or by use of a sum of absolute values of values in the vertical axis.
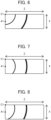
- FIG. 6 is a conceptual diagram of a map based on the reception result of the reception unit 102 at point C1 (measurement point: point C1, struck point: point A1) and shows an XZ plane passing point C1 and point A1 in the furnace wall 11 shown in FIG. 3 .
- control unit 103 draws the distance characteristic graph of FIG. 5 in an XZ plane having the origin O of the graph as point C1, for instance. Obtained in this manner is the map ( FIG. 6 ) in which the degree of the intensity (vertical axis) at each distance (horizontal axis) in the distance characteristic graph is drawn in an XZ plane.
- the control unit 103 first divides the refractory brick 16 into a grid shape.
- each cell of the grid is called “voxel,” and a group of voxels is called “voxel group.”
- the size (for example, length of one side) of a single voxel is not particularly limited, and an exemplary length of one side of a single voxel in a grid shape (cubic shape) may be 1 mm.
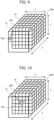
- FIG. 9 is a conceptual diagram showing a voxel group A02.
- FIG. 9 also shows the reception unit 102 arranged at point C1 on the surface of the steel shell 12.
- the control unit 103 calculates a distance d between one voxel A01 and point C1, the voxel A01 being included in the voxel group A02. Subsequently, the control unit 103 refers to the distance characteristic graph ( FIG. 5 ) and performs, in the voxel A01, processing of reflecting an amplitude (intensity) v corresponding to the distance d as a value. This processing is performed in every voxel of the voxel group A02.
- the same amplitude (intensity) value is assigned to voxels situated at the same distance from point C1, and the same amplitude (intensity) is set in a concentric spherical manner having point C1 as its center.
- the control unit 103 extracts only voxels present in the XZ plane passing point C1 and point A1 from voxels included in the voxel group A02. As a result, the two-dimensional heat map ( FIG. 6 ) is generated.
- the degree (e.g., color gradation) in the map of FIG. 6 shows the level of likelihood of the reflection position (including the position of the end 18) of the elastic wave 21 in the refractory brick 16.
- the map of FIG. 6 shows an approximate state of the remaining refractory brick 16.
- An intensity (vertical axis) is drawn in the map of FIG. 6 to be paler for a weaker intensity and darker for a stronger intensity, for instance. Difference in the intensity may be expressed by means of colors.
- FIG. 6 only two black strips separately corresponding to two peaks in the graph of FIG. 5 are drawn for convenience.
- the two black strips in FIG. 6 show positions each having relatively high likelihood of the reflection position. In other words, they are likely to include the crack 19 or the end 18 in the refractory brick 16.
- Determination of which of the crack 19 and the end 18 a black strip includes is made based on the distance from point C1, i.e., the measurement point. For example, the black strip situated closer to point C1 is likely to include the crack 19, whereas the black strip situated farther from point C1 is likely to include the end 18.
- FIG. 6 shows the peak on the left side (peak being likely to include the position of the crack 19) in the graph of FIG. 5 in a thick line and the peak on the right side (peak being likely to include the position of the end 18) in the graph of FIG. 5 in a thicker line (extra thick line).
- control unit 103 performs the same processing as the processing described with reference to FIGS. 4 to 6 to thereby obtain a plurality of two-dimensional heat maps aside from FIG. 6 .
- control unit 103 draws a map based on reception results of reception units 102 arranged at the remaining points (such as point A1).
- the control unit 103 performs the same processing as the processing described with reference to FIGS. 4 to 6 to thereby obtain a two-dimensional heat map ( FIG. 7 ).
- FIG. 7 is a conceptual diagram of a map based on the reception result of the reception unit 102 at point A1 (measurement point: point A1, struck point: point C1) and shows an XZ plane passing point C1 and point A1 in the furnace wall 11 shown in FIG. 3 .
- FIG. 7 shows the site that is likely to include the position of the crack 19 in the distance characteristic graph in a thick line and the peak that is likely to include the position of the end 18 in an extra thick line, for convenience.
- the control unit 103 first divides the refractory brick 16 into a grid shape.
- FIG. 10 is a conceptual diagram showing another voxel group B02 than the voxel group A02 ( FIG. 9).
- FIG. 10 also shows the reception unit 102 arranged at point A1.
- the control unit 103 calculates the distance d between a voxel B01 included in the voxel group B02 and point A1. Subsequently, the control unit 103 refers to the distance characteristic graph which is not shown (measurement point: point A1, struck point: point C1) and performs, in the voxel B01, processing to reflect an amplitude (intensity) v corresponding to the distance d as a value. This processing is performed for every voxel of the voxel group B02.
- the same amplitude (intensity) value is assigned to voxels situated at the same distance from point A1, and the same amplitude (intensity) is set in a concentric spherical manner having point A1 as its center.
- the control unit 103 extracts voxels situated in the XZ plane passing point C1 and point A1 from voxels included in the voxel group B02. As a result, the two-dimensional heat map ( FIG. 7 ) is generated.
- control unit 103 performs the same processing to thereby obtain two-dimensional heat maps aside from FIG. 7 .
- control unit 103 also obtains a two-dimensional heat map for a case where the measurement point is not point C1 or point A1 (such as a case where the measurement point is point C3 or point A3) in a similar manner.
- control unit 103 synthesizes the maps thus drawn to thereby generate a synthesized map.
- FIG. 8 is a conceptual diagram of a synthesized map, in particular, a map (synthesized map) in which FIG. 6 is synthesized with FIG. 7 , and shows an XZ plane passing point C1 and point A1 of the furnace wall 11 shown in FIG. 3 .
- FIG. 8 two thick lines are each illustrated in positions between those in FIGS. 6 and 7 .
- control unit 103 refers to the voxel group A02 (measurement point: point C1, struck point: point A1) of FIG. 9 and the voxel group B02 (measurement point: point A1, struck point: point C1) of FIG. 10 . Even in different voxel groups, voxels having the same coordinate indicate the same position in the refractory brick 16.
- the control unit 103 sums the amplitude (intensity) values assigned to voxels (e.g., voxel A01 and voxel B01) having the same coordinate in the voxel group A02 ( FIG. 9 ) and the voxel group B02 ( FIG. 10 ) to calculate a new intensity value (synthesized value).
- voxels e.g., voxel A01 and voxel B01
- the synthesized value thus calculated is assigned to a voxel C01 (not shown) in another voxel group C02 (not shown) than the voxel group A02 ( FIG. 9 ) and the voxel group B02 ( FIG. 10 ), the voxel C01 having the same coordinate as that of the voxel A01 and the voxel B01.
- the control unit 103 then extracts only voxels situated in an XZ plane passing point C1 and point A1 from voxels assigned with synthesized values in the new voxel group C02. As a result, the two-dimensional heat map ( FIG. 8 ) is generated.
- the control unit 103 may obtain, as a three-dimensional map, a new voxel group C02 in which a synthesized value is assigned to each voxel.
- the size of the intensity (synthesized value) is also expressed by difference in color or color gradation.
- the control unit 103 causes, for example, a display unit 104 described later to display the obtained map (heat map in this embodiment). As a result, the state of the refractory brick 16 can be visualized.
- the obtained map includes information on not only the position of the end 18 (i.e., remaining thickness of the refractory brick 16) but also the position of the crack 19, and owing to this constitution, an operator can visually understand the state of the refractory brick 16 during an operation of the blast furnace.
- An operator can repair the refractory brick 16 based on the obtained map.
- an operator can determine the timing to repair the refractory brick 16 and can repair the refractory brick 16.
- the refractory brick 16 can be repaired even before a scheduled repair timing.
- the number of the reception units 102 is not limited to 4 and may be fewer or more than 4. For instance, even if the number of the reception units 102 is 1, it is possible to obtain the map as described above (see, for example, FIGS. 6 and 7 ).
- the number of the reception units 102 is preferably 2 or more.
- control unit 103 may be exemplified by the processing described below based on FIG. 11 or FIG. 12 .
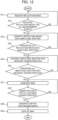
- FIG. 11 is a flowchart showing an example of a processing flow performed by the control unit 103.
- the reception unit 102 disposed at each measurement point receives the reflection wave 22 as an acceleration signal (Step S11).
- the reflection wave 22 from each struck point is received at each measurement point.
- the control unit 103 next converts the reflection wave 22 into an amplitude spectrum (see FIG. 4 ) (Step S12), converts the amplitude spectrum into a distance characteristic graph (see FIG. 5 ) (Step S13), and in addition generates a map based on the distance characteristic graph (see FIG. 6 or FIG. 7 ) (Step S14).
- Step S15 Unless maps for all of the struck points have been generated at all of the measurement points, the above-described steps are repeated ("NO" in Step S15). Once maps for all of the struck points have been generated at all of the measurement points ("YES” in Step S15), the control unit 103 synthesizes the generated maps to generate a synthesized map (see FIG. 8 ) (Step S16). Furthermore, the control unit 103 causes the display unit 104 described later to display the generated synthesized map (Step S17).
- FIG. 12 is a flowchart showing another example of the processing flow performed by the control unit 103.
- the reception unit 102 disposed at each measurement point receives the reflection wave 22 as an acceleration signal (Step S21).
- the reflection wave 22 from each struck point is received at each measurement point.
- Step S22 the control unit 103 converts the respective reflection waves 22 into amplitude spectra (see FIG. 4 ) (Step S23).
- Step S24 the control unit 103 converts the respective amplitude spectra into the distance characteristic graphs (see FIG. 5 ) (Step S25).
- Step S26 the control unit 103 generates a map (see FIG. 6 or FIG. 7 ) based on each of the distance characteristic graphs (Step S27).
- Step S28 the control unit 103 synthesizes the generated maps to generate a synthesized map (see FIG. 8 ) (Step S29).
- the control unit 103 causes the display unit 104 described later to display the generated synthesized map (Step S30).
- a furnace to which the status visualization apparatus can be applied is not limited thereto, and examples thereof include a furnace provided with a furnace wall including a steel shell and a refractory (refractory brick). Specific examples thereof include a blast furnace (blast furnace with three-layer structure) other than the CS-structure blast furnace, an electric furnace, a converter, a ladle (RH furnace or the like), a torpedo car, and a gasification melting furnace.
- a blast furnace blast furnace with three-layer structure
- an electric furnace a converter, a ladle (RH furnace or the like), a torpedo car, and a gasification melting furnace.
- Embodiment A a status visualization apparatus 1A according to another embodiment (referred to as "Embodiment A") is described using FIGS. 13 to 18 .
- FIG. 13 is a functional block diagram of the state visualization apparatus 1A.
- the status visualization apparatus 1A includes the input unit 101, the reception unit 102, the control unit 103, and the display unit 104.
- the input unit 101 is constituted of an impact hammer, a vibrator, or the like.
- the input unit 101 is constituted of an impact hammer
- the expected value of the resonant frequency can be calculated through simulation.
- the reception unit 102 is constituted of, for example, an accelerometer.
- the reception unit 102 is constituted of an accelerometer
- the control unit 103 controls the entire status visualization apparatus 1A.
- the control unit 103 is constituted of, for example, one or more processors.
- the control unit 103 may be constituted of a logic circuit (hardware) formed in, for example, an integrated circuit (IC chip).
- the control unit 103 may be constituted of software with use of a central processing unit (CPU).
- CPU central processing unit
- the control unit 103 may be constituted of a field-programmable gate array (FPGA) or an application-specific integrated circuit (ASIC), for example.
- FPGA field-programmable gate array
- ASIC application-specific integrated circuit
- the control unit 103 includes a frequency analysis unit 201, a distance characteristic calculation unit 202, a storage unit 203, and a map generation unit 204. These units may each include an independent casing.
- the frequency analysis unit 201 is constituted of, for example, a fast Fourier transform (FFT) analyzer.
- FFT fast Fourier transform
- the distance characteristic calculation unit 202, the storage unit 203, and the map generation unit 204 are constituted of, for example, a personal computer (PC).
- the control unit 103 may be provided with a data bus for communicating data between the above-described units.
- control unit 103 Some of the respective units constituting the control unit 103 may be provided in a separate terminal (not shown).
- the frequency analysis unit 201 receives a reflection wave received by the reception unit 102, performs frequency analysis, and calculates frequency characteristics.
- an amplitude spectrum is used, but this is not the sole case; for instance, a frequency response function calculated from an elastic wave and a reflection wave may be used, the elastic wave being input by the input unit 101 and the reflection wave being received by the reception unit 102.
- Examples of the frequency analysis method include discrete Fourier transform (DFT) and fast Fourier transform (FFT) which rapidly executes DFT, but these are not the sole cases; the frequency analysis may be carried out through the wavelet transform.
- DFT discrete Fourier transform
- FFT fast Fourier transform
- the frequency analysis unit 201 may directly perform frequency analysis on the reflection wave received from the reception unit 102 to obtain the amplitude spectrum.
- the frequency analysis unit 201 may also perform frequency analysis only on a signal in a specific frequency band with use of a band pass filter to obtain the amplitude spectrum.
- the frequency analysis unit 201 may perform frequency analysis on a signal that is cut out from the received reflection wave with use of a window function to obtain the amplitude spectrum.
- the sampling number of an acceleration signal that is measured by the reception unit 102 is n, and the sampled signal that is sampled from the acceleration signal is a(n).
- the discrete Fourier transform A(k) for a(n) can be calculated by the following Formula (1).
- N is a gate length of a sampled signal a(n) subjected to the discrete Fourier transform.
- the lower limit of the gate length N can be calculated from the maximum frequency f max to be observed, the reciprocating time T of an elastic wave based on the maximum thickness of the refractory brick 16, and the number of reciprocations m of an elastic wave used in frequency analysis.
- the time width of a signal subjected to the frequency analysis with the gate length N is determined by N x ⁇ t, and this time width needs to be equal to or more than the reciprocating time m x T for m reciprocations of the elastic wave.
- the upper limit of the gate length N is determined, for example, based on an input interval of elastic waves by the input unit 101 or time during which at least a certain level of attenuation of the acceleration signal is observed.
- the amplitude spectrum of A(k) can be calculated from the absolute value
- the distance characteristic calculation unit 202 converts the frequency characteristics calculated by the frequency analysis unit 201 into distance characteristics.
- the wavelength calculated from a sound velocity and a frequency may be used as a distance, or a frequency may be converted into a distance using the relationship between the thickness of the refractory brick 16 and the frequency read out from the storage unit 203, the relationship between the thickness and the frequency being preliminarily obtained through simulation and stored in the storage unit 203.
- calculated by the frequency analysis unit 201 can be calculated by the following Formula (4).
- f k kf max N
- the wavelength ⁇ k can be calculated by the following Formula (5).
- the distance characteristic F ( ⁇ k ) is determined by the following Formula (6).
- F ⁇ k A k
- the storage unit 203 stores, for example, the acceleration signal measured by the reception unit 102, the processing result of each unit in the control unit 103, and various data used in the processing.
- the storage unit 203 is constituted of, for example, a random access memory (RAM), or a storage apparatus such as a hard disk.
- RAM random access memory
- hard disk a storage apparatus
- the map generation unit 204 generates a map showing likelihood of the reflection position (i.e., reflection position likelihood) of the elastic wave 21 in the refractory brick 16 based on the distance characteristics calculated by the distance characteristic calculation unit 202.
- the map generation unit 204 calculates the likelihood of the reflection position using the distance characteristics calculated by the distance characteristic calculation unit 202 and subsequently generates a map showing the thus calculated likelihood of the reflection position as described below.
- the method for calculating likelihood of the reflection position at an arbitrary point R in the refractory brick 16 by the map generation unit 204 is described with reference to FIGS. 14 and 15 .
- FIG. 14 is a perspective view showing the furnace wall 11 with the reception unit 102 being attached to the steel shell 12.
- FIG. 15 is a conceptual diagram of the distance characteristics calculated by the distance characteristic calculation unit 202.
- the position where the reception unit 102 is attached has a spatial coordinate (x p , y p , z p ), and an arbitrary point R in the refractory brick 16 has a spatial coordinate (x r , y r , z r ).
- the distance d r between the point R in the refractory brick 16 and the position where the reception unit 102 is attached can be calculated by the following Formula (7).
- the likelihood L(x r , y r , z r ) of the reflection position at the point R in the refractory brick 16 can be calculated by the following Formula (8) using the distance characteristic F(d r ) of the distance d r .
- k 0, 1, ..., N-1.
- max(x) is a function for calculating the largest element in the parentheses.
- FIG. 16 is a perspective view showing the furnace wall 11 with M reception units 102 being attached to the steel shell 12.
- the positions where the reception units 102 are attached have spatial coordinates (x p0 , y p0 , z p0 ), (x p1 , y p1 , z p1 ), ..., (x pM- 1, y pM-1 , z pM-1 ), and the arbitrary point R in the refractory brick 16 has a spatial coordinate (x r , y r , z r ).
- the distance d rm between the point R in the refractory brick 16 and the position where the mth reception unit 102 is attached can be calculated by the following Formula (9).
- the likelihood L(x r , y r , z r ) of the reflection position at the point R in the refractory brick 16 can be calculated by the following Formula (10) using the distance characteristic F(d rm ) of the distance d rm .
- the map generation unit 204 generates a map in which the level of likelihood of a reflection position is visualized.
- the map is preferably a two-dimensional map or a three-dimensional map.
- a heat map is selected as an example of the map.
- a distance from a measurement point is shown on the vertical axis and the horizontal axis, and an amplitude (intensity) is drawn in color gradation.
- the heat map may express the level of likelihood of a reflection position in hue.
- the heat map may be a three-dimensional heat map or a two-dimensional heat map of an arbitrary cross section selected by a user of the state visualization apparatus 1A.
- the display unit 104 displays a heat map 401 generated by the map generation unit 204 or a user interface (UI) for operating the state visualization apparatus 1A.
- UI user interface
- FIG. 17 is a schematic view showing the display unit 104 displaying the heat map 401.
- the display unit 104 is constituted of, for example, a liquid crystal display (LCD), an organic electroluminescence display (OELD), or another device.
- LCD liquid crystal display
- OELD organic electroluminescence display
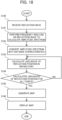
- FIG. 18 is a flowchart showing an example of a processing flow in the state visualization apparatus 1A.
- the reception unit 102 first receives a reflection wave signal (Step S100).
- the frequency analysis unit 201 receives the reflection wave signal from the reception unit 102 and performs frequency analysis on the received signal to calculate an amplitude spectrum (Step S101).
- the distance characteristic calculation unit 202 converts the amplitude spectrum calculated by the frequency analysis unit 201 into a distance characteristic (Step S102).
- the map generation unit 204 calculates likelihood of a reflection position in the refractory brick 16 using the distance characteristic calculated by the distance characteristic calculation unit 202 (Step S103).
- the map generation unit 204 determines whether the likelihood of the reflection position has been calculated for all of the points in the refractory brick 16 (Step S104). In a case where the likelihood of the reflection position has not been calculated for all of the points yet ("NO" in Step S104), calculation of the likelihood of the reflection position is repeatedly performed (Step S103).
- Step S104 the same reception unit 102 again or another reception unit 102 may receive a reflection wave (Step S100).
- an amplitude spectrum is calculated (Step S101)
- the calculated amplitude spectrum is converted into a distance characteristic (Step S102)
- the likelihood of the reflection position is calculated using the distance characteristic (Step S103).
- the map generation unit 204 In a case where the likelihood of the reflection position has been calculated for all of the points ("YES" in Step S104), the map generation unit 204 generates a map in which the level of likelihood of the reflection position is reflected (Step S105). In the embodiment, the map generation unit 204 generates the heat map 401 in which the level of likelihood of a reflection position is reflected in color gradation.
- the control unit 103 then drives and controls the display unit 104 such that the display unit 104 displays the map generated by the map generation unit 204 (Step S106).
- the control unit 103 drives and controls the display unit 104 such that the heat map 401 generated by the map generation unit 204 is displayed in the display unit 104.
- Embodiment B only differences from Embodiment A are described. In particular, Embodiment B is different from Embodiment A in the distance characteristic calculation unit 202.
- the distance characteristic calculation unit 202 preliminarily acquires the relationship between the thickness of the refractory brick 16 and the frequency through simulation and stores the relationship in the storage unit 203, and the relationship between the thickness and the frequency is read out from the storage unit 203 to convert the frequency into a distance.
- the distance characteristic calculation unit 202 As the method of calculating a distance characteristic by the distance characteristic calculation unit 202, a method of calculating a distance characteristic using a result of vibration application simulation according to the finite element method is described.
- the finite element method is a numerical analysis technique for approximately solving differential equations, in which a continuum is divided into elements having finite sizes for calculation.
- the ultrasound propagation motion in a continuum is expressed by the differential equation shown in the following Formula (11).
- [Mathematical Formula 11] ⁇ ⁇ 2 u i ⁇ t 2 ⁇ ⁇ 2 ⁇ ij ⁇ x j ⁇ b i 0
- ⁇ represents a density, ⁇ a stress, x a coordinate, i and j numerals in coordinate axes, b a body force, u a displacement, and t a time.
- [M] represents an element mass matrix
- [C] an element attenuation matrix
- [K] an element rigidity matrix
- ⁇ u" ⁇ an acceleration vector
- ⁇ u' ⁇ a velocity vector ⁇ u ⁇ a displacement vector
- ⁇ f ⁇ an external force vector.
- u" is an acceleration when a displacement u is differentiated twice
- u' is a velocity when a displacement u is differentiated once.
- the distance characteristic calculation unit 202 generates a three-dimensional model of a furnace (blast furnace) that is divided into elements having definite sizes.
- the three-dimensional model of a furnace may be of an entire furnace.
- the three-dimensional model of a furnace may also be of only the refractory brick 16 whose thickness is measured and an outer layer region of the refractory brick 16.
- the distance characteristic calculation unit 202 generates a plurality of three-dimensional models having different thicknesses of the refractory brick 16.
- the distance characteristic calculation unit 202 successively calculates the ultrasound propagation motion of the above Formula (12) using each of the generated three-dimensional models.
- k 0, 1, ..., N-1.
- k 0, 1, ..., N-1.
- argmax (x) is a function to calculate a parameter below argmax which maximizes the element in the parentheses.
- the distance characteristic calculation unit 202 performs calculation of the above Formula (14) for each thickness T of the refractory brick 16, thereby deriving a function for converting between the thickness T of the refractory brick 16 and a resonant frequency f.
- the distance characteristic calculation unit 202 may derive a function for associating the thickness of the refractory brick 16 with the resonant frequency in a one-to-one manner through simulation with the thickness of the refractory brick 16 for each resolution by which the thickness is determined. Moreover, the distance characteristic calculation unit 202 may derive an approximation expression for converting between the thickness of the refractory brick 16 and the resonant frequency through simulation with a representative point.
Landscapes
- Engineering & Computer Science (AREA)
- Chemical & Material Sciences (AREA)
- Manufacturing & Machinery (AREA)
- Materials Engineering (AREA)
- Metallurgy (AREA)
- Organic Chemistry (AREA)
- Physics & Mathematics (AREA)
- Mechanical Engineering (AREA)
- General Engineering & Computer Science (AREA)
- Health & Medical Sciences (AREA)
- Acoustics & Sound (AREA)
- Life Sciences & Earth Sciences (AREA)
- Analytical Chemistry (AREA)
- Biochemistry (AREA)
- General Health & Medical Sciences (AREA)
- General Physics & Mathematics (AREA)
- Immunology (AREA)
- Pathology (AREA)
- Waste-Gas Treatment And Other Accessory Devices For Furnaces (AREA)
- Length Measuring Devices Characterised By Use Of Acoustic Means (AREA)
- Furnace Housings, Linings, Walls, And Ceilings (AREA)
Abstract
Description
- The present invention relates to a refractory state visualization method, a refractory repair method, and a refractory state visualization apparatus.
- An industrial furnace such as a blast furnace has a furnace wall that generally includes a steel shell, an unshaped refractory, and a refractory brick (shaped refractory) in this order from the outside to the inside.
- The refractory brick that is a refractory situated innermost wears from the furnace core side and, in addition, experiences generation of cracks in its interior in some cases. In particular, a refractory brick in a furnace bottom of a blast furnace is ceaselessly exposed to molten iron even during an outage and hence wears significantly. Wear of a refractory brick or generation of cracks in a refractory brick shortens the life of a furnace body.
- Accordingly, it is important to understand the state of a refractory brick from the viewpoint of maintenance management of the furnace, and, hence, there have been conventionally proposed methods for measuring the remaining thickness of a refractory brick (
Patent Literatures 1 and 2) . -
- Patent Literature 1:
JP 62-297710 A - Patent Literature 2:
JP 8-219751 A - The methods described in
Patent Literatures 1 and 2 merely measure the remaining thickness of a refractory brick. - From the viewpoint of maintenance management of a furnace, it is desired not only to find the remaining thickness of a refractory brick but to visually find the refractory brick state including cracks or the like generated in the interior of a refractory brick.
- The present invention has been made in view of the foregoing and has an object of visualizing the state of a refractory such as a refractory brick.
- The present inventors found, through an earnest study, that employing the configuration described below enables achievement of the above-mentioned object, and the invention has been completed.
- Specifically, the present invention provides the following [1] to [4].
- [1] A refractory state visualization method comprising: a step of inputting an elastic wave to a furnace wall having a refractory; a step of receiving a reflection wave of the elastic wave; a step of determining a frequency characteristic of the reflection wave; a step of determining a distance characteristic from the frequency characteristic; and a step of generating a map showing likelihood of a reflection position in the refractory based on the distance characteristic.
- [2] The refractory state visualization method according to [1], wherein the distance characteristic includes a plurality of distance characteristics, and the map is generated by synthesizing maps that are separately generated for the plurality of distance characteristics.
- [3] A refractory repair method comprising repairing a refractory based on a map generated by the refractory state visualization method according to [1] or [2].
- [4] A refractory state visualization apparatus comprising: an input unit adapted to input an elastic wave to a furnace wall having a refractory; a reception unit adapted to receive a reflection wave of the elastic wave; and a control unit adapted to determine a frequency characteristic of the reflection wave, determine a distance characteristic from the frequency characteristic, and generate a map showing likelihood of a reflection position in the refractory based on the distance characteristic.
- The present invention can visualize the state of a refractory such as a refractory brick.
-
- [
FIG. 1] FIG. 1 is a cross-sectional view showing part of a furnace wall when viewed from an upper side of a CS-structure blast furnace. - [
FIG. 2] FIG. 2 is a schematic view showing a state visualization apparatus along with a furnace wall. - [
FIG. 3] FIG. 3 is a perspective view showing the furnace wall with reception units being attached to a steel shell. - [
FIG. 4] FIG. 4 is a conceptual diagram of an amplitude spectrum. - [
FIG. 5] FIG. 5 is a conceptual diagram of a distance characteristic graph. - [
FIG. 6] FIG. 6 is a conceptual diagram of a map based on a reception result of a reception unit at point C1. - [
FIG. 7] FIG. 7 is a conceptual diagram of a map based on a reception result of a reception unit at point A1. - [
FIG. 8] FIG. 8 is a conceptual diagram of a synthesized map. - [
FIG. 9] FIG. 9 is a conceptual diagram showing a voxel group. - [
FIG. 10] FIG. 10 is a conceptual diagram showing another voxel group. - [
FIG. 11] FIG. 11 is a flowchart showing an example of a processing flow performed by a control unit. - [
FIG. 12] FIG. 12 is a flowchart showing another example of a processing flow performed by the control unit. - [
FIG. 13] FIG. 13 is a functional block diagram of the state visualization apparatus. - [
FIG. 14] FIG. 14 is a perspective view showing a furnace wall with a reception unit being attached to a steel shell. - [
FIG. 15] FIG. 15 is a conceptual diagram of a distance characteristic calculated by a distance characteristic calculation unit. - [
FIG. 16] FIG. 16 is a perspective view showing a furnace wall with M reception units being attached to a steel shell. - [
FIG. 17] FIG. 17 is a schematic view showing a display unit displaying a heat map. - [
FIG. 18] FIG. 18 is a flowchart showing an example of a processing flow performed by the state visualization apparatus. - Below, described is a state visualization apparatus for a refractory (also simply referred to as "state visualization apparatus"). The following description covers both a refractory state visualization method and a refractory repair method.
- First, a furnace wall of a blast furnace will be described.
- While a furnace wall of a conventional blast furnace has a three layer structure including a steel shell, an unshaped refractory, and a refractory brick (shaped refractory) in this order, most of blast furnaces recently have a cooling stave (CS) structure.
-
FIG. 1 is a cross-sectional view showing part of afurnace wall 11 when viewed from an upper side of a CS-structure blast furnace. Here,FIG. 1 is a cross-sectional view of thefurnace wall 11 constituting a furnace bottom. - As shown in
FIG. 1 , thefurnace wall 11 of the CS-structure blast furnace (hereinafter, also simply referred to as "blast furnace") has a five layer structure. That is, thefurnace wall 11 includes asteel shell 12, an unshaped refractory 13, acopper plate 14, an unshaped refractory 15, and a refractory brick 16 (shaped refractory) in this order from the outside to the inside (from the left side to the right side inFIG. 1 ). - As the unshaped refractory 13 and the unshaped refractory 15, a stamp material is suitably used.
- A stamp material and a castable refractory can be adopted as the unshaped refractories and are different from each other in composition and installation method. Specifically, a stamp material is made of a carbon material as a main component and is rammed with a rammer, whereas a castable refractory is made of alumina cement as a main component and is hardened through drying.
- As the
refractory brick 16, a high alumina brick, a silicon carbide brick, or another conventionally known brick for a blast furnace is used. Therefractory brick 16 is exposed to molten iron (not shown) to thereby wear out. - The
copper plate 14 is provided with a plurality ofholes 17. The blast furnace is cooled by water passing through theholes 17 from the upper side toward the lower side of the blast furnace. - Meanwhile, conventionally, the remaining thickness of a refractory brick is sometimes estimated by monitoring temperature of the refractory brick with use of a thermocouple and calculating heat transfer based on the temperature.
- However, since a CS-structure blast furnace has the foregoing cooling structure and is thus excellent in heat insulation, it may be difficult to estimate the remaining thickness of a refractory brick through calculation of heat transfer.
- Therefore, a
state visualization apparatus 1 described below is preferably used. The state, including the remaining thickness, of a refractory brick can be found accordingly. -
FIG. 2 is a schematic view showing thestate visualization apparatus 1 along with thefurnace wall 11. - Other constituent members of the furnace wall 11 (such as the unshaped refractory 13) than the
steel shell 12 and therefractory brick 16 are omitted inFIG. 2 . - The
state visualization apparatus 1 includes at least aninput unit 101, areception unit 102, and acontrol unit 103. An example thereof is constituted of an impact hammer as theinput unit 101, an accelerometer as thereception unit 102, and an amplifier, an oscilloscope and a personal computer (PC) as thecontrol unit 103. -
FIG. 3 is a perspective view showing thefurnace wall 11 withreception units 102 being attached to thesteel shell 12.FIG. 3 also omits other constituent members (such as the unshaped refractory 13) of thefurnace wall 11 than thesteel shell 12 and therefractory brick 16. In addition,FIG. 3 shows the X axis direction, the Y axis direction, and the Z axis direction. The Z axis direction coincides with the thickness direction of therefractory brick 16. - The
reception units 102, i.e., accelerometer, are provided on a surface of thesteel shell 12 and are arranged, in one example, at four points (point A1, point A3, point C1, and point C3) on the surface of thesteel shell 12 so as to form a rectangular shape as shown inFIG. 3 . - Here, reference is again made to
FIG. 2 . - As shown in
FIG. 2 , the surface of the steel shell 12 (at each point at which thereception unit 102 is arranged, for instance) is struck by theinput unit 101, i.e., an impact hammer to thereby apply vibration to thefurnace wall 11 including therefractory brick 16. As a result, anelastic wave 21 is input to thefurnace wall 11. Hereinbelow, the point, on the surface of thesteel shell 12, struck by theinput unit 101 may be called "struck point" for convenience. - The
elastic wave 21 propagates though the interior of thefurnace wall 11 and is reflected by anend 18 of therefractory brick 16 to thereby turn into areflection wave 22. Thereception unit 102, i.e., an accelerometer, receives (detects) thisreflection wave 22 as an acceleration signal. Hereinbelow, a point, on the surface of thesteel shell 12, at which thereception unit 102 for receiving thereflection wave 22 is arranged may be called "measurement point" for convenience. - First, described based on
FIGS. 4 to 6 is a processing flow thecontrol unit 103 performs when a map (described later) is generated in a case where the measurement point and the struck point are points C1 and A1, respectively. - The
control unit 103 analyzes the acceleration signal received by thereception unit 102 to thereby determine the frequency characteristic. In other words, the acceleration signal is converted into an amplitude spectrum (frequency spectrum) to thereby determine a resonant frequency (peak frequency). - Prior to this process, the relationship (hereinafter, also referred to as "conversion model") between the resonant frequency and the thickness of the refractory brick 16 (at reflection position of the elastic wave 21) is preliminarily determined by simulation (e.g., elastic wave propagation simulation) or the like. The conversion model is stored in the
control unit 103 or an external storage apparatus (not shown) in advance. - The
control unit 103 inputs the resonant frequency determined from the acceleration signal into the conversion model to thereby determine the distance characteristic that indicates the relationship between an amplitude and a distance from the measurement point (point C1). - Meanwhile, in a case where a
crack 19 is generated in therefractory brick 16, theelastic wave 21 is reflected by not only theend 18 but also thecrack 19. A conceptual diagram of an amplitude spectrum obtained from the reflection wave 22 (acceleration signal) in this case is shown inFIG. 4 . -
FIG. 4 is a conceptual diagram of an amplitude spectrum (measurement point: point C1, struck point: point A1); the vertical axis shows an amplitude (intensity), and the horizontal axis shows a frequency. As an example, in the amplitude spectrum inFIG. 4 , a peak on the low frequency side indicates a peak due to reflection by theend 18, whereas a peak on the high frequency side indicates a peak due to reflection by thecrack 19. - The amplitude spectrum of
FIG. 4 is applied to the foregoing conversion model to be thereby converted to a one-dimensional distance characteristic graph (hereinafter, also referred to as "distance characteristic graph") showing the relationship between the amplitude and the distance from the measurement point (distance in Z axis direction). A conceptual diagram of the distance characteristic graph is shown inFIG. 5 . -
FIG. 5 is a conceptual diagram of the distance characteristic graph (measurement point: point C1, struck point: point A1), and the vertical axis shows an amplitude (intensity), and the horizontal axis shows a distance from the measurement point. - The number of vibration applications to the
furnace wall 11 with use of the input unit 101 (number of times a struck point is struck) at each measurement point may be one, or two or more (for instance, three times). In a case of two or more times, thecontrol unit 103 preferably determines a distance characteristic graph based on the acceleration signal for each time. - The
control unit 103 next draws a map based on the distance characteristic graph ofFIG. 5 . - The map is preferably a two-dimensional map or a three-dimensional map.
- In this embodiment, heat maps (
FIGS. 6 to 8 ) exemplify the map. A heat map is one type of visualization graph which expresses each value of a two-dimensional numerical data (matrix data) as a color or color gradation. - The map (heat map) shows likelihood of a reflection position in the
refractory brick 16 as described later and is exemplified by the following two types (a) and (b). - (a) Map with a single measurement point: examples thereof include maps shown in
FIGS. 6 and 7 to be described later, in which a distance characteristic graph (e.g.,FIG. 5 ) is developed in a circumferential manner having the measurement point as the center, or is superposed in a spherical manner having the measurement point as the center. - (b) Map with plural measurement points: examples thereof include a map shown in
FIG. 8 orFIG. 17 to be described later, in which plural maps (a) described above are synthesized while maintaining the relationship between the distance and the coordinate (positional relationship) of a measurement point. Since there are plural measurement points, the likelihood is more accurate. - In the heat maps shown in
FIGS. 6 to 8 , a distance from a measurement point is plotted in the vertical axis and the horizontal axis, and an amplitude (intensity) is drawn in color gradation. The amplitude (intensity) may be expressed as a hue. - The heat map may be a three-dimensional heat map or a two-dimensional heat map of an arbitrary cross section selected by a user of a state visualization apparatus 1A.
- For drawing the map, the vertical axis is preferably normalized in each distance characteristic graph. The normalization may be carried out by use of the maximum value of the vertical axis or by use of a sum of absolute values of values in the vertical axis.
-
FIG. 6 is a conceptual diagram of a map based on the reception result of thereception unit 102 at point C1 (measurement point: point C1, struck point: point A1) and shows an XZ plane passing point C1 and point A1 in thefurnace wall 11 shown inFIG. 3 . - Specifically, the
control unit 103 draws the distance characteristic graph ofFIG. 5 in an XZ plane having the origin O of the graph as point C1, for instance. Obtained in this manner is the map (FIG. 6 ) in which the degree of the intensity (vertical axis) at each distance (horizontal axis) in the distance characteristic graph is drawn in an XZ plane. - Processing performed by the
control unit 103 to create the map ofFIG. 6 based on the distance characteristic graph ofFIG. 5 (measurement point: point C1, struck point: point A1) is described usingFIG. 9 . - The
control unit 103 first divides therefractory brick 16 into a grid shape. In this description, each cell of the grid is called "voxel," and a group of voxels is called "voxel group." The size (for example, length of one side) of a single voxel is not particularly limited, and an exemplary length of one side of a single voxel in a grid shape (cubic shape) may be 1 mm. -
FIG. 9 is a conceptual diagram showing a voxel group A02.FIG. 9 also shows thereception unit 102 arranged at point C1 on the surface of thesteel shell 12. - The
control unit 103 calculates a distance d between one voxel A01 and point C1, the voxel A01 being included in the voxel group A02. Subsequently, thecontrol unit 103 refers to the distance characteristic graph (FIG. 5 ) and performs, in the voxel A01, processing of reflecting an amplitude (intensity) v corresponding to the distance d as a value. This processing is performed in every voxel of the voxel group A02. Consequently, the same amplitude (intensity) value is assigned to voxels situated at the same distance from point C1, and the same amplitude (intensity) is set in a concentric spherical manner having point C1 as its center. - The
control unit 103 extracts only voxels present in the XZ plane passing point C1 and point A1 from voxels included in the voxel group A02. As a result, the two-dimensional heat map (FIG. 6 ) is generated. - The degree (e.g., color gradation) in the map of
FIG. 6 shows the level of likelihood of the reflection position (including the position of the end 18) of theelastic wave 21 in therefractory brick 16. The map ofFIG. 6 shows an approximate state of the remainingrefractory brick 16. - An intensity (vertical axis) is drawn in the map of
FIG. 6 to be paler for a weaker intensity and darker for a stronger intensity, for instance. Difference in the intensity may be expressed by means of colors. - In
FIG. 6 , only two black strips separately corresponding to two peaks in the graph ofFIG. 5 are drawn for convenience. The two black strips inFIG. 6 show positions each having relatively high likelihood of the reflection position. In other words, they are likely to include thecrack 19 or theend 18 in therefractory brick 16. - Determination of which of the
crack 19 and the end 18 a black strip includes is made based on the distance from point C1, i.e., the measurement point. For example, the black strip situated closer to point C1 is likely to include thecrack 19, whereas the black strip situated farther from point C1 is likely to include theend 18. - Specifically,
FIG. 6 shows the peak on the left side (peak being likely to include the position of the crack 19) in the graph ofFIG. 5 in a thick line and the peak on the right side (peak being likely to include the position of the end 18) in the graph ofFIG. 5 in a thicker line (extra thick line). - Next, for each case where another point than point A1 is the struck point, with point C1 being kept as the measurement point, the
control unit 103 performs the same processing as the processing described with reference toFIGS. 4 to 6 to thereby obtain a plurality of two-dimensional heat maps aside fromFIG. 6 . - For example, first, obtained is a two-dimensional heat map for a case where the measurement point is point C1 and the struck point is point C3. Subsequently, a two-dimensional heat map for a case where the measurement point is point C1 and the struck point is point A3 is obtained. In addition, a two-dimensional heat map for a case where the measurement point is point C1 and the struck point is another point than point A1, point C3, and point A3 is obtained.
- Furthermore, the
control unit 103 draws a map based on reception results ofreception units 102 arranged at the remaining points (such as point A1). - For example, first, for a case where the measurement point is point A1 and the struck point is point C1, the
control unit 103 performs the same processing as the processing described with reference toFIGS. 4 to 6 to thereby obtain a two-dimensional heat map (FIG. 7 ). -
FIG. 7 is a conceptual diagram of a map based on the reception result of thereception unit 102 at point A1 (measurement point: point A1, struck point: point C1) and shows an XZ plane passing point C1 and point A1 in thefurnace wall 11 shown inFIG. 3 . - As with
FIG. 6, FIG. 7 shows the site that is likely to include the position of thecrack 19 in the distance characteristic graph in a thick line and the peak that is likely to include the position of theend 18 in an extra thick line, for convenience. - Processing by the
control unit 103 to generate the map ofFIG. 7 based on the distance characteristic graph which is not shown (measurement point: point A1, struck point: point C1) is described usingFIG. 10 . - The
control unit 103 first divides therefractory brick 16 into a grid shape. -
FIG. 10 is a conceptual diagram showing another voxel group B02 than the voxel group A02 (FIG. 9). FIG. 10 also shows thereception unit 102 arranged at point A1. - The
control unit 103 calculates the distance d between a voxel B01 included in the voxel group B02 and point A1. Subsequently, thecontrol unit 103 refers to the distance characteristic graph which is not shown (measurement point: point A1, struck point: point C1) and performs, in the voxel B01, processing to reflect an amplitude (intensity) v corresponding to the distance d as a value. This processing is performed for every voxel of the voxel group B02. Consequently, the same amplitude (intensity) value is assigned to voxels situated at the same distance from point A1, and the same amplitude (intensity) is set in a concentric spherical manner having point A1 as its center. - The
control unit 103 extracts voxels situated in the XZ plane passing point C1 and point A1 from voxels included in the voxel group B02. As a result, the two-dimensional heat map (FIG. 7 ) is generated. - Next, for each case where another point than point C1 is the struck point, with point A1 being kept as the measurement point, the
control unit 103 performs the same processing to thereby obtain two-dimensional heat maps aside fromFIG. 7 . - For example, first, obtained is a two-dimensional heat map for a case where the measurement point is point A1 and the struck point is point C3. Subsequently, a two-dimensional heat map for a case where the measurement point is point A1 and the struck point is point A3 is obtained. In addition, a two-dimensional heat map for a case where the measurement point is point A1 and the struck point is another point than point A1, point C3, and point A3 is obtained.
- In addition, aside from
FIGS. 6 and 7 , thecontrol unit 103 also obtains a two-dimensional heat map for a case where the measurement point is not point C1 or point A1 (such as a case where the measurement point is point C3 or point A3) in a similar manner. - Thereafter, the
control unit 103 synthesizes the maps thus drawn to thereby generate a synthesized map. -
FIG. 8 is a conceptual diagram of a synthesized map, in particular, a map (synthesized map) in whichFIG. 6 is synthesized withFIG. 7 , and shows an XZ plane passing point C1 and point A1 of thefurnace wall 11 shown inFIG. 3 . - In
FIG. 8 , two thick lines are each illustrated in positions between those inFIGS. 6 and 7 . - Processing by the
control unit 103 to generate the synthesized map ofFIG. 8 based on the map (measurement point: point C1, struck point: point A1) ofFIG. 6 and the map (measurement point: point A1, struck point: point C1) ofFIG. 7 is described usingFIGS. 9 and 10 . - For synthesizing maps having the same measurement point but different struck points, the same processing as the processing described below may be also performed.
- First, the
control unit 103 refers to the voxel group A02 (measurement point: point C1, struck point: point A1) ofFIG. 9 and the voxel group B02 (measurement point: point A1, struck point: point C1) ofFIG. 10 . Even in different voxel groups, voxels having the same coordinate indicate the same position in therefractory brick 16. - The
control unit 103 sums the amplitude (intensity) values assigned to voxels (e.g., voxel A01 and voxel B01) having the same coordinate in the voxel group A02 (FIG. 9 ) and the voxel group B02 (FIG. 10 ) to calculate a new intensity value (synthesized value). - The synthesized value thus calculated is assigned to a voxel C01 (not shown) in another voxel group C02 (not shown) than the voxel group A02 (
FIG. 9 ) and the voxel group B02 (FIG. 10 ), the voxel C01 having the same coordinate as that of the voxel A01 and the voxel B01. - The
control unit 103 then extracts only voxels situated in an XZ plane passing point C1 and point A1 from voxels assigned with synthesized values in the new voxel group C02. As a result, the two-dimensional heat map (FIG. 8 ) is generated. - The
control unit 103 also generates a similar map for a YZ plane passing point A1 and point A3 of thefurnace 11 shown inFIG. 3 in the same manner. - Thereafter, a three-dimensional map is obtained from the map of the XZ plane and the map of the YZ plane.
- The
control unit 103 may obtain, as a three-dimensional map, a new voxel group C02 in which a synthesized value is assigned to each voxel. In the three-dimensional map, the size of the intensity (synthesized value) is also expressed by difference in color or color gradation. - The
control unit 103 causes, for example, adisplay unit 104 described later to display the obtained map (heat map in this embodiment). As a result, the state of therefractory brick 16 can be visualized. - The obtained map includes information on not only the position of the end 18 (i.e., remaining thickness of the refractory brick 16) but also the position of the
crack 19, and owing to this constitution, an operator can visually understand the state of therefractory brick 16 during an operation of the blast furnace. - An operator can repair the
refractory brick 16 based on the obtained map. - That is, by referring to the map in which the state of the
refractory brick 16 is visualized, an operator can determine the timing to repair therefractory brick 16 and can repair therefractory brick 16. - For instance, when generation of the
crack 19 in therefractory brick 16 is discovered by reference to the map, therefractory brick 16 can be repaired even before a scheduled repair timing. - The number of the
reception units 102 is not limited to 4 and may be fewer or more than 4. For instance, even if the number of thereception units 102 is 1, it is possible to obtain the map as described above (see, for example,FIGS. 6 and 7 ). - Meanwhile, from the viewpoint of more accurately finding the state of the
refractory brick 16, the number of thereception units 102 is preferably 2 or more. - In summary, the processing performed by the
control unit 103 in the embodiment may be exemplified by the processing described below based onFIG. 11 orFIG. 12 . - It should be noted that while the processing described below is performed in a case where there are plural struck points per measurement point, there may be a single struck point per measurement point.
-
FIG. 11 is a flowchart showing an example of a processing flow performed by thecontrol unit 103. - First, the
reception unit 102 disposed at each measurement point (e.g., point C1, point A1, point C3, point A3) receives thereflection wave 22 as an acceleration signal (Step S11). In this step, thereflection wave 22 from each struck point is received at each measurement point. - The
control unit 103 next converts thereflection wave 22 into an amplitude spectrum (seeFIG. 4 ) (Step S12), converts the amplitude spectrum into a distance characteristic graph (seeFIG. 5 ) (Step S13), and in addition generates a map based on the distance characteristic graph (seeFIG. 6 or FIG. 7 ) (Step S14). - Unless maps for all of the struck points have been generated at all of the measurement points, the above-described steps are repeated ("NO" in Step S15). Once maps for all of the struck points have been generated at all of the measurement points ("YES" in Step S15), the
control unit 103 synthesizes the generated maps to generate a synthesized map (seeFIG. 8 ) (Step S16). Furthermore, thecontrol unit 103 causes thedisplay unit 104 described later to display the generated synthesized map (Step S17). -
FIG. 12 is a flowchart showing another example of the processing flow performed by thecontrol unit 103. First, thereception unit 102 disposed at each measurement point receives thereflection wave 22 as an acceleration signal (Step S21). In this step, thereflection wave 22 from each struck point is received at each measurement point. - Once reflection waves 22 from all of the struck points have been received at all of the measurement points ("YES" in Step S22), the
control unit 103 converts the respective reflection waves 22 into amplitude spectra (seeFIG. 4 ) (Step S23). - Once the reflection waves 22 have been all converted into amplitude spectra ("YES" in Step S24), the
control unit 103 converts the respective amplitude spectra into the distance characteristic graphs (seeFIG. 5 ) (Step S25). - Once the amplitude spectra have been all converted into distance characteristic graphs ("YES" in Step S26), the
control unit 103 generates a map (seeFIG. 6 or FIG. 7 ) based on each of the distance characteristic graphs (Step S27). - Once maps for all of the distance characteristic graphs have been generated ("YES" in Step S28), the
control unit 103 synthesizes the generated maps to generate a synthesized map (seeFIG. 8 ) (Step S29). In addition, thecontrol unit 103 causes thedisplay unit 104 described later to display the generated synthesized map (Step S30). - Examples of the cases where the status visualization apparatus is applied to a CS-structure blast furnace have been described above.
- Meanwhile, a furnace (industrial furnace) to which the status visualization apparatus can be applied is not limited thereto, and examples thereof include a furnace provided with a furnace wall including a steel shell and a refractory (refractory brick). Specific examples thereof include a blast furnace (blast furnace with three-layer structure) other than the CS-structure blast furnace, an electric furnace, a converter, a ladle (RH furnace or the like), a torpedo car, and a gasification melting furnace.
- Next, a status visualization apparatus 1A according to another embodiment (referred to as "Embodiment A") is described using
FIGS. 13 to 18 . -
FIG. 13 is a functional block diagram of the state visualization apparatus 1A. - As shown in
FIG. 13 , the status visualization apparatus 1A includes theinput unit 101, thereception unit 102, thecontrol unit 103, and thedisplay unit 104. - The
input unit 101 is constituted of an impact hammer, a vibrator, or the like. - When the
input unit 101 is constituted of an impact hammer, use is made of an impact hammer with frequency characteristics which allow measurement of the expected maximum value of the resonant frequency. The expected value of the resonant frequency can be calculated through simulation. - The
reception unit 102 is constituted of, for example, an accelerometer. - When the
reception unit 102 is constituted of an accelerometer, use is preferably made of an accelerometer capable of detecting acceleration in a normal direction of the steel shell 12 (seeFIG. 1 ). - The
control unit 103 controls the entire status visualization apparatus 1A. - The
control unit 103 is constituted of, for example, one or more processors. - The
control unit 103 may be constituted of a logic circuit (hardware) formed in, for example, an integrated circuit (IC chip). - The
control unit 103 may be constituted of software with use of a central processing unit (CPU). - The
control unit 103 may be constituted of a field-programmable gate array (FPGA) or an application-specific integrated circuit (ASIC), for example. - The
control unit 103 includes afrequency analysis unit 201, a distancecharacteristic calculation unit 202, astorage unit 203, and amap generation unit 204. These units may each include an independent casing. - The
frequency analysis unit 201 is constituted of, for example, a fast Fourier transform (FFT) analyzer. The distancecharacteristic calculation unit 202, thestorage unit 203, and themap generation unit 204 are constituted of, for example, a personal computer (PC). - The
control unit 103 may be provided with a data bus for communicating data between the above-described units. - Some of the respective units constituting the
control unit 103 may be provided in a separate terminal (not shown). - The
frequency analysis unit 201 receives a reflection wave received by thereception unit 102, performs frequency analysis, and calculates frequency characteristics. - As an exemplary frequency characteristic to be output, an amplitude spectrum is used, but this is not the sole case; for instance, a frequency response function calculated from an elastic wave and a reflection wave may be used, the elastic wave being input by the
input unit 101 and the reflection wave being received by thereception unit 102. - Examples of the frequency analysis method include discrete Fourier transform (DFT) and fast Fourier transform (FFT) which rapidly executes DFT, but these are not the sole cases; the frequency analysis may be carried out through the wavelet transform.
- The
frequency analysis unit 201 may directly perform frequency analysis on the reflection wave received from thereception unit 102 to obtain the amplitude spectrum. Thefrequency analysis unit 201 may also perform frequency analysis only on a signal in a specific frequency band with use of a band pass filter to obtain the amplitude spectrum. Moreover, thefrequency analysis unit 201 may perform frequency analysis on a signal that is cut out from the received reflection wave with use of a window function to obtain the amplitude spectrum. - As the frequency characteristic analysis method by the
frequency analysis unit 201, a method involving discrete Fourier transform is described. - At the time t, hypothetically, the sampling number of an acceleration signal that is measured by the
reception unit 102 is n, and the sampled signal that is sampled from the acceleration signal is a(n). At this time, the discrete Fourier transform A(k) for a(n) can be calculated by the following Formula (1).
[Mathematical Formula 1]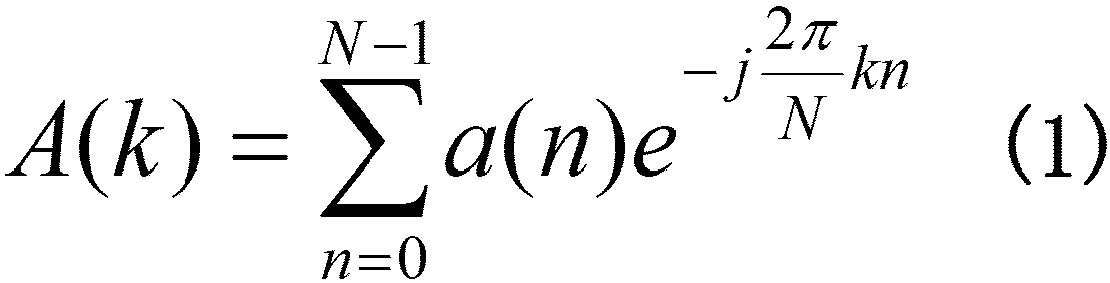
- Here, k is a sampling number of a frequency (k=0, 1, ..., N-1), N is a gate length of a sampled signal a(n) subjected to the discrete Fourier transform.
- The lower limit of the gate length N can be calculated from the maximum frequency fmax to be observed, the reciprocating time T of an elastic wave based on the maximum thickness of the
refractory brick 16, and the number of reciprocations m of an elastic wave used in frequency analysis. When a sampling interval of an acceleration signal is Δt, the maximum frequency fmax to be observed can be calculated by the following Formula (2).
[Mathematical Formula 2]
- In this calculation, the time width of a signal subjected to the frequency analysis with the gate length N is determined by N x Δt, and this time width needs to be equal to or more than the reciprocating time m x T for m reciprocations of the elastic wave. Hence, the lower limit of the gate length N is determined by the following Formula (3).
[Mathematical Formula 3]
- The upper limit of the gate length N is determined, for example, based on an input interval of elastic waves by the
input unit 101 or time during which at least a certain level of attenuation of the acceleration signal is observed. - The amplitude spectrum of A(k) can be calculated from the absolute value |A(k)| of A(k).
- The distance
characteristic calculation unit 202 converts the frequency characteristics calculated by thefrequency analysis unit 201 into distance characteristics. - In an exemplary method for converting frequency characteristics into distance characteristics, the wavelength calculated from a sound velocity and a frequency may be used as a distance, or a frequency may be converted into a distance using the relationship between the thickness of the
refractory brick 16 and the frequency read out from thestorage unit 203, the relationship between the thickness and the frequency being preliminarily obtained through simulation and stored in thestorage unit 203. - As the method for calculating distance characteristics by the distance
characteristic calculation unit 202, a method for calculating distance characteristics using the sound velocity is described. - The frequency fk of the sampled number k of the amplitude spectrum |A(k)| calculated by the
frequency analysis unit 201 can be calculated by the following Formula (4).
[Mathematical Formula 4]
- When the sound velocity is c, the wavelength λk can be calculated by the following Formula (5).
[Mathematical Formula 5]
- At this time, the distance characteristic F (λk) is determined by the following Formula (6).
[Mathematical Formula 6]
- The
storage unit 203 stores, for example, the acceleration signal measured by thereception unit 102, the processing result of each unit in thecontrol unit 103, and various data used in the processing. - The
storage unit 203 is constituted of, for example, a random access memory (RAM), or a storage apparatus such as a hard disk. - The
map generation unit 204 generates a map showing likelihood of the reflection position (i.e., reflection position likelihood) of theelastic wave 21 in therefractory brick 16 based on the distance characteristics calculated by the distancecharacteristic calculation unit 202. - In the embodiment, the
map generation unit 204 calculates the likelihood of the reflection position using the distance characteristics calculated by the distancecharacteristic calculation unit 202 and subsequently generates a map showing the thus calculated likelihood of the reflection position as described below. - The method for calculating likelihood of the reflection position at an arbitrary point R in the
refractory brick 16 by themap generation unit 204 is described with reference toFIGS. 14 and 15 . -
FIG. 14 is a perspective view showing thefurnace wall 11 with thereception unit 102 being attached to thesteel shell 12.FIG. 15 is a conceptual diagram of the distance characteristics calculated by the distancecharacteristic calculation unit 202. - In
FIG. 14 , the position where thereception unit 102 is attached has a spatial coordinate (xp, yp, zp), and an arbitrary point R in therefractory brick 16 has a spatial coordinate (xr, yr, zr). - At this time, the distance dr between the point R in the
refractory brick 16 and the position where thereception unit 102 is attached can be calculated by the following Formula (7).
[Mathematical Formula 7]
- When the distance dr thus obtained is applied to the distance characteristics calculated by the distance
characteristic calculation unit 202 to calculate F(dr), the likelihood L(xr, yr, zr) of the reflection position at the point R in therefractory brick 16 can be calculated by the following Formula (8) using the distance characteristic F(dr) of the distance dr.
[Mathematical Formula 8]
- In the formula, k=0, 1, ..., N-1.
- Here, max(x) is a function for calculating the largest element in the parentheses.
- Next, described with reference to
FIG. 16 is the method for calculating the likelihood of the reflection position at an arbitrary point R in therefractory brick 16 by themap generation unit 204 in a case where a plurality ofreception units 102 separately receivereflection waves 22 at plural positions. -
FIG. 16 is a perspective view showing thefurnace wall 11 withM reception units 102 being attached to thesteel shell 12. - In
FIG. 16 , the positions where thereception units 102 are attached have spatial coordinates (xp0, yp0, zp0), (xp1, yp1, zp1), ..., (xpM-1, ypM-1, zpM-1), and the arbitrary point R in therefractory brick 16 has a spatial coordinate (xr, yr, zr). - At this time, the distance drm between the point R in the
refractory brick 16 and the position where themth reception unit 102 is attached can be calculated by the following Formula (9). - [Mathematical Formula 9]

- In the formula, m=0, 1, ..., M-1.
- When the distance drm thus obtained is applied to the distance characteristics calculated by the distance
characteristic calculation unit 202 to calculate F(drm), the likelihood L(xr, yr, zr) of the reflection position at the point R in therefractory brick 16 can be calculated by the following Formula (10) using the distance characteristic F(drm) of the distance drm.
[Mathematical Formula 10]
- The
map generation unit 204 generates a map in which the level of likelihood of a reflection position is visualized. - The map is preferably a two-dimensional map or a three-dimensional map. In the embodiment, a heat map is selected as an example of the map. In the heat map in the embodiment, a distance from a measurement point is shown on the vertical axis and the horizontal axis, and an amplitude (intensity) is drawn in color gradation. The heat map may express the level of likelihood of a reflection position in hue. The heat map may be a three-dimensional heat map or a two-dimensional heat map of an arbitrary cross section selected by a user of the state visualization apparatus 1A.
- The
display unit 104 displays aheat map 401 generated by themap generation unit 204 or a user interface (UI) for operating the state visualization apparatus 1A. -
FIG. 17 is a schematic view showing thedisplay unit 104 displaying theheat map 401. - The
display unit 104 is constituted of, for example, a liquid crystal display (LCD), an organic electroluminescence display (OELD), or another device. - Processing performed by the state visualization apparatus 1A is described using
FIG. 18 . -
FIG. 18 is a flowchart showing an example of a processing flow in the state visualization apparatus 1A. - The
reception unit 102 first receives a reflection wave signal (Step S100). - Next, the
frequency analysis unit 201 receives the reflection wave signal from thereception unit 102 and performs frequency analysis on the received signal to calculate an amplitude spectrum (Step S101). - Next, the distance
characteristic calculation unit 202 converts the amplitude spectrum calculated by thefrequency analysis unit 201 into a distance characteristic (Step S102). - Next, the
map generation unit 204 calculates likelihood of a reflection position in therefractory brick 16 using the distance characteristic calculated by the distance characteristic calculation unit 202 (Step S103). - The
map generation unit 204 determines whether the likelihood of the reflection position has been calculated for all of the points in the refractory brick 16 (Step S104). In a case where the likelihood of the reflection position has not been calculated for all of the points yet ("NO" in Step S104), calculation of the likelihood of the reflection position is repeatedly performed (Step S103). - It should be noted that in a case where the likelihood of the reflection position has not been calculated for all of the points yet ("NO" in Step S104), the
same reception unit 102 again or anotherreception unit 102 may receive a reflection wave (Step S100). In this case, subsequently, an amplitude spectrum is calculated (Step S101), the calculated amplitude spectrum is converted into a distance characteristic (Step S102), and the likelihood of the reflection position is calculated using the distance characteristic (Step S103). - In a case where the likelihood of the reflection position has been calculated for all of the points ("YES" in Step S104), the
map generation unit 204 generates a map in which the level of likelihood of the reflection position is reflected (Step S105). In the embodiment, themap generation unit 204 generates theheat map 401 in which the level of likelihood of a reflection position is reflected in color gradation. - The
control unit 103 then drives and controls thedisplay unit 104 such that thedisplay unit 104 displays the map generated by the map generation unit 204 (Step S106). In the embodiment, thecontrol unit 103 drives and controls thedisplay unit 104 such that theheat map 401 generated by themap generation unit 204 is displayed in thedisplay unit 104. - Next, another embodiment (called "Embodiment B") is further described.
- With regard to Embodiment B, only differences from Embodiment A are described. In particular, Embodiment B is different from Embodiment A in the distance
characteristic calculation unit 202. - Hereinbelow, described is a method in which the distance
characteristic calculation unit 202 preliminarily acquires the relationship between the thickness of therefractory brick 16 and the frequency through simulation and stores the relationship in thestorage unit 203, and the relationship between the thickness and the frequency is read out from thestorage unit 203 to convert the frequency into a distance. - As the method of calculating a distance characteristic by the distance
characteristic calculation unit 202, a method of calculating a distance characteristic using a result of vibration application simulation according to the finite element method is described. - The finite element method is a numerical analysis technique for approximately solving differential equations, in which a continuum is divided into elements having finite sizes for calculation. The ultrasound propagation motion in a continuum is expressed by the differential equation shown in the following Formula (11).
[Mathematical Formula 11]
- Here, ρ represents a density, σ a stress, x a coordinate, i and j numerals in coordinate axes, b a body force, u a displacement, and t a time.
- When the Formula (11) above is subjected to division into elements having finite sizes, the ultrasound propagation motion at the time tn is expressed by the following Formula (12).
[Mathematical Formula 12]
- Here, [M] represents an element mass matrix, [C] an element attenuation matrix, [K] an element rigidity matrix, {u"} an acceleration vector, {u'} a velocity vector, {u} a displacement vector, and {f} an external force vector. Established here is a relationship where u" is an acceleration when a displacement u is differentiated twice, and u' is a velocity when a displacement u is differentiated once.
- The distance
characteristic calculation unit 202 generates a three-dimensional model of a furnace (blast furnace) that is divided into elements having definite sizes. The three-dimensional model of a furnace may be of an entire furnace. The three-dimensional model of a furnace may also be of only therefractory brick 16 whose thickness is measured and an outer layer region of therefractory brick 16. The distancecharacteristic calculation unit 202 generates a plurality of three-dimensional models having different thicknesses of therefractory brick 16. - The distance
characteristic calculation unit 202 successively calculates the ultrasound propagation motion of the above Formula (12) using each of the generated three-dimensional models. - The ultrasound propagation motion is simulated with use of the three-dimensional model of the thickness T of the
refractory brick 16, and, as a result, the acceleration signal observed at an acceleration measurement position {xp} is defined as aTxp(n). At this time, the discrete Fourier transform ATxp(k) of aTxp(n) can be calculated by the following Formula (13).
[Mathematical Formula 13]
- In the formula, k=0, 1, ..., N-1.
- Using the ATxp(k), the distance
characteristic calculation unit 202 calculates the resonant frequency fT of the thickness T of therefractory brick 16 according to the following equation (14).
[Mathematical Formula 14]
- In the formula, k=0, 1, ..., N-1.
- Here, argmax (x) is a function to calculate a parameter below argmax which maximizes the element in the parentheses.
- The distance
characteristic calculation unit 202 performs calculation of the above Formula (14) for each thickness T of therefractory brick 16, thereby deriving a function for converting between the thickness T of therefractory brick 16 and a resonant frequency f. - The distance
characteristic calculation unit 202 may derive a function for associating the thickness of therefractory brick 16 with the resonant frequency in a one-to-one manner through simulation with the thickness of therefractory brick 16 for each resolution by which the thickness is determined. Moreover, the distancecharacteristic calculation unit 202 may derive an approximation expression for converting between the thickness of therefractory brick 16 and the resonant frequency through simulation with a representative point. -
- 1, 1A: state visualization apparatus
- 11: furnace wall
- 12: steel shell
- 13: unshaped refractory
- 14: copper plate
- 15: unshaped refractory
- 16: refractory brick
- 17: hole
- 18: end
- 19: crack
- 21: elastic wave
- 22: reflection wave
- 101: input unit
- 102: reception unit
- 103: control unit
- 104: display unit
- 201: frequency analysis unit
- 202: distance characteristic calculation unit
- 203: storage unit
- 204: map generation unit
- 401: heat map (map)
Claims (4)
- A refractory state visualization method comprising:a step of inputting an elastic wave to a furnace wall having a refractory;a step of receiving a reflection wave of the elastic wave;a step of determining a frequency characteristic of the reflection wave;a step of determining a distance characteristic from the frequency characteristic; anda step of generating a map showing likelihood of a reflection position in the refractory based on the distance characteristic.
- The refractory state visualization method according to claim 1,wherein the distance characteristic includes a plurality of distance characteristics, andthe map is generated by synthesizing maps that are separately generated for the plurality of distance characteristics.
- A refractory repair method comprising repairing a refractory based on a map generated by the refractory state visualization method according to claim 1 or 2.
- A refractory state visualization apparatus comprising:an input unit adapted to input an elastic wave to a furnace wall having a refractory;a reception unit adapted to receive a reflection wave of the elastic wave; anda control unit adapted to determine a frequency characteristic of the reflection wave, determine a distance characteristic from the frequency characteristic, and generate a map showing likelihood of a reflection position in the refractory based on the distance characteristic.
Applications Claiming Priority (2)
| Application Number | Priority Date | Filing Date | Title |
|---|---|---|---|
| JP2022101839 | 2022-06-24 | ||
| PCT/JP2023/022848 WO2023249031A1 (en) | 2022-06-24 | 2023-06-21 | Refractory material state visualization method, refractory material repair method, and refractory material state visualization device |
Publications (2)
| Publication Number | Publication Date |
|---|---|
| EP4509618A1 true EP4509618A1 (en) | 2025-02-19 |
| EP4509618A4 EP4509618A4 (en) | 2025-09-24 |
Family
ID=88509959
Family Applications (1)
| Application Number | Title | Priority Date | Filing Date |
|---|---|---|---|
| EP23827214.0A Pending EP4509618A4 (en) | 2022-06-24 | 2023-06-21 | Method for visualizing the condition of a refractory material, method for repairing a refractory material, and device for visualizing the condition of a refractory material |
Country Status (4)
| Country | Link |
|---|---|
| EP (1) | EP4509618A4 (en) |
| JP (1) | JP7371823B1 (en) |
| KR (1) | KR20250004270A (en) |
| CN (1) | CN119234119A (en) |
Family Cites Families (6)
| Publication number | Priority date | Publication date | Assignee | Title |
|---|---|---|---|---|
| JPS62297710A (en) | 1986-06-16 | 1987-12-24 | Nippon Steel Corp | Thickness detecting method for double-layer refractory wall by impulse elastic wave |
| JP3039308B2 (en) | 1995-02-16 | 2000-05-08 | 住友金属工業株式会社 | Refractory thickness measurement method using elastic waves |
| JP2001294918A (en) * | 2000-04-13 | 2001-10-26 | Nippon Steel Corp | Refractory thickness measurement method in furnace |
| JP2008209107A (en) * | 2007-01-29 | 2008-09-11 | Mitsubishi Heavy Ind Ltd | Method for monitoring refractory on furnace bottom in melting furnace |
| JP5438276B2 (en) * | 2007-01-29 | 2014-03-12 | 三菱重工環境・化学エンジニアリング株式会社 | Refractory erosion detection method and apparatus for melting furnace bottom |
| BR112022020068A2 (en) * | 2020-04-06 | 2022-11-22 | Paneratech Inc | METHOD AND APPARATUS FOR ASSESSING THE STATUS OF A MATERIAL IN METALLURGICAL CONTAINERS |
-
2023
- 2023-06-21 EP EP23827214.0A patent/EP4509618A4/en active Pending
- 2023-06-21 JP JP2023552118A patent/JP7371823B1/en active Active
- 2023-06-21 CN CN202380041449.XA patent/CN119234119A/en active Pending
- 2023-06-21 KR KR1020247037547A patent/KR20250004270A/en active Pending
Also Published As
| Publication number | Publication date |
|---|---|
| JP7371823B1 (en) | 2023-10-31 |
| JPWO2023249031A1 (en) | 2023-12-28 |
| EP4509618A4 (en) | 2025-09-24 |
| KR20250004270A (en) | 2025-01-07 |
| CN119234119A (en) | 2024-12-31 |
Similar Documents
| Publication | Publication Date | Title |
|---|---|---|
| Andreaus et al. | Cracked beam identification by numerically analysing the nonlinear behaviour of the harmonically forced response | |
| US7665362B2 (en) | Systems, methods and apparatus for non-disruptive and non-destructive inspection of metallurgical furnaces and similar vessels | |
| CN104204769B (en) | Method and system for the certainty fatigue life prediction of rotor material | |
| Żółtowski | Investigations of harbour brick structures by using operational modal analysis | |
| EP2198229B1 (en) | Method for the acoustic monitoring of tapblocks and similar elements | |
| CN110564905B (en) | A signal processing method and system for detecting blast furnace lining impact echo | |
| US12055922B2 (en) | Analysis system and analysis method | |
| US20100169043A1 (en) | Non-destructive thickness measurement systems and methods | |
| CN115754013B (en) | A method, system, medium and device for visual inversion of coal rock mass stress field | |
| EP4163589B1 (en) | Estimation device, estimation method, and computer program product for estimating deposit thickness | |
| US20180080884A1 (en) | Macrotexture Map Visualizing Texture Heterogeneity in Polycrystalline Parts | |
| RU2542589C2 (en) | Method of reconstruction of three-dimensional image of physical state of monitored object in measurement point | |
| Zima et al. | Nondestructive global corrosion measurement using guided wavefield data | |
| EP3708992B1 (en) | Estimating device, estimating method, and program storing medium | |
| JP3039308B2 (en) | Refractory thickness measurement method using elastic waves | |
| US6345535B1 (en) | Apparatus and method for estimating the compressive strength of foam cement | |
| JP3981740B1 (en) | Diagnostic system and diagnostic method for concrete structure | |
| Christian et al. | Real-time quantification of damage in structural materials during mechanical testing | |
| JPH03218421A (en) | Oscillation mode measuring device | |
| WO2019058478A1 (en) | Vibration determination device, vibration determination method, and program | |
| JP7371823B1 (en) | Refractory condition visualization method, refractory repair method, and refractory condition visualization device | |
| JP5390447B2 (en) | Method for estimating noise countermeasure effect | |
| WO2023249031A1 (en) | Refractory material state visualization method, refractory material repair method, and refractory material state visualization device | |
| EP1893972B1 (en) | Systems, methods and apparatus for non-disruptive and non-destructive inspection of metallurgical furnaces and similar vessels | |
| Commandeur et al. | Observations and improvements on the impact-echo method used for blast furnace hearth refractory measurement |
Legal Events
| Date | Code | Title | Description |
|---|---|---|---|
| STAA | Information on the status of an ep patent application or granted ep patent |
Free format text: STATUS: THE INTERNATIONAL PUBLICATION HAS BEEN MADE |
|
| PUAI | Public reference made under article 153(3) epc to a published international application that has entered the european phase |
Free format text: ORIGINAL CODE: 0009012 |
|
| STAA | Information on the status of an ep patent application or granted ep patent |
Free format text: STATUS: REQUEST FOR EXAMINATION WAS MADE |
|
| 17P | Request for examination filed |
Effective date: 20241112 |
|
| AK | Designated contracting states |
Kind code of ref document: A1 Designated state(s): AL AT BE BG CH CY CZ DE DK EE ES FI FR GB GR HR HU IE IS IT LI LT LU LV MC ME MK MT NL NO PL PT RO RS SE SI SK SM TR |
|
| A4 | Supplementary search report drawn up and despatched |
Effective date: 20250827 |
|
| RIC1 | Information provided on ipc code assigned before grant |
Ipc: C21B 7/24 20060101AFI20250821BHEP Ipc: C21C 5/44 20060101ALI20250821BHEP Ipc: C21C 5/46 20060101ALI20250821BHEP Ipc: F27D 1/00 20060101ALI20250821BHEP Ipc: F27D 1/16 20060101ALI20250821BHEP Ipc: G01N 29/06 20060101ALI20250821BHEP Ipc: F27B 1/28 20060101ALI20250821BHEP Ipc: F27D 21/00 20060101ALI20250821BHEP Ipc: G01N 29/11 20060101ALI20250821BHEP |
|
| DAV | Request for validation of the european patent (deleted) | ||
| DAX | Request for extension of the european patent (deleted) | ||
| STAA | Information on the status of an ep patent application or granted ep patent |
Free format text: STATUS: EXAMINATION IS IN PROGRESS |