EP4502610A1 - Data processing system and method for automatic analyzer - Google Patents
Data processing system and method for automatic analyzer Download PDFInfo
- Publication number
- EP4502610A1 EP4502610A1 EP23776813.0A EP23776813A EP4502610A1 EP 4502610 A1 EP4502610 A1 EP 4502610A1 EP 23776813 A EP23776813 A EP 23776813A EP 4502610 A1 EP4502610 A1 EP 4502610A1
- Authority
- EP
- European Patent Office
- Prior art keywords
- periodic noise
- automatic analyzer
- noise
- data processing
- reagent
- Prior art date
- Legal status (The legal status is an assumption and is not a legal conclusion. Google has not performed a legal analysis and makes no representation as to the accuracy of the status listed.)
- Pending
Links
Images



Classifications
-
- G—PHYSICS
- G01—MEASURING; TESTING
- G01N—INVESTIGATING OR ANALYSING MATERIALS BY DETERMINING THEIR CHEMICAL OR PHYSICAL PROPERTIES
- G01N21/00—Investigating or analysing materials by the use of optical means, i.e. using sub-millimetre waves, infrared, visible or ultraviolet light
- G01N21/75—Systems in which material is subjected to a chemical reaction, the progress or the result of the reaction being investigated
- G01N21/77—Systems in which material is subjected to a chemical reaction, the progress or the result of the reaction being investigated by observing the effect on a chemical indicator
-
- G—PHYSICS
- G01—MEASURING; TESTING
- G01D—MEASURING NOT SPECIALLY ADAPTED FOR A SPECIFIC VARIABLE; ARRANGEMENTS FOR MEASURING TWO OR MORE VARIABLES NOT COVERED IN A SINGLE OTHER SUBCLASS; TARIFF METERING APPARATUS; MEASURING OR TESTING NOT OTHERWISE PROVIDED FOR
- G01D3/00—Indicating or recording apparatus with provision for the special purposes referred to in the subgroups
- G01D3/028—Indicating or recording apparatus with provision for the special purposes referred to in the subgroups mitigating undesired influences, e.g. temperature, pressure
- G01D3/032—Indicating or recording apparatus with provision for the special purposes referred to in the subgroups mitigating undesired influences, e.g. temperature, pressure affecting incoming signal, e.g. by averaging; gating undesired signals
-
- G—PHYSICS
- G01—MEASURING; TESTING
- G01N—INVESTIGATING OR ANALYSING MATERIALS BY DETERMINING THEIR CHEMICAL OR PHYSICAL PROPERTIES
- G01N35/00—Automatic analysis not limited to methods or materials provided for in any single one of groups G01N1/00 - G01N33/00; Handling materials therefor
- G01N35/00584—Control arrangements for automatic analysers
-
- G—PHYSICS
- G01—MEASURING; TESTING
- G01N—INVESTIGATING OR ANALYSING MATERIALS BY DETERMINING THEIR CHEMICAL OR PHYSICAL PROPERTIES
- G01N21/00—Investigating or analysing materials by the use of optical means, i.e. using sub-millimetre waves, infrared, visible or ultraviolet light
- G01N21/75—Systems in which material is subjected to a chemical reaction, the progress or the result of the reaction being investigated
- G01N21/77—Systems in which material is subjected to a chemical reaction, the progress or the result of the reaction being investigated by observing the effect on a chemical indicator
- G01N2021/7769—Measurement method of reaction-produced change in sensor
- G01N2021/7783—Transmission, loss
-
- G—PHYSICS
- G01—MEASURING; TESTING
- G01N—INVESTIGATING OR ANALYSING MATERIALS BY DETERMINING THEIR CHEMICAL OR PHYSICAL PROPERTIES
- G01N2201/00—Features of devices classified in G01N21/00
- G01N2201/12—Circuits of general importance; Signal processing
Definitions
- the present invention relates to a data processing technique of an automatic analyzer including a measurement mechanism of a test piece.
- the abstract of the following PTL 1 discloses that "To be surely capable of removing periodic noise superimposed on a measuring signal without delaying the measuring signal.”
- a first noise frequency detecting unit 1 performs an FFT process on a measuring signal, and detects a frequency of a periodic noise signal as first detection frequency.
- a noise signal analyzing unit 5 obtains a mutual correlation function between the first detection frequency and the measuring signal, and calculates, based on the mutual correlation function, an amplitude and a phase of the periodic noise signal superimposed on the measuring signal posterior to a point of time when the mutual correlation function is obtained.
- a cancel signal preparing unit 7 prepares a cancel signal from the first detection frequency, the amplitude, and the phase related to the periodic noise signal.
- a signal cancel unit 3 calculates the measuring signal and the cancel signal, and cancels the periodic noise signal.”
- the abstract of the following PTL 2 discloses that "Provided is a data collection system for a mass spectrometer capable of removing systematic noise and obtaining a high-quality mass spectrum without increasing a size of a memory device of the data collection system and without incorporating a strong CPU in the data collection system.”, and that "In the data collection system for a mass spectrometer that collects data output from the mass spectrometer and performs data processing, noise of a predetermined period is acquired, and the noise is repeatedly subtracted from the data, thereby removing noise having periodicity from the data.”
- an object of the invention is to provide a data processing system and method for an automatic analyzer that prevent periodic noise superimposed on a measured waveform without enlarging a CPU and memory performance.
- the invention provides a data processing system of an automatic analyzer that obtains measurement data by a measurement mechanism of a test piece, in which an integration start position is determined based on a period and phase information of periodic noise, and the periodic noise is prevented by integrating or averaging the measurement data based on the determined integration start position.
- the invention provides a data processing method of an automatic analyzer that obtains measurement data by a measurement mechanism of a test piece, and the data processing method includes: determining an integration start position based on a period and phase information of periodic noise, and preventing the periodic noise by integrating or averaging the measurement data based on the determined integration start position.
- an automatic analyzer that performs a qualitative and quantitative analysis by irradiating a reaction liquid obtained by causing a reaction between a biological sample such as blood or urine and a reagent with light and measuring the light transmitted through the reaction liquid with a detector.
- an automatic analyzer 1 mainly includes a sample disk 10, a reagent disk 20, a reaction disk 30, a light transmitting unit 40, a light receiving unit 41, a light signal collection unit 42, and a computer 54.
- the reaction disk 30 is formed in a substantially circular plate shape, and a plurality of (for example, about 100 to 200) reaction containers 31 are disposed in a peripheral portion of an upper surface of the reaction disk 30.
- the reaction container 31 is formed of a light transmissive material in a substantially rectangular box shape.
- the reaction container 31 is maintained at a predetermined temperature (for example, 37 °C) by a thermostatic bath 32.
- sample aliquoting mechanism 16 is disposed near the sample disk 10.
- This sample aliquoting mechanism 16 includes a movable arm 15, and a pipette nozzle 17 attached to the movable arm 15.
- the pipette nozzle 17 moves to a aliquoting position by the movable arm 15 to aspiration a predetermined amount of sample from the specimen container 11 positioned at a aspiration position of the sample disk 10, and discharges the sample into the certain reaction container 31 at a discharging position on the reaction disk 30.
- a reagent refrigerator 22 formed in a substantially cylindrical shape is disposed in the reagent disk 20.
- a plurality of reagent bottles 21 are disposed along a circumferential direction of the reagent disk 20.
- a label (not shown) indicating reagent identification information such as a barcode is attached to each reagent bottle 21.
- Each reagent bottle 21 accommodates a reagent liquid corresponding to an analysis item that can be analyzed by the automatic analyzer 1.
- a barcode reading device 27 is disposed close to the reagent disk 20. The barcode reading device 27 reads the barcode displayed on an outer wall of each reagent bottle 21 at the time of reagent registration. The read reagent information is registered in a storage device 53 together with a position on the reagent disk 20.
- a reagent aliquoting mechanism 25 having substantially the same mechanism as the sample aliquoting mechanism 16 is disposed near the reagent disk 20.
- the reagent disk 20 disposes the reagent bottle 21 corresponding to a test item near the reagent aliquoting mechanism 25.
- the reaction disk 30 disposes the corresponding reaction container 31 near the reagent aliquoting mechanism 25.
- the reagent aliquoting mechanism 25 aspirates the reagent liquid from the reagent bottle 21 by a pipette nozzle 25a, and discharges the reagent liquid to the reaction container 31.
- a stirring mechanism 36 is disposed at a position surrounded by the reaction disk 30, the reagent disk 20, and the reagent aliquoting mechanism 25.
- the reaction liquid (test piece) of the sample and the reagent accommodated in the reaction container 31 is stirred by this stirring mechanism 36 to promote the reaction.
- the light transmitting unit 40 is disposed near a center portion of the reaction disk 30, and the light receiving unit 41 is disposed on an outer peripheral side of the reaction disk 30.
- a row of the reaction container 31 where the stirring is completed rotationally moves so as to pass through a photometry position sandwiched between the light transmitting unit 40 and the light receiving unit 41.
- the reaction disk 30 is intermittently driven at every, for example, 45° rotation angle, and rotates once in 18 seconds.
- the reaction liquid of the sample and the reagent in each reaction container 31 is irradiated with light by the light transmitting unit 40 every time the reaction liquid crosses the photometry position during the rotation operation of the reaction disk 30.
- a period where one reaction container 31 crosses the photometry position is, for example, about 10 msec to 30 msec.
- the transmitted light attenuated according to an absorbance of the reaction liquid is incident on the light receiving unit 41 facing the reaction liquid.
- the light receiving unit 41 separates the received light for each wavelength and supplies a photocurrent signal corresponding to an intensity for each wavelength to the light signal collection unit 42.
- the computer 54 is connected to a sample aliquoting control unit 19, a reagent aliquoting control unit 29, and the light signal collection unit 42 via an interface 50.
- the computer 54 sends a command to the sample aliquoting control unit 19 to control the aliquoting operation of the sample.
- the computer 54 sends a command to the reagent aliquoting control unit 29 to control the aliquoting operation of the reagent.
- the light signal collection unit 42 converts a measurement signal into numerical data, and supplies the numerical data to the computer 54 via the interface 50.
- a printer 56 for printing, a storage device 53 as a storage device, an external output medium (not shown), an input device 52 for inputting an operation command and the like, and a display device 51 for displaying a screen are connected to the interface 50.
- the storage device 53 includes, for example, a hard disk memory or an external memory (not shown).
- the storage device 53 stores information such as passwords of the operators, display levels of the screens, analysis parameters, analysis item request contents, calibration results, and analysis results.
- the analysis parameters related to items that can be analyzed by the automatic analyzer 1 are input in advance via the input device 52 such as a keyboard and stored in the storage device 53.
- the operator selects the test item requested for each sample using an operation function screen of the display device 51.
- the pipette nozzle 17 of the sample aliquoting mechanism 16 aliquots a predetermined amount of the sample from the specimen container 11 to the reaction container 31 according to the analysis parameter.
- the reaction container 31 where the sample is aliquoted is transferred by the rotation of the reaction disk 30, and stops at a reagent receiving position near the reagent aliquoting mechanism 25.
- the pipette nozzle 25a of the reagent aliquoting mechanism 25 aliquots a predetermined amount of the reagent liquid into the reaction container 31 according to the analysis parameter of the corresponding test item.
- a aliquoting order of the sample and the reagent may be opposite to this example, and the reagent may be aliquoted earlier than the sample.
- the sample and the reagent are stirred by the stirring mechanism 36 such that the sample and the reagent are mixed.
- the transmitted light of the reaction liquid is measured by the light receiving unit 41.
- the measured transmitted light is converted into the numerical data corresponding to an amount of the light by a signal processing circuit, and is taken into the computer 54 via the interface 50.
- concentration data is calculated based on a calibration curve measured in advance by an analysis method specified for each test item.
- Component concentration data as the analysis result of each test item is output to a screen of the printer 56 or the display device 51.
- the operator sets various parameters necessary for analysis measurement and registers the test piece via an operation screen of the display device 51. Further, the operator confirms the analysis result after the measurement through the operation screen on the display device 51.
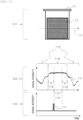
- FIG. 2 shows a cross-sectional view 101 of the reaction container in a rotation direction, a waveform 102 of the light signal collection unit, and a waveform 103 of a reaction liquid start position.
- the waveform 102 of the light signal collection unit is measured by scanning 113 of a light axis of the transmitted light.
- the reaction container 31 contains a reaction liquid 112.
- the waveform 102 of the light signal collection unit includes a reaction liquid section waveform 114 and section waveforms 115 of a place other than the reaction liquid including clearance between a wall surface of the reaction container and the adjacent reaction container.
- a reaction liquid start position detection unit is provided as a unit for detecting a position of the reaction liquid 112, and it is possible to measure only a portion where the reaction liquid is present while detecting the position of the reaction liquid 112 by this detection unit.
- the waveform 103 of the reaction liquid start position indicates a signal issued from the reaction liquid start position detection unit.
- an issuance timing of a trigger signal 117 of the waveform 103 of the reaction liquid start position is set by providing a margin 118 and a margin 119 from the wall portion of the reaction container.
- the margin 118 with a front wall portion of the reaction container is defined as t fm
- the margin 119 with a rear wall portion of the reaction container is defined as t bm .
- a signal 121 including random noise due to disturbance is observed.
- the random noise can be reduced by performing integration processing or averaging processing in a certain integration section 116 in accordance with a timing of a section where the reaction liquid is present.
- FIGS. 3 and 4 relate to Embodiment 1, and show a case where periodic noise is superimposed on the waveform 102 of the light signal collection unit due to the influence of the disturbance. A fact that the periodic noise cannot be prevented by the integration processing or the averaging processing will be described with reference to FIGS. 3 and 4 .
- FIG. 3 shows a signal 122 where the periodic noise is superimposed on the signal 121 including the random noise.
- FIG. 4 shows a signal 123 where the periodic noise is superimposed on the signal 121 including the random noise.
- the signal 123 where the periodic noise is superimposed has the same period as compared with the signal 122 where the periodic noise is superimposed in FIG. 3 , but a phase of the period is shifted by 180 degrees.
- Embodiment 1 Next, a method for preventing the periodic noise in Embodiment 1 will be described.
- a waveform related to the periodic noise is acquired in advance, and a frequency and phase analysis is performed to acquire a frequency and phase information of the periodic noise.
- t cycle is a period of the periodic noise and is an inverse number of the frequency of the periodic noise.
- t phase is a phase of the periodic noise
- t average is a time of the integration processing or the averaging processing corresponding to the integration section 116
- n is any integer.
- the periodic noise synchronization timing t sync provides a start position of the integration processing or the averaging processing such that a result becomes constant.
- this t sync is set as a start position candidate t sync1 of the integration processing or the averaging processing.
- t sync1 satisfying Formula (2) is determined as the start position of the integration processing or the averaging processing by using the times t fm and t bm up to the margin 118 and the margin 119 with respect to the wall portion of the reaction container shown in FIG. 2 .
- FIGS. 5 and 6 relate to Embodiment 1.
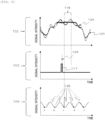
- FIG. 5 and FIG. 3 , and FIG. 6 and FIG. 4 respectively show cases where the same periodic noise is superimposed. A fact that the periodic noise can be prevented by the integration processing or the averaging processing will be described with reference to FIGS. 5 and 6 .
- FIGS. 5 and 6 show synchronization timing positions 125 that visualize the periodic noise synchronization timing t sync in accordance with a waveform 104 where the periodic noise is superimposed.
- the integration processing or the averaging processing is performed in the integration section 116 based on a synchronization timing position 125b closest to a timing of the trigger signal 117 of the waveform 103 of the reaction liquid start position. Since an amplitude of the periodic noise in the integration section 116 is positive-negative symmetric with respect to the measurement value of the reaction liquid 112, the periodic noise included in the result of the integration processing or the averaging processing is removed.
- the integration processing or the averaging processing is performed in the integration section 116 based on a synchronization timing position 125c' closest to the timing of the trigger signal 117 of the waveform 103 of the reaction liquid start position. Since the amplitude of the periodic noise in the integration section 116 is positive-negative symmetric with respect to the measurement value of the reaction liquid 112, the periodic noise included in the result of the integration processing or the averaging processing is removed.
- the invention in order to remove the random noise and the periodic noise, it is sufficient to have a configuration including a small amount of memory for storing the frequency and the phase information of the periodic noise and a small scale arithmetic unit for only executing the calculation of the periodic noise synchronization timing and conditional branching of the determination of the start position of the processing.
- the automatic analyzer is exemplified where the reaction liquid obtained by causing a reaction between the biological sample and the reagent is irradiated with light and the light transmitted through the reaction liquid is measured with the detector, but the invention is not limited to this embodiment, and can be applied to an automatic analyzer that performs measurement in which a timing of data collection and a timing of noise having periodicity are different.
Landscapes
- Physics & Mathematics (AREA)
- Chemical & Material Sciences (AREA)
- General Physics & Mathematics (AREA)
- General Health & Medical Sciences (AREA)
- Analytical Chemistry (AREA)
- Biochemistry (AREA)
- Life Sciences & Earth Sciences (AREA)
- Health & Medical Sciences (AREA)
- Immunology (AREA)
- Pathology (AREA)
- Engineering & Computer Science (AREA)
- Chemical Kinetics & Catalysis (AREA)
- Plasma & Fusion (AREA)
- Automatic Analysis And Handling Materials Therefor (AREA)
Abstract
Description
- The present invention relates to a data processing technique of an automatic analyzer including a measurement mechanism of a test piece.
- As a background art of the present technical field, there is a known method of removing noise having a random property superimposed on a measuring signal by measuring a test piece for a certain time and performing integrating processing or averaging processing on acquired data as a method of reducing noise having a random property superimposed on measurement data of a test piece.
- In addition, as a method of reducing noise having periodicity superimposed on measurement data of a test piece, the abstract of the following
PTL 1 discloses that "To be surely capable of removing periodic noise superimposed on a measuring signal without delaying the measuring signal.", and that "A first noisefrequency detecting unit 1 performs an FFT process on a measuring signal, and detects a frequency of a periodic noise signal as first detection frequency. A noise signal analyzing unit 5 obtains a mutual correlation function between the first detection frequency and the measuring signal, and calculates, based on the mutual correlation function, an amplitude and a phase of the periodic noise signal superimposed on the measuring signal posterior to a point of time when the mutual correlation function is obtained. A cancel signal preparing unit 7 prepares a cancel signal from the first detection frequency, the amplitude, and the phase related to the periodic noise signal. A signal cancel unit 3 calculates the measuring signal and the cancel signal, and cancels the periodic noise signal." - Further, the abstract of the following PTL 2 discloses that "Provided is a data collection system for a mass spectrometer capable of removing systematic noise and obtaining a high-quality mass spectrum without increasing a size of a memory device of the data collection system and without incorporating a strong CPU in the data collection system.", and that "In the data collection system for a mass spectrometer that collects data output from the mass spectrometer and performs data processing, noise of a predetermined period is acquired, and the noise is repeatedly subtracted from the data, thereby removing noise having periodicity from the data."
-
- PTL 1:
JP2002-171183A - PTL 2:
JP2000-299083A - In the above-described technique, there is a demand to prevent the random noise and the periodic noise with a more reasonable configuration of an arithmetic unit and a storage device. The invention has been made in view of the above circumstances, and an object of the invention is to provide a data processing system and method for an automatic analyzer that prevent periodic noise superimposed on a measured waveform without enlarging a CPU and memory performance.
- In order to solve the above problems, the invention provides a data processing system of an automatic analyzer that obtains measurement data by a measurement mechanism of a test piece, in which an integration start position is determined based on a period and phase information of periodic noise, and the periodic noise is prevented by integrating or averaging the measurement data based on the determined integration start position.
- Further, in order to solve the above problems, the invention provides a data processing method of an automatic analyzer that obtains measurement data by a measurement mechanism of a test piece, and the data processing method includes: determining an integration start position based on a period and phase information of periodic noise, and preventing the periodic noise by integrating or averaging the measurement data based on the determined integration start position.
- According to the invention, it is possible to prevent periodic noise superimposed on a measured waveform without enlarging a CPU and memory performance.
-
- [
FIG. 1] FIG. 1 is a diagram showing a schematic configuration of an automatic analyzer according toEmbodiment 1. - [
FIG. 2] FIG. 2 is a diagram showing a reaction container and waveforms of transmitted light according toEmbodiment 1. - [
FIG. 3] FIG. 3 is a diagram showing an example of transmitted light where periodic noise is superimposed and a reaction liquid start position signal according toEmbodiment 1. - [
FIG. 4] FIG. 4 is a diagram showing another example of the transmitted light where the periodic noise is superimposed and the reaction liquid start position signal according toEmbodiment 1. - [
FIG. 5] FIG. 5 is a diagram showing an example of the transmitted light where the periodic noise is superimposed, the reaction liquid start position signal, and periodic noise synchronization timings according toEmbodiment 1. - [
FIG. 6] FIG. 6 is a diagram showing another example of the transmitted light where the periodic noise is superimposed, the reaction liquid start position signal, and the periodic noise synchronization timings according toEmbodiment 1. - Hereinafter, a preferred embodiment will be described by taking, as an example, an automatic analyzer that performs a qualitative and quantitative analysis by irradiating a reaction liquid obtained by causing a reaction between a biological sample such as blood or urine and a reagent with light and measuring the light transmitted through the reaction liquid with a detector.
- First, an outline of an automatic analyzer according to
Embodiment 1 of the invention shown inFIG. 1 will be described. InFIG. 1 , anautomatic analyzer 1 mainly includes asample disk 10, areagent disk 20, areaction disk 30, a light transmittingunit 40, alight receiving unit 41, a lightsignal collection unit 42, and acomputer 54. - The
reaction disk 30 is formed in a substantially circular plate shape, and a plurality of (for example, about 100 to 200)reaction containers 31 are disposed in a peripheral portion of an upper surface of thereaction disk 30. Thereaction container 31 is formed of a light transmissive material in a substantially rectangular box shape. Thereaction container 31 is maintained at a predetermined temperature (for example, 37 °C) by athermostatic bath 32. - A large number of
specimen containers 11 that accommodate biological samples such as blood and urine are placed on thesample disk 10 in a double manner along a circumferential direction in the shown example. Further, asample aliquoting mechanism 16 is disposed near thesample disk 10. Thissample aliquoting mechanism 16 includes a movable arm 15, and a pipette nozzle 17 attached to the movable arm 15. - With the above configuration, in the
sample aliquoting mechanism 16, when aliquoting a sample, the pipette nozzle 17 moves to a aliquoting position by the movable arm 15 to aspiration a predetermined amount of sample from thespecimen container 11 positioned at a aspiration position of thesample disk 10, and discharges the sample into thecertain reaction container 31 at a discharging position on thereaction disk 30. - A
reagent refrigerator 22 formed in a substantially cylindrical shape is disposed in thereagent disk 20. In thisreagent refrigerator 22, a plurality ofreagent bottles 21 are disposed along a circumferential direction of thereagent disk 20. A label (not shown) indicating reagent identification information such as a barcode is attached to eachreagent bottle 21. - Each
reagent bottle 21 accommodates a reagent liquid corresponding to an analysis item that can be analyzed by theautomatic analyzer 1. In addition, abarcode reading device 27 is disposed close to thereagent disk 20. Thebarcode reading device 27 reads the barcode displayed on an outer wall of eachreagent bottle 21 at the time of reagent registration. The read reagent information is registered in astorage device 53 together with a position on thereagent disk 20. - In addition, a reagent aliquoting mechanism 25 having substantially the same mechanism as the
sample aliquoting mechanism 16 is disposed near thereagent disk 20. At the time of reagent aliquoting, thereagent disk 20 disposes thereagent bottle 21 corresponding to a test item near the reagent aliquoting mechanism 25. Thereaction disk 30 disposes thecorresponding reaction container 31 near the reagent aliquoting mechanism 25. Then, the reagent aliquoting mechanism 25 aspirates the reagent liquid from thereagent bottle 21 by apipette nozzle 25a, and discharges the reagent liquid to thereaction container 31. - A
stirring mechanism 36 is disposed at a position surrounded by thereaction disk 30, thereagent disk 20, and the reagent aliquoting mechanism 25. The reaction liquid (test piece) of the sample and the reagent accommodated in thereaction container 31 is stirred by thisstirring mechanism 36 to promote the reaction. Thelight transmitting unit 40 is disposed near a center portion of thereaction disk 30, and thelight receiving unit 41 is disposed on an outer peripheral side of thereaction disk 30. A row of thereaction container 31 where the stirring is completed rotationally moves so as to pass through a photometry position sandwiched between the light transmittingunit 40 and thelight receiving unit 41. - The
reaction disk 30 is intermittently driven at every, for example, 45° rotation angle, and rotates once in 18 seconds. The reaction liquid of the sample and the reagent in eachreaction container 31 is irradiated with light by thelight transmitting unit 40 every time the reaction liquid crosses the photometry position during the rotation operation of thereaction disk 30. A period where onereaction container 31 crosses the photometry position is, for example, about 10 msec to 30 msec. The transmitted light attenuated according to an absorbance of the reaction liquid is incident on thelight receiving unit 41 facing the reaction liquid. Thelight receiving unit 41 separates the received light for each wavelength and supplies a photocurrent signal corresponding to an intensity for each wavelength to the lightsignal collection unit 42. - Next, a control system and a signal processing system in the
automatic analyzer 1 inFIG. 1 will be briefly described. Thecomputer 54 is connected to a samplealiquoting control unit 19, a reagentaliquoting control unit 29, and the lightsignal collection unit 42 via aninterface 50. Thecomputer 54 sends a command to the samplealiquoting control unit 19 to control the aliquoting operation of the sample. In addition, thecomputer 54 sends a command to the reagentaliquoting control unit 29 to control the aliquoting operation of the reagent. - The light
signal collection unit 42 converts a measurement signal into numerical data, and supplies the numerical data to thecomputer 54 via theinterface 50. Aprinter 56 for printing, astorage device 53 as a storage device, an external output medium (not shown), an input device 52 for inputting an operation command and the like, and adisplay device 51 for displaying a screen are connected to theinterface 50. - The
storage device 53 includes, for example, a hard disk memory or an external memory (not shown). Thestorage device 53 stores information such as passwords of the operators, display levels of the screens, analysis parameters, analysis item request contents, calibration results, and analysis results. - Next, analysis operations of the sample in the
automatic analyzer 1 inFIG. 1 will be described. The analysis parameters related to items that can be analyzed by theautomatic analyzer 1 are input in advance via the input device 52 such as a keyboard and stored in thestorage device 53. The operator selects the test item requested for each sample using an operation function screen of thedisplay device 51. - At this time, information such as a patient ID is also received from the input device 52. In order to analyze the instructed test item for each sample, the pipette nozzle 17 of the
sample aliquoting mechanism 16 aliquots a predetermined amount of the sample from thespecimen container 11 to thereaction container 31 according to the analysis parameter. - The
reaction container 31 where the sample is aliquoted is transferred by the rotation of thereaction disk 30, and stops at a reagent receiving position near the reagent aliquoting mechanism 25. Thepipette nozzle 25a of the reagent aliquoting mechanism 25 aliquots a predetermined amount of the reagent liquid into thereaction container 31 according to the analysis parameter of the corresponding test item. A aliquoting order of the sample and the reagent may be opposite to this example, and the reagent may be aliquoted earlier than the sample. - Thereafter, the sample and the reagent are stirred by the stirring
mechanism 36 such that the sample and the reagent are mixed. When thisreaction container 31 crosses the photometry position, the transmitted light of the reaction liquid is measured by thelight receiving unit 41. The measured transmitted light is converted into the numerical data corresponding to an amount of the light by a signal processing circuit, and is taken into thecomputer 54 via theinterface 50. - Using the converted numerical values, concentration data is calculated based on a calibration curve measured in advance by an analysis method specified for each test item. Component concentration data as the analysis result of each test item is output to a screen of the
printer 56 or thedisplay device 51. Before the above measurement operation is performed, the operator sets various parameters necessary for analysis measurement and registers the test piece via an operation screen of thedisplay device 51. Further, the operator confirms the analysis result after the measurement through the operation screen on thedisplay device 51. -
FIG. 2 relates toEmbodiment 1, and shows waveforms when a change in the amount of the light of the reaction liquid in thereaction container 31 is measured by thelight transmitting unit 40 and thelight receiving unit 41. -
FIG. 2 shows across-sectional view 101 of the reaction container in a rotation direction, awaveform 102 of the light signal collection unit, and awaveform 103 of a reaction liquid start position. Thewaveform 102 of the light signal collection unit is measured by scanning 113 of a light axis of the transmitted light. Thereaction container 31 contains areaction liquid 112. - The
waveform 102 of the light signal collection unit includes a reactionliquid section waveform 114 andsection waveforms 115 of a place other than the reaction liquid including clearance between a wall surface of the reaction container and the adjacent reaction container. - Although not shown in
FIG. 2 , a reaction liquid start position detection unit is provided as a unit for detecting a position of thereaction liquid 112, and it is possible to measure only a portion where the reaction liquid is present while detecting the position of thereaction liquid 112 by this detection unit. - The
waveform 103 of the reaction liquid start position indicates a signal issued from the reaction liquid start position detection unit. Here, in order to eliminate an influence of rapid transmitted light transition of the wall portion of the reaction container, an issuance timing of atrigger signal 117 of thewaveform 103 of the reaction liquid start position is set by providing a margin 118 and a margin 119 from the wall portion of the reaction container. - With respect to the issuance timing of the
trigger signal 117 of thewaveform 103 of the reaction liquid start position, the margin 118 with a front wall portion of the reaction container is defined as tfm, and the margin 119 with a rear wall portion of the reaction container is defined as tbm. - In the
waveform 102 of the light signal collection unit, asignal 121 including random noise due to disturbance is observed. Based on thetrigger signal 117 of thewaveform 103 of the reaction liquid start position, the random noise can be reduced by performing integration processing or averaging processing in acertain integration section 116 in accordance with a timing of a section where the reaction liquid is present. -
FIGS. 3 and4 relate toEmbodiment 1, and show a case where periodic noise is superimposed on thewaveform 102 of the light signal collection unit due to the influence of the disturbance. A fact that the periodic noise cannot be prevented by the integration processing or the averaging processing will be described with reference toFIGS. 3 and4 . -
FIG. 3 shows asignal 122 where the periodic noise is superimposed on thesignal 121 including the random noise. - In the case of
FIG. 3 , when the integration processing or the averaging processing is performed in theintegration section 116 based on thetrigger signal 117 of thewaveform 103 of the reaction liquid start position, since a positive half period of the periodic noise is taken, a value larger than an original measurement value of thereaction liquid 112 is output. -
FIG. 4 shows asignal 123 where the periodic noise is superimposed on thesignal 121 including the random noise. Thesignal 123 where the periodic noise is superimposed has the same period as compared with thesignal 122 where the periodic noise is superimposed inFIG. 3 , but a phase of the period is shifted by 180 degrees. - In the case of
FIG. 4 , when the integration processing or the averaging processing is performed in theintegration section 116 based on thetrigger signal 117 of thewaveform 103 of the reaction liquid start position, since a negative half period of the periodic noise is taken, a value smaller than the original measurement value of thereaction liquid 112 is output. - Since the
signal 122 and thesignal 123 where the periodic noise is superimposed in this manner have different phases even when the period is the same, a difference occurs in the results of the integration processing or the averaging processing, which leads to deterioration in accuracy. - Next, a method for preventing the periodic noise in
Embodiment 1 will be described. - First, as preprocessing, a waveform related to the periodic noise is acquired in advance, and a frequency and phase analysis is performed to acquire a frequency and phase information of the periodic noise.
- A periodic noise synchronization timing tsync is defined as Formula (1) from the frequency and the phase information obtained in advance.
[Math. 1]
- In Formula (1), tcycle is a period of the periodic noise and is an inverse number of the frequency of the periodic noise. In addition, tphase is a phase of the periodic noise, taverage is a time of the integration processing or the averaging processing corresponding to the
integration section 116, and n is any integer. - When the integration processing or the averaging processing is performed on the acquired
signal 122 or the acquiredsignal 123 where the periodic noise is superimposed, the periodic noise synchronization timing tsync provides a start position of the integration processing or the averaging processing such that a result becomes constant. - tsync at which a difference from the time ttrig at which the
trigger signal 117 of thewaveform 103 of the reaction liquid start position is issued is minimized is obtained, and this tsync is set as a start position candidate tsync1 of the integration processing or the averaging processing. - In this state, since there is a possibility that tsync1 indicates a position where the
reaction container 31 is not present, tsync1 satisfying Formula (2) is determined as the start position of the integration processing or the averaging processing by using the times tfm and tbm up to the margin 118 and the margin 119 with respect to the wall portion of the reaction container shown inFIG. 2 .
[Math. 2]
-
FIGS. 5 and6 relate toEmbodiment 1.FIG. 5 andFIG. 3 , andFIG. 6 andFIG. 4 respectively show cases where the same periodic noise is superimposed. A fact that the periodic noise can be prevented by the integration processing or the averaging processing will be described with reference toFIGS. 5 and6 . -
FIGS. 5 and6 show synchronization timing positions 125 that visualize the periodic noise synchronization timing tsync in accordance with awaveform 104 where the periodic noise is superimposed. - In the case of
FIG. 5 , the integration processing or the averaging processing is performed in theintegration section 116 based on a synchronization timing position 125b closest to a timing of thetrigger signal 117 of thewaveform 103 of the reaction liquid start position. Since an amplitude of the periodic noise in theintegration section 116 is positive-negative symmetric with respect to the measurement value of thereaction liquid 112, the periodic noise included in the result of the integration processing or the averaging processing is removed. - In the case of
FIG. 6 , the integration processing or the averaging processing is performed in theintegration section 116 based on a synchronization timing position 125c' closest to the timing of thetrigger signal 117 of thewaveform 103 of the reaction liquid start position. Since the amplitude of the periodic noise in theintegration section 116 is positive-negative symmetric with respect to the measurement value of thereaction liquid 112, the periodic noise included in the result of the integration processing or the averaging processing is removed. - One embodiment of the invention has been described above. According to the invention, in order to remove the random noise and the periodic noise, it is sufficient to have a configuration including a small amount of memory for storing the frequency and the phase information of the periodic noise and a small scale arithmetic unit for only executing the calculation of the periodic noise synchronization timing and conditional branching of the determination of the start position of the processing.
- In the preferred embodiment, the automatic analyzer is exemplified where the reaction liquid obtained by causing a reaction between the biological sample and the reagent is irradiated with light and the light transmitted through the reaction liquid is measured with the detector, but the invention is not limited to this embodiment, and can be applied to an automatic analyzer that performs measurement in which a timing of data collection and a timing of noise having periodicity are different.
-
- 1: automatic analyzer
- 10: sample disk
- 11: specimen container
- 15: movable arm
- 16: sample aliquoting mechanism
- 17: pipette nozzle
- 19: sample aliquoting control unit
- 20: reagent disk
- 21: reagent bottle
- 22: reagent refrigerator
- 25: reagent aliquoting mechanism
- 25a: pipette nozzle
- 27: barcode reading device
- 29: reagent aliquoting control unit
- 30: reaction disk
- 31: reaction container
- 32: thermostatic bath
- 36: stirring mechanism
- 40: light transmitting unit
- 41: light receiving unit
- 42: light signal collection unit
- 50: interface
- 51: display device
- 52: input device
- 53: storage device
- 54: computer
- 56: printer
- 101: cross-section view in rotation direction
- 102: waveform of light signal collection unit
- 103: waveform at start position of reaction liquid
- 112: reaction liquid
- 113: scanning of light axis
- 114: reaction liquid section waveform
- 115: section waveform of place other than reaction liquid
- 116: integration section
- 117: trigger signal
- 118: margin with front wall portion of reaction container
- 119: margin with rear wall portion of reaction container
- 121: signal including random noise
- 122: signal where periodic noise is superimposed
- 123: signal where periodic noise is superimposed
- 125: periodic noise synchronization timing position
Claims (8)
- A data processing system of an automatic analyzer that obtains measurement data by a measurement mechanism of a test piece, wherein
an integration start position is determined based on a period and phase information of periodic noise, and the periodic noise is prevented by integrating or averaging the measurement data based on the determined integration start position. - The data processing system of an automatic analyzer according to claim 1, wherein
the measurement data is analyzed to acquire the period and the phase information of the periodic noise. - The data processing system of an automatic analyzer according to claim 1 or 2, wherein
the integration start position is a position allowing the periodic noise to be reduced when integrating or averaging the periodic noise. - The data processing system of an automatic analyzer according to claim 1 or 2, wherein
a time for performing the integration or the averaging is set at a position where the periodic noise is reduced in order to reduce noise having a random property included in the measurement data. - A data processing method of an automatic analyzer that obtains measurement data by a measurement mechanism of a test piece, the method comprising:
determining an integration start position based on a period and phase information of periodic noise, and preventing the periodic noise by integrating or averaging the measurement data based on the determined integration start position. - The data processing method of an automatic analyzer according to claim 5, wherein
the measurement data is analyzed to acquire the period and the phase information of the periodic noise. - The data processing method of an automatic analyzer according to claim 5 or 6, wherein
the integration start position is a position allowing the periodic noise to be reduced when integrating or averaging the periodic noise. - The data processing method of an automatic analyzer according to claim 5 or 6, wherein
a time for performing the integration or the averaging is set at a position where the periodic noise is reduced in order to reduce noise having a random property included in the measurement data.
Applications Claiming Priority (2)
| Application Number | Priority Date | Filing Date | Title |
|---|---|---|---|
| JP2022055705 | 2022-03-30 | ||
| PCT/JP2023/002594 WO2023188765A1 (en) | 2022-03-30 | 2023-01-27 | Data processing system and method for automatic analyzer |
Publications (2)
| Publication Number | Publication Date |
|---|---|
| EP4502610A1 true EP4502610A1 (en) | 2025-02-05 |
| EP4502610A4 EP4502610A4 (en) | 2026-03-18 |
Family
ID=88200714
Family Applications (1)
| Application Number | Title | Priority Date | Filing Date |
|---|---|---|---|
| EP23776813.0A Pending EP4502610A4 (en) | 2022-03-30 | 2023-01-27 | DATA PROCESSING SYSTEM AND METHOD FOR AN AUTOMATIC ANALYST |
Country Status (5)
| Country | Link |
|---|---|
| US (1) | US20250198935A1 (en) |
| EP (1) | EP4502610A4 (en) |
| JP (1) | JP7719956B2 (en) |
| CN (1) | CN118922722A (en) |
| WO (1) | WO2023188765A1 (en) |
Family Cites Families (8)
| Publication number | Priority date | Publication date | Assignee | Title |
|---|---|---|---|---|
| JPH03118423A (en) * | 1989-09-29 | 1991-05-21 | Yamato Scale Co Ltd | Filtering apparatus of weight measuring signal |
| JPH08114632A (en) * | 1994-10-14 | 1996-05-07 | Horiba Ltd | Noise eliminator |
| JP2002257868A (en) * | 2001-03-05 | 2002-09-11 | Hioki Ee Corp | How to remove hum noise from electrical measuring instruments |
| JP5072423B2 (en) * | 2007-05-01 | 2012-11-14 | キヤノン株式会社 | Noise removing apparatus and noise removing method |
| JP5487546B2 (en) * | 2008-02-18 | 2014-05-07 | パナソニック株式会社 | Angular velocity sensor |
| JP5771737B2 (en) * | 2012-02-17 | 2015-09-02 | 株式会社日立製作所 | Minute signal detection method and system |
| JP2014137350A (en) * | 2013-01-18 | 2014-07-28 | Hitachi High-Technologies Corp | Method for removing noise of chromatogram, and chromatography apparatus |
| JP6102618B2 (en) * | 2013-08-05 | 2017-03-29 | 横河電機株式会社 | Periodic noise elimination A / D converter |
-
2023
- 2023-01-27 US US18/843,034 patent/US20250198935A1/en active Pending
- 2023-01-27 CN CN202380027018.8A patent/CN118922722A/en active Pending
- 2023-01-27 JP JP2024511311A patent/JP7719956B2/en active Active
- 2023-01-27 WO PCT/JP2023/002594 patent/WO2023188765A1/en not_active Ceased
- 2023-01-27 EP EP23776813.0A patent/EP4502610A4/en active Pending
Also Published As
| Publication number | Publication date |
|---|---|
| CN118922722A (en) | 2024-11-08 |
| JP7719956B2 (en) | 2025-08-06 |
| US20250198935A1 (en) | 2025-06-19 |
| EP4502610A4 (en) | 2026-03-18 |
| JPWO2023188765A1 (en) | 2023-10-05 |
| WO2023188765A1 (en) | 2023-10-05 |
Similar Documents
| Publication | Publication Date | Title |
|---|---|---|
| EP2562547B1 (en) | Automatic analysis device and automatic analysis method | |
| EP2799882A1 (en) | Automatic analysis device and detection method for measurement value abnormalities | |
| JP5972762B2 (en) | Automatic analyzer | |
| JP2010190779A (en) | Automatic analyzer | |
| JPH11142412A (en) | Automatic analyzer | |
| US20250198935A1 (en) | Data Processing System and Method for Automatic Analyzer | |
| CN114174800B (en) | Automatic analysis device | |
| CN111727366B (en) | Signal processing device and signal processing method | |
| EP3660514B1 (en) | Automated analyzer and image processing method | |
| US11009518B2 (en) | Apparatus and method for automated analysis | |
| JPH10282099A (en) | Automatic analyzer | |
| JP4117253B2 (en) | Automatic analyzer | |
| JP5860643B2 (en) | Automatic analyzer | |
| EP4040161B1 (en) | PROCEDURE FOR SELECTING PIERCING CONDITIONS | |
| JP5205124B2 (en) | Automatic analyzer and its management method | |
| US11125765B2 (en) | Automatic analyzer | |
| JP2020128906A (en) | Analysis method, method for creating analytical curve, and automatic analyzer | |
| JP2017020956A (en) | Automatic analyzer, automatic analyzing method, and program | |
| EP4685491A1 (en) | Automated analysis device and sample analysis method | |
| JP2008058065A (en) | Automatic analyzer and automatic analysis method | |
| JPH10300755A (en) | Automatic analyzer | |
| JP5414286B2 (en) | Automatic analyzer | |
| EP4220181A1 (en) | Automatic analysis device | |
| JPH0961435A (en) | Automatic analyzer | |
| JPH03110474A (en) | Data processor in automatic analyzer |
Legal Events
| Date | Code | Title | Description |
|---|---|---|---|
| STAA | Information on the status of an ep patent application or granted ep patent |
Free format text: STATUS: UNKNOWN |
|
| STAA | Information on the status of an ep patent application or granted ep patent |
Free format text: STATUS: THE INTERNATIONAL PUBLICATION HAS BEEN MADE |
|
| PUAI | Public reference made under article 153(3) epc to a published international application that has entered the european phase |
Free format text: ORIGINAL CODE: 0009012 |
|
| STAA | Information on the status of an ep patent application or granted ep patent |
Free format text: STATUS: REQUEST FOR EXAMINATION WAS MADE |
|
| 17P | Request for examination filed |
Effective date: 20240904 |
|
| AK | Designated contracting states |
Kind code of ref document: A1 Designated state(s): AL AT BE BG CH CY CZ DE DK EE ES FI FR GB GR HR HU IE IS IT LI LT LU LV MC ME MK MT NL NO PL PT RO RS SE SI SK SM TR |
|
| DAV | Request for validation of the european patent (deleted) | ||
| DAX | Request for extension of the european patent (deleted) | ||
| REG | Reference to a national code |
Ref country code: DE Ref legal event code: R079 Free format text: PREVIOUS MAIN CLASS: G01N0035000000 Ipc: G01D0003032000 |
|
| A4 | Supplementary search report drawn up and despatched |
Effective date: 20260216 |
|
| RIC1 | Information provided on ipc code assigned before grant |
Ipc: G01D 3/032 20060101AFI20260210BHEP Ipc: G01N 21/77 20060101ALI20260210BHEP Ipc: G01N 35/00 20060101ALN20260210BHEP |