EP4487787A1 - Computer program, information processing device, and information processing method - Google Patents
Computer program, information processing device, and information processing method Download PDFInfo
- Publication number
- EP4487787A1 EP4487787A1 EP23779289.0A EP23779289A EP4487787A1 EP 4487787 A1 EP4487787 A1 EP 4487787A1 EP 23779289 A EP23779289 A EP 23779289A EP 4487787 A1 EP4487787 A1 EP 4487787A1
- Authority
- EP
- European Patent Office
- Prior art keywords
- frames
- luminal organ
- basis
- blood vessel
- feature value
- Prior art date
- Legal status (The legal status is an assumption and is not a legal conclusion. Google has not performed a legal analysis and makes no representation as to the accuracy of the status listed.)
- Pending
Links
Images







Classifications
-
- A—HUMAN NECESSITIES
- A61—MEDICAL OR VETERINARY SCIENCE; HYGIENE
- A61B—DIAGNOSIS; SURGERY; IDENTIFICATION
- A61B8/00—Diagnosis using ultrasonic, sonic or infrasonic waves
- A61B8/08—Clinical applications
- A61B8/0891—Clinical applications for diagnosis of blood vessels
-
- A—HUMAN NECESSITIES
- A61—MEDICAL OR VETERINARY SCIENCE; HYGIENE
- A61B—DIAGNOSIS; SURGERY; IDENTIFICATION
- A61B5/00—Measuring for diagnostic purposes; Identification of persons
- A61B5/0033—Features or image-related aspects of imaging apparatus, e.g. for MRI, optical tomography or impedance tomography apparatus; Arrangements of imaging apparatus in a room
- A61B5/004—Features or image-related aspects of imaging apparatus, e.g. for MRI, optical tomography or impedance tomography apparatus; Arrangements of imaging apparatus in a room adapted for image acquisition of a particular organ or body part
-
- A—HUMAN NECESSITIES
- A61—MEDICAL OR VETERINARY SCIENCE; HYGIENE
- A61B—DIAGNOSIS; SURGERY; IDENTIFICATION
- A61B5/00—Measuring for diagnostic purposes; Identification of persons
- A61B5/0059—Measuring for diagnostic purposes; Identification of persons using light, e.g. diagnosis by transillumination, diascopy, fluorescence
- A61B5/0062—Arrangements for scanning
- A61B5/0066—Optical coherence imaging
-
- A—HUMAN NECESSITIES
- A61—MEDICAL OR VETERINARY SCIENCE; HYGIENE
- A61B—DIAGNOSIS; SURGERY; IDENTIFICATION
- A61B5/00—Measuring for diagnostic purposes; Identification of persons
- A61B5/0059—Measuring for diagnostic purposes; Identification of persons using light, e.g. diagnosis by transillumination, diascopy, fluorescence
- A61B5/0082—Measuring for diagnostic purposes; Identification of persons using light, e.g. diagnosis by transillumination, diascopy, fluorescence adapted for particular medical purposes
- A61B5/0084—Measuring for diagnostic purposes; Identification of persons using light, e.g. diagnosis by transillumination, diascopy, fluorescence adapted for particular medical purposes for introduction into the body, e.g. by catheters
-
- A—HUMAN NECESSITIES
- A61—MEDICAL OR VETERINARY SCIENCE; HYGIENE
- A61B—DIAGNOSIS; SURGERY; IDENTIFICATION
- A61B5/00—Measuring for diagnostic purposes; Identification of persons
- A61B5/02—Detecting, measuring or recording for evaluating the cardiovascular system, e.g. pulse, heart rate, blood pressure or blood flow
- A61B5/02007—Evaluating blood vessel condition, e.g. elasticity, compliance
-
- A—HUMAN NECESSITIES
- A61—MEDICAL OR VETERINARY SCIENCE; HYGIENE
- A61B—DIAGNOSIS; SURGERY; IDENTIFICATION
- A61B5/00—Measuring for diagnostic purposes; Identification of persons
- A61B5/72—Signal processing specially adapted for physiological signals or for diagnostic purposes
- A61B5/7271—Specific aspects of physiological measurement analysis
- A61B5/7285—Specific aspects of physiological measurement analysis for synchronizing or triggering a physiological measurement or image acquisition with a physiological event or waveform, e.g. an ECG signal
- A61B5/7289—Retrospective gating, i.e. associating measured signals or images with a physiological event after the actual measurement or image acquisition, e.g. by simultaneously recording an additional physiological signal during the measurement or image acquisition
-
- A—HUMAN NECESSITIES
- A61—MEDICAL OR VETERINARY SCIENCE; HYGIENE
- A61B—DIAGNOSIS; SURGERY; IDENTIFICATION
- A61B8/00—Diagnosis using ultrasonic, sonic or infrasonic waves
- A61B8/12—Diagnosis using ultrasonic, sonic or infrasonic waves in body cavities or body tracts, e.g. by using catheters
-
- A—HUMAN NECESSITIES
- A61—MEDICAL OR VETERINARY SCIENCE; HYGIENE
- A61B—DIAGNOSIS; SURGERY; IDENTIFICATION
- A61B8/00—Diagnosis using ultrasonic, sonic or infrasonic waves
- A61B8/52—Devices using data or image processing specially adapted for diagnosis using ultrasonic, sonic or infrasonic waves
- A61B8/5215—Devices using data or image processing specially adapted for diagnosis using ultrasonic, sonic or infrasonic waves involving processing of medical diagnostic data
- A61B8/5223—Devices using data or image processing specially adapted for diagnosis using ultrasonic, sonic or infrasonic waves involving processing of medical diagnostic data for extracting a diagnostic or physiological parameter from medical diagnostic data
-
- G—PHYSICS
- G06—COMPUTING OR CALCULATING; COUNTING
- G06T—IMAGE DATA PROCESSING OR GENERATION, IN GENERAL
- G06T7/00—Image analysis
-
- G—PHYSICS
- G06—COMPUTING OR CALCULATING; COUNTING
- G06T—IMAGE DATA PROCESSING OR GENERATION, IN GENERAL
- G06T7/00—Image analysis
- G06T7/0002—Inspection of images, e.g. flaw detection
- G06T7/0012—Biomedical image inspection
-
- G—PHYSICS
- G06—COMPUTING OR CALCULATING; COUNTING
- G06T—IMAGE DATA PROCESSING OR GENERATION, IN GENERAL
- G06T7/00—Image analysis
- G06T7/0002—Inspection of images, e.g. flaw detection
- G06T7/0012—Biomedical image inspection
- G06T7/0014—Biomedical image inspection using an image reference approach
- G06T7/0016—Biomedical image inspection using an image reference approach involving temporal comparison
-
- G—PHYSICS
- G06—COMPUTING OR CALCULATING; COUNTING
- G06T—IMAGE DATA PROCESSING OR GENERATION, IN GENERAL
- G06T7/00—Image analysis
- G06T7/60—Analysis of geometric attributes
- G06T7/62—Analysis of geometric attributes of area, perimeter, diameter or volume
-
- A—HUMAN NECESSITIES
- A61—MEDICAL OR VETERINARY SCIENCE; HYGIENE
- A61B—DIAGNOSIS; SURGERY; IDENTIFICATION
- A61B8/00—Diagnosis using ultrasonic, sonic or infrasonic waves
- A61B8/13—Tomography
- A61B8/14—Echo-tomography
-
- G—PHYSICS
- G06—COMPUTING OR CALCULATING; COUNTING
- G06T—IMAGE DATA PROCESSING OR GENERATION, IN GENERAL
- G06T2207/00—Indexing scheme for image analysis or image enhancement
- G06T2207/10—Image acquisition modality
- G06T2207/10072—Tomographic images
- G06T2207/10076—4D tomography; Time-sequential 3D tomography
-
- G—PHYSICS
- G06—COMPUTING OR CALCULATING; COUNTING
- G06T—IMAGE DATA PROCESSING OR GENERATION, IN GENERAL
- G06T2207/00—Indexing scheme for image analysis or image enhancement
- G06T2207/10—Image acquisition modality
- G06T2207/10072—Tomographic images
- G06T2207/10081—Computed x-ray tomography [CT]
-
- G—PHYSICS
- G06—COMPUTING OR CALCULATING; COUNTING
- G06T—IMAGE DATA PROCESSING OR GENERATION, IN GENERAL
- G06T2207/00—Indexing scheme for image analysis or image enhancement
- G06T2207/10—Image acquisition modality
- G06T2207/10072—Tomographic images
- G06T2207/10088—Magnetic resonance imaging [MRI]
-
- G—PHYSICS
- G06—COMPUTING OR CALCULATING; COUNTING
- G06T—IMAGE DATA PROCESSING OR GENERATION, IN GENERAL
- G06T2207/00—Indexing scheme for image analysis or image enhancement
- G06T2207/10—Image acquisition modality
- G06T2207/10072—Tomographic images
- G06T2207/10101—Optical tomography; Optical coherence tomography [OCT]
-
- G—PHYSICS
- G06—COMPUTING OR CALCULATING; COUNTING
- G06T—IMAGE DATA PROCESSING OR GENERATION, IN GENERAL
- G06T2207/00—Indexing scheme for image analysis or image enhancement
- G06T2207/10—Image acquisition modality
- G06T2207/10132—Ultrasound image
-
- G—PHYSICS
- G06—COMPUTING OR CALCULATING; COUNTING
- G06T—IMAGE DATA PROCESSING OR GENERATION, IN GENERAL
- G06T2207/00—Indexing scheme for image analysis or image enhancement
- G06T2207/20—Special algorithmic details
- G06T2207/20081—Training; Learning
-
- G—PHYSICS
- G06—COMPUTING OR CALCULATING; COUNTING
- G06T—IMAGE DATA PROCESSING OR GENERATION, IN GENERAL
- G06T2207/00—Indexing scheme for image analysis or image enhancement
- G06T2207/20—Special algorithmic details
- G06T2207/20084—Artificial neural networks [ANN]
-
- G—PHYSICS
- G06—COMPUTING OR CALCULATING; COUNTING
- G06T—IMAGE DATA PROCESSING OR GENERATION, IN GENERAL
- G06T2207/00—Indexing scheme for image analysis or image enhancement
- G06T2207/30—Subject of image; Context of image processing
- G06T2207/30004—Biomedical image processing
- G06T2207/30101—Blood vessel; Artery; Vein; Vascular
Definitions
- Patent Literature 1 discloses an image diagnosis apparatus that generates a blood vessel cross-sectional image on the basis of a signal (ultrasound emitted to a vascular tissue and reflected wave) obtained by an imaging core accommodated in a catheter inserted into a blood vessel.
- IVUS intravascular ultrasound
- Patent Literature 1 WO 2017/164071 A
- the present invention has been made in view of such circumstances, and it is therefore an object of the present invention to provide a computer program, an information processing apparatus, and an information processing method capable of extracting frames at specific intervals only on the basis of medical images.
- the present application includes a plurality of means for solving the above-described problems, and examples of the means includes a computer program causing a computer to execute processing of: acquiring medical image data representing a plurality of frames of cross-sectional images of a luminal organ; calculating a feature value of the luminal organ for each of the frames on the basis of the acquired medical image data; detecting a local maximum of variations in the feature value between the frames; and identifying a plurality of necessary frames from among the plurality of frames on the basis of the detected local maximum.
- the OCT is intravascular image diagnosis to which near-infrared rays and optical fiber technology are applied.
- a blood vessel will be described herein as an example of a luminal organ.
- the medical image includes one generated by the IVUS, the OFDI, or the OCT, but the case of using the IVUS method will be mainly described herein below.
- the information processing system 100 includes a catheter 10, a motor drive unit (MDU) 20, a display apparatus 30, an input apparatus 40, and an information processing apparatus 50.
- a server 200 is connected to the information processing apparatus 50 via a communication network 1.
- the catheter 10 is an image diagnosis catheter for obtaining an ultrasound tomographic image of a blood vessel by the IVUS method.
- the catheter 10 has an ultrasound probe provided at its distal end for obtaining an ultrasound tomographic image of a blood vessel.
- the ultrasound probe includes an ultrasound transducer that emits ultrasound in a blood vessel, and an ultrasound sensor that receives a reflected wave (ultrasound echo) reflected by a structure such as a biological tissue of the blood vessel or a medical device.
- the ultrasound probe is configured to be movable back and forth in a longitudinal direction of the blood vessel while rotating in a circumferential direction of the blood vessel.
- the MDU 20 is a drive apparatus to which the catheter 10 can be detachably attached, and drives a built-in motor in response to the operation made by a medical worker to control the motion of the catheter 10 inserted into a blood vessel.
- the MDU 20 can rotate the ultrasound probe of the catheter 10 in the circumferential direction while moving the ultrasound probe from the distal end (distal) side to the proximal end (proximal) side (pull-back operation).
- the ultrasound probe continuously scans the inside of the blood vessel at predetermined time intervals, and outputs reflected wave data of the detected ultrasound to the information processing apparatus 50.
- the display apparatus 30 includes a liquid crystal display panel, an organic EL display panel, or the like, and can display a result of processing executed by the information processing apparatus 50. Furthermore, the display apparatus 30 can display the medical image generated (acquired) by the information processing apparatus 50.
- the control unit 51 may include a predetermined number of central processing units (CPUs), micro-processing units (MPUs), graphics processing units (GPUs), general-purpose computing on graphics processing units (GPGPUs), or tensor processing units (TPUs). Furthermore, the control unit 51 may include a combination of digital signal processors (DSPs), field-programmable gate arrays (FPGAs), quantum processors, and the like.
- CPUs central processing units
- MPUs micro-processing units
- GPUs graphics processing units
- GPGPUs general-purpose computing on graphics processing units
- TPUs tensor processing units
- DSPs digital signal processors
- FPGAs field-programmable gate arrays
- quantum processors and the like.
- the control unit 51 can execute processing defined by the computer program 58. That is, the processing executed by the control unit 51 corresponds to processing executed in accordance with the computer program 58.
- the communication unit 52 includes, for example, a communication module and has a capability of communicating with the server 200 over the communication network 1. Furthermore, the communication unit 52 may have a capability of communicating with an external device (not illustrated) connected to the communication network 1. The communication unit 52 may acquire, from the server 200, medical image data representing a plurality of frames of cross-sectional images of a blood vessel.
- the interface unit 53 provides an interface function between the catheter 10, the display apparatus 30, and the input apparatus 40.
- the information processing apparatus 50 (control unit 51) can transmit and receive data or information to and from the catheter 10, the display apparatus 30, and the input apparatus 40 via the interface unit 53.
- the interface unit 53 may acquire, from the catheter 10, medical image data representing a plurality of frames of cross-sectional images of a blood vessel.
- Fig. 3 is a diagram illustrating a first example of processing based on the learning model 59.
- the learning model 59 includes an input layer 59a, an intermediate layer 59b, and an output layer 59c, and can be created as a U-Net, for example.
- the intermediate layer 59b includes a plurality of encoders and a plurality of decoders.
- the plurality of encoders repeat convolution processing on the medical image data input into the input layer 59a.
- the plurality of decoders repeat upsampling (deconvolution) processing on the image convolved by the encoders.
- the learning model 59 may be generated on the basis of the first training data to output region information on each of the boundary of a lumen and the boundary of a blood vessel when the medical image data representing the cross-sectional image of the blood vessel is input into the learning model 59.
- control unit 51 inputs the acquired medical image data into the learning model 59 that outputs region information on a predetermined site of a blood vessel to acquire region information on the predetermined site of the blood vessel for each frame.
- the control unit 51 (feature value calculation unit 54) can calculate the feature value of the blood vessel for each frame on the basis of the acquired region information.
- Figs. 6A and 6B are diagrams illustrating examples of the feature value.
- the feature value can be calculated for each piece of segmentation data S1, S2, S3, ..., and Sn corresponding to the frames 1 to n on a one-to-one basis illustrated in Fig. 5 .
- the segmentation data Sm corresponding to the frame m will be described.
- m can be 1 to n.
- the centroid O(x, y) may be obtained, for example, as a center position of a circle approximate to the boundary of the blood vessel.
- the centroid O(x, y) may be obtained, for example, by setting a plurality of vertices on the boundary of the blood vessel and obtaining the centroid of a polygon including the vertices.
- Fig. 6B illustrates a case where a mean lumen diameter D of the blood vessel is used as the feature value.
- the mean lumen diameter D may be calculated as follows: a maximum diameter D1 and a minimum diameter D2 of line segments passing through the centroid O of the blood vessel are obtained, and the mean of the maximum diameter D1 and the minimum diameter D2 is obtained as the mean lumen diameter D.
- the centroid position of the blood vessel is used as the feature value, but the mean lumen diameter D may be used.
- the feature value calculation unit 54 calculates variations in the feature value for each of the plurality of frames.
- the centroid position for the frame (i - 1) is denoted as ⁇ x(i - 1), y(i - 1) ⁇
- the centroid position for the frame i is denoted as ⁇ xi, yi ⁇ .
- a variation ⁇ i in feature value for the frame i is a variation from the centroid position ⁇ x(i - 1), y(i - 1) ⁇ to the centroid position ⁇ xi, yi ⁇ , and can be expressed by a distance between the two centroid positions ⁇ x(i - 1), y(i - 1) ⁇ and ⁇ xi, yi ⁇ .
- Fig. 8 is a diagram illustrating an example of the method of identifying a necessary frame.
- a symbol ⁇ indicates a position where the peak of variations in the centroid of the blood vessel is detected, and the corresponding frame becomes a necessary frame.
- the necessary frame is identified regardless of with or without a side branch.
- the necessary frame is a frame having a variation in the centroid of the blood vessel greater than or equal to a predetermined threshold, and is a frame corresponding to the specific heartbeat intervals.
- frames can be extracted at specific intervals only by acquiring medical image data representing a plurality of frames of cross-sectional images of the blood vessel.
- Fig. 9B only the necessary frames are extracted from all the frames, and the boundaries of the blood vessel of the extracted necessary frames are arranged.
- the number of the necessary frames is 1 to n', the frame number n' ⁇ the frame number n holds.
- the original frame 1 and the necessary frame 1 do not necessarily coincide with each other.
- the original frame 2 and the necessary frame 2 do not necessarily coincide with each other.
- the frames 1 to n' indicate the indexes of the necessary frames, and do not indicate the indexes of the original frames.
- Fig. 9B the boundaries of the blood vessel in the frames corresponding to the specific heartbeat intervals are shown, which makes the blood vessel boundary in each frame clear.
- Fig. 10 is a diagram illustrating an example of a method of identifying a corresponding point group of a predetermined site in a case where there is no side branch.
- the boundary of the lumen will be described as the predetermined site, but the predetermined site also includes the boundary of the blood vessel.
- the necessary frames identified by the frame identification unit 55 are denoted as 1, 2, 3, ..., n'. Segmentation data of the necessary frames are denoted as F1, F2, F3, ..., Fi, ..., Fj, ..., Fn'.
- the number of frames is n', and n' ⁇ the total number of frames n holds.
- a frame of interest is denoted as j, and a corresponding frame corresponding to the frame of interest j is denoted as i.
- the frame of interest j and the corresponding frame i are necessary frames for identifying the corresponding point group. Note that the frame of interest j and the corresponding frame i need not be adjacent frames, and another frame may exist between the frame of interest j and the corresponding frame i.
- a discrete point on the boundary of the lumen indicated by the segmentation data Fi of the frame i is represented by P (i, m)
- a discrete point on the boundary of the lumen indicated by the segmentation data Fj of the frame j is represented by P (j, m).
- m denotes a number from 1 to m, indicating the number of discrete points. Examples of a method of identifying the discrete points include: (1) a method of sequentially identifying the discrete points at the same angle along the boundary; (2) a method of identifying the discrete points such that the distance between the discrete points is constant; and (3) a method of identifying the discrete points such that the number of the discrete points is constant.
- the number of discrete points on the boundary of the blood vessel may be less than or equal to the number of discrete points on the boundary of the lumen. As a result, the number of discrete points on the boundary of the blood vessel can be reduced, and the visibility of the mesh of the lumen can be improved.
- Fig. 11 is a diagram illustrating an example of a method of connecting corresponding point groups. It is assumed that a discrete point group on the boundary of the lumen indicated by the segmentation data Fi of the frame i and a discrete point group on the boundary of the lumen indicated by the segmentation data Fj of the frame j are associated with each other.
- the discrete points associated with each other are referred to as corresponding points, and the corresponding points on the boundary are collectively referred to as corresponding point group.
- the segmentation data Fi of the frame i and the segmentation data Fj of the frame j are separated at an appropriate interval from each other and arranged along the Z-axis direction.
- the Z axis indicates the long axis direction of the blood vessel.
- the corresponding points (corresponding point group) of the frames i and j are connected by a straight line in the Z-axis direction. Furthermore, corresponding points adjacent on the boundary are connected by a straight line along the boundary. As a result, it is possible to generate a 3D image in which the boundaries of the lumen indicated by the respective pieces of segmentation data of the frames i and j are connected in a mesh shape. Similarly, a 3D mesh image can be generated for the boundary of the blood vessel. It is possible to generate, by executing similar processing on all the frames 1 to n, a 3D mesh image of the blood vessel.
- Fig. 12 is a diagram illustrating a first example of the method of identifying a corresponding point group of a predetermined site in a case where there is a side branch.
- the presence or absence of the side branch can be determined on the basis of the segmentation data output by the learning model 59.
- the presence or absence of a side branch can be determined on the basis of the eccentricity of the blood vessel cross-sectional shape.
- the eccentricity can be obtained by calculating the maximum diameter d1 and the minimum diameter d2 of the lumen diameter on the basis of the boundary of the lumen.
- the presence or absence of a side branch can be determined according to whether or not the eccentricity is greater than or equal to a predetermined threshold. Instead of the eccentricity, the circularity may be calculated.
- the circularity is the ratio of the area of the inner region of the boundary of the blood vessel to the circumferential length of the boundary of the blood vessel. It can be determined that the closer the circularity is to the ratio between the area of the circle and the length of the circumference, the higher the circularity is and the lower the possibility that a side branch is shown.
- a value obtained by comparing the diameter (maximum diameter and minimum diameter) of the target boundary of the blood vessel with the diameter of the boundary of the blood vessel shown in a scanned tomographic image is calculated as a parameter, and the presence or absence of a side branch can be determined according to whether or not the diameter suddenly changes by a predetermined ratio or more and by a predetermined length or more.
- determination may be made using a learning model for determination trained to output accuracy corresponding to the possibility that a side branch is shown in a case where data of the boundary of the lumen and the boundary of the blood vessel is input.
- the discrete point group of the boundary of the lumen of the segmentation Fi and the discrete point group of the boundary of the lumen of the main trunk of the segmentation Fj are associated with each other and identified as a corresponding point group, and is subjected to the same processing as the processing illustrated in Fig. 10 .
- the discrete point group of the boundary of the lumen of the side branch of the segmentation Fj is left as is, and is not subjected to the connection processing.
- control unit 51 can identify the corresponding point group of the predetermined site of the blood vessel in two different frames among the necessary frames identified by the frame identification unit 55, and generate the 3D image of the blood vessel on the basis of the identified corresponding point group.
- Fig. 16 is a diagram illustrating an example of a processing procedure by the information processing apparatus 50.
- the control unit 51 acquires medical image data (S11), inputs the acquired medical image data into the learning model 59 to acquire region information on a predetermined site of the blood vessel (for example, the boundary of the blood vessel and the boundary of the lumen) for each frame (S12).
- the computer program of the present embodiment causes the computer to further execute processing of generating information on plaque distribution in an axial direction of the luminal organ on the basis of region information on a predetermined site of the luminal organ for each of the identified necessary frames.
- the computer program of the present embodiment causes the computer to further execute processing of calculating a mean lumen diameter in an axial direction of the luminal organ on the basis of region information on a predetermined site of the luminal organ for each of the identified necessary frames.
- An information processing method of the present embodiment includes: acquiring medical image data representing a plurality of frames of cross-sectional images of a luminal organ; calculating a feature value of the luminal organ for each of the frames on the basis of the acquired medical image data; detecting a local maximum of variations in the feature value between the frames; and identifying a plurality of necessary frames from among the plurality of frames on the basis of the detected local maximum.
Landscapes
- Health & Medical Sciences (AREA)
- Life Sciences & Earth Sciences (AREA)
- Engineering & Computer Science (AREA)
- Physics & Mathematics (AREA)
- General Health & Medical Sciences (AREA)
- Medical Informatics (AREA)
- Nuclear Medicine, Radiotherapy & Molecular Imaging (AREA)
- Radiology & Medical Imaging (AREA)
- Veterinary Medicine (AREA)
- Animal Behavior & Ethology (AREA)
- Public Health (AREA)
- Surgery (AREA)
- Molecular Biology (AREA)
- Biophysics (AREA)
- Pathology (AREA)
- Biomedical Technology (AREA)
- Heart & Thoracic Surgery (AREA)
- Computer Vision & Pattern Recognition (AREA)
- General Physics & Mathematics (AREA)
- Theoretical Computer Science (AREA)
- Physiology (AREA)
- Vascular Medicine (AREA)
- Quality & Reliability (AREA)
- Geometry (AREA)
- Artificial Intelligence (AREA)
- Psychiatry (AREA)
- Signal Processing (AREA)
- Cardiology (AREA)
- Ultra Sonic Daignosis Equipment (AREA)
- Apparatus For Radiation Diagnosis (AREA)
Abstract
Description
- The present invention relates to a computer program, an information processing apparatus, and an information processing method.
-
Patent Literature 1 discloses an image diagnosis apparatus that generates a blood vessel cross-sectional image on the basis of a signal (ultrasound emitted to a vascular tissue and reflected wave) obtained by an imaging core accommodated in a catheter inserted into a blood vessel. - When acquiring a medical image such as an intravascular ultrasound (IVUS) image, there is a possibility that the catheter moves back and forth and left and right relative to a coronary artery due to the influence of heartbeat. For this reason, on blood vessel cross-sectional images acquired by making the pull-back operation at a constant speed, the shape and position of the blood vessel may change to prevent the three-dimensional shape of the blood vessel from being accurately reproduced. It is therefore conceivable to suppress the movement of the catheter relative to the coronary artery by simultaneously acquiring electrocardiogram information together with the medical image and extracting only frames at specific intervals on the basis of the acquired electrocardiogram information.
- Patent Literature 1:
WO 2017/164071 A - The electrocardiogram information, however, is not always obtained under percutaneous coronary intervention (PCI), so that the problem that the three-dimensional shape of the blood vessel cannot be accurately reproduced practically arises.
- The present invention has been made in view of such circumstances, and it is therefore an object of the present invention to provide a computer program, an information processing apparatus, and an information processing method capable of extracting frames at specific intervals only on the basis of medical images.
- The present application includes a plurality of means for solving the above-described problems, and examples of the means includes a computer program causing a computer to execute processing of: acquiring medical image data representing a plurality of frames of cross-sectional images of a luminal organ; calculating a feature value of the luminal organ for each of the frames on the basis of the acquired medical image data; detecting a local maximum of variations in the feature value between the frames; and identifying a plurality of necessary frames from among the plurality of frames on the basis of the detected local maximum.
- According to the present invention, it is possible to extract frames at specific intervals only on the basis of medical images.
-
-
Fig. 1 is a diagram illustrating an example of a configuration of an information processing system according to the present embodiment. -
Fig. 2 is a diagram illustrating an example of a configuration of an information processing apparatus. -
Fig. 3 is a diagram illustrating a first example of processing based on a learning model. -
Fig. 4 is a diagram illustrating a second example of the processing based on the learning model. -
Fig. 5 is a diagram illustrating an example of segmentation data output by the learning model. -
Fig. 6A is a diagram illustrating an example of a feature value. -
Fig. 6B is a diagram illustrating an example of the feature value. -
Fig. 7 is a diagram illustrating an example of variations in centroid of a blood vessel. -
Fig. 8 is a diagram illustrating an example of a method of identifying a necessary frame. -
Fig. 9 is a diagram illustrating an example of a result of extracting necessary frames. -
Fig. 10 is a diagram illustrating an example of a method of identifying a corresponding point group of a predetermined site in a case where there is no side branch. -
Fig. 11 is a diagram illustrating an example of a method of connecting corresponding point groups. -
Fig. 12 is a diagram illustrating a first example of a method of identifying a corresponding point group of a predetermined site in a case where there is a side branch. -
Fig. 13 is a diagram illustrating a second example of the method of identifying a corresponding point group of a predetermined site in a case where there is a side branch. -
Fig. 14A is a diagram illustrating an example of a simulated 3D image of a blood vessel. -
Fig. 14B is a diagram illustrating an example of a simulated 3D image of a blood vessel. -
Fig. 15A is a diagram illustrating an example of blood vessel information based on necessary frames. -
Fig. 15B is a diagram illustrating an example of the blood vessel information based on necessary frames. -
Fig. 16 is a diagram illustrating an example of a processing procedure by the information processing apparatus. - Hereinafter, an embodiment of the present invention will be described.
Fig. 1 is a diagram illustrating an example of a configuration of aninformation processing system 100 according to the present embodiment. Theinformation processing system 100 is, for example, an image diagnosis system and an apparatus for performing intravascular imaging (image diagnosis) used for cardiac catheter treatment (PCI: Percutaneous Coronary Intervention). The cardiac catheter treatment is a method of treating a narrowed portion of a coronary artery by inserting a catheter from a blood vessel such as a base of a leg, an arm, or a wrist. For intravascular imaging, there are two methods: an intravascular ultrasound (IVUS) method; and an optical coherence tomography (OFDI: Optical Frequency Domain Imaging, OCT: Optical Coherence Tomography) method. The IVUS uses reflection of ultrasound to interpret the inside of a blood vessel in a tomographic image. Specifically, a thin catheter equipped with an ultra-small sensor at its distal end is inserted into the coronary artery, and after passing to a lesion, a medical image representing the inside of a blood vessel can be generated using ultrasound transmitted from the sensor. The OFDI uses near-infrared rays to interpret a state in a blood vessel with a high-resolution image. Specifically, as in the IVUS, a catheter is inserted into a blood vessel, near-infrared rays are emitted from its distal end, a cross-section of the blood vessel is measured by interferometry, and a medical image is generated. Furthermore, the OCT is intravascular image diagnosis to which near-infrared rays and optical fiber technology are applied. A blood vessel will be described herein as an example of a luminal organ. Furthermore, the medical image (medical image data) includes one generated by the IVUS, the OFDI, or the OCT, but the case of using the IVUS method will be mainly described herein below. - The
information processing system 100 includes acatheter 10, a motor drive unit (MDU) 20, adisplay apparatus 30, aninput apparatus 40, and aninformation processing apparatus 50. Aserver 200 is connected to theinformation processing apparatus 50 via acommunication network 1. - The
catheter 10 is an image diagnosis catheter for obtaining an ultrasound tomographic image of a blood vessel by the IVUS method. Thecatheter 10 has an ultrasound probe provided at its distal end for obtaining an ultrasound tomographic image of a blood vessel. The ultrasound probe includes an ultrasound transducer that emits ultrasound in a blood vessel, and an ultrasound sensor that receives a reflected wave (ultrasound echo) reflected by a structure such as a biological tissue of the blood vessel or a medical device. The ultrasound probe is configured to be movable back and forth in a longitudinal direction of the blood vessel while rotating in a circumferential direction of the blood vessel. - The MDU 20 is a drive apparatus to which the
catheter 10 can be detachably attached, and drives a built-in motor in response to the operation made by a medical worker to control the motion of thecatheter 10 inserted into a blood vessel. TheMDU 20 can rotate the ultrasound probe of thecatheter 10 in the circumferential direction while moving the ultrasound probe from the distal end (distal) side to the proximal end (proximal) side (pull-back operation). The ultrasound probe continuously scans the inside of the blood vessel at predetermined time intervals, and outputs reflected wave data of the detected ultrasound to theinformation processing apparatus 50. - The
information processing apparatus 50 acquires medical image data representing time-series (a plurality of frames of) cross-sectional images of the blood vessel on the basis of the reflected wave data output from the ultrasound probe of thecatheter 10. Since the ultrasound probe scans the inside of the blood vessel while moving from the distal end (distal) side to the proximal end (proximal) side in the blood vessel, a plurality of medical images in chronological order is tomographic images of the blood vessel observed at a plurality of points from the distal side to the proximal side. - The
display apparatus 30 includes a liquid crystal display panel, an organic EL display panel, or the like, and can display a result of processing executed by theinformation processing apparatus 50. Furthermore, thedisplay apparatus 30 can display the medical image generated (acquired) by theinformation processing apparatus 50. - The
input apparatus 40 is an input interface such as a keyboard and a mouse that receives input of various setting values, an operation for theinformation processing apparatus 50, and the like when an examination is made. Theinput apparatus 40 may be a touch panel, a software key, a hardware key, or the like provided in thedisplay apparatus 30. - The
server 200 is, for example, a data server, and may include an image DB in which the medical image data is accumulated. -
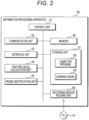
Fig. 2 is a diagram illustrating an example of a configuration of theinformation processing apparatus 50. Theinformation processing apparatus 50 includes a control unit 51 that controls the entireinformation processing apparatus 50, acommunication unit 52, aninterface unit 53, a featurevalue calculation unit 54, aframe identification unit 55, amemory 56, astorage unit 57, and a recordingmedium reading unit 60. Thestorage unit 57 stores acomputer program 58 and alearning model 59. - The feature
value calculation unit 54 and theframe identification unit 55 may be implemented by hardware, may be implemented by software (computer program 58), or may be implemented by both hardware and software. Theinformation processing apparatus 50 may include a plurality of information processing apparatuses to distribute its function over the plurality of information processing apparatuses. - The control unit 51 may include a predetermined number of central processing units (CPUs), micro-processing units (MPUs), graphics processing units (GPUs), general-purpose computing on graphics processing units (GPGPUs), or tensor processing units (TPUs). Furthermore, the control unit 51 may include a combination of digital signal processors (DSPs), field-programmable gate arrays (FPGAs), quantum processors, and the like.
- The control unit 51 can execute processing defined by the
computer program 58. That is, the processing executed by the control unit 51 corresponds to processing executed in accordance with thecomputer program 58. - The
memory 56 may include a semiconductor memory, such as a static random access memory (SRAM), a dynamic random access memory (DRAM), or a flash memory. Loading thecomputer program 58 into thememory 56 enables the control unit 51 to execute thecomputer program 58. - The
communication unit 52 includes, for example, a communication module and has a capability of communicating with theserver 200 over thecommunication network 1. Furthermore, thecommunication unit 52 may have a capability of communicating with an external device (not illustrated) connected to thecommunication network 1. Thecommunication unit 52 may acquire, from theserver 200, medical image data representing a plurality of frames of cross-sectional images of a blood vessel. - The
interface unit 53 provides an interface function between thecatheter 10, thedisplay apparatus 30, and theinput apparatus 40. The information processing apparatus 50 (control unit 51) can transmit and receive data or information to and from thecatheter 10, thedisplay apparatus 30, and theinput apparatus 40 via theinterface unit 53. Theinterface unit 53 may acquire, from thecatheter 10, medical image data representing a plurality of frames of cross-sectional images of a blood vessel. - The recording
medium reading unit 60 can include, for example, an optical disc drive, and the computer program 58 (program product) recorded on a recording medium 61 (for example, an optically readable disc storage medium such as a CD-ROM) can be read by the recordingmedium reading unit 60 and stored into thestorage unit 57. Thecomputer program 58 is loaded into thememory 56 and executed by the control unit 51. Note that thecomputer program 58 may be downloaded from an external device via thecommunication unit 52 and stored into thestorage unit 57. - The
storage unit 57 can include, for example, a hard disk, a semiconductor memory, or the like, and can store necessary information (for example, data being processed by theinformation processing apparatus 50, a processing result, and the like). - The feature
value calculation unit 54 functions as a calculation unit, and calculates a feature value of a blood vessel for each frame on the basis of the medical image data acquired via theinterface unit 53 or thecommunication unit 52. Details of the feature value will be described later. - The
frame identification unit 55 functions as a detection unit and an identification unit, detects a local maximum (peak) of variations in the feature value between frames, and identifies a plurality of necessary frames from among the plurality of frames on the basis of the detected local maximum. Details of the method of identifying a necessary frame will be described later. -
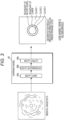
Fig. 3 is a diagram illustrating a first example of processing based on thelearning model 59. In the first example, it is assumed that the blood vessel has no side branch. Thelearning model 59 includes aninput layer 59a, anintermediate layer 59b, and anoutput layer 59c, and can be created as a U-Net, for example. Theintermediate layer 59b includes a plurality of encoders and a plurality of decoders. The plurality of encoders repeat convolution processing on the medical image data input into theinput layer 59a. The plurality of decoders repeat upsampling (deconvolution) processing on the image convolved by the encoders. When decoding the convolved image, processing of adding a feature map generated by the encoders to the image to be subjected to the deconvolution processing is executed. As a result, position information lost by the convolution processing can be retained, and more accurate segmentation (to which class each pixel belongs) can be output. - When the medical image data is input, the
learning model 59 can output segmentation data (region information on a predetermined site). The segmentation data is obtained by classifying each pixel of the medical image data into a class. Thelearning model 59 can classify pixels of each piece of the input medical image data into, for example, three classes:classes Class 1 indicates Background that is a region outside the blood vessel.Class 2 indicates (Plaque + Media), that is a region of the blood vessel containing the plaque.Class 3 indicates Lumen that is the lumen of the blood vessel. Therefore, a boundary between pixels classified intoClass 2 and pixels classified intoClass 3 indicates a boundary of the lumen, and a boundary between pixels classified intoClass 1 and pixels classified intoClass 2 indicates a boundary of the blood vessel. That is, when the medical image data is input, thelearning model 59 can output region information on a predetermined site of the blood vessel (that is, information indicating the boundary of the lumen and the boundary of the blood vessel). The predetermined site includes the boundary of the blood vessel and the boundary of the lumen. The region information is coordinate data of pixels indicating both the boundary of the lumen and the boundary of the blood vessel. Note that thelearning model 59 is not limited to the U-Net, and may be, for example, a generative adversarial network (GAN), SegNet, or the like. - A method of generating the
learning model 59 can be as follows. First, first training data including medical image data representing a cross-sectional image of a blood vessel and segmentation data indicating a class of each pixel of the medical image data is acquired. For example, the first training data may be collected and stored in theserver 200 and acquired from theserver 200. Next, thelearning model 59 may be generated on the basis of the first training data to output segmentation data when the medical image data representing the cross-sectional image of a blood vessel is input into thelearning model 59. In other words, thelearning model 59 may be generated on the basis of the first training data to output region information on each of the boundary of a lumen and the boundary of a blood vessel when the medical image data representing the cross-sectional image of the blood vessel is input into thelearning model 59. -
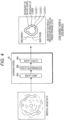
Fig. 4 is a diagram illustrating a second example of the processing based on thelearning model 59. In the second example, it is assumed that the blood vessel has a side branch. As in the first example, when the medical image data is input into thelearning model 59, thelearning model 59 outputs region information on each of the boundary of the lumen and the boundary of the blood vessel. Thelearning model 59 can output region information on the boundary of the lumen and the boundary of the blood vessel of each of the main trunk of the blood vessel and the side branch connected to the main trunk. Other configurations are similar to those of the first example, and thus the description thereof will be omitted. -
Fig. 5 is a diagram illustrating an example of segmentation data output by thelearning model 59. Medical image data (G1, G2, G3, ..., Gn) including a plurality of frames (frames 1 to n) of cross-sectional images is acquired from a plurality of time-series cross-sectional images of the blood vessel obtained as a result of one pull-back operation. The acquired medical image data is data to be input into thelearning model 59. Thelearning model 59 outputs segmentation data (S1, S2, S3, ..., Sn) corresponding toframes 1 to n on a one-to-one basis. As described with reference toFig. 3 or4 , each piece of segmentation data includes the region information on the boundary of the blood vessel and the boundary of the lumen. - In a case where medical image data representing a plurality of frames of cross-sectional images of a blood vessel is input, the control unit 51 inputs the acquired medical image data into the
learning model 59 that outputs region information on a predetermined site of a blood vessel to acquire region information on the predetermined site of the blood vessel for each frame. The control unit 51 (feature value calculation unit 54) can calculate the feature value of the blood vessel for each frame on the basis of the acquired region information. - Next, the feature value calculated by the feature
value calculation unit 54 will be described. As with electrocardiogram information and the like, the feature value may be a physical quantity on the basis of which specific heartbeat intervals synchronized with heartbeat can be identified, and may be, for example, a physical quantity that can express a relative positional relationship between the catheter and the blood vessel that changes with heartbeat. Herein, as examples of the feature value, the centroid of the blood vessel and the mean lumen diameter will be described, but the feature value is not limited to such examples. Note that the lumen varies in a manner that depends on the plaque area ratio (plaque burden), so that the blood vessel is more preferable. -
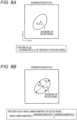
Figs. 6A and 6B are diagrams illustrating examples of the feature value. The feature value can be calculated for each piece of segmentation data S1, S2, S3, ..., and Sn corresponding to theframes 1 to n on a one-to-one basis illustrated inFig. 5 . In the example inFig. 6 , the segmentation data Sm corresponding to the frame m will be described. Here, m can be 1 to n. -
Fig. 6A illustrates a case where coordinates (x, y) of a centroid O of the blood vessel are used as the feature value. Specifically, the centroid O of the blood vessel is a centroid position of a shape defined by the boundary of the blood vessel represented by the segmentation data. The centroid O(x, y) can be calculated as follows. In xy two-dimensional coordinates, coordinates of a plurality of mass points (all masses are assumed to be 1) constituting the blood vessel are denoted as (x1, y1), (x2, y2), ..., and (xn, yn). n denotes the number of mass points. On the basis of moment equilibrium around the centroid O in the x-axis direction, an x coordinate of the centroid O can be obtained by x = (x1 + x2 + ... + xn) /n. Furthermore, on the basis of moment equilibrium around the centroid O in the y-axis direction, a y coordinate of the centroid O can be obtained by y = (y1 + y2 + ... + yn)/n. Furthermore, the centroid O(x, y) may be obtained, for example, as a center position of a circle approximate to the boundary of the blood vessel. Furthermore, the centroid O(x, y) may be obtained, for example, by setting a plurality of vertices on the boundary of the blood vessel and obtaining the centroid of a polygon including the vertices. -
Fig. 6B illustrates a case where a mean lumen diameter D of the blood vessel is used as the feature value. Specifically, the mean lumen diameter D may be calculated as follows: a maximum diameter D1 and a minimum diameter D2 of line segments passing through the centroid O of the blood vessel are obtained, and the mean of the maximum diameter D1 and the minimum diameter D2 is obtained as the mean lumen diameter D. Hereinafter, the centroid position of the blood vessel is used as the feature value, but the mean lumen diameter D may be used. - As described above, the feature
value calculation unit 54 can calculate the centroid position O(x, y) of the blood vessel for each of the plurality of frames. - The feature
value calculation unit 54 calculates variations in the feature value for each of the plurality of frames. For example, the centroid position for the frame (i - 1) is denoted as {x(i - 1), y(i - 1)}, and the centroid position for the frame i is denoted as {xi, yi}. A variation Δi in feature value for the frame i is a variation from the centroid position {x(i - 1), y(i - 1)} to the centroid position {xi, yi}, and can be expressed by a distance between the two centroid positions {x(i - 1), y(i - 1)} and {xi, yi}. -
Fig. 7 is a diagram illustrating an example of variations in the centroid of the blood vessel. In the drawing, the horizontal axis represents frames, and the vertical axis represents variations in the centroid of the blood vessel. A change in the relative positional relationship between the blood vessel and the catheter changes due to the influence of heartbeat causes a change in the shape and position of the blood vessel on the cross-sectional image of the blood vessel. Therefore, variations in the centroid of the blood vessel for each frame appear as a pulsatile flow (unstable variations) as illustrated inFig. 7 . Note that, in the drawing, there is a frame having a peak of variations in the centroid of the blood vessel larger than the other peaks, but the frame corresponds to a location where a side branch is present, and this is because the centroid position of the blood vessel largely varies in a manner that depends on whether or not the blood vessel has a side branch. - The
frame identification unit 55 detects a peak of variations in the centroid of the blood vessel and identifies a frame having the detected peak as a necessary frame. Specifically, theframe identification unit 55 can detect a local maximum (peak) of variations in the centroid of the blood vessel calculated for each frame and identify a frame corresponding to the detected local maximum as a necessary frame. Furthermore, at least one of preprocessing or post-processing for the processing of detecting a local maximum (peak) may be executed. The preprocessing includes, for example, processing of removing noise from variations in the centroid of the blood vessel by means of filter processing as pre-noise removal. Furthermore, the post-processing includes, for example, (1) processing of removing noise (for example, a smaller local maximum and the like) so as to make a detected local maximum (peak) greater than or equal to a certain value, and (2) processing of removing noise (for example, a smaller local maximum and the like) so as to make an interval between adjacent local maxima greater than or equal to a certain interval. As a result, unnecessary noise can be removed. -
Fig. 8 is a diagram illustrating an example of the method of identifying a necessary frame. In the drawing, a symbol ▼ indicates a position where the peak of variations in the centroid of the blood vessel is detected, and the corresponding frame becomes a necessary frame. As illustrated inFig. 8 , the necessary frame is identified regardless of with or without a side branch. The necessary frame is a frame having a variation in the centroid of the blood vessel greater than or equal to a predetermined threshold, and is a frame corresponding to the specific heartbeat intervals. - As described above, with the
information processing apparatus 50, even in a case where electrocardiogram information or the like cannot be obtained, frames (necessary frames) can be extracted at specific intervals only by acquiring medical image data representing a plurality of frames of cross-sectional images of the blood vessel. -
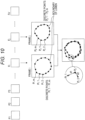
Fig. 9 is a diagram illustrating an example of a result of extracting necessary frames.Fig. 9A is a diagram in which the boundaries of the blood vessel of the segmentation data (S1, S2, S3, ..., Sn) corresponding to theframes 1 to n of the medical image data (G1, G2, G3, ..., Gn) on a one-to-one basis are arranged. InFig. 9A , the boundaries of the blood vessel in all the frames are shown, but the blood vessel boundaries vary between frames due to the influence of heartbeat, which makes the overall blood vessel boundary unclear. - In
Fig. 9B , only the necessary frames are extracted from all the frames, and the boundaries of the blood vessel of the extracted necessary frames are arranged. When the number of the necessary frames is 1 to n', the frame number n' < the frame number n holds. Note that theoriginal frame 1 and thenecessary frame 1 do not necessarily coincide with each other. Similarly, theoriginal frame 2 and thenecessary frame 2 do not necessarily coincide with each other. The same applies to the subsequent frames. Theframes 1 to n' indicate the indexes of the necessary frames, and do not indicate the indexes of the original frames. InFig. 9B , the boundaries of the blood vessel in the frames corresponding to the specific heartbeat intervals are shown, which makes the blood vessel boundary in each frame clear. - Next, a method of generating a 3D image of a blood vessel will be described.
-
Fig. 10 is a diagram illustrating an example of a method of identifying a corresponding point group of a predetermined site in a case where there is no side branch. Hereinafter, the boundary of the lumen will be described as the predetermined site, but the predetermined site also includes the boundary of the blood vessel. The necessary frames identified by theframe identification unit 55 are denoted as 1, 2, 3, ..., n'. Segmentation data of the necessary frames are denoted as F1, F2, F3, ..., Fi, ..., Fj, ..., Fn'. The number of frames is n', and n' < the total number of frames n holds. A frame of interest is denoted as j, and a corresponding frame corresponding to the frame of interest j is denoted as i. The frame of interest j and the corresponding frame i are necessary frames for identifying the corresponding point group. Note that the frame of interest j and the corresponding frame i need not be adjacent frames, and another frame may exist between the frame of interest j and the corresponding frame i. - A discrete point on the boundary of the lumen indicated by the segmentation data Fi of the frame i is represented by P (i, m), and a discrete point on the boundary of the lumen indicated by the segmentation data Fj of the frame j is represented by P (j, m). m denotes a number from 1 to m, indicating the number of discrete points. Examples of a method of identifying the discrete points include: (1) a method of sequentially identifying the discrete points at the same angle along the boundary; (2) a method of identifying the discrete points such that the distance between the discrete points is constant; and (3) a method of identifying the discrete points such that the number of the discrete points is constant. As a result, regardless of the shape of the boundary, it is possible to acquire the discrete points in a well-balanced manner while suppressing excessive torsion and the like. Furthermore, the number of discrete points on the boundary of the blood vessel may be less than or equal to the number of discrete points on the boundary of the lumen. As a result, the number of discrete points on the boundary of the blood vessel can be reduced, and the visibility of the mesh of the lumen can be improved.
- A distance between the discrete point P (j, 1) of the segmentation data Fj of the frame j and each of the m discrete points P (i, m) (m = 1 to m) of the segmentation data Fi of the frame i is calculated, and the discrete point P (i, m) having the shortest distance is identified as a corresponding point. In the example in
Fig. 10 , when a distance d1 between the discrete point P (j, 1) and the discrete point P (i, 1) and a distance d2 between the discrete point P (j, 1) and the discrete point P (i, 2) are calculated and the calculated distances d1 and d2 are compared, the distance d2 is shorter than the distance d1, and thus the discrete point P (i, 2) is selected. A similar comparison is made for other discrete points. - It is possible to identify, by executing similar processing on each discrete point P (j, m) of the segmentation data Fj of the frame j, the corresponding point group of the boundary of the lumen between the frame i and the frame j.
-
Fig. 11 is a diagram illustrating an example of a method of connecting corresponding point groups. It is assumed that a discrete point group on the boundary of the lumen indicated by the segmentation data Fi of the frame i and a discrete point group on the boundary of the lumen indicated by the segmentation data Fj of the frame j are associated with each other. The discrete points associated with each other are referred to as corresponding points, and the corresponding points on the boundary are collectively referred to as corresponding point group. The segmentation data Fi of the frame i and the segmentation data Fj of the frame j are separated at an appropriate interval from each other and arranged along the Z-axis direction. The Z axis indicates the long axis direction of the blood vessel. The corresponding points (corresponding point group) of the frames i and j are connected by a straight line in the Z-axis direction. Furthermore, corresponding points adjacent on the boundary are connected by a straight line along the boundary. As a result, it is possible to generate a 3D image in which the boundaries of the lumen indicated by the respective pieces of segmentation data of the frames i and j are connected in a mesh shape. Similarly, a 3D mesh image can be generated for the boundary of the blood vessel. It is possible to generate, by executing similar processing on all theframes 1 to n, a 3D mesh image of the blood vessel. -
Fig. 12 is a diagram illustrating a first example of the method of identifying a corresponding point group of a predetermined site in a case where there is a side branch. The presence or absence of the side branch can be determined on the basis of the segmentation data output by thelearning model 59. Note that the presence or absence of a side branch can be determined on the basis of the eccentricity of the blood vessel cross-sectional shape. For example, the eccentricity can be obtained by calculating the maximum diameter d1 and the minimum diameter d2 of the lumen diameter on the basis of the boundary of the lumen. The eccentricity can be calculated by an equation of eccentricity = (maximum diameter d1 - minimum diameter d2)/maximum diameter d1. The presence or absence of a side branch can be determined according to whether or not the eccentricity is greater than or equal to a predetermined threshold. Instead of the eccentricity, the circularity may be calculated. The circularity is the ratio of the area of the inner region of the boundary of the blood vessel to the circumferential length of the boundary of the blood vessel. It can be determined that the closer the circularity is to the ratio between the area of the circle and the length of the circumference, the higher the circularity is and the lower the possibility that a side branch is shown. Furthermore, as another determination example of the presence or absence of a side branch, a value obtained by comparing the diameter (maximum diameter and minimum diameter) of the target boundary of the blood vessel with the diameter of the boundary of the blood vessel shown in a scanned tomographic image is calculated as a parameter, and the presence or absence of a side branch can be determined according to whether or not the diameter suddenly changes by a predetermined ratio or more and by a predetermined length or more. As still another determination example, determination may be made using a learning model for determination trained to output accuracy corresponding to the possibility that a side branch is shown in a case where data of the boundary of the lumen and the boundary of the blood vessel is input. - As illustrated in
Fig. 12 , it is assumed that there is no side branch in the segmentation data F1, ..., F(i - 1), and Fi, and there is a side branch in the segmentation data Fj and F(j + 1). In this case, as the corresponding frame, a frame without a side branch and a frame with a side branch can be associated. In the example inFig. 12 , the segmentation data Fi of the frame i is associated with the segmentation data Fj of the frame j. The discrete point group of the boundary of the lumen of the segmentation Fi and the discrete point group of the boundary of the lumen of the main trunk of the segmentation Fj are associated with each other and identified as a corresponding point group, and is subjected to the same processing as the processing illustrated inFig. 10 . On the other hand, the discrete point group of the boundary of the lumen of the side branch of the segmentation Fj is left as is, and is not subjected to the connection processing. -
Fig. 13 is a diagram illustrating a second example of the method of identifying a corresponding point group of a predetermined site in a case where there is a side branch. As illustrated inFig. 13 , a distance d1 between the discrete point P (j, 1) and the discrete point P (i, 1) and a distance d2 between the discrete point P (j, 1) and the discrete point P (i, 2) are calculated. Whether or not to perform association is determined according to whether or not the calculated distances d1 and d2 are greater than or equal to a predetermined threshold. For example, since the distance d1 is smaller than the threshold, association is performed. On the other hand, since the distance d2 is longer than the threshold, no association is performed. As described above, when the corresponding points are identified, if the distance between the discrete points is greater than or equal to the threshold, the discrete points are not connected. A similar comparison is made for other discrete points. - As described above, the control unit 51 can identify the corresponding point group of the predetermined site of the blood vessel in two different frames among the necessary frames identified by the
frame identification unit 55, and generate the 3D image of the blood vessel on the basis of the identified corresponding point group. -
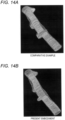
Figs. 14A and 14B are diagrams illustrating an example of a simulated 3D image of a blood vessel. The 3D image of the blood vessel illustrated inFigs. 14A and 14B is a 3D image obtained on the basis of assumption (simulation) of actual processing.Fig. 14A illustrates a case where a 3D image is simulated according to a comparative example. In the comparative example, a 3D image of a blood vessel generated using segmentation data of all frames without identifying a necessary frame is illustrated. In the comparative example, the 3D mesh image becomes quite a bit blurry due to the influence of noise caused by heartbeat. -
Fig. 14B illustrates a case where a 3D image is simulated according to the present embodiment. In the present embodiment, since segmentation data using only necessary frames is used, noise caused by heartbeat is removed. As a result, the 3D mesh image is hardly blurry, so that a clear 3D image can be obtained. -
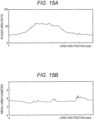
Figs. 15A and 15B are diagrams illustrating an example of blood vessel information based on necessary frames. InFig. 15A , the horizontal axis represents the long axis position of the blood vessel, and the vertical axis represents the plaque area ratio (plaque burden). The plaque area ratio illustrated inFig. 15A uses the segmentation data using only necessary frames, so that noise caused by heartbeat is removed, the plaque area ratio can be calculated with high accuracy. That is, the control unit 51 can generate information on plaque distribution (plaque burden) in the axial direction of the blood vessel on the basis of the region information on the predetermined site of the blood vessel in each identified necessary frame. It is possible to determine, by obtaining the blood vessel information as illustrated inFig. 15A , at which position in the blood vessel a stent should be placed, how long the stent should be, and the like, for example. - In
Fig. 15B , the horizontal axis represents the long axis position of the blood vessel, and the vertical axis represents the mean lumen diameter. The mean lumen diameter illustrated inFig. 15B uses the segmentation data using only necessary frames, so that noise caused by heartbeat is removed, the mean lumen diameter can be calculated with high accuracy. That is, the control unit 51 can calculate the mean lumen diameter in the axial direction of the blood vessel on the basis of the region information on the predetermined site of the blood vessel for each identified necessary frame. It is possible to determine, by obtaining the blood vessel information as illustrated inFig. 15B , a stent diameter, for example. -
Fig. 16 is a diagram illustrating an example of a processing procedure by theinformation processing apparatus 50. For convenience, the following description will be given on the assumption that the control unit 51 takes the lead in executing the processing. The control unit 51 acquires medical image data (S11), inputs the acquired medical image data into thelearning model 59 to acquire region information on a predetermined site of the blood vessel (for example, the boundary of the blood vessel and the boundary of the lumen) for each frame (S12). - The control unit 51 calculates a feature value (for example, the centroid of the blood vessel) for each frame on the basis of the acquired region information on the predetermined site (S13), and calculates variations in the feature value for each frame on the basis of a difference in the feature value between the frames (S14).
- The control unit 51 detects a local maximum (peak) of the variations calculated for each frame to identify a necessary frame (S15). As for the identification of a necessary frame, refer to
Fig. 8 , for example. The control unit 51 identifies a corresponding point group of the predetermined site in two different necessary frames among the identified necessary frames (S16), and generates a 3D mesh image of the blood vessel using the identified corresponding point group (S17). - The control unit 51 calculates a plaque area ratio and a mean lumen diameter in the long axis direction of the blood vessel on the basis of the region information on the predetermined site in the identified necessary frames (S18), and ends the processing. Note that the process of step S18 can branch off from the process of step S15 and be executed in parallel with the processes of steps S16 and S17 .
- A computer program of the present embodiment causes a computer to execute processing of: acquiring medical image data representing a plurality of frames of cross-sectional images of a luminal organ; calculating a feature value of the luminal organ for each of the frames on the basis of the acquired medical image data; detecting a local maximum of variations in the feature value between the frames; and identifying a plurality of necessary frames from among the plurality of frames on the basis of the detected local maximum.
- The computer program of the present embodiment causes the computer to further execute processing of: inputting the acquired medical image data into a learning model that outputs region information on a predetermined site of the luminal organ in response to input of the medical image data representing the plurality of frames of cross-sectional images of the luminal organ to acquire the region information on the predetermined site of the luminal organ for each of the frames; and calculating the feature value of the luminal organ for each of the frames on the basis of the acquired region information.
- In the computer program of the present embodiment, the feature value includes a centroid position or a mean lumen diameter of the luminal organ.
- The computer program of the present embodiment causes the computer to further execute processing of generating information on plaque distribution in an axial direction of the luminal organ on the basis of region information on a predetermined site of the luminal organ for each of the identified necessary frames.
- The computer program of the present embodiment causes the computer to further execute processing of calculating a mean lumen diameter in an axial direction of the luminal organ on the basis of region information on a predetermined site of the luminal organ for each of the identified necessary frames.
- The computer program of the present embodiment causes the computer to further execute processing of: identifying a corresponding point group of a predetermined site of the luminal organ in two different frames among the identified necessary frames; and generating a 3D image of the luminal organ on the basis of the identified corresponding point group.
- An information processing apparatus of the present embodiment includes: an acquisition unit that acquires medical image data representing a plurality of frames of cross-sectional images of a luminal organ; a calculation unit that calculates a feature value of the luminal organ for each of the frames on the basis of the acquired medical image data; a detection unit that detects a local maximum of variations in the feature value between the frames; and an identification unit that identifies a plurality of necessary frames from among the plurality of frames on the basis of the detected local maximum.
- An information processing method of the present embodiment includes: acquiring medical image data representing a plurality of frames of cross-sectional images of a luminal organ; calculating a feature value of the luminal organ for each of the frames on the basis of the acquired medical image data; detecting a local maximum of variations in the feature value between the frames; and identifying a plurality of necessary frames from among the plurality of frames on the basis of the detected local maximum.
-
- 1
- Communication network
- 10
- Catheter
- 20
- MDU
- 30
- Display apparatus
- 40
- Input apparatus
- 50
- Information processing apparatus
- 51
- Control unit
- 52
- Communication unit
- 53
- Interface unit
- 54
- Feature value calculation unit
- 55
- Frame identification unit
- 56
- Memory
- 57
- Storage unit
- 58
- Computer program
- 59
- Learning model
- 59a
- Input layer
- 59b
- Intermediate layer
- 59c
- Output layer
- 60
- Recording medium reading unit
- 61
- Recording medium
- 200
- Server
Claims (8)
- A computer program causing a computer to execute processing of:acquiring medical image data representing a plurality of frames of cross-sectional images of a luminal organ;calculating a feature value of the luminal organ for each of the frames on a basis of the medical image data acquired;detecting a local maximum of variations in the feature value between the frames; andidentifying a plurality of necessary frames from among the plurality of frames on a basis of the local maximum detected.
- The computer program according to claim 1, causing the computer to further execute processing of:inputting the medical image data acquired into a learning model that outputs region information on a predetermined site of the luminal organ in response to input of the medical image data representing the plurality of frames of cross-sectional images of the luminal organ to acquire the region information on the predetermined site of the luminal organ for each of the frames; andcalculating the feature value of the luminal organ for each of the frames on a basis of the region information acquired.
- The computer program according to claim 1 or 2, wherein the feature value includes
a centroid position or a mean lumen diameter of the luminal organ. - The computer program according to any one of claims 1 to 3, causing the computer to further execute processing of
generating information on plaque distribution in an axial direction of the luminal organ on a basis of region information on a predetermined site of the luminal organ for each of the necessary frames identified. - The computer program according to any one of claims 1 to 4, causing the computer to further execute processing of
calculating a mean lumen diameter in an axial direction of the luminal organ on a basis of region information on a predetermined site of the luminal organ for each of the necessary frames identified. - The computer program according to any one of claims 1 to 5, causing the computer to further execute processing of:identifying a corresponding point group of a predetermined site of the luminal organ in two different frames among the necessary frames identified; andgenerating a 3D image of the luminal organ on a basis of the corresponding point group identified.
- An information processing apparatus comprising:an acquisition unit that acquires medical image data representing a plurality of frames of cross-sectional images of a luminal organ;a calculation unit that calculates a feature value of the luminal organ for each of the frames on a basis of the medical image data acquired;a detection unit that detects a local maximum of variations in the feature value between the frames; andan identification unit that identifies a plurality of necessary frames from among the plurality of frames on a basis of the local maximum detected.
- An information processing method comprising:acquiring medical image data representing a plurality of frames of cross-sectional images of a luminal organ;calculating a feature value of the luminal organ for each of the frames on a basis of the medical image data acquired;detecting a local maximum of variations in the feature value between the frames; andidentifying a plurality of necessary frames from among the plurality of frames on a basis of the local maximum detected.
Applications Claiming Priority (2)
| Application Number | Priority Date | Filing Date | Title |
|---|---|---|---|
| JP2022054470 | 2022-03-29 | ||
| PCT/JP2023/008440 WO2023189261A1 (en) | 2022-03-29 | 2023-03-07 | Computer program, information processing device, and information processing method |
Publications (2)
| Publication Number | Publication Date |
|---|---|
| EP4487787A1 true EP4487787A1 (en) | 2025-01-08 |
| EP4487787A4 EP4487787A4 (en) | 2025-04-16 |
Family
ID=88201401
Family Applications (1)
| Application Number | Title | Priority Date | Filing Date |
|---|---|---|---|
| EP23779289.0A Pending EP4487787A4 (en) | 2022-03-29 | 2023-03-07 | COMPUTER PROGRAM, INFORMATION PROCESSING DEVICE AND INFORMATION PROCESSING METHOD |
Country Status (4)
| Country | Link |
|---|---|
| US (1) | US20250017560A1 (en) |
| EP (1) | EP4487787A4 (en) |
| JP (1) | JPWO2023189261A1 (en) |
| WO (1) | WO2023189261A1 (en) |
Families Citing this family (1)
| Publication number | Priority date | Publication date | Assignee | Title |
|---|---|---|---|---|
| US12579644B2 (en) * | 2022-08-10 | 2026-03-17 | Northwestern University | Mechanics-informed quantitative flow analysis of medical images of a tubular organ |
Family Cites Families (5)
| Publication number | Priority date | Publication date | Assignee | Title |
|---|---|---|---|---|
| JP3316268B2 (en) * | 1993-08-30 | 2002-08-19 | アロカ株式会社 | Intraluminal ultrasound diagnostic device |
| CN105530871B (en) * | 2013-09-11 | 2019-05-07 | 波士顿科学国际有限公司 | System and method for selecting and displaying images using an intravascular ultrasound imaging system |
| WO2017164071A1 (en) | 2016-03-22 | 2017-09-28 | テルモ株式会社 | Catheter and image diagnosis device |
| EP3764915B1 (en) * | 2018-03-15 | 2025-07-16 | Koninklijke Philips N.V. | Determination and visualization of anatomical landmarks for intraluminal lesion assessment and treatment planning |
| CA3288480A1 (en) * | 2019-03-17 | 2025-11-29 | Lightlab Imaging Inc | Arterial imaging and assessment systems and methods and related user interface based-workflows |
-
2023
- 2023-03-07 EP EP23779289.0A patent/EP4487787A4/en active Pending
- 2023-03-07 WO PCT/JP2023/008440 patent/WO2023189261A1/en not_active Ceased
- 2023-03-07 JP JP2024511586A patent/JPWO2023189261A1/ja active Pending
-
2024
- 2024-09-26 US US18/898,587 patent/US20250017560A1/en active Pending
Also Published As
| Publication number | Publication date |
|---|---|
| WO2023189261A1 (en) | 2023-10-05 |
| JPWO2023189261A1 (en) | 2023-10-05 |
| EP4487787A4 (en) | 2025-04-16 |
| US20250017560A1 (en) | 2025-01-16 |
Similar Documents
| Publication | Publication Date | Title |
|---|---|---|
| JP7375102B2 (en) | How an intravascular imaging system operates | |
| JP7752194B2 (en) | System and method for displaying stent strut coverage in a vessel | |
| CN108633312B (en) | A method of contrast cloud detection in x-ray images | |
| JP5944917B2 (en) | Computer readable medium for detecting and displaying body lumen bifurcation and system including the same | |
| CN114585297A (en) | AI registration and marker detection including machine learning and using its results | |
| EP3459048B1 (en) | Motion-based image segmentation systems and methods | |
| JP2016525893A (en) | Multimodal segmentation in intravascular images | |
| US20240242351A1 (en) | Medical image processing apparatus, method, and medium | |
| JP7801065B2 (en) | Computer program, information processing method, and information processing device | |
| CN112716461A (en) | Method and system for intravascular imaging and detection of guide catheter | |
| US20250017560A1 (en) | Medical imaging apparatus, method, and storage medium | |
| JP2026509571A (en) | Graphical user interface for intravascular plaque load index | |
| JP7803928B2 (en) | Program, image processing method and image processing device | |
| JP2025531162A (en) | Keyframe Identification for Intravascular Ultrasound Based on Plaque Burden | |
| WO2022209657A1 (en) | Computer program, information processing method, and information processing device | |
| US20240331285A1 (en) | Vessel physiology generation from angio-ivus co-registration | |
| EP4487786A1 (en) | Computer program, information processing device, and information processing method | |
| US11779277B2 (en) | Systems and methods for endovascular device detection and apposition measurement | |
| CN116630386A (en) | CTA scanning image processing method and system thereof | |
| JP7680325B2 (en) | COMPUTER PROGRAM, INFORMATION PROCESSING APPARATUS, AND INFORMATION PROCESSING METHOD | |
| JP7642511B2 (en) | COMPUTER PROGRAM, INFORMATION PROCESSING APPARATUS, INFORMATION PROCESSING METHOD, AND LEARNING MODEL GENERATION METHOD | |
| WO2022071208A1 (en) | Information processing device, information processing method, program, model generation method, and training data generation method | |
| JP7686523B2 (en) | COMPUTER PROGRAM, INFORMATION PROCESSING METHOD, AND INFORMATION PROCESSING APPARATUS | |
| WO2023100838A1 (en) | Computer program, information processing device, information processing method, and training model generation method | |
| WO2025070350A1 (en) | Information processing method, program, and information processing device |
Legal Events
| Date | Code | Title | Description |
|---|---|---|---|
| STAA | Information on the status of an ep patent application or granted ep patent |
Free format text: STATUS: THE INTERNATIONAL PUBLICATION HAS BEEN MADE |
|
| PUAI | Public reference made under article 153(3) epc to a published international application that has entered the european phase |
Free format text: ORIGINAL CODE: 0009012 |
|
| STAA | Information on the status of an ep patent application or granted ep patent |
Free format text: STATUS: REQUEST FOR EXAMINATION WAS MADE |
|
| 17P | Request for examination filed |
Effective date: 20240930 |
|
| AK | Designated contracting states |
Kind code of ref document: A1 Designated state(s): AL AT BE BG CH CY CZ DE DK EE ES FI FR GB GR HR HU IE IS IT LI LT LU LV MC ME MK MT NL NO PL PT RO RS SE SI SK SM TR |
|
| A4 | Supplementary search report drawn up and despatched |
Effective date: 20250318 |
|
| RIC1 | Information provided on ipc code assigned before grant |
Ipc: G06T 7/62 20170101ALI20250312BHEP Ipc: A61B 8/00 20060101ALI20250312BHEP Ipc: A61B 8/14 20060101ALI20250312BHEP Ipc: A61B 8/08 20060101ALI20250312BHEP Ipc: G06T 7/10 20170101ALI20250312BHEP Ipc: G06T 7/00 20170101ALI20250312BHEP Ipc: A61B 5/02 20060101ALI20250312BHEP Ipc: A61B 5/00 20060101ALI20250312BHEP Ipc: A61B 8/12 20060101AFI20250312BHEP |
|
| DAV | Request for validation of the european patent (deleted) | ||
| DAX | Request for extension of the european patent (deleted) | ||
| STAA | Information on the status of an ep patent application or granted ep patent |
Free format text: STATUS: EXAMINATION IS IN PROGRESS |
|
| 17Q | First examination report despatched |
Effective date: 20260119 |