EP4431626A1 - Titanium plate - Google Patents
Titanium plate Download PDFInfo
- Publication number
- EP4431626A1 EP4431626A1 EP21964101.6A EP21964101A EP4431626A1 EP 4431626 A1 EP4431626 A1 EP 4431626A1 EP 21964101 A EP21964101 A EP 21964101A EP 4431626 A1 EP4431626 A1 EP 4431626A1
- Authority
- EP
- European Patent Office
- Prior art keywords
- phase
- titanium plate
- orientation
- crystal
- grain size
- Prior art date
- Legal status (The legal status is an assumption and is not a legal conclusion. Google has not performed a legal analysis and makes no representation as to the accuracy of the status listed.)
- Pending
Links
Images


Classifications
-
- C—CHEMISTRY; METALLURGY
- C22—METALLURGY; FERROUS OR NON-FERROUS ALLOYS; TREATMENT OF ALLOYS OR NON-FERROUS METALS
- C22C—ALLOYS
- C22C14/00—Alloys based on titanium
-
- C—CHEMISTRY; METALLURGY
- C22—METALLURGY; FERROUS OR NON-FERROUS ALLOYS; TREATMENT OF ALLOYS OR NON-FERROUS METALS
- C22F—CHANGING THE PHYSICAL STRUCTURE OF NON-FERROUS METALS AND NON-FERROUS ALLOYS
- C22F1/00—Changing the physical structure of non-ferrous metals or alloys by heat treatment or by hot or cold working
- C22F1/16—Changing the physical structure of non-ferrous metals or alloys by heat treatment or by hot or cold working of other metals or alloys based thereon
- C22F1/18—High-melting or refractory metals or alloys based thereon
- C22F1/183—High-melting or refractory metals or alloys based thereon of titanium or alloys based thereon
-
- C—CHEMISTRY; METALLURGY
- C22—METALLURGY; FERROUS OR NON-FERROUS ALLOYS; TREATMENT OF ALLOYS OR NON-FERROUS METALS
- C22C—ALLOYS
- C22C2200/00—Crystalline structure
Definitions
- the present invention relates to a titanium plate.
- Titanium constituting a titanium plate is classified into pure titanium and a titanium alloy depending on its composition.
- Pure titanium has a content of an alloy component smaller than that of a titanium alloy, and has a crystal structure called a hexagonal close-packed (hcp) structure at normal temperature in a crystal structure.
- the hexagonal close-packed structure is also called hexagonal crystal or ⁇ phase.
- An hcp crystal constituting pure titanium has poor symmetry as a crystal structure. Therefore, characteristics of pure titanium greatly change depending on the orientation of the crystal orientation, that is, a texture.
- a texture mainly having a crystal orientation split-TD
- a texture mainly having a crystal orientation split-TD
- ND sheet surface normal direction
- TD sheet width direction
- the texture mainly having the split-TD orientation is excellent in bulging formability in plane strain with TD as a major principal strain. For this reason, when a pure titanium sheet is strictly formed, a deformation mode of a portion where a strain is most concentrated may be designed to be a plane strain in a sheet width direction.
- Patent Document 1 discloses a titanium plate which is pure titanium containing a predetermined component and in which a proportion of grains in which an angle formed by RD (rolling direction) and a c axis is 0 to 50° or 70 to 90° is 90.0% or more and 95% or less.
- Patent Document 1 Japanese Unexamined Patent Application, First Publication No. 2017-226858
- An object of the present invention is to provide a titanium plate having more excellent bulging formability in plane strain with TD as a major principal strain than conventional ones.
- the gist of the present invention is as follows.
- the present inventors have found that in pure titanium manufactured by a conventional manufacturing method, in addition to the above split-TD, the crystal orientation (T-texture) in which a c axis is oriented parallel to a sheet width direction (TD) also slightly exists. As a result of studies by the present inventors, it has been found that the presence of the T-texture deteriorates bulging formability in plane strain with TD as a major principal strain of a titanium plate.
- Examples of the titanium plate according to the present invention include first and second types specified in JIS H4600 (2012), corresponding Grades 1 to 2 specified in ASTM B265, and titanium (also referred to as pure titanium for industrial use) specified in 3-7025, 3 ⁇ 7035, and 3 ⁇ 7055 standardized by DIN 17850.
- a chemical composition of the titanium plate according to the present embodiment will be specifically described as follows. Note that, a unit "%" of a content of an element means mass%.
- O is an element always contained in titanium, and improves 0.2% proof stress.
- a lower limit of an O content is 0.02%, preferably 0.03%.
- the upper limit of the O content is 0.15%, preferably 0.10%, and more preferably 0.08%.
- Fe is an element always contained in titanium, and has an effect of improving 0.2% proof stress.
- a ⁇ phase is precipitated during final annealing, which adversely affects formability.
- a lower limit of an Fe content is 0.02%, preferably 0.03%.
- the upper limit of the Fe content is 0.20%, preferably 0.10%, and more preferably 0.08%.
- N may not be contained in the titanium plate. N lowers workability of the titanium plate. Therefore, a lower limit of an N content is 0%.
- the upper limit of the N content is 0.080%. However, the N content may be 0.0001% or more, 0.0003% or more, or 0.0005% or more in consideration of a cost for reducing the N content.
- the N content may be 0.0700% or less, 0.0600% or less, or 0.0500% or less.
- a lower limit of a C content is 0%.
- the upper limit of the C content is 0.1000%.
- the C content may be 0.0001% or more, 0.0003% or more, or 0.0005% or more in consideration of a cost for reducing the C content.
- the C content may be 0.0800% or less, 0.0500% or less, or 0.0300% or less.
- H may not be contained in the titanium plate. H causes embrittlement of the titanium plate. Therefore, a lower limit of an H content is 0%.
- the upper limit of the H content is 0.0130%.
- the H content may be 0.0001% or more, 0.0002% or more, or 0.0003% or more in consideration of a cost for reducing the H content.
- the H content may be 0.0100% or less, 0.0080% or less, 0.0060% or less, 0.0040% or less, or 0.0030% or less.
- a remainder of the chemical composition of the titanium plate according to the present embodiment may be Ti and impurities.
- the impurities include Cl, Na, Mg, Si, and Ca mixed in refining, and Al, Zr, Sn, Mo, Nb, Ta, and V mixed from scrap. When these impurities are contained, each of contents thereof is, for example, 0.1% or less, and if the total content is 0.5% or less, there is no problem.
- an ⁇ phase is a main crystal structure.
- the fact that an ⁇ phase is a main crystal structure means that an ⁇ phase fraction in an entire evaluation surface is 95% or more in terms of area fraction. This fraction is preferably 97% or more, and more preferably 99% or more.
- the crystal structure other than the ⁇ phase is a ⁇ phase.
- RD is a rolling direction of the titanium plate
- TD is a sheet width direction of the titanium plate
- ND is a sheet surface normal direction of the titanium plate.
- RD and TD can be specified based on, for example, an elongation direction of a roll mark formed on a surface of the titanium plate, a dimension of the titanium plate, or an elongation direction of a crystal in the titanium plate.
- the Z axis in the crystal coordinate system is a [0001] direction expressed by Miller indices.
- the X axis in the crystal coordinate system may be in a [10-10] direction (normal direction of a column surface) or in a [1-210] direction.
- the X axis is the [1-210] direction.
- the Y axis is the [10-10] direction (normal direction of a column surface).
- ⁇ 1 (0 to 90°)
- ⁇ (0 to 90°) ⁇ (0 to 90°
- ⁇ 2 0 to 60°
- the crystal orientation distribution of a polycrystal is represented by a function f( ⁇ 1 , ⁇ , ⁇ 2 ) using the above-described Euler angle ( ⁇ 1 , ⁇ , cpz), and this function is called an orientation distribution function (ODF).
- ODF orientation distribution function
- a texture which is a general texture of a titanium plate manufactured by a conventional normal method and in which an orientation in which a c axis is inclined by about 35° with respect to TD is set as a preferential orientation, will be expressed below using the Euler angle ( ⁇ 1 , ⁇ , ⁇ 2 ).
- f(g) at specific ⁇ 2 is expressed by contour lines in a space with a horizontal axis: ⁇ 1 (0 to 90°) and a vertical axis: ⁇ (0 to 90°).
- FIG. 3 is a diagram of a pure titanium plate manufactured by a conventional manufacturing method.
- These crystal orientations (T-texture) represented by (0°, 90°, 0°) and (0°, 90°, 30°) deteriorate bulging formability in plane strain with TD as a major principal strain.
- it is difficult to reduce the crystal orientations represented by (0°, 90°, 0°) and (0°, 90°, 30°) it is difficult to reduce the crystal orientations represented by (0°, 90°, 0°) and (0°, 90°, 30°), and bulging formability in plane strain with TD as a major principal strain has been insufficient in some cases.
- X1&2 is the area fraction of the ⁇ phase calculated for both X1 and X2. Then, X1 + X2 - X1 &2 is used as the presence ratio of T-texture.
- the upper limit of a total of both (X1 + X2 - X1&2) is 0.075, preferably 0.070.
- FIG. 2 shows the titanium plate according to the present embodiment
- a presence ratio (area fraction) (X1 + X2 - X1&2) of a crystal having a crystal orientation (T-texture) in which the absolute value of an orientation difference is indicated within 30° around (0°, 90°, 0°) and (0°, 90°, 30°) is 0.082 in the case of FIG. 3 of a conventional example, whereas it is reduced to 0.062 in FIG. 2 of the titanium plate according to the present embodiment.
- a presence ratio of split-TD in the titanium plate is defined as follows. That is, the area fraction of the ⁇ phase having a crystal orientation in which the absolute value of an orientation difference with respect to (0°, 35°, 0°) is within 15° is defined as X3, and the area fraction of the ⁇ phase having a crystal orientation in which the absolute value of an orientation difference with respect to (0°, 35°, 30°) is within 15° is defined as X4. Further, the area fraction of the ⁇ phase having a crystal orientation in which absolute values of orientation differences with respect to both (0°, 35°, 0°) and (0°, 35°, 30°) are within 15° is defined as X3&4. X3&4 is the area fraction of the ⁇ phase calculated for both X3 and X4. Then, X3 + X4 - X3&4 is used as the presence ratio of split-TD.
- a lower limit of (X3 + X4 - X3&4)/(X1 + X2 - X1&2) is preferably 5.0 and more preferably 5.5 in order to obtain sufficient formability.
- the area fractions X1 to X4 of crystals having the above crystal orientations can be measured as follows.
- a surface perpendicular to a sheet width direction of the titanium plate (hereinafter also referred to as an "L cross section") was polished to obtain a measurement surface, and by an electron backscatter diffraction (EBSD) method, an EBSD pattern was measured with a step size of 10 ⁇ m while scanning an electron beam in a visual field of a total sheet thickness ⁇ 15 mm of this surface with a scanning electron microscope (SEM).
- SEM scanning electron microscope
- X1 + X2 - X1&2 can be obtained as an evaluation result.
- X3 + X4 - X3&4 can also be obtained by a similar procedure.
- CI value confidence of index value
- the average grain size of the ⁇ phase is preferably 70.0 ⁇ m or less, 50.0 ⁇ m or less, 25.0 ⁇ m or less, and more preferably 20.0 ⁇ m or less.
- the average grain size of the ⁇ phase is preferably 2.0 ⁇ m or more.
- a value obtained by dividing a standard deviation of a grain size (equivalent circle diameter) of the ⁇ phase by the average value of grain sizes of the ⁇ phase is defined as a coefficient of variation of the grain size of the ⁇ phase.
- the coefficient of variation of the grain size of the ⁇ phase is preferably 0.75 or less, and more preferably 0.70 or less.
- the average grain size of the ⁇ phase is in an arbitrary cross section of the titanium plate, and can be measured by observing a surface perpendicular to a sheet width direction of the titanium plate (L cross section). A surface perpendicular to a sheet width direction of the titanium plate (L cross section) was polished to obtain a measurement surface, and by an electron backscatter diffraction (EBSD) method, an EBSD pattern was measured with a step size of 0.5 ⁇ m while scanning an electron beam in a visual field of a total sheet thickness ⁇ 1000 ⁇ m of this surface with a scanning electron microscope (SEM). For the data, the average grain size of the ⁇ phase was calculated using OIM Analysis ver 7.31 software manufactured by TSL Solutions K.K.
- a boundary having an orientation difference of 15° or more is recognized as a grain boundary, and a region surrounded by this grain boundary is defined as a grain.
- this visual field there are about 1000 or more grains.
- the average grain size the average value of equivalent circle diameters was evaluated as an arithmetical mean. The coefficient of variation was determined by dividing a standard deviation of a grain size (equivalent circle diameter) of the ⁇ phase by the average grain size. Measurement conditions of the EBSD pattern other than the measurement visual field and the step size are the same as the conditions for measuring X1 to X4 and the like.
- the present inventors have been able to realize, for the first time, a titanium plate which has both of a characteristic that the ⁇ phase is fine grains and wrinkles hardly occur and a characteristic of having excellent bulging formability in plane strain with TD as a major principal strain and which is not included in the conventional art.
- the average grain size of the ⁇ phase is 70.0 ⁇ m or less, T-texture is conventionally present, whereas the titanium plate according to the present embodiment hardly has T-texture, and an effect thereof can be sufficiently exhibited.
- the titanium plate according to the present embodiment is characterized by a texture with almost no T-texture, and is excellent in bulging formability in plane strain with TD as a major principal strain.
- the manufacturing method is not particularly limited, but for example, the texture is achieved by controlling hot rolling to cause a specific dislocation to remain, suppressing T-texture formation, increasing a cold-rolling reduction to increase a development degree of split-TD as a preferential orientation, and decreasing a development degree of T-texture by a manufacturing method whose points are shown below.
- a titanium raw material manufactured to have a predetermined purity is melted by a conventionally known method to form a predetermined ingot. Specifically, a vacuum arc remelting method (VAR method) or an electron beam melting method (EB method) can be applied.
- VAR method vacuum arc remelting method
- EB method electron beam melting method
- Working is performed into a slab shape by conventionally known blooming rolling or forging.
- the titanium slab obtained through the above blooming may be subjected to cutting, cleaning treatment, or the like by a known method as necessary. This step may be omitted as necessary.
- the titanium plate according to the present embodiment it is important to control a rolling reduction during hot rolling, a finishing temperature during hot rolling, a coiling temperature after hot rolling, and the average cooling rate from the finishing temperature to 300°C.
- Heating before hot rolling may be performed by a conventionally known method, and for example, the slab may be heated to 700 to 1000°C.
- a heating temperature is preferably equal to or lower than a ⁇ transformation point temperature.
- the " ⁇ transformation point temperature” means a boundary temperature at which the ⁇ phase starts to be generated when pure titanium or a titanium alloy is cooled from a ⁇ phase single phase region.
- the ⁇ transformation point temperature can be obtained from a phase diagram.
- the phase diagram can be obtained, for example, by a computer coupling of phase diagrams and thermochemistry (CALPHAD) method, and for that purpose, for example, Thermo-Calc, which is an integrated thermodynamic calculation system of Thermo-Calc Software AB, and a predetermined database (TI3) can be used.
- CALPHAD phase diagrams and thermochemistry
- the average rolling reduction per pass it is preferable to set the average rolling reduction per pass to 10% or more and the interpass time to 2.0 seconds or less. This makes it possible to suppress disappearance of dislocations due to recovery and to introduce a large amount of dislocations into the titanium plate. As described later, dislocations have a function of suppressing T-texture formation during cooling of the titanium plate after hot rolling. Therefore, a texture with less T-texture can be developed by performing finish rolling under these conditions.
- a lower limit of the hot rolling finishing temperature is 600°C, preferably 625°C, and more preferably 650°C.
- the hot rolling finishing temperature exceeds 750°C, recovery and recrystallization occur during working, the above dislocations disappear, a large amount of T-texture is formed during final annealing, and bulging formability in plane strain with TD as a major principal strain is deteriorated. Therefore, the upper limit temperature is 750°C, preferably 730°C, and more preferably 720°C.
- the hot rolling finishing temperature is measured by a radiation thermometer. A coiling temperature and the like described below are also values measured by a radiation thermometer.
- the cooling rate of the titanium plate decreases.
- the above coiling temperature exceeds 450°C, recovery and recrystallization occur in the coiled titanium plate, the above dislocations disappear, a large amount of T-texture is formed during final annealing, and bulging formability in plane strain with TD as a major principal strain is deteriorated. Therefore, the coiling temperature is 450°C or lower.
- a lower limit of the cooling rate is 5.0 °C/s, preferably 10.0 °C/s, and more preferably 20.0 °C/s.
- the upper limit is not particularly limited, but may be 100 °C/s from the viewpoint of equipment capacity and the like.
- annealing of hot rolled plate and cold rolling intermediate annealing When annealing of hot rolled plate and cold rolling intermediate annealing are performed, the above dislocations disappear, a large amount of T-texture is formed during final annealing, and bulging formability in plane strain with TD as a major principal strain is deteriorated. Therefore, annealing of hot rolled plate and cold rolling intermediate annealing should not be performed after hot rolling until final annealing. Note that annealing of hot rolled plate is annealing performed on a titanium plate after coiling and before start of cold rolling, and cold rolling intermediate annealing is annealing performed on a titanium plate between passes when cold rolling is performed in a plurality of passes.
- the obtained hot-rolled plate may be subjected to removal of oxide scale or the like by pickling or cutting by a known method, a cleaning treatment, or the like.
- Total cold-rolling reduction 78% or more
- the total cold-rolling reduction of cold rolling is less than 78%, a development degree of split-TD decreases, and development of T-texture increases. For this reason, the total cold-rolling reduction is 78% or more. More preferably, the total cold-rolling reduction is 81 % or more.
- the upper limit of the total cold-rolling reduction is preferably 95% from the viewpoint of edge cracks and the like.
- a sheet thickness of a titanium plate subjected to hot rolling and cold rolling under the above-described conditions is, for example, in a range of 0.3 mm to 1.0 mm.
- P in the above formula (1) is a function called a Larson-Miller parameter, T is an annealing temperature (°C), and t is an annealing time (s).
- a lower limit of the annealing temperature is 500°C, preferably 550°C.
- the upper limit of the annealing temperature is 750°C, and more preferably 700°C.
- a lower limit of P is 18500, preferably 19000.
- the average grain size of the titanium plate can be reduced.
- the average grain size is 70.0 ⁇ or less, and occurrence of wrinkles during forming can be suppressed.
- the Larson-Miller parameter P is 21500 or less, the average grain size is 25.0 ⁇ m or less, and occurrence of wrinkles during forming can be reliably prevented. Therefore, the upper limit of P is preferably set to 21500.
- the cold-rolling reduction is small, a degree of strain accumulation in each grain in a cold-rolled sheet becomes non-uniform, and distribution of the grain size after annealing may become non-uniform. Therefore, the cold-rolling reduction is preferably higher, and is preferably 80% or more.
- a titanium ingot as a material of a titanium sheet shown in Table 2 was manufactured by vacuum arc remelting (VAR). Thereafter, a slab having a thickness of 150 mm ⁇ a width of 800 mm ⁇ a length of 5000 mm was manufactured by blooming rolling or forging.
- VAR vacuum arc remelting
- a slab having a thickness of 150 mm ⁇ a width of 800 mm ⁇ a length of 5000 mm was manufactured by blooming rolling or forging.
- “Bal.” represents a remainder.
- a description of a content of impurity elements was omitted.
- a method of measuring chemical compositions of the slab was as follows.
- a content of Fe was measured by IPC emission spectrometry using a sequential ICP emission spectrometer.
- Contents of O and N were measured by a thermal conductivity/infrared light absorption method using an oxygen/nitrogen simultaneous analyzer.
- a content of C was measured by an infrared light absorption method using a carbon/sulfur analyzer.
- H was measured by a thermal conductivity method using a hydrogen analyzer.
- Chemical compositions of each of the manufactured hot-rolled plates were equal to chemical compositions of the titanium slab shown in Table 2.
- a phase diagram of a titanium alloy was obtained by a CALPHAD method using Thermo-Calc, which is an integrated thermodynamic calculation system of Thermo-Calc Software AB, and a predetermined database (TI3), and a ⁇ transformation point T ⁇ was calculated.
- hot-rolled titanium plate (hot-rolled plate) was subjected to annealing of hot rolled plate as necessary, and then shot blasting and pickling were performed.
- the average rolling reduction per pass was set to 10% or more, and an interpass time was set to 2.0 seconds or less.
- the term "hot rolling reduction” described in Tables 3 and 5 is a total rolling reduction in hot rolling.
- the "hot-rolled plate thickness” described in Tables 3 and 5 is a sheet thickness of the hot-rolled plate after completion of hot rolling.
- T ⁇ is a ⁇ transformation point
- T is an annealing temperature (°C) and t is an annealing time (s).
- a method of evaluating area fractions X1 + X2 - X1&2 and X3 + X4 - X3&4 of crystals having crystal orientations in the titanium plate was as follows. First, in order to measure the area fractions X1 + X2 - X1&2 and X3 + X4 - X3&4, a surface perpendicular to a sheet width direction of the titanium plate (hereinafter also referred to as "L cross section”) was polished to obtain a measurement surface. In this measurement surface, an observed visual field including an entire region in a sheet thickness direction and having a width of 15 mm along a sheet surface was set.
- a method of evaluating the average grain size of an ⁇ phase and a coefficient of variation was as follows. First, in order to measure the grain size of the ⁇ phase, a surface perpendicular to a sheet width direction of the titanium plate (L cross section) was polished to obtain a measurement surface. In this measurement surface, an observed visual field including an entire region in a sheet thickness direction and having a width of 1000 ⁇ m along a sheet surface was set. In this observed visual field, by an electron backscatter diffraction (EBSD) method, an EBSD pattern was measured with a step size of 0.5 ⁇ m while scanning an electron beam with a scanning electron microscope (SEM).
- EBSD electron backscatter diffraction
- Formability of the titanium plate was evaluated by plane strain stretch-expanding height in the sheet width direction. Using a die with a hole diameter of ⁇ 44 mm, a shoulder portion R of 6 mm, and a bead of ⁇ 70 mm, and a spherical head punch of ⁇ 40 mm, formability was evaluated at a wrinkle suppression force of 7 ton and a punch rising speed of 20 mm/min. A blank having a side length of 60 mm parallel to a rolling direction and a side length of 90 mm parallel to a sheet width direction was cut out from the cold-rolled sheet.
- a poly sheet NAFLON tape 9001 (0.05 t) manufactured by NICHIAS Corporation
- a highly viscous oil Pressure oil #660 manufactured by Nihon Kohsakuyu Co., Ltd.
- a displacement at a maximum load which can be read from the load-displacement curve obtained in the test, was regarded as a stretch-expanding height.
- a titanium plate having a stretch-expanding height of 24.0 mm or more was evaluated as a titanium plate having good formability, that is, a titanium plate having more excellent bulging formability in plane strain with TD as a major principal strain than conventional ones.
- Evaluation of wrinkles during forming of a titanium plate was performed based on roughness after a tensile test. From the titanium plate, a JIS 13B tensile test piece was taken so that the rolling direction was a tensile direction. The test piece was subjected to a tensile test up to a nominal strain of 20% at a strain rate of 30%/min. A surface of a parallel portion of the test piece after the tensile test was subjected to roughness measurement using a laser microscope.
- the average Ra was 0.25 ⁇ m or less, it was regarded as very good, and when the average Ra was 0.65 ⁇ m or less, it was regarded as good.
- Examples 1 to 36 in Tables 3 and 4 are Inventive Examples.
- Examples 1 to 25 in Tables 5 and 6 are Comparative Examples that do not satisfy one or more of the requirements of the present invention.
- Tables 2 to 6 numerical values outside the scope of the present invention or numerical values/items outside a preferred range of a manufacturing method are underlined.
- Comparative Examples 1 to 18, 24, and 25 in Tables 5 and 6 X1 + X2 - X1&2 was outside the scope of the invention. This is presumed to be because the manufacturing methods of Comparative Examples 1 to 18, 24, and 25 were outside the preferred range of the present invention. In Comparative Examples 1 to 18 and 25, bulging formability in plane strain with TD as a major principal strain was inferior to that of the invention. In Comparative Example 24, since cold rolling was not performed and the sheet thickness was extremely large, the stretch-expanding height was not evaluated. However, since X1 + X2 - X1&2 of Comparative Example 24 was outside the scope of the invention, it is estimated that Comparative Example 24 had inferior plane strain formability as in other Comparative Examples.
- Comparative Example 4 In the manufacture of Comparative Example 4, Comparative Example 12, Comparative Example 14, and Comparative Example 18, annealing of hot rolled plate was performed.
Landscapes
- Chemical & Material Sciences (AREA)
- Engineering & Computer Science (AREA)
- Materials Engineering (AREA)
- Mechanical Engineering (AREA)
- Metallurgy (AREA)
- Organic Chemistry (AREA)
- Physics & Mathematics (AREA)
- Thermal Sciences (AREA)
- Crystallography & Structural Chemistry (AREA)
- Metal Rolling (AREA)
- Heat Treatment Of Sheet Steel (AREA)
Abstract
Description
- The present invention relates to a titanium plate.
- Titanium constituting a titanium plate is classified into pure titanium and a titanium alloy depending on its composition. Pure titanium has a content of an alloy component smaller than that of a titanium alloy, and has a crystal structure called a hexagonal close-packed (hcp) structure at normal temperature in a crystal structure. The hexagonal close-packed structure is also called hexagonal crystal or α phase.
- An hcp crystal constituting pure titanium has poor symmetry as a crystal structure. Therefore, characteristics of pure titanium greatly change depending on the orientation of the crystal orientation, that is, a texture. When a titanium sheet is manufactured through hot rolling, (optional annealing of hot rolled plate), cold rolling, and final annealing, which are general manufacturing methods of a titanium plate, a texture mainly having a crystal orientation (split-TD) in which a c axis ([0001] axis) of hcp is inclined by about 35° from ND (sheet surface normal direction) to TD (sheet width direction) is formed. The texture mainly having the split-TD orientation is excellent in bulging formability in plane strain with TD as a major principal strain. For this reason, when a pure titanium sheet is strictly formed, a deformation mode of a portion where a strain is most concentrated may be designed to be a plane strain in a sheet width direction.
-
Patent Document 1 discloses a titanium plate which is pure titanium containing a predetermined component and in which a proportion of grains in which an angle formed by RD (rolling direction) and a c axis is 0 to 50° or 70 to 90° is 90.0% or more and 95% or less. - [Patent Document 1]
Japanese Unexamined Patent Application, First Publication No. 2017-226858 - However, in recent years, there is an increasing demand for workability of a titanium plate. Specifically, there is a demand for a titanium plate having further improved bulging formability in plane strain with TD as a major principal strain.
- An object of the present invention is to provide a titanium plate having more excellent bulging formability in plane strain with TD as a major principal strain than conventional ones.
- The gist of the present invention is as follows.
-
- (1) A titanium plate according to an aspect of the present invention includes, as a chemical composition, in mass%, O: 0.02% to 0.15%, Fe: 0.02% to 0.20%, N: 0 to 0.0800%, C: 0 to 0.1000%, and H: 0 to 0.0130%, and a remainder including Ti and impurities, in which when the crystal orientation of an α phase is represented by an Euler angle g = (ϕ1, Φ, ϕ2), the area fraction of the α phase having a crystal orientation in which the absolute value of an orientation difference with respect to (0°, 90°, 0°) is within 30° is defined as X1, the area fraction of the α phase having a crystal orientation in which the absolute value of an orientation difference with respect to (0°, 90°, 30°) is within 30° is defined as X2, and the area fraction of the α phase having a crystal orientation in which absolute values of orientation differences with respect to both (0°, 90°, 0°) and (0°, 90°, 30°) are within 30° is defined as X1&2, X1 + X2 - X1&2 is 0.075 or less.
- (2) In the titanium plate according to (1), when the area fraction of the α phase having a crystal orientation in which the absolute value of an orientation difference with respect to (0°, 35°, 0°) is within 15° is defined as X3, the area fraction of the α phase having a crystal orientation in which the absolute value of an orientation difference with respect to (0°, 35°, 30°) is within 15° is defined as X4, and the area fraction of the α phase having a crystal orientation in which absolute values of orientation differences with respect to both (0°, 35°, 0°) and (0°, 35°, 30°) are within 15° is defined as X3&4, (X3 + X4 - X3&4)/(X1 + X2 - X1&2) may be 5.0 or more.
- (3) In the titanium plate according to (1) or (2), the average grain size of the α phase may be 70.0 µm or less.
- (4) In the titanium plate according to (1) or (2), the average grain size of the α phase may be 20.0 µm or less.
- (5) In the titanium plate according to any one of (1) to (4), a coefficient of variation of a grain size of the α phase, which is a value obtained by dividing a standard deviation of the grain size of the α phase by the average grain size of the α phase, may be 0.75 or less.
- According to the present invention, it is possible to provide a titanium plate having more excellent bulging formability in plane strain with TD as a major principal strain than conventional ones.
-
-
FIG. 1A is a view showing a notation method by Euler angle in which the crystal orientation is expressed in three dimensions. -
FIG. 1B is a view showing a notation method by Euler angle in which the crystal orientation is expressed in three dimensions. -
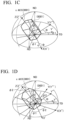
FIG. 1C is a view showing a notation method by Euler angle in which the crystal orientation is expressed in three dimensions. -
FIG. 1D is a view showing a notation method by Euler angle in which the crystal orientation is expressed in three dimensions. -
FIG. 2 is a diagram in which an orientation distribution function ODF is displayed in contour lines in a space of Euler angles for the titanium plate according to the present embodiment. -
FIG. 3 is a diagram in which an orientation distribution function ODF is displayed in contour lines in a space of Euler angles for a titanium plate of a conventional example. - The present inventors have found that in pure titanium manufactured by a conventional manufacturing method, in addition to the above split-TD, the crystal orientation (T-texture) in which a c axis is oriented parallel to a sheet width direction (TD) also slightly exists. As a result of studies by the present inventors, it has been found that the presence of the T-texture deteriorates bulging formability in plane strain with TD as a major principal strain of a titanium plate. Therefore, as a result of further studies on a method of suppressing occurrence of T-texture, the present inventors have found that the occurrence of T-texture can be suppressed and the bulging formability in plane strain with TD as a major principal strain of a titanium plate can be dramatically improved by introducing a strain when hot rolling pure titanium and coiling and cooling the titanium plate so as to maintain the strain. Hereinafter, a titanium plate according to the present embodiment will be described in detail.
- Examples of the titanium plate according to the present invention include first and second types specified in JIS H4600 (2012),
corresponding Grades 1 to 2 specified in ASTM B265, and titanium (also referred to as pure titanium for industrial use) specified in 3-7025, 3·7035, and 3·7055 standardized by DIN 17850. A chemical composition of the titanium plate according to the present embodiment will be specifically described as follows. Note that, a unit "%" of a content of an element means mass%. - O is an element always contained in titanium, and improves 0.2% proof stress. However, when an amount of O is too large, ductility decreases, and bulging formability in plane strain with TD as a major principal strain is deteriorated. In order to obtain a 0.2% proof stress improving effect by addition of O, a lower limit of an O content is 0.02%, preferably 0.03%. From the viewpoint of formability, the upper limit of the O content is 0.15%, preferably 0.10%, and more preferably 0.08%.
- Fe is an element always contained in titanium, and has an effect of improving 0.2% proof stress. However, when an amount of Fe is too large, a β phase is precipitated during final annealing, which adversely affects formability. In order to obtain the 0.2% proof stress improving effect, a lower limit of an Fe content is 0.02%, preferably 0.03%. On the other hand, from the viewpoint of formability, the upper limit of the Fe content is 0.20%, preferably 0.10%, and more preferably 0.08%.
- N may not be contained in the titanium plate. N lowers workability of the titanium plate. Therefore, a lower limit of an N content is 0%. The upper limit of the N content is 0.080%. However, the N content may be 0.0001% or more, 0.0003% or more, or 0.0005% or more in consideration of a cost for reducing the N content. The N content may be 0.0700% or less, 0.0600% or less, or 0.0500% or less.
- C may not be contained in the titanium plate. Therefore, a lower limit of a C content is 0%. The upper limit of the C content is 0.1000%. However, the C content may be 0.0001% or more, 0.0003% or more, or 0.0005% or more in consideration of a cost for reducing the C content. The C content may be 0.0800% or less, 0.0500% or less, or 0.0300% or less.
- H may not be contained in the titanium plate. H causes embrittlement of the titanium plate. Therefore, a lower limit of an H content is 0%. The upper limit of the H content is 0.0130%. However, the H content may be 0.0001% or more, 0.0002% or more, or 0.0003% or more in consideration of a cost for reducing the H content. The H content may be 0.0100% or less, 0.0080% or less, 0.0060% or less, 0.0040% or less, or 0.0030% or less.
- A remainder of the chemical composition of the titanium plate according to the present embodiment may be Ti and impurities. Specific examples of the impurities include Cl, Na, Mg, Si, and Ca mixed in refining, and Al, Zr, Sn, Mo, Nb, Ta, and V mixed from scrap. When these impurities are contained, each of contents thereof is, for example, 0.1% or less, and if the total content is 0.5% or less, there is no problem.
- Since the titanium plate according to the present embodiment has the above-described composition, it is industrially referred to as pure titanium. In pure titanium, due to the composition, an α phase (hcp) is a main crystal structure. The fact that an α phase is a main crystal structure means that an α phase fraction in an entire evaluation surface is 95% or more in terms of area fraction. This fraction is preferably 97% or more, and more preferably 99% or more. The crystal structure other than the α phase is a β phase.
- In the titanium plate according to the present embodiment, in order to express a crystal orientation in a texture in three dimensions, a notation method by Euler angle is used. Hereinafter, the notation method by Euler angle (Bunge notation method) will be described.
- As a premise for expressing the crystal orientation by Euler angle, first, three coordinate axes of RD, TD, and ND orthogonal to each other are assumed as a sample coordinate system (coordinate system of a plate material). RD is a rolling direction of the titanium plate, TD is a sheet width direction of the titanium plate, and ND is a sheet surface normal direction of the titanium plate. RD and TD can be specified based on, for example, an elongation direction of a roll mark formed on a surface of the titanium plate, a dimension of the titanium plate, or an elongation direction of a crystal in the titanium plate.
- Next, three coordinate axes of an X axis, a Y axis, and a Z axis orthogonal to each other are assumed as a crystal coordinate system (in the case of a titanium α phase, a coordinate system based on a direction of an hcp microstructure). The Z axis in the crystal coordinate system is a [0001] direction expressed by Miller indices. The X axis in the crystal coordinate system may be in a [10-10] direction (normal direction of a column surface) or in a [1-210] direction. In the titanium plate according to the present embodiment, the X axis is the [1-210] direction. In this case, the Y axis is the [10-10] direction (normal direction of a column surface).
- (A) In the notation method by Euler angle, as shown in
FIG. 1A , a state in which the sample coordinate system and the crystal coordinate system coincide with each other (the X axis matches RD, the Y axis matches TD, and the Z axis matches ND) is used as a reference. - (B) It is assumed that this reference crystal is rotated by ϕ1° about the Z axis in the crystal coordinate system as shown in
FIG. 1B . The crystal coordinate system of the rotated crystal is denoted as (X', Y', Z) inFIG. 1B . - (C) Next, as shown in
FIG. 1C , it is assumed that this crystal is rotated by Φ° about the X (X') axis after rotation by ϕ1°. The axes of the crystal coordinate system of the rotated crystal are denoted as (X', Y", Z') inFIG. 1C . - (D) Finally, as shown in
FIG. 1D , it is assumed that this crystal is rotated by ϕ2° about the Z (Z') axis after rotation by ϕ1° and rotation by Φ°. The axes of the crystal coordinate system of the rotated crystal are denoted as (X", Y‴, Z') inFIG. 1D . - In the notation method by Euler angle, the crystal orientation (such as a direction of a c axis) of an arbitrary grain is expressed using these three angles of ϕ1°, Φ°, and ϕ2°. That is, the crystal orientation of a crystal shown in
FIG. 1A is denoted by Euler angle as (0, 0, 0), the crystal orientation of a crystal shown inFIG. 1B is denoted by Euler angle as (ϕ1, 0, 0), the crystal orientation of a crystal shown inFIG. 1C is denoted by Euler angle as (ϕ1, Φ, 0), and the crystal orientation of a crystal shown inFIG. 1D is denoted by Euler angle as (ϕ1, Φ, ϕ2). Since a crystal structure of the α phase, which is a microstructure of a main phase of the titanium plate, is a hexagonal crystal, it can be denoted by ϕ1 (0 to 90°), Φ (0 to 90°), and ϕ2 (0 to 60°). - In Miller indices described in
FIGS. 1A to 1D , an overlined value is a negative value. On the other hand, in the specification, a minus sign is used instead of the overline in order to denote a negative value in the Miller indices. Therefore, notation of some crystal orientations in the drawings is rewritten as follows in the specification.[Table 1] Drawing Specification X axis (RD) [1 2 10][1-210] Y axis (TD) [10 1 0][10-10] - The crystal orientation distribution of a polycrystal is represented by a function f(ϕ1, Φ, ϕ2) using the above-described Euler angle (ϕ1, Φ, cpz), and this function is called an orientation distribution function (ODF). When the crystal orientation (ϕ1, Φ, ϕ2) is g, ODF can be expressed as f(g). The higher a value of f(g), the more crystals oriented in the crystal orientation g.
- A texture (split-TD), which is a general texture of a titanium plate manufactured by a conventional normal method and in which an orientation in which a c axis is inclined by about 35° with respect to TD is set as a preferential orientation, will be expressed below using the Euler angle (ϕ1, Φ, ϕ2). In order to denote a three-dimensional orientation distribution function on a two-dimensional paper surface, f(g) at specific ϕ2 is expressed by contour lines in a space with a horizontal axis: ϕ1 (0 to 90°) and a vertical axis: Φ (0 to 90°). In titanium, typical orientations are represented by ϕ2 = 0° and 30° (
FIGS. 2 and 3 ). As is clear fromFIGS. 2 and 3 , it is clear that a peak having a high value of f(g) exists in the vicinity of Φ = 35° and ϕ1 = 0° at any ϕ2. Each of these crystal orientations indicates an orientation in which a c axis of an hcp structure is inclined by 35° from ND to TD, and when ϕ2 = 0°, [1-210] is oriented to RD, and when ϕ2 = 30°, [0-110] is oriented to RD. In these orientations, since crystal orientations represented by (0°, 35°, 0°) and (0°, 35°, 30°), which are main orientations, are extremely excellent in bulging formability in plane strain with TD as a major principal strain, press working utilizing this characteristic is performed. -
FIG. 3 is a diagram of a pure titanium plate manufactured by a conventional manufacturing method. InFIG. 3 , when ϕ1 = 0° and Φ is 35 to 90°, an orientation of a crystal orientation is confirmed. Among them, Φ = 90° indicates a crystal orientation in which a c axis of hcp is parallel to TD. These crystal orientations (T-texture) represented by (0°, 90°, 0°) and (0°, 90°, 30°) deteriorate bulging formability in plane strain with TD as a major principal strain. In a normal manufacturing method, it is difficult to reduce the crystal orientations represented by (0°, 90°, 0°) and (0°, 90°, 30°), and bulging formability in plane strain with TD as a major principal strain has been insufficient in some cases. - In the titanium plate according to the present embodiment, a presence ratio of T-texture in the titanium plate is defined as follows. That is, when the crystal orientation of the α phase is represented by an Euler angle g = (ϕ1, Φ, ϕ2), the area fraction of the α phase having a crystal orientation in which the absolute value of an orientation difference with respect to (0°, 90°, 0°) is within 30° is defined as X1, and the area fraction of the α phase having a crystal orientation in which the absolute value of an orientation difference with respect to (0°, 90°, 30°) is within 30° is defined as X2. Further, the area fraction of the α phase having a crystal orientation in which absolute values of orientation differences with respect to both (0°, 90°, 0°) and (0°, 90°, 30°) are within 30° is defined as X1&2. X1&2 is the area fraction of the α phase calculated for both X1 and X2. Then, X1 + X2 - X1 &2 is used as the presence ratio of T-texture.
- The crystal orientations (T-texture) represented by (0°, 90°, 0°) and (0°, 90°, 30°) deteriorate bulging formability in plane strain with TD as a major principal strain. Therefore, area fractions of crystals having these crystal orientations are preferably small. In order to obtain sufficient formability, in the titanium plate according to the present embodiment, the upper limit of a total of both (X1 + X2 - X1&2) is 0.075, preferably 0.070.
-
FIG. 2 shows the titanium plate according to the present embodiment andFIG. 3 shows a conventional titanium plate in which f(g) at ϕ2 = 0° and 30° is expressed by contour lines in a space with a horizontal axis: ϕ1 (0 to 90°) and a vertical axis: Φ (0 to 90°). A presence ratio (area fraction) (X1 + X2 - X1&2) of a crystal having a crystal orientation (T-texture) in which the absolute value of an orientation difference is indicated within 30° around (0°, 90°, 0°) and (0°, 90°, 30°) is 0.082 in the case ofFIG. 3 of a conventional example, whereas it is reduced to 0.062 inFIG. 2 of the titanium plate according to the present embodiment. - A presence ratio of split-TD in the titanium plate is defined as follows. That is, the area fraction of the α phase having a crystal orientation in which the absolute value of an orientation difference with respect to (0°, 35°, 0°) is within 15° is defined as X3, and the area fraction of the α phase having a crystal orientation in which the absolute value of an orientation difference with respect to (0°, 35°, 30°) is within 15° is defined as X4. Further, the area fraction of the α phase having a crystal orientation in which absolute values of orientation differences with respect to both (0°, 35°, 0°) and (0°, 35°, 30°) are within 15° is defined as X3&4. X3&4 is the area fraction of the α phase calculated for both X3 and X4. Then, X3 + X4 - X3&4 is used as the presence ratio of split-TD.
- Since the crystal orientations (split-TD) represented by (0°, 35°, 0°) and (0°, 35°, 30°) are extremely excellent in bulging formability in plane strain with TD as a major principal strain, area fractions of crystals having these crystal orientations are preferably large. Therefore, it is preferable that (X3 + X4 - X3&4)/(X1 + X2 - X1&2) is large in consideration of the area fraction (X1 + X2 - X1&2) of (0°, 90°, 0°) and (0°, 90°, 30°) described above. In the titanium plate according to the present embodiment, a lower limit of (X3 + X4 - X3&4)/(X1 + X2 - X1&2) is preferably 5.0 and more preferably 5.5 in order to obtain sufficient formability.
- The area fractions X1 to X4 of crystals having the above crystal orientations can be measured as follows. A surface perpendicular to a sheet width direction of the titanium plate (hereinafter also referred to as an "L cross section") was polished to obtain a measurement surface, and by an electron backscatter diffraction (EBSD) method, an EBSD pattern was measured with a step size of 10 µm while scanning an electron beam in a visual field of a total sheet thickness × 15 mm of this surface with a scanning electron microscope (SEM). For the data, each area fraction was calculated using OIM Analysis ver 7.31 software manufactured by TSL Solutions K.K. For example, by designating a close-packed hexagonal crystal as a crystal structure and designating "simultaneous evaluation of the area fraction of a crystal having a crystal orientation in which the absolute value of an orientation difference is within 30° around (0°, 90°, 0°) and the area fraction of a crystal having a crystal orientation in which the absolute value of an orientation difference is within 30° around (0°, 90°, 30°)", X1 + X2 - X1&2 can be obtained as an evaluation result. X3 + X4 - X3&4 can also be obtained by a similar procedure. For analysis, only analysis data having a confidence of index value (CI value) of 0.1 or more was used. In consideration of symmetry of rolling deformation, crystal orientations that are line-symmetric with respect to each of a sheet thickness direction, a rolling direction, and a sheet width direction were calculated as the same orientation. Measurement conditions were as follows.
- Heating voltage: 15 kV
- Amount of current: about 35 nA
- Magnification: 200 times
- When the average grain size of the α phase is too large, wrinkles may occur during press forming. In addition, as the average grain size of the α phase is smaller, strength increases. Therefore, the average grain size of the α phase is preferably 70.0 µm or less, 50.0 µm or less, 25.0 µm or less, and more preferably 20.0 µm or less. On the other hand, when the average grain size of the α phase is less than 2 µm, non-recrystallized grains remain, which may adversely affect formability. Therefore, the average grain size of the α phase is preferably 2.0 µm or more.
- A value obtained by dividing a standard deviation of a grain size (equivalent circle diameter) of the α phase by the average value of grain sizes of the α phase is defined as a coefficient of variation of the grain size of the α phase. When the coefficient of variation of the grain size of the α phase is too large, distribution of the grain size becomes non-uniform, and deformation concentrates on specific grains, so that formability may be deteriorated. Therefore, the coefficient of variation of the grain size of the α phase is preferably 0.75 or less, and more preferably 0.70 or less.
- The average grain size of the α phase is in an arbitrary cross section of the titanium plate, and can be measured by observing a surface perpendicular to a sheet width direction of the titanium plate (L cross section). A surface perpendicular to a sheet width direction of the titanium plate (L cross section) was polished to obtain a measurement surface, and by an electron backscatter diffraction (EBSD) method, an EBSD pattern was measured with a step size of 0.5 µm while scanning an electron beam in a visual field of a total sheet thickness × 1000 µm of this surface with a scanning electron microscope (SEM). For the data, the average grain size of the α phase was calculated using OIM Analysis ver 7.31 software manufactured by TSL Solutions K.K. A boundary having an orientation difference of 15° or more is recognized as a grain boundary, and a region surrounded by this grain boundary is defined as a grain. In this visual field, there are about 1000 or more grains. For the average grain size, the average value of equivalent circle diameters was evaluated as an arithmetical mean. The coefficient of variation was determined by dividing a standard deviation of a grain size (equivalent circle diameter) of the α phase by the average grain size. Measurement conditions of the EBSD pattern other than the measurement visual field and the step size are the same as the conditions for measuring X1 to X4 and the like.
- When the grain size of the α phase is relatively coarse, grains having split-TD preferentially grow in a grain growth process after completion of recrystallization, and a development degree of grains having T-texture tends to decrease. However, when the grain size of the α phase is coarse, wrinkles occur during forming working as described above. On the other hand, a conventional manufacturing method had a problem that when the grain size of the α phase becomes small, T-texture increases. In contrast, in the titanium plate according to the present embodiment, T-texture hardly exists even if the grain size of the α phase is relatively small. For this reason, the present inventors have been able to realize, for the first time, a titanium plate which has both of a characteristic that the α phase is fine grains and wrinkles hardly occur and a characteristic of having excellent bulging formability in plane strain with TD as a major principal strain and which is not included in the conventional art. When the average grain size of the α phase is 70.0 µm or less, T-texture is conventionally present, whereas the titanium plate according to the present embodiment hardly has T-texture, and an effect thereof can be sufficiently exhibited.
- The titanium plate according to the present embodiment is characterized by a texture with almost no T-texture, and is excellent in bulging formability in plane strain with TD as a major principal strain. The manufacturing method is not particularly limited, but for example, the texture is achieved by controlling hot rolling to cause a specific dislocation to remain, suppressing T-texture formation, increasing a cold-rolling reduction to increase a development degree of split-TD as a preferential orientation, and decreasing a development degree of T-texture by a manufacturing method whose points are shown below.
- As described above, by controlling a hot rolling finishing temperature and a subsequent cooling rate of pure titanium and performing cold rolling at a large rolling reduction, a texture in which T-texture, which is considered to be a main cause of anisotropy, is hardly present even in the case of fine grains after final annealing is developed, and a titanium sheet in which wrinkles do not occur during forming and having excellent bulging formability in plane strain with TD as a major principal strain can be manufactured.
- Hereinafter, an example of the manufacturing method of the titanium plate according to the present embodiment will be described. As a step flow, melting, blooming, hot rolling, cold rolling, and final annealing are sequentially performed.
- A titanium raw material manufactured to have a predetermined purity is melted by a conventionally known method to form a predetermined ingot. Specifically, a vacuum arc remelting method (VAR method) or an electron beam melting method (EB method) can be applied.
- Working is performed into a slab shape by conventionally known blooming rolling or forging. The titanium slab obtained through the above blooming may be subjected to cutting, cleaning treatment, or the like by a known method as necessary. This step may be omitted as necessary.
- In the titanium plate according to the present embodiment, it is important to control a rolling reduction during hot rolling, a finishing temperature during hot rolling, a coiling temperature after hot rolling, and the average cooling rate from the finishing temperature to 300°C.
- Heating before hot rolling may be performed by a conventionally known method, and for example, the slab may be heated to 700 to 1000°C. However, from the viewpoint of accurately adjusting the hot rolling finishing temperature, a heating temperature is preferably equal to or lower than a β transformation point temperature. The "β transformation point temperature" means a boundary temperature at which the α phase starts to be generated when pure titanium or a titanium alloy is cooled from a β phase single phase region. The β transformation point temperature can be obtained from a phase diagram. The phase diagram can be obtained, for example, by a computer coupling of phase diagrams and thermochemistry (CALPHAD) method, and for that purpose, for example, Thermo-Calc, which is an integrated thermodynamic calculation system of Thermo-Calc Software AB, and a predetermined database (TI3) can be used.
- In finish rolling of hot rolling, it is preferable to set the average rolling reduction per pass to 10% or more and the interpass time to 2.0 seconds or less. This makes it possible to suppress disappearance of dislocations due to recovery and to introduce a large amount of dislocations into the titanium plate. As described later, dislocations have a function of suppressing T-texture formation during cooling of the titanium plate after hot rolling. Therefore, a texture with less T-texture can be developed by performing finish rolling under these conditions.
- In titanium, there are as many as five types of slip systems as plastic deformation mechanisms, and types of active mechanisms vary depending on the temperature. It was found that when dislocations generated by activity of a slip system active at 600°C or higher remain, formation of T-texture can be suppressed during final annealing after cold rolling. The hot rolling finishing temperature is controlled such that the dislocations remain.
- When the hot rolling finishing temperature is lower than 600°C, a density of dislocations that suppress T-texture formation is low, a large amount of T-texture is formed during final annealing, and bulging formability in plane strain with TD as a major principal strain is deteriorated. Therefore, a lower limit of the hot rolling finishing temperature is 600°C, preferably 625°C, and more preferably 650°C. On the other hand, when the hot rolling finishing temperature exceeds 750°C, recovery and recrystallization occur during working, the above dislocations disappear, a large amount of T-texture is formed during final annealing, and bulging formability in plane strain with TD as a major principal strain is deteriorated. Therefore, the upper limit temperature is 750°C, preferably 730°C, and more preferably 720°C. The hot rolling finishing temperature is measured by a radiation thermometer. A coiling temperature and the like described below are also values measured by a radiation thermometer.
- By increasing a cooling rate after hot rolling, recovery and recrystallization during cooling are suppressed, the above dislocations are caused to remain, and formation of T-texture during final annealing is suppressed.
- When the titanium plate after hot rolling is coiled, the cooling rate of the titanium plate decreases. When the above coiling temperature exceeds 450°C, recovery and recrystallization occur in the coiled titanium plate, the above dislocations disappear, a large amount of T-texture is formed during final annealing, and bulging formability in plane strain with TD as a major principal strain is deteriorated. Therefore, the coiling temperature is 450°C or lower.
- In addition, when the above cooling rate is lower than 5 °C/s, recovery and recrystallization occur during cooling, the above dislocations disappear, a large amount of T-texture is formed during final annealing, and bulging formability in plane strain with TD as a major principal strain is deteriorated. Therefore, a lower limit of the cooling rate is 5.0 °C/s, preferably 10.0 °C/s, and more preferably 20.0 °C/s. The upper limit is not particularly limited, but may be 100 °C/s from the viewpoint of equipment capacity and the like.
- When annealing of hot rolled plate and cold rolling intermediate annealing are performed, the above dislocations disappear, a large amount of T-texture is formed during final annealing, and bulging formability in plane strain with TD as a major principal strain is deteriorated. Therefore, annealing of hot rolled plate and cold rolling intermediate annealing should not be performed after hot rolling until final annealing. Note that annealing of hot rolled plate is annealing performed on a titanium plate after coiling and before start of cold rolling, and cold rolling intermediate annealing is annealing performed on a titanium plate between passes when cold rolling is performed in a plurality of passes.
- The obtained hot-rolled plate may be subjected to removal of oxide scale or the like by pickling or cutting by a known method, a cleaning treatment, or the like.
- When the total cold-rolling reduction of cold rolling is less than 78%, a development degree of split-TD decreases, and development of T-texture increases. For this reason, the total cold-rolling reduction is 78% or more. More preferably, the total cold-rolling reduction is 81 % or more. The upper limit of the total cold-rolling reduction is preferably 95% from the viewpoint of edge cracks and the like. A sheet thickness of a titanium plate subjected to hot rolling and cold rolling under the above-described conditions is, for example, in a range of 0.3 mm to 1.0 mm.
- "Final annealing" annealing temperature is 500°C or higher and 750°C or lower and a combination of temperature and time that satisfies formula (1)

- P in the above formula (1) is a function called a Larson-Miller parameter, T is an annealing temperature (°C), and t is an annealing time (s).
- When the annealing temperature is lower than 500°C, recrystallization is not completed, and there is a possibility that bulging formability in plane strain with TD as a major principal strain is deteriorated. Therefore, a lower limit of the annealing temperature is 500°C, preferably 550°C. On the other hand, when the annealing temperature is higher than 750°C, the grain size greatly changes with a slight time change, the grain size becomes too coarse, and wrinkles may occur during forming. Therefore, the upper limit of the annealing temperature is 750°C, and more preferably 700°C. In addition, when the Larson-Miller parameter P is less than 18500, recrystallization is not completed, and there is a possibility that bulging formability in plane strain with TD as a major principal strain is deteriorated. Therefore, a lower limit of P is 18500, preferably 19000.
- On the other hand, as a value of the Larson-Miller parameter P decreases, the average grain size of the titanium plate can be reduced. When the Larson-Miller parameter P is 23000 or less, the average grain size is 70.0 µ or less, and occurrence of wrinkles during forming can be suppressed. When the Larson-Miller parameter P is 21500 or less, the average grain size is 25.0 µm or less, and occurrence of wrinkles during forming can be reliably prevented. Therefore, the upper limit of P is preferably set to 21500.
- When the cold-rolling reduction is small, a degree of strain accumulation in each grain in a cold-rolled sheet becomes non-uniform, and distribution of the grain size after annealing may become non-uniform. Therefore, the cold-rolling reduction is preferably higher, and is preferably 80% or more.
- First, a titanium ingot as a material of a titanium sheet shown in Table 2 was manufactured by vacuum arc remelting (VAR). Thereafter, a slab having a thickness of 150 mm × a width of 800 mm × a length of 5000 mm was manufactured by blooming rolling or forging. In Table 2, "Bal." represents a remainder. In Table 2, a description of a content of impurity elements was omitted.
- A method of measuring chemical compositions of the slab was as follows. A content of Fe was measured by IPC emission spectrometry using a sequential ICP emission spectrometer. Contents of O and N were measured by a thermal conductivity/infrared light absorption method using an oxygen/nitrogen simultaneous analyzer. A content of C was measured by an infrared light absorption method using a carbon/sulfur analyzer. H was measured by a thermal conductivity method using a hydrogen analyzer. Chemical compositions of each of the manufactured hot-rolled plates were equal to chemical compositions of the titanium slab shown in Table 2. For titanium materials A to K shown in Table 2, a phase diagram of a titanium alloy was obtained by a CALPHAD method using Thermo-Calc, which is an integrated thermodynamic calculation system of Thermo-Calc Software AB, and a predetermined database (TI3), and a β transformation point Tβ was calculated.
- Subsequently, these slabs were hot rolled under conditions shown in Table 3 or Table 5. The hot-rolled titanium plate (hot-rolled plate) was subjected to annealing of hot rolled plate as necessary, and then shot blasting and pickling were performed. In manufacture of all of Inventive Examples and Comparative Examples, in finish rolling of hot rolling, the average rolling reduction per pass was set to 10% or more, and an interpass time was set to 2.0 seconds or less. The term "hot rolling reduction" described in Tables 3 and 5 is a total rolling reduction in hot rolling. The "hot-rolled plate thickness" described in Tables 3 and 5 is a sheet thickness of the hot-rolled plate after completion of hot rolling.
- Subsequently, the obtained hot-rolled plate was subjected to cold rolling and annealing under conditions shown in Table 4 or Table 6 to manufacture a cold-rolled sheet having a thickness of 0.8 mm. In the tables, "Tβ" is a β transformation point, and "Larson-Miller parameter" is a value of P = (T + 273.15) × (Log10(t) + 20). T is an annealing temperature (°C) and t is an annealing time (s).
- A method of evaluating area fractions X1 + X2 - X1&2 and X3 + X4 - X3&4 of crystals having crystal orientations in the titanium plate was as follows. First, in order to measure the area fractions X1 + X2 - X1&2 and X3 + X4 - X3&4, a surface perpendicular to a sheet width direction of the titanium plate (hereinafter also referred to as "L cross section") was polished to obtain a measurement surface. In this measurement surface, an observed visual field including an entire region in a sheet thickness direction and having a width of 15 mm along a sheet surface was set. In this observed visual field, by an electron backscatter diffraction (EBSD) method, an EBSD pattern was measured with a step size of 10 µm while scanning an electron beam with a scanning electron microscope (SEM). For the data, each area fraction was calculated using OIM Analysis ver 7.31 software manufactured by TSL Solutions K.K. At this time, for analysis, only analysis data having a confidence of index value (CI value) of 0.1 or more was used. In consideration of symmetry of rolling deformation, crystal orientations that are line-symmetric with respect to each of a sheet thickness direction, a rolling direction, and a sheet width direction were calculated as the same orientation. Measurement conditions of the EBSD pattern were as follows.
- Heating voltage: 15 kV
- Amount of current: about 35 nA
- Magnification: 200 times
- A method of evaluating the average grain size of an α phase and a coefficient of variation was as follows. First, in order to measure the grain size of the α phase, a surface perpendicular to a sheet width direction of the titanium plate (L cross section) was polished to obtain a measurement surface. In this measurement surface, an observed visual field including an entire region in a sheet thickness direction and having a width of 1000 µm along a sheet surface was set. In this observed visual field, by an electron backscatter diffraction (EBSD) method, an EBSD pattern was measured with a step size of 0.5 µm while scanning an electron beam with a scanning electron microscope (SEM). For the data, using OIM Analysis ver 7.31 software manufactured by TSL Solutions K.K., a boundary having an orientation difference of 15° or more was recognized as a grain boundary, a region surrounded by this grain boundary was defined as a grain, and the grain size of the α phase was calculated as an equivalent circle diameter. The average grain size was an arithmetical mean of equivalent circle diameters. The coefficient of variation was determined by dividing a standard deviation of the grain size (equivalent circle diameter) of the α phase by the average grain size.
- Formability of the titanium plate was evaluated by plane strain stretch-expanding height in the sheet width direction. Using a die with a hole diameter of ϕ 44 mm, a shoulder portion R of 6 mm, and a bead of ϕ 70 mm, and a spherical head punch of ϕ 40 mm, formability was evaluated at a wrinkle suppression force of 7 ton and a punch rising speed of 20 mm/min. A blank having a side length of 60 mm parallel to a rolling direction and a side length of 90 mm parallel to a sheet width direction was cut out from the cold-rolled sheet. For lubrication, a poly sheet (NAFLON tape 9001 (0.05 t) manufactured by NICHIAS Corporation) and a highly viscous oil (Press oil #660 manufactured by Nihon Kohsakuyu Co., Ltd.) were used. A displacement at a maximum load, which can be read from the load-displacement curve obtained in the test, was regarded as a stretch-expanding height. A titanium plate having a stretch-expanding height of 24.0 mm or more was evaluated as a titanium plate having good formability, that is, a titanium plate having more excellent bulging formability in plane strain with TD as a major principal strain than conventional ones.
- Evaluation of wrinkles during forming of a titanium plate was performed based on roughness after a tensile test. From the titanium plate, a JIS 13B tensile test piece was taken so that the rolling direction was a tensile direction. The test piece was subjected to a tensile test up to a nominal strain of 20% at a strain rate of 30%/min. A surface of a parallel portion of the test piece after the tensile test was subjected to roughness measurement using a laser microscope. Using a laser microscope manufactured by KEYENCE CORPORATION, a visual field of 213 µm × 284 µm was measured at a magnification of 500 times for 3 visual fields in a measurement mode: surface shape, measurement area: surface, measurement quality: high definition, Z measurement pitch of 0.01 µm. For the data, using VK Analyzer software ver. 2.5.0.1, after surface inclination correction (automatic) of the sample, the average value of arithmetical average roughness Ra in the rolling direction in each visual field was calculated in accordance with JIS B0601:2001 under a condition that 11 lines were drawn in parallel to the rolling direction so as to divide the sheet width direction into 12 equal parts at cut-off values λc = 0.8 mm and λs = 2.5 µm, and evaluation was performed by the average value of 3 visual fields. When the average Ra was 0.25 µm or less, it was regarded as very good, and when the average Ra was 0.65 µm or less, it was regarded as good. However, an example in which an evaluation result of the stretch-expanding height was good even when wrinkles were more than 0.65 µm was regarded as a titanium plate having more excellent bulging formability in plane strain with TD as a major principal strain than conventional ones. For surface roughness, the same result can be obtained as long as measurement is performed at a parallel portion of the test piece. In this test, measurement was performed at a center portion of a parallel portion.
[Table 2] Material Component content (mass%) Tβ Fe O N C H Ti °C A 0.03 0.04 0.0012 0.0050 0.0005 Bal. 885 B 0.06 0.08 0.0021 0.0062 0.0003 Bal. 889 C 0.18 0.12 0.0025 0.0044 0.0007 Bal. 891 D 0.12 0.18 0.0015 0.0058 0.0007 Bal. 900 E 0.22 0.12 0.0027 0.0060 0.0008 Bal. 890 F 0.18 0.12 0.0992 0.0054 0.0006 Bal. 903 G 0.17 0.12 0.0026 0.1181 0.0006 Bal. 948 H 0.18 0.11 0.0028 0.0063 0.0151 Bal. 888 I 0.06 0.08 0.0755 0.0052 0.0006 Bal. 953 J 0.07 0.09 0.0011 0.0917 0.0008 Bal. 930 K 0.06 0.08 0.0027 0.0068 0.0101 Bal. 889 


- Examples 1 to 36 in Tables 3 and 4 are Inventive Examples. Examples 1 to 25 in Tables 5 and 6 are Comparative Examples that do not satisfy one or more of the requirements of the present invention. In Tables 2 to 6, numerical values outside the scope of the present invention or numerical values/items outside a preferred range of a manufacturing method are underlined.
- In Inventive Examples 1 to 36, the chemical compositions and X1 + X2 - X1&2 were within the scope of the invention. These Inventive Examples were evaluated to be titanium plates having more excellent bulging formability in plane strain with TD as a major principal strain than conventional ones.
- In Comparative Examples 1 to 18, 24, and 25 in Tables 5 and 6, X1 + X2 - X1&2 was outside the scope of the invention. This is presumed to be because the manufacturing methods of Comparative Examples 1 to 18, 24, and 25 were outside the preferred range of the present invention. In Comparative Examples 1 to 18 and 25, bulging formability in plane strain with TD as a major principal strain was inferior to that of the invention. In Comparative Example 24, since cold rolling was not performed and the sheet thickness was extremely large, the stretch-expanding height was not evaluated. However, since X1 + X2 - X1&2 of Comparative Example 24 was outside the scope of the invention, it is estimated that Comparative Example 24 had inferior plane strain formability as in other Comparative Examples.
- Specifically, in the manufacture of Comparative Example 1, Comparative Example 9, and Comparative Example 14, the hot rolling finishing temperature was excessive.
- In the manufacture of Comparative Example 2, Comparative Example 10, and Comparative Example 15, the hot rolling finishing temperature was insufficient.
- In the manufacture of Comparative Example 3, Comparative Example 11, and Comparative Example 16, the average cooling rate from hot rolling finishing temperature to 300°C was insufficient.
- In the manufacture of Comparative Example 4, Comparative Example 12, Comparative Example 14, and Comparative Example 18, annealing of hot rolled plate was performed.
- In the manufacture of Comparative Example 5, Comparative Example 13, and Comparative Example 17, the final cold-rolling reduction was insufficient.
- In the manufacture of Comparative Example 6, intermediate annealing was performed.
- In the manufacture of Comparative Example 7, the annealing temperature in final annealing was insufficient.
- In the manufacture of Comparative Example 8, the Larson-Miller parameter P was insufficient.
- In the manufacture of Comparative Example 24, cold rolling was omitted.
- In the manufacture of Comparative Example 25, the coiling temperature was excessive.
- In Comparative Examples 19 to 23 in Tables 5 and 6, the chemical compositions were outside the scope of the invention. Comparative Examples 19 to 23 also failed in one or both of the wrinkle evaluation result and the stretch-expanding height.
Claims (5)
- A titanium plate comprising, as a chemical composition, in mass%,O: 0.02% to 0.15%,Fe: 0.02% to 0.20%,N: 0 to 0.0800%,C: 0 to 0.1000%, andH: 0 to 0.0130%,and a remainder including Ti and impurities,wherein when a crystal orientation of an α phase is represented by an Euler angle g = (ϕ1, Φ, ϕ2), an area fraction of the α phase having a crystal orientation in which an absolute value of an orientation difference with respect to (0°, 90°, 0°) is within 30° is defined as X1, an area fraction of the α phase having a crystal orientation in which an absolute value of an orientation difference with respect to (0°, 90°, 30°) is within 30° is defined as X2, and an area fraction of the α phase having a crystal orientation in which absolute values of orientation differences with respect to both (0°, 90°, 0°) and (0°, 90°, 30°) are within 30° is defined as X1 &2,X1 + X2 - X1&2 is 0.075 or less.
- The titanium plate according to claim 1,wherein when an area fraction of the α phase having a crystal orientation in which an absolute value of an orientation difference with respect to (0°, 35°, 0°) is within 15° is defined as X3,an area fraction of the α phase having a crystal orientation in which an absolute value of an orientation difference with respect to (0°, 35°, 30°) is within 15° is defined as X4, andan area fraction of the α phase having a crystal orientation in which absolute values of orientation differences with respect to both (0°, 35°, 0°) and (0°, 35°, 30°) are within 15° is defined as X3&4,(X3 + X4 - X3&4)/(X1 + X2 - X1&2) is 5.0 or more.
- The titanium plate according to claim 1 or 2, wherein an average grain size of the α phase is 70.0 µm or less.
- The titanium plate according to claim 1 or 2, wherein an average grain size of the α phase is 20.0 µm or less.
- The titanium plate according to any one of claims 1 to 4, wherein a coefficient of variation of a grain size of the α phase, which is a value obtained by dividing a standard deviation of the grain size of the α phase by an average grain size of the α phase, is 0.75 or less.
Applications Claiming Priority (1)
| Application Number | Priority Date | Filing Date | Title |
|---|---|---|---|
| PCT/JP2021/041769 WO2023084746A1 (en) | 2021-11-12 | 2021-11-12 | Titanium plate |
Publications (2)
| Publication Number | Publication Date |
|---|---|
| EP4431626A1 true EP4431626A1 (en) | 2024-09-18 |
| EP4431626A4 EP4431626A4 (en) | 2025-06-04 |
Family
ID=86335427
Family Applications (1)
| Application Number | Title | Priority Date | Filing Date |
|---|---|---|---|
| EP21964101.6A Pending EP4431626A4 (en) | 2021-11-12 | 2021-11-12 | TITANIUM PLATE |
Country Status (5)
| Country | Link |
|---|---|
| EP (1) | EP4431626A4 (en) |
| JP (1) | JP7799208B2 (en) |
| KR (1) | KR20240070623A (en) |
| CN (1) | CN118202075A (en) |
| WO (1) | WO2023084746A1 (en) |
Family Cites Families (6)
| Publication number | Priority date | Publication date | Assignee | Title |
|---|---|---|---|---|
| JP4088183B2 (en) * | 2003-01-31 | 2008-05-21 | 株式会社神戸製鋼所 | Titanium plate excellent in formability and method for producing the same |
| JP5668712B2 (en) * | 2012-03-05 | 2015-02-12 | 新日鐵住金株式会社 | A hard pure titanium plate excellent in impact resistance and a method for producing the same. |
| CN107406917A (en) * | 2015-03-23 | 2017-11-28 | 株式会社神户制钢所 | Titanium plate, heat exchanger are with plate and fuel cell distance piece |
| WO2017175569A1 (en) * | 2016-04-05 | 2017-10-12 | 株式会社神戸製鋼所 | Titanium plate, heat exchanger plate, and fuel cell separator |
| JP6623950B2 (en) | 2016-06-20 | 2019-12-25 | 日本製鉄株式会社 | Titanium plate excellent in balance between proof stress and ductility and method for producing the same |
| KR102608727B1 (en) * | 2019-04-17 | 2023-12-04 | 닛폰세이테츠 가부시키가이샤 | Drums for manufacturing titanium plates, titanium rolled coils and copper foil |
-
2021
- 2021-11-12 KR KR1020247013647A patent/KR20240070623A/en active Pending
- 2021-11-12 WO PCT/JP2021/041769 patent/WO2023084746A1/en not_active Ceased
- 2021-11-12 JP JP2023559353A patent/JP7799208B2/en active Active
- 2021-11-12 CN CN202180103812.7A patent/CN118202075A/en active Pending
- 2021-11-12 EP EP21964101.6A patent/EP4431626A4/en active Pending
Also Published As
| Publication number | Publication date |
|---|---|
| JPWO2023084746A1 (en) | 2023-05-19 |
| JP7799208B2 (en) | 2026-01-15 |
| WO2023084746A1 (en) | 2023-05-19 |
| KR20240070623A (en) | 2024-05-21 |
| EP4431626A4 (en) | 2025-06-04 |
| CN118202075A (en) | 2024-06-14 |
Similar Documents
| Publication | Publication Date | Title |
|---|---|---|
| EP1514949B1 (en) | FERRITIC STAINLESS STEEL PLATE WITH Ti AND METHOD FOR PRODUCTION THEREOF | |
| EP2481824B1 (en) | Pure titanium sheet excellent in balance between stamping formability and strenght | |
| EP3276017A1 (en) | Titanium plate, plate for heat exchanger, and separator for fuel cell | |
| EP3822376A1 (en) | ?+? type titanium alloy wire and method for producing ?+? type titanium alloy wire | |
| EP2453031B1 (en) | Magnesium alloy plate | |
| US20200123639A1 (en) | Aluminum alloy foil, and method for producing aluminum alloy foil | |
| US12031198B2 (en) | Aluminum alloy foil | |
| EP3460088A1 (en) | Steel sheet | |
| EP3623487B1 (en) | Titanium sheet | |
| KR102801567B1 (en) | Titanium plate | |
| EP3778968B1 (en) | Metal sheet, method for manufacturing metal sheet, method of producing molded product of metal sheet, and molded product of metal sheet | |
| EP2716778A1 (en) | Pure titanium sheet having excellent balance between press formability and strength and excellent corrosion resistance, and process for manufacturing same | |
| TWI796118B (en) | Titanium alloy plate and titanium alloy coil and manufacturing method of titanium alloy plate and titanium alloy coil | |
| EP4431626A1 (en) | Titanium plate | |
| JP7736893B2 (en) | Aluminum alloy foil and its manufacturing method | |
| JP2017190480A (en) | Titanium sheet | |
| EP4286550A1 (en) | Titanium alloy thin plate, and method for producing titanium alloy thin plate | |
| EP4459000A1 (en) | a+ß TYPE TITANIUM ALLOY SHAPED MATERIAL AND MANUFACTURING METHOD THEREOF | |
| US20250243562A1 (en) | Titanium alloy sheet and method for producing same | |
| CN119768547A (en) | Titanium alloy plate and glasses | |
| JP2023162898A (en) | β type titanium alloy |
Legal Events
| Date | Code | Title | Description |
|---|---|---|---|
| STAA | Information on the status of an ep patent application or granted ep patent |
Free format text: STATUS: THE INTERNATIONAL PUBLICATION HAS BEEN MADE |
|
| PUAI | Public reference made under article 153(3) epc to a published international application that has entered the european phase |
Free format text: ORIGINAL CODE: 0009012 |
|
| STAA | Information on the status of an ep patent application or granted ep patent |
Free format text: STATUS: REQUEST FOR EXAMINATION WAS MADE |
|
| 17P | Request for examination filed |
Effective date: 20240410 |
|
| AK | Designated contracting states |
Kind code of ref document: A1 Designated state(s): AL AT BE BG CH CY CZ DE DK EE ES FI FR GB GR HR HU IE IS IT LI LT LU LV MC MK MT NL NO PL PT RO RS SE SI SK SM TR |
|
| DAV | Request for validation of the european patent (deleted) | ||
| DAX | Request for extension of the european patent (deleted) | ||
| A4 | Supplementary search report drawn up and despatched |
Effective date: 20250502 |
|
| RIC1 | Information provided on ipc code assigned before grant |
Ipc: C22F 1/18 20060101ALI20250425BHEP Ipc: C22F 1/00 20060101ALI20250425BHEP Ipc: C22C 14/00 20060101AFI20250425BHEP |