EP4391421A1 - Determination of signal characteristics - Google Patents
Determination of signal characteristics Download PDFInfo
- Publication number
- EP4391421A1 EP4391421A1 EP23219162.7A EP23219162A EP4391421A1 EP 4391421 A1 EP4391421 A1 EP 4391421A1 EP 23219162 A EP23219162 A EP 23219162A EP 4391421 A1 EP4391421 A1 EP 4391421A1
- Authority
- EP
- European Patent Office
- Prior art keywords
- signal
- samples
- noise ratio
- machine learning
- extracted feature
- Prior art date
- Legal status (The legal status is an assumption and is not a legal conclusion. Google has not performed a legal analysis and makes no representation as to the accuracy of the status listed.)
- Pending
Links
Images






Classifications
-
- H—ELECTRICITY
- H04—ELECTRIC COMMUNICATION TECHNIQUE
- H04B—TRANSMISSION
- H04B17/00—Monitoring; Testing
- H04B17/30—Monitoring; Testing of propagation channels
- H04B17/309—Measuring or estimating channel quality parameters
- H04B17/336—Signal-to-interference ratio [SIR] or carrier-to-interference ratio [CIR]
-
- G—PHYSICS
- G06—COMPUTING OR CALCULATING; COUNTING
- G06N—COMPUTING ARRANGEMENTS BASED ON SPECIFIC COMPUTATIONAL MODELS
- G06N20/00—Machine learning
-
- G—PHYSICS
- G06—COMPUTING OR CALCULATING; COUNTING
- G06N—COMPUTING ARRANGEMENTS BASED ON SPECIFIC COMPUTATIONAL MODELS
- G06N3/00—Computing arrangements based on biological models
- G06N3/02—Neural networks
- G06N3/04—Architecture, e.g. interconnection topology
- G06N3/048—Activation functions
-
- G—PHYSICS
- G06—COMPUTING OR CALCULATING; COUNTING
- G06N—COMPUTING ARRANGEMENTS BASED ON SPECIFIC COMPUTATIONAL MODELS
- G06N3/00—Computing arrangements based on biological models
- G06N3/02—Neural networks
- G06N3/08—Learning methods
- G06N3/084—Backpropagation, e.g. using gradient descent
-
- G—PHYSICS
- G06—COMPUTING OR CALCULATING; COUNTING
- G06N—COMPUTING ARRANGEMENTS BASED ON SPECIFIC COMPUTATIONAL MODELS
- G06N3/00—Computing arrangements based on biological models
- G06N3/02—Neural networks
- G06N3/08—Learning methods
- G06N3/09—Supervised learning
-
- H—ELECTRICITY
- H04—ELECTRIC COMMUNICATION TECHNIQUE
- H04B—TRANSMISSION
- H04B10/00—Transmission systems employing electromagnetic waves other than radio-waves, e.g. infrared, visible or ultraviolet light, or employing corpuscular radiation, e.g. quantum communication
- H04B10/07—Arrangements for monitoring or testing transmission systems; Arrangements for fault measurement of transmission systems
- H04B10/075—Arrangements for monitoring or testing transmission systems; Arrangements for fault measurement of transmission systems using an in-service signal
- H04B10/079—Arrangements for monitoring or testing transmission systems; Arrangements for fault measurement of transmission systems using an in-service signal using measurements of the data signal
- H04B10/0795—Performance monitoring; Measurement of transmission parameters
-
- H—ELECTRICITY
- H04—ELECTRIC COMMUNICATION TECHNIQUE
- H04B—TRANSMISSION
- H04B17/00—Monitoring; Testing
- H04B17/30—Monitoring; Testing of propagation channels
- H04B17/309—Measuring or estimating channel quality parameters
-
- H—ELECTRICITY
- H04—ELECTRIC COMMUNICATION TECHNIQUE
- H04B—TRANSMISSION
- H04B17/00—Monitoring; Testing
- H04B17/30—Monitoring; Testing of propagation channels
- H04B17/309—Measuring or estimating channel quality parameters
- H04B17/346—Noise values
-
- H—ELECTRICITY
- H04—ELECTRIC COMMUNICATION TECHNIQUE
- H04B—TRANSMISSION
- H04B17/00—Monitoring; Testing
- H04B17/30—Monitoring; Testing of propagation channels
- H04B17/391—Modelling the propagation channel
- H04B17/3913—Predictive models, e.g. based on neural network models
-
- H—ELECTRICITY
- H04—ELECTRIC COMMUNICATION TECHNIQUE
- H04L—TRANSMISSION OF DIGITAL INFORMATION, e.g. TELEGRAPHIC COMMUNICATION
- H04L25/00—Baseband systems
- H04L25/02—Details ; arrangements for supplying electrical power along data transmission lines
- H04L25/0202—Channel estimation
- H04L25/024—Channel estimation channel estimation algorithms
- H04L25/0254—Channel estimation channel estimation algorithms using neural network algorithms
Definitions
- the present disclosure concerns methods of determining signal characteristics. More particularly, but not exclusively, this disclosure concerns measures, including methods, apparatus and computer programs, for use in determining signal characteristics.
- SNR signal-to-noise ratio
- Known methods for estimating SNR characteristics include blind methods and data-aided methods.
- Blind methods refer to estimating the SNR from a received signal when no extra (assisting) data is sent.
- An example of extra (assisting) data would be a pilot data sequence which is transmitted from the transmitter and known at the receiver.
- Known blind methods include the second moment, fourth moment (M2M4) estimator and the signal to variance ratio (SVR) estimator.
- M2M4 second moment, fourth moment estimator
- SVR signal to variance ratio
- a known data-aided method is the error vector magnitude (EVM).
- M2M4 and SVR have the disadvantages of relatively low accuracy and accuracy fluctuation over the range of SNRs they might be used for.
- Data-aided methods have the disadvantage of requiring the transmission of extra (assisting) data which results in greater power consumption at the transmitter and reduced overall channel capacity for actual data transmission.
- SNR Signal to Noise Ratio
- a method of determining an estimate of a signal-to-noise ratio characteristic of a signal comprising, at a processor:
- the method may further comprise adjusting the relative weightings of at least two of the extracted feature values.
- the extracted feature values may be normalised.
- the step of normalising may comprise rescaling each extracted feature value based on a predetermined mean and/or standard deviation of the respective feature.
- the mean of the feature values may be equal to zero and the standard deviation of the feature values may be equal to one.
- a loop for continuous or periodic updating of the mean and standard deviation may be provided, to account for non-stationary signal statistics.
- the signal-to-noise ratio characteristic may be the ratio of the signal power to the noise power, expressed either on a decibel scale or a linear scale.
- the signal-to-noise ratio characteristic may be the signal-to-noise ratio per bit, E b /N 0 .
- the machine learning agent may comprise an artificial neural network, ANN.
- the ANN may have multiple output neurons which are combined. In this manner, the accuracy of the estimation may be improved.
- the two or more features may comprise the maximum received signal amplitude and/or the minimum received signal amplitude.
- the methods may further comprise performing an initial training process of the machine learning agent, wherein the initial training process is continued until a pre-determined accuracy is achieved.
- the method may further comprise periodically updating the training of the machine learning agent when in use. Updating the training of the machine learning agent may be performed on the basis of the received signal samples.
- the method comprises extracting, from the samples, values of 10 or more features (or 15 or more features) indicative of the signal-to-noise ratio characteristic and providing all of the extracted feature values as inputs to a machine learning agent. Any feature that varies as a function of the signal-to-noise ratio characteristic may be used.
- the two or more feature values are extracted directly from the received signal samples.
- the signal is a time-domain signal and the step of extracting, from the samples, values of two or more features indicative of the signal-to-noise ratio characteristic is performed in the time domain.
- a computer program comprising a set of instructions, which, when executed by computerised apparatus, cause the computerised apparatus to perform a method of determining an estimate of a signal-to-noise ratio characteristic of a signal, the method comprising:
- apparatus for determining an estimate of a signal-to-noise ratio characteristic of a signal, the apparatus comprising a processor configured to:
- Figure 1 is a flow diagram corresponding to a method 100 of determining an estimate of a signal-to-noise ratio (SNR) characteristic of a signal according to embodiments of the disclosure.
- the method comprises receiving samples of the signal at a processor 220.
- values of two or more different features indicative of the signal-to-noise ratio characteristic are extracted from the samples. Examples of such features for estimating an SNR characteristic of a signal are given below.
- optional step 104 the extracted feature values are rescaled, as expanded upon below.
- the two or more extracted feature values are provided as inputs to a machine learning agent.
- the extracted feature values are processed by the machine learning agent to provide the estimate of the signal-to-noise ratio characteristic.
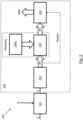
- FIG. 2 is a block diagram 200 representing a communications system implementation of the method of Figure 1 according to embodiments of the present disclosure.
- SNR single-to-noise ratio
- the noisy channel is represented by block 201 in Figure 2 .
- the SNR characteristic may be the ratio of the signal power to the noise power, S/N, expressed either on a decibel scale or on a linear scale. Alternatively, or additionally, the SNR characteristic may be theEnergy per bit to Noise density ratio, E b /N o .
- Region 220 represents a processor which processes the noisy, received signal z according to the methods disclosed herein.
- values of two or more different features ⁇ F ⁇ indicative of the SNR characteristic to be estimated are extracted from the received signal samples, z.
- Features indicative of the SNR characteristic should be understood to mean features derived from the signal samples that in some way vary in accordance with the SNR characteristic and that are therefore sensitive to different values of the SNR characteristic. Many such features are envisaged as being applicable to methods according to the present disclosure.
- the two or more features comprise the maximum received signal amplitude and/or the minimum received signal amplitude.
- the two or more features comprise the Kurtosis value, which is given by the fourth moment, M 4 , normalized by the second moment squared, M 2 2 .
- the extracted features are not limited to a particular sub-set of the received signal features.
- the M2M4 estimator is limited to the first, second and fourth moment features
- the SVR estimator is limited to the first, fourth and pre-post fourth moment.
- a machine learning agent such as an artificial neural network (ANN), for example.
- the machine learning agent is represented by block 205.
- the machine learning agent processes the extracted feature values ⁇ F ⁇ to provide an estimate of the SNR characteristic. Specific, example implementation details are expanded upon below.
- the rescaling involves adjusting the relative weightings of at least two of the extracted feature values.
- the rescaling involves multiplying the maximum received signal amplitude by a factor of 1.5 and leaving the minimum received signal amplitude unchanged, thereby weighting the maximum received signal amplitude 50% more than the minimum received signal amplitude.
- the rescaling involves normalising at least two of the extracted features. Normalisation may mean, for example, that after normalisation, the mean of each of the feature values is equal to zero and the standard deviation of each of the feature values is equal to one.
- Normalisation may mean, for example, that after normalisation, the mean of each of the feature values is equal to zero and the standard deviation of each of the feature values is equal to one.
- the rescaling process may involve subtracting, from each value of the maximum received signal amplitude (corresponding to a value obtained from a given set of received signal samples, e.g.
- the extracted features have similar weightings which may improve the ability of the machine learning agent to process the different features equally. For example, there may be some features that have absolute values which are very large and others that are very small. In order to ensure smaller values are not "swamped" by larger values, the input features are normalized to their means and standard deviations. To do this, a pre-run may be carried out using, for example, the statistics calculator described in currently unpublished United Kingdom patent application nos. GB2213111.4 and GB2213110.6 by the same applicant. Alternatively, other methods of calculating the normalisation factors may be used, such as classical formulae for the standard deviation and mean, for example.
- the rescaling factors may be stored in a memory, represented by block 204a. The rescaling factors may be updated from time to time, either in an offline process or by updating them in real-time.
- the rescaled feature values ⁇ F' ⁇ are then passed to block 205, where the estimate of the SNR characteristic is determined by the machine learning agent, in the manner described above.
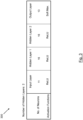
- Figure 3 illustrates properties of a machine learning agent 300 according to an embodiment.
- an ANN is used as the machine learning agent.
- the input layer has 11 inputs, the output layer has 13 outputs and two hidden layers are employed, each having 16 nodes.
- "ReLU” denotes "RectiLinear Unit”
- Soft Max represents a function that turns a vector of K real values into a vector of K real values that sum to 1. This is used to normalise the output vector, as is described in more detail below.
- Such a mini batch input is shown in Figure 4 . The batch size represents the number of feature vectors given to the ANN for each forward and backward processing/training iteration.
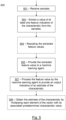
- FIG. 5 is a flow diagram corresponding to a method 500 of determining an estimate of a characteristic of a set of samples according to embodiments of the disclosure.
- the method comprises receiving the samples at a processor.
- step 503 a value of at least one feature indicative of the characteristic is extracted from the samples.
- step 504 the extracted feature values are rescaled.
- step 505 the at least one extracted feature value is provided as an input to a machine learning agent (e.g. an ANN).
- a machine learning agent e.g. an ANN
- the machine learning agent processes the at least one extracted feature value to provide an output indicative of the estimate of the characteristic.
- the output of the machine learning agent is a vector comprising elements corresponding to the probabilities associated with different predetermined characteristic values.
- the estimate of the characteristic is obtained by multiplying each element of the vector with its associated predetermined characteristic value.
- the method 500 described with reference to Figure 5 is applicable to any general set of samples and any characteristic that it is desired to estimate from the samples.
- the samples could be samples of a medical image and the characteristic could be bone density.
- specific embodiments of this method are described herein with reference to the communications system of Figure 2 , in which the samples correspond to samples of a (received) signal and the characteristic is a signal-to-noise ratio characteristic (expressed either in dBs, on a linear scale, or E b /N 0 , for example).
- the method 500 enables the machine learning agent to output any real value in a specified range (i.e. the output is not restricted to integer values). This is illustrated below with two specific examples.
- an nth output target probability vector, ⁇ p(n) ⁇ is generated by first generating an nth random target SNR value (used to train the system), SNR n .
- SNR n the number of integer SNR values that SNR n lies between.
- SNRs can be expressed in dBs or in linear numbers (note: when linear numbers are used a further step is generally employed in terms of generating a SNR/probability look-up table - this is explained later).
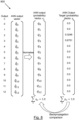
- the output probability vector will have 13 elements, each being representative of the probability of occurrence of the corresponding, integer, SNR value (in dB). Denoting the probability vector by ⁇ p(n) ⁇ , where p(0) can be read as the probability that a SNR value of 0dB occurs, p(1) can be read as the probability that a SNR value of 1dB occurs, p(2) can be read as the probability that a SNR value of 2dB occurs, then, having found the two integer values the randomly generated SNR n value lies between, two probability relationships should hold.
- the method further comprises obtaining the estimate of the characteristic, i.e. SNR n , by multiplying each element of the probability vector with its associated predetermined characteristic value, as represented by the equation above.
- the signal characteristic being estimated is the SNR expressed on a linear scale, as opposed to being expressed in dBs.
- SNR value since it is now linear
- element index value in the vector as seen in Figure 7 .
- the corresponding linear range can be seen to be 1.0 to 15.84893192.
- the target vectors (derived in the manner described above) are used as the first step during the back propagation of the ANN.
- the target vectors are compared to the ANN output - which is first normalized because the ANN output vectors should also be probabilistic in nature, that is, the sum of all the elements when expressed in probability form must equal 1.0.
- the first stage of training back propagation, construction and comparison of ANN output probability vectors, ⁇ vp ⁇ and ANN output target (probability) vectors, ⁇ v t ⁇ is indicated in Figure 8 .
- an initial training process of the machine learning agent is performed prior to the step of providing the two or more extracted feature values as inputs to the machine learning agent.
- the initial training process is continued until a pre-determined accuracy is attained.
- the machine learning agent may undergo additional training in use. In a communications system, this additional training/learning may be based on actual received signal samples, for example.
- FIG. 9 is a flow diagram 900 that represents an example of the processing to train an ANN to be able to estimate the SNR of a received signal in a communications system.
- the start of the process 901 involves reading in the communication system parameters, reading in the ANN parameters, setting up required random number generators, assigning dynamic memory storage and initializing ANN weights and biases.
- a pre-processing loop 902 is then executed, in order to derive the normalization parameters (with reference to blocks 204a and 204 in Figure 2 ) for the features which will be derived from the noisy, received, signal. In this example, these normalization parameters are then frozen - they could however be updated on a continuous basis and used on a dynamic basis.
- the process enters the ANN training loop at 903.
- the first part/module in the loop is to generate, in step 904:
- ANN normalized input features - using the normalization parameters found in the earlier pre-processing stage.
- the ANN input features are formatted into a matrix (a mini batch), each column of which is a vector of features (11 features in this example).
- the mini batch is then subject, in step 908, to ANN forward propagation to generate the ANN outputs. These outputs are then processed as detailed above, i.e. to normalise them. After this processing, there will exist a set of ANN-derived SNR output probability vectors, which are then turned into the ANN output E b /N 0 or SNR estimates. These estimates are then compared, in step 909, with the target values to see how many of the processed ANN output estimates are within a specified distance (e.g. 0.1dB) from the target value. The number with the required accuracy is compared to the last highest number (obtained from a previous pass through the loop).
- a specified distance e.g. 0.1dB
- ANN weights and biases are written to an output (text file) in step 910, i.e. stored, and the last highest number is replaced with the current number (the current number might also be stored in the text file to enable processing to carry on from the last best result should the number of iterations through the training loop prove to be insufficient for appropriate convergence).
- ANN back propagation is then carried out, using, for example, the Statistical Gradient Descent (SGD), Batch Gradient Descent (BGD) or Mini Batch Gradient Descent (MBGD), as in this example,method together with ADAptive Moments (ADAM) optimisation.
- SGD Statistical Gradient Descent
- BGD Batch Gradient Descent
- MBGD Mini Batch Gradient Descent
- the process loops back and continues. If the number of training epochs/iterations has been equalled the process will stop. Should the accuracy and training results prove to be acceptable, the weights and biases can then be frozen, the training loop can be removed and the (trained) ANN can be used as a plug-in module to a communications system for estimating an SNR characteristic of a signal.
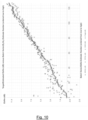
- Figure 10 is a snapshot of 128 random SNR estimations (in dBs) where the method has over 79% of its batch estimations within 0.1dB of the actual value.
- Figure 11 is a snapshot of 128 random SNR estimations (linear) where the method has over 75% of its instantaneous batch estimations within 0.1 (linear) of the actual value. It shall be noted that methods according to the present disclosure outperform the two classical methods known as the SVR and M2M4 methods.
- the present disclosure also provides a method of determining an estimate of a characteristic of a signal.
- the method comprises, at a processor: receiving samples of the signal; extracting, from the samples, values of two or more features indicative of the characteristic; providing the two or more extracted feature values as inputs to a machine learning agent; and causing the machine learning agent to process the extracted feature values to provide the estimate of the characteristic.
- Methods according to embodiments of the present disclosure may be applied to any type of signal, for example any digitally modulated signal.
- more than two features indicative of the signal-to-noise ratio characteristic may be input to the machine learning agent.
- at least 10 features may be used, or at least 15 features may be used.
- any features which vary with signal to noise ratio may be used. In this manner, the machine learning agent itself is allowed to determine what is relevant information and what is not, i.e. no pre-selection of a subset of specific features is necessary.
- the signal samples may be fed directly to feature extraction without any prior, intervening signal processing steps (such as framing, windowing or performing a Fourier transform).
- methods according to embodiments of the disclosure can work in the time domain (although features from the frequency domain could also be used). Avoiding the use of a Fourier transform reduces complexity and may improve the latency associated with the signal-to-noise estimation.
- methods according to embodiments of the disclosure do not require any prior information about the codec involved in the encoding of the signal of which the signal-to-noise ratio is to be determined. It should be appreciated that methods according to embodiments of the disclosure can provide an analogue (i.e.
- an SNR "class” for example. In this manner, an accurate estimation of the SNR can be obtained with no class association.
- Embodiments of the disclosure consider an entire, analogue, SNR range (from minimum expected to maximum expected), without the need for training data subsets to estimate SNR.
- the methods as described above may each be comprised in or implemented in apparatus comprising a processor or processing system.
- the processing system may comprise one or more processors and/or memory.
- One or more aspects of the embodiments described herein comprise processes performed by apparatus.
- the apparatus comprises one or more processing systems or processors configured to carry out these processes.
- embodiments may be implemented at least in part by computer software stored in (non-transitory) memory and executable by the processor, or by hardware, or by a combination of tangibly stored software and hardware (and tangibly stored firmware).
- Embodiments also extend to computer programs, particularly computer programs on or in a carrier, adapted for putting the above described embodiments into practice.
- the program may be in the form of non-transitory source code, object code, or in any other non-transitory form suitable for use in the implementation of processes according to embodiments.
- the carrier may be any entity or device capable of carrying the program, such as a RAM, a ROM, or an optical memory device, etc.
Landscapes
- Engineering & Computer Science (AREA)
- Physics & Mathematics (AREA)
- Theoretical Computer Science (AREA)
- Computer Networks & Wireless Communication (AREA)
- Signal Processing (AREA)
- Artificial Intelligence (AREA)
- Evolutionary Computation (AREA)
- Software Systems (AREA)
- Electromagnetism (AREA)
- Data Mining & Analysis (AREA)
- Computing Systems (AREA)
- Mathematical Physics (AREA)
- General Physics & Mathematics (AREA)
- General Engineering & Computer Science (AREA)
- Quality & Reliability (AREA)
- Health & Medical Sciences (AREA)
- Molecular Biology (AREA)
- General Health & Medical Sciences (AREA)
- Life Sciences & Earth Sciences (AREA)
- Computational Linguistics (AREA)
- Biophysics (AREA)
- Biomedical Technology (AREA)
- Computer Vision & Pattern Recognition (AREA)
- Medical Informatics (AREA)
- Power Engineering (AREA)
- Indication And Recording Devices For Special Purposes And Tariff Metering Devices (AREA)
- Digital Transmission Methods That Use Modulated Carrier Waves (AREA)
- Measurement Of Mechanical Vibrations Or Ultrasonic Waves (AREA)
Abstract
receiving (101) samples of the signal;
extracting, (103) from the samples, values of two or more features indicative of the signal-to-noise ratio characteristic;
providing (105) the two or more extracted feature values as inputs to a machine learning agent; and
causing (107) the machine learning agent to process the extracted feature values to provide the estimate of the signal-to-noise ratio characteristic.
Description
- The present disclosure concerns methods of determining signal characteristics. More particularly, but not exclusively, this disclosure concerns measures, including methods, apparatus and computer programs, for use in determining signal characteristics.
- In communications systems, for example, there is often a need or a desire to calculate a signal-to-noise ratio (SNR) characteristic of a received signal. This can be used to determine expected signal quality or to assist with further performance related measurements such as bit error rate (BER).
- Known methods for estimating SNR characteristics include blind methods and data-aided methods. Blind methods refer to estimating the SNR from a received signal when no extra (assisting) data is sent. An example of extra (assisting) data would be a pilot data sequence which is transmitted from the transmitter and known at the receiver. Known blind methods include the second moment, fourth moment (M2M4) estimator and the signal to variance ratio (SVR) estimator. A known data-aided method is the error vector magnitude (EVM).
- M2M4 and SVR have the disadvantages of relatively low accuracy and accuracy fluctuation over the range of SNRs they might be used for. Data-aided methods have the disadvantage of requiring the transmission of extra (assisting) data which results in greater power consumption at the transmitter and reduced overall channel capacity for actual data transmission.
- It is an object of the present disclosure to provide improved methods for estimating a signal-to-noise ratio (SNR) characteristic of a received signal, which do not suffer from the disadvantages set out above. In particular, it is an object of the present disclosure to more accurately calculate the Signal to Noise Ratio (SNR) of a transmit/receive system, for example, and to provide consistent accuracy across a relatively large SNR range.
- According to a first aspect, there is provided a method of determining an estimate of a signal-to-noise ratio characteristic of a signal, the method comprising, at a processor:
- receiving samples of the signal;
- extracting, from the samples, values of two or more features indicative of the signal-to-noise ratio characteristic;
- providing the two or more extracted feature values as inputs to a machine learning agent; and
- causing the machine learning agent to process the extracted feature values to provide the estimate of the signal-to-noise ratio characteristic.
- In embodiments, prior to the step of providing the two or more extracted feature values to the machine learning agent, the method may further comprise adjusting the relative weightings of at least two of the extracted feature values.
- Optionally, at least two of the extracted feature values may be normalised. The step of normalising may comprise rescaling each extracted feature value based on a predetermined mean and/or standard deviation of the respective feature. After normalisation, for each feature, the mean of the feature values may be equal to zero and the standard deviation of the feature values may be equal to one. In embodiments, a loop for continuous or periodic updating of the mean and standard deviation may be provided, to account for non-stationary signal statistics.
- The signal-to-noise ratio characteristic may be the ratio of the signal power to the noise power, expressed either on a decibel scale or a linear scale. Alternatively, the signal-to-noise ratio characteristic may be the signal-to-noise ratio per bit, Eb/N0.
- The machine learning agent may comprise an artificial neural network, ANN. The ANN may have multiple output neurons which are combined. In this manner, the accuracy of the estimation may be improved.
- The two or more features may comprise the maximum received signal amplitude and/or the minimum received signal amplitude.
- The two or more features may comprise the in-phase part, µ r , of the mean of the signal samples, M1 and/or the quadrature part µ i of the mean of the signal samples, wherein

- The two or more features may comprise the variance, M 2, of the signal samples, wherein

- The two or more features may comprise the in-phase part, αr, of the third moment of the signal samples, M 3, wherein


- The two or more features may comprise the fourth moment of the signal samples, M4, wherein

- The two or more features may comprise the Kurtosis value, which is given by the fourth moment of the signal samples, M4, normalized by the second moment squared of the signal samples, M2 2, wherein


- The two or more features may comprise the critical part, λ, of the M2M4 estimator of the signal samples, wherein λ = 2.M2 2 - M4, wherein M4 =


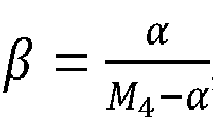
- The two or more features may comprise the critical part, β, of the signal to variance ratio, wherein

- In embodiments, prior to the step of providing the two or more extracted feature values as inputs to the machine learning agent, the methods may further comprise performing an initial training process of the machine learning agent, wherein the initial training process is continued until a pre-determined accuracy is achieved.
- In embodiments, the method may further comprise periodically updating the training of the machine learning agent when in use. Updating the training of the machine learning agent may be performed on the basis of the received signal samples.
- In embodiments, the method comprises extracting, from the samples, values of 10 or more features (or 15 or more features) indicative of the signal-to-noise ratio characteristic and providing all of the extracted feature values as inputs to a machine learning agent. Any feature that varies as a function of the signal-to-noise ratio characteristic may be used.
- In embodiments, prior to the step of extracting, from the samples, values of two or more features indicative of the signal-to-noise ratio characteristic, there is no prior signal processing (such as framing, windowing or performing a fast Fourier transform, for example). In this manner, the two or more feature values are extracted directly from the received signal samples.
- In embodiments, the signal is a time-domain signal and the step of extracting, from the samples, values of two or more features indicative of the signal-to-noise ratio characteristic is performed in the time domain.
- According to a second aspect, there is provided a computer program comprising a set of instructions, which, when executed by computerised apparatus, cause the computerised apparatus to perform a method of determining an estimate of a signal-to-noise ratio characteristic of a signal, the method comprising:
- receiving samples of the signal;
- extracting, from the samples, values of two or more features indicative of the signal-to-noise ratio characteristic;
- providing the two or more extracted feature values as inputs to a machine learning agent; and
- causing the machine learning agent to process the extracted feature values to provide the estimate of the signal-to-noise ratio characteristic.
- According to a third aspect, there is provided apparatus for determining an estimate of a signal-to-noise ratio characteristic of a signal, the apparatus comprising a processor configured to:
- receive samples of the signal;
- extract, from the samples, values of two or more features indicative of the signal-to-noise ratio characteristic;
- provide the two or more extracted feature values as inputs to a machine learning agent; and
- causing the machine learning agent to process the extracted feature values to provide the estimate of the signal-to-noise ratio characteristic.
- According to a fourth aspect, there is provided a method of determining an estimate of a characteristic of a signal, the method comprising, at a processor:
- receiving samples of the signal;
- extracting, from the samples, values of two or more features indicative of the characteristic;
- providing the two or more extracted feature values as inputs to a machine learning agent; and
- causing the machine learning agent to process the extracted feature values to provide the estimate of the characteristic.
- It will of course be appreciated that features described in relation to one aspect may be incorporated into other aspects.
- Embodiments of the present disclosure will now be described by way of example only with reference to the accompanying schematic drawings of which:
-
Figure 1 is a flow diagram corresponding to a method of determining a signal-to-noise ratio (SNR) characteristic of a signal according to embodiments of the disclosure; -
Figure 2 is a block diagram representing a communications system implementation of the method ofFigure 1 ; -
Figure 3 illustrates properties of an artificial neural network (ANN) according to embodiments of the disclosure; -
Figure 4 illustrates how inputs to the ANN can be represented by a matrix of column vectors according to embodiments of the disclosure; -
Figure 5 is a flow diagram corresponding to a method of determining a characteristic of a set of samples according to embodiments of the disclosure; -
Figures 6 and7 illustrate probability vectors which form the output of the ANN according to embodiments of the disclosure; -
Figure 8 illustrates back propagation, construction and comparison of ANN output probability vectors and ANN output target (probability) vectors according to embodiments of the disclosure; -
Figure 9 is a flow diagram that represents an example of training an ANN to be able to estimate the SNR of a received signal in a communications system according to embodiments of the disclosure; and -
Figures 10 and11 show simulated results for SNR estimation using methods according to the present disclosure and using classical methods. -
Figure 1 is a flow diagram corresponding to amethod 100 of determining an estimate of a signal-to-noise ratio (SNR) characteristic of a signal according to embodiments of the disclosure. In afirst step 101, the method comprises receiving samples of the signal at aprocessor 220. Then in a followingstep 103, values of two or more different features indicative of the signal-to-noise ratio characteristic are extracted from the samples. Examples of such features for estimating an SNR characteristic of a signal are given below. In embodiments, in a following,optional step 104 the extracted feature values are rescaled, as expanded upon below. In a followingstep 105, the two or more extracted feature values are provided as inputs to a machine learning agent. In afinal step 107, the extracted feature values are processed by the machine learning agent to provide the estimate of the signal-to-noise ratio characteristic. -
Figure 2 is a block diagram 200 representing a communications system implementation of the method ofFigure 1 according to embodiments of the present disclosure. A clean, transmitted (Tx) signal, s =x+jy, with transmit power S, is seen on the left ofFigure 2 . This is the signal at transmission time. The signal from which a single-to-noise ratio (SNR) characteristic is to be estimated is the received (noisy) version of this signal, z, which will constitute the clean signal, s =x+jy, with e.g. channel and/or system noise, n = nx + jny (having noise power N). z is thus a complex signal sequence of noisy complex samples given by z= (x + nx) + j(y + ny) =s+n. The noisy channel is represented byblock 201 inFigure 2 . The SNR characteristic may be the ratio of the signal power to the noise power, S/N, expressed either on a decibel scale or on a linear scale. Alternatively, or additionally, the SNR characteristic may be theEnergy per bit to Noise density ratio, Eb/No. Region 220 represents a processor which processes the noisy, received signal z according to the methods disclosed herein. - Next, in
block 203, values of two or more different features {F} indicative of the SNR characteristic to be estimated are extracted from the received signal samples, z. Features indicative of the SNR characteristic should be understood to mean features derived from the signal samples that in some way vary in accordance with the SNR characteristic and that are therefore sensitive to different values of the SNR characteristic. Many such features are envisaged as being applicable to methods according to the present disclosure. - For example, in embodiments the two or more features comprise the maximum received signal amplitude and/or the minimum received signal amplitude. In embodiments, the two or more extracted features comprise the in-phase part, µ r , of the mean of the signal samples, M1 and/or the quadrature part µ i of the mean of the signal samples, wherein M 1 = µ r +j.


- It should be appreciated that in methods according to embodiments of the present disclosure, unlike prior art SNR estimators, the extracted features are not limited to a particular sub-set of the received signal features. For example, the M2M4 estimator is limited to the first, second and fourth moment features, and the SVR estimator is limited to the first, fourth and pre-post fourth moment.
- Following feature value extraction in
block 203, methods according to embodiments of the present disclosure may proceed directly to block 205 (i.e. following the path labelled "Bypass" inFigure 2 ). In this manner, the two or more extracted feature values {F} are provided directly as inputs to a machine learning agent, such as an artificial neural network (ANN), for example. The machine learning agent is represented byblock 205. The machine learning agent processes the extracted feature values {F} to provide an estimate of the SNR characteristic. Specific, example implementation details are expanded upon below. - Alternatively, following feature extraction in
block 203, methods according to embodiments of the present disclosure may then proceed to block 204, which represents a rescaling process. In embodiments, the rescaling involves adjusting the relative weightings of at least two of the extracted feature values. By way of example, suppose two of the extracted features consist of the maximum received signal amplitude and the minimum received signal amplitude. For a given communications system, each of these features will have a typical range of values. As an example, adjusting the relative weightings of at least two of the extracted feature values may involve multiplying the maximum received signal amplitude by a factor of 1.5 and leaving the minimum received signal amplitude unchanged, thereby weighting the maximum received signal amplitude 50% more than the minimum received signal amplitude. - In embodiments, the rescaling involves normalising at least two of the extracted features. Normalisation may mean, for example, that after normalisation, the mean of each of the feature values is equal to zero and the standard deviation of each of the feature values is equal to one. By way of example, suppose two of the at least two extracted features consist of the maximum received signal amplitude and the minimum received signal amplitude. For a given communications system each of these features will have a typical range of values. This range can be determined during training of the machine learning agent, or from real-world measurements. Then, the rescaling process may involve subtracting, from each value of the maximum received signal amplitude (corresponding to a value obtained from a given set of received signal samples, e.g. 1024 samples), the mean maximum received signal amplitude, and dividing each value of the maximum received signal amplitude by the standard deviation of the maximum received signal amplitude. The same applies, mutatis mutandis, to other extracted features, such as the minimum received signal amplitude, for example.
- In this manner, due to normalisation, the extracted features have similar weightings which may improve the ability of the machine learning agent to process the different features equally. For example, there may be some features that have absolute values which are very large and others that are very small. In order to ensure smaller values are not "swamped" by larger values, the input features are normalized to their means and standard deviations. To do this, a pre-run may be carried out using, for example, the statistics calculator described in currently unpublished United Kingdom patent application nos.
GB2213111.4 GB2213110.6 block 204a. The rescaling factors may be updated from time to time, either in an offline process or by updating them in real-time. - Following rescaling, the rescaled feature values {F'} are then passed to block 205, where the estimate of the SNR characteristic is determined by the machine learning agent, in the manner described above.
-
Figure 3 illustrates properties of amachine learning agent 300 according to an embodiment. In this embodiment, an ANN is used as the machine learning agent. The input layer has 11 inputs, the output layer has 13 outputs and two hidden layers are employed, each having 16 nodes. "ReLU" denotes "RectiLinear Unit" and "Soft Max" represents a function that turns a vector of K real values into a vector of K real values that sum to 1. This is used to normalise the output vector, as is described in more detail below. - Attention is now turned to how the input and output vectors to and from the machine learning agent are constructed. In embodiments, the ANN uses a mini batch processing method of the type known in the art. Accordingly, the inputs to the ANN can be represented by a matrix of column vectors. If all of the 11 features described above are used, each column vector has 11 elements (numbered n = 0 to n = N-1, where N=11) corresponding to the features (either rescaled, normalised or unscaled). A typical batch size may be 128 column vectors (numbered m = 0 to m = M-1, where M=128). Such a mini batch input is shown in
Figure 4 . The batch size represents the number of feature vectors given to the ANN for each forward and backward processing/training iteration. - Turning attention to the machine learning agent (e.g. ANN) output, in embodiments the output comprises a vector comprising elements corresponding to the probabilities of different predetermined characteristic (e.g. SNR) values.
Figure 5 is a flow diagram corresponding to amethod 500 of determining an estimate of a characteristic of a set of samples according to embodiments of the disclosure. In afirst step 501, the method comprises receiving the samples at a processor. Next, instep 503, a value of at least one feature indicative of the characteristic is extracted from the samples. In embodiments, in a following,optional step 504, the extracted feature values are rescaled. Next, instep 505, the at least one extracted feature value is provided as an input to a machine learning agent (e.g. an ANN). Next, instep 507, the machine learning agent processes the at least one extracted feature value to provide an output indicative of the estimate of the characteristic. The output of the machine learning agent is a vector comprising elements corresponding to the probabilities associated with different predetermined characteristic values. In a final,optional step 509, in embodiments the estimate of the characteristic is obtained by multiplying each element of the vector with its associated predetermined characteristic value. - The
method 500 described with reference toFigure 5 is applicable to any general set of samples and any characteristic that it is desired to estimate from the samples. For example, the samples could be samples of a medical image and the characteristic could be bone density. However, specific embodiments of this method are described herein with reference to the communications system ofFigure 2 , in which the samples correspond to samples of a (received) signal and the characteristic is a signal-to-noise ratio characteristic (expressed either in dBs, on a linear scale, or Eb/N0, for example). Themethod 500 enables the machine learning agent to output any real value in a specified range (i.e. the output is not restricted to integer values). This is illustrated below with two specific examples. - With each system, a range can be identified, the minimum value of which is the minimum SNR, SNRmin, that can occur in the system and the maximum value corresponding to the maximum SNR, SNRmax, that can occur in the system. During training of the ANN, an nth output target probability vector, {p(n)} is generated by first generating an nth random target SNR value (used to train the system), SNRn. The next step is to determine the two integer SNR values that SNRn lies between. SNRs can be expressed in dBs or in linear numbers (note: when linear numbers are used a further step is generally employed in terms of generating a SNR/probability look-up table - this is explained later). With reference to
Figure 6 , as an example of when the characteristic is the SNR expressed in dBs, if a random SNR of 2.6751 dB is generated as part of the ANN training, then the two integer dB values that this value lies between can be found by calculating {SNRL = FLOOR(SNRn), SNRU = CEIL(SNRn)} which will give {SNRL = 2, SNRU = 3}, i.e. as expected 2.6751 dB lies between SNRL = 2 dB and SNRU = 3 dB. Note "FLOOR" and "CEIL" refer to rounding the value down and up to the nearest integer respectively. In an example system, the range of SNR of interest may be 0 dB to 12 dB. Working directly with dB and with this range enables the integer dB values to also represent the vector element number (which also goes from 0 to 12). - Continuing with this example, the output probability vector will have 13 elements, each being representative of the probability of occurrence of the corresponding, integer, SNR value (in dB). Denoting the probability vector by {p(n)}, where p(0) can be read as the probability that a SNR value of 0dB occurs, p(1) can be read as the probability that a SNR value of 1dB occurs, p(2) can be read as the probability that a SNR value of 2dB occurs, then, having found the two integer values the randomly generated SNRn value lies between, two probability relationships should hold. The first is that the sum of the lower SNR value, SNRL, multiplied by its probability, p(SNRL), and the upper SNR value, SNRU, multiplied by its probability, p(SNRU), is equal to the randomly generated value, SNRn=2.6751, i.e:

- Accordingly, in embodiments, the method further comprises obtaining the estimate of the characteristic, i.e. SNRn, by multiplying each element of the probability vector with its associated predetermined characteristic value, as represented by the equation above.
- A second relationship stems from the fact that, since some value must always occur, the sum of all probabilities in the vector should be equal to 1. However all p(n), except p(SNRL) and p(SNRU) will be zero, hence the second relationship is that the sum of the probabilities associated with the lower and upper integer SNRs should be equal to 1, i.e.

- These two equations can be solved to find p(SNRL) and p(SNRu) - used to train the ANN. In the example, 2.6751 = 2.p(2)+3.p(3), and 1.0 = p(2)+p(3). Solving gives p(2)=0.3249 and p(3) = 0.6751. The output probability vector derived for the randomly generated SNR of 2.6751dB is thus {0.0, 0.0, 0.3249, 0.6751, 0.0, 0.0, 0.0, 0.0, 0.0, 0.0, 0.0, 0.0, 0.0}, as seen in
Figure 6 . - A further example is now illustrated with reference to
Figure 7 . Here, the signal characteristic being estimated is the SNR expressed on a linear scale, as opposed to being expressed in dBs. There is no longer a direct relationship between the SNR value (since it is now linear) and the element index value in the vector, as seen inFigure 7 . In this example, keeping the SNR range the same (0 to 12dB), the corresponding linear range can be seen to be 1.0 to 15.84893192. A similar process is followed, whereby a random target SNR is generated, in the example this value is SNRn = 1.75 (lin.) and the two values, held in a Look Up Table (LUT), between which SNRn lies is found (in the example, this corresponds to SNRL = 1.584893192, and, SNRU = 1.995262315). The lower value, SNRL, is then taken as the value previous to SNRu. Following a process similar to that described above with reference toFigure 6 , with SNRL = 1.584893192 (from LUT) and SNRU = 1.995262315 and using the index of each to determine where the output probabilities will lie in the target (probability) vector gives p(2)=0.59766269, and, p(3)=0.40233731. The output probability vector derived for the randomly generated SNR of 1.75 (lin.) is thus {0.0, 0.0, 0.59766269, 0.40233731, 0.0, 0.0, 0.0, 0.0, 0.0, 0.0, 0.0, 0.0, 0.0}, as seen inFigure 7 . - For training of the ANN, the target vectors (derived in the manner described above) are used as the first step during the back propagation of the ANN. The target vectors are compared to the ANN output - which is first normalized because the ANN output vectors should also be probabilistic in nature, that is, the sum of all the elements when expressed in probability form must equal 1.0. The elements, {q̂n }, of each ANN un-normalized output vector, vo, from the ANN (after forward propagation is complete) are normalized by the sum of all the elements in that vector, to form the probability vector, vp, with probability elements, {qn}, i.e.:

- The first stage of training: back propagation, construction and comparison of ANN output probability vectors, {vp} and ANN output target (probability) vectors, {vt} is indicated in
Figure 8 . It will be appreciated that in embodiments, prior to the step of providing the two or more extracted feature values as inputs to the machine learning agent, an initial training process of the machine learning agent is performed. The initial training process is continued until a pre-determined accuracy is attained. Furthermore, the machine learning agent may undergo additional training in use. In a communications system, this additional training/learning may be based on actual received signal samples, for example. -
Figure 9 is a flow diagram 900 that represents an example of the processing to train an ANN to be able to estimate the SNR of a received signal in a communications system. The start of theprocess 901 involves reading in the communication system parameters, reading in the ANN parameters, setting up required random number generators, assigning dynamic memory storage and initializing ANN weights and biases. Apre-processing loop 902 is then executed, in order to derive the normalization parameters (with reference toblocks Figure 2 ) for the features which will be derived from the noisy, received, signal. In this example, these normalization parameters are then frozen - they could however be updated on a continuous basis and used on a dynamic basis. Once the normalization parameters have been found, the process enters the ANN training loop at 903. The first part/module in the loop is to generate, in step 904: - (1) Input (mini batch) data - a matrix of input vectors, the elements of each vector correspond to feature values, as explained above; and
- (2) Output target probability vectors (together with the associated channel SNR value - to be used later in the loop).
- This is then followed, at 905, by generating the communications system outputs which then have, at
step 906, (channel) noise added to them. The noisy communications system outputs (after the channel) are then used instep 907 to form the ANN (normalized) input features - using the normalization parameters found in the earlier pre-processing stage. The ANN input features are formatted into a matrix (a mini batch), each column of which is a vector of features (11 features in this example). - The mini batch is then subject, in
step 908, to ANN forward propagation to generate the ANN outputs. These outputs are then processed as detailed above, i.e. to normalise them. After this processing, there will exist a set of ANN-derived SNR output probability vectors, which are then turned into the ANN output Eb/N0 or SNR estimates. These estimates are then compared, instep 909, with the target values to see how many of the processed ANN output estimates are within a specified distance (e.g. 0.1dB) from the target value. The number with the required accuracy is compared to the last highest number (obtained from a previous pass through the loop). If the current number is higher than the last highest number, the ANN weights and biases are written to an output (text file) instep 910, i.e. stored, and the last highest number is replaced with the current number (the current number might also be stored in the text file to enable processing to carry on from the last best result should the number of iterations through the training loop prove to be insufficient for appropriate convergence). Instep 911, ANN back propagation is then carried out, using, for example, the Statistical Gradient Descent (SGD), Batch Gradient Descent (BGD) or Mini Batch Gradient Descent (MBGD), as in this example,method together with ADAptive Moments (ADAM) optimisation. - If the number of training epochs/iterations has not been exceeded, the process loops back and continues. If the number of training epochs/iterations has been equalled the process will stop. Should the accuracy and training results prove to be acceptable, the weights and biases can then be frozen, the training loop can be removed and the (trained) ANN can be used as a plug-in module to a communications system for estimating an SNR characteristic of a signal.
- An example communications system has been modelled/simulated and results indicate that the methods disclosed herein exceed the performance of standard, classical, methods in two ways:
- (1) More accurate values at any given Eb/N0 or SNR; and
- (2) More consistently accurate values over the entire range of Eb/N0 or SNR of interest.
- Graphs that indicate this are given in
Figure 10 (SNR in dBs) andFigure 11 (linear SNR).Figure 10 is a snapshot of 128 random SNR estimations (in dBs) where the method has over 79% of its batch estimations within 0.1dB of the actual value.Figure 11 is a snapshot of 128 random SNR estimations (linear) where the method has over 75% of its instantaneous batch estimations within 0.1 (linear) of the actual value. It shall be noted that methods according to the present disclosure outperform the two classical methods known as the SVR and M2M4 methods. - It should be appreciated that the method described with reference to
Figure 1 , and other Figures herein, is also applicable to determining an estimate of any general characteristic of a signal. Accordingly, the present disclosure also provides a method of determining an estimate of a characteristic of a signal. The method comprises, at a processor: receiving samples of the signal; extracting, from the samples, values of two or more features indicative of the characteristic; providing the two or more extracted feature values as inputs to a machine learning agent; and causing the machine learning agent to process the extracted feature values to provide the estimate of the characteristic. - Methods according to embodiments of the present disclosure may be applied to any type of signal, for example any digitally modulated signal. In embodiments, more than two features indicative of the signal-to-noise ratio characteristic may be input to the machine learning agent. For example, at least 10 features may be used, or at least 15 features may be used. In general, any features which vary with signal to noise ratio may be used. In this manner, the machine learning agent itself is allowed to determine what is relevant information and what is not, i.e. no pre-selection of a subset of specific features is necessary.
- In embodiments, the signal samples may be fed directly to feature extraction without any prior, intervening signal processing steps (such as framing, windowing or performing a Fourier transform). In this manner, methods according to embodiments of the disclosure can work in the time domain (although features from the frequency domain could also be used). Avoiding the use of a Fourier transform reduces complexity and may improve the latency associated with the signal-to-noise estimation. Furthermore, methods according to embodiments of the disclosure do not require any prior information about the codec involved in the encoding of the signal of which the signal-to-noise ratio is to be determined. It should be appreciated that methods according to embodiments of the disclosure can provide an analogue (i.e. continuous) value for the estimate of the signal to noise ratio, as opposed to a discretised estimate or a threshold estimate (i.e. whether the SNR is merely "good" or "bad", for example). It should be appreciated that according to embodiments of the disclosure, a direct SNR estimation is obtained, and methods disclosed herein may not require any postprocessing or formula-based mapping of the output of the machine learning agent.
- In embodiments, it is not required to define anything such as an SNR "class", for example. In this manner, an accurate estimation of the SNR can be obtained with no class association. Embodiments of the disclosure consider an entire, analogue, SNR range (from minimum expected to maximum expected), without the need for training data subsets to estimate SNR.
- The methods as described above may each be comprised in or implemented in apparatus comprising a processor or processing system. The processing system may comprise one or more processors and/or memory. One or more aspects of the embodiments described herein comprise processes performed by apparatus. In some examples, the apparatus comprises one or more processing systems or processors configured to carry out these processes. In this regard, embodiments may be implemented at least in part by computer software stored in (non-transitory) memory and executable by the processor, or by hardware, or by a combination of tangibly stored software and hardware (and tangibly stored firmware). Embodiments also extend to computer programs, particularly computer programs on or in a carrier, adapted for putting the above described embodiments into practice. The program may be in the form of non-transitory source code, object code, or in any other non-transitory form suitable for use in the implementation of processes according to embodiments. The carrier may be any entity or device capable of carrying the program, such as a RAM, a ROM, or an optical memory device, etc.
- It is to be understood that any feature described in relation to any one embodiment may be used alone, or in combination with other features described, and may also be used in combination with one or more features of any other of the embodiments, or any combination of any other of the embodiments. Furthermore, equivalents and modifications not described above may also be employed without departing from the scope of the invention, which is defined in the accompanying claims.
Claims (15)
- A method of determining an estimate of a signal-to-noise ratio characteristic of a signal, the method comprising, at a processor:receiving samples of the signal;extracting, from the samples, values of two or more features indicative of the signal-to-noise ratio characteristic;providing the two or more extracted feature values as inputs to a machine learning agent; andcausing the machine learning agent to process the extracted feature values to provide the estimate of the signal-to-noise ratio characteristic.
- The method of claim 1, further comprising, prior to the step of providing the two or more extracted feature values to the machine learning agent, adjusting the relative weightings of at least two of the extracted feature values.
- The method of claim 1 or 2, further comprising, prior to the step of providing the two or more extracted feature values to the machine learning agent, normalising at least two of the extracted feature values.
- The method of any proceeding claim, wherein the signal-to-noise ratio characteristic is the ratio of the signal power to the noise power, expressed either on a decibel scale or a linear scale, or the signal-to-noise ratio characteristic is the signal-to-noise ratio per bit, Eb/N0.
- The method of any preceding claim, wherein the two or more features comprise the maximum received signal amplitude and/or the minimum received signal amplitude.
- The method of any preceding claim, wherein the two or more features comprise the in-phase part, µ r , of the mean of the signal samples, M1 and/or the quadrature part µ i of the mean of the signal samples, wherein M 1 = µ r + j. µ i =

- The method of any preceding claim, wherein the two or more features comprise the variance, M 2, of the signal samples, wherein

- The method of any preceding claim, wherein the two or more features comprise the in-phase part, αr, of the third moment of the signal samples, M 3, wherein


- The method of any preceding claim, wherein the two or more features comprise the fourth moment of the signal samples, M4, wherein

- The method of any preceding claim, wherein the two or more features comprise the Kurtosis value, which is given by the fourth moment of the signal samples, M4, normalized by the second moment squared of the signal samples, M 2 2, wherein


- The method of any preceding claim, wherein the two or more features comprise the critical part, λ, of the M2M4 estimator of the signal samples, wherein λ = 2.M2 2 - M4, wherein


- The method of any preceding claim, wherein the two or more features comprise the critical part, β, of the signal to variance ratio, wherein


- A computer program comprising a set of instructions, which, when executed by computerised apparatus, cause the computerised apparatus to perform a method of determining an estimate of a signal-to-noise ratio characteristic of a signal, the method comprising:receiving samples of the signal;extracting, from the samples, values of two or more features indicative of the signal-to-noise ratio characteristic;providing the two or more extracted feature values as inputs to a machine learning agent; andcausing the machine learning agent to process the extracted feature values to provide the estimate of the signal-to-noise ratio characteristic.
- Apparatus for determining an estimate of a signal-to-noise ratio characteristic of a signal, the apparatus comprising a processor configured to:receive samples of the signal;extract, from the samples, values of two or more features indicative of the signal-to-noise ratio characteristic;provide the two or more extracted feature values as inputs to a machine learning agent; andcause the machine learning agent to process the extracted feature values to provide the estimate of the signal-to-noise ratio characteristic.
- A method of determining an estimate of a characteristic of a signal, the method comprising, at a processor:receiving samples of the signal;extracting, from the samples, values of two or more features indicative of the characteristic;providing the two or more extracted feature values as inputs to a machine learning agent; andcausing the machine learning agent to process the extracted feature values to provide the estimate of the characteristic.
Applications Claiming Priority (1)
| Application Number | Priority Date | Filing Date | Title |
|---|---|---|---|
| GB2219622.4A GB2625773A (en) | 2022-12-23 | 2022-12-23 | Determination of signal characteristics |
Publications (1)
| Publication Number | Publication Date |
|---|---|
| EP4391421A1 true EP4391421A1 (en) | 2024-06-26 |
Family
ID=85130141
Family Applications (1)
| Application Number | Title | Priority Date | Filing Date |
|---|---|---|---|
| EP23219162.7A Pending EP4391421A1 (en) | 2022-12-23 | 2023-12-21 | Determination of signal characteristics |
Country Status (3)
| Country | Link |
|---|---|
| US (1) | US12598008B2 (en) |
| EP (1) | EP4391421A1 (en) |
| GB (1) | GB2625773A (en) |
Citations (2)
| Publication number | Priority date | Publication date | Assignee | Title |
|---|---|---|---|---|
| WO2010015371A1 (en) * | 2008-08-05 | 2010-02-11 | Fraunhofer-Gesellschaft Zur Förderung Der Angewandten Forschung E . V . | Apparatus and method for processing an audio signal for speech enhancement using a feature extraction |
| CN110912629A (en) * | 2019-10-22 | 2020-03-24 | 南京海骅信息技术有限公司 | Signal-to-noise ratio prediction method and device and satellite communication link adaptive adjustment method |
Family Cites Families (6)
| Publication number | Priority date | Publication date | Assignee | Title |
|---|---|---|---|---|
| EP1273102B1 (en) * | 2000-04-04 | 2005-11-16 | Koninklijke Philips Electronics N.V. | A digital to analog converter |
| US20050226398A1 (en) * | 2004-04-09 | 2005-10-13 | Bojeun Mark C | Closed Captioned Telephone and Computer System |
| CN109305165B (en) * | 2017-07-28 | 2022-04-12 | 现代摩比斯株式会社 | Intelligent ultrasonic system, vehicle rear collision warning device and control method thereof |
| KR102654497B1 (en) * | 2019-05-20 | 2024-04-03 | 사안크야 랩스 프라이빗 리미티드 | RADIO MAPPING ARCHITECTURE FOR APPLYING MACHINE LEARNING TECHNIQUES TO WIRELESS RADIO ACCESS NETWORKS |
| US11545159B1 (en) * | 2021-06-10 | 2023-01-03 | Nice Ltd. | Computerized monitoring of digital audio signals |
| US12113657B2 (en) * | 2022-11-28 | 2024-10-08 | Rakuten Symphony, Inc. | PUCCH format 1 signal processing with reduced complexity |
-
2022
- 2022-12-23 GB GB2219622.4A patent/GB2625773A/en active Pending
-
2023
- 2023-12-21 US US18/392,358 patent/US12598008B2/en active Active
- 2023-12-21 EP EP23219162.7A patent/EP4391421A1/en active Pending
Patent Citations (2)
| Publication number | Priority date | Publication date | Assignee | Title |
|---|---|---|---|---|
| WO2010015371A1 (en) * | 2008-08-05 | 2010-02-11 | Fraunhofer-Gesellschaft Zur Förderung Der Angewandten Forschung E . V . | Apparatus and method for processing an audio signal for speech enhancement using a feature extraction |
| CN110912629A (en) * | 2019-10-22 | 2020-03-24 | 南京海骅信息技术有限公司 | Signal-to-noise ratio prediction method and device and satellite communication link adaptive adjustment method |
Non-Patent Citations (2)
| Title |
|---|
| ANONYMOUS: "machine learning - How and why do normalization and feature scaling work? - Cross Validated", 1 November 2012 (2012-11-01), XP055332275, Retrieved from the Internet <URL:http://stats.stackexchange.com/questions/41704/how-and-why-do-normalization-and-feature-scaling-work> [retrieved on 20170104] * |
| SHEN LU ET AL: "SIDOND: Single-Input Dual-Output Network for Radar Target Detection in Complex Environment", 2021 CIE INTERNATIONAL CONFERENCE ON RADAR (RADAR), IEEE, 15 December 2021 (2021-12-15), pages 2263 - 2266, XP034286873, DOI: 10.1109/RADAR53847.2021.10028574 * |
Also Published As
| Publication number | Publication date |
|---|---|
| US20240214089A1 (en) | 2024-06-27 |
| GB202219622D0 (en) | 2023-02-08 |
| GB2625773A (en) | 2024-07-03 |
| US12598008B2 (en) | 2026-04-07 |
Similar Documents
| Publication | Publication Date | Title |
|---|---|---|
| CN112735456B (en) | Speech enhancement method based on DNN-CLSTM network | |
| US9548064B2 (en) | Noise estimation apparatus of obtaining suitable estimated value about sub-band noise power and noise estimating method | |
| US9799331B2 (en) | Feature compensation apparatus and method for speech recognition in noisy environment | |
| Droppo et al. | Evaluation of the SPLICE algorithm on the Aurora2 database. | |
| US6778954B1 (en) | Speech enhancement method | |
| US9754608B2 (en) | Noise estimation apparatus, noise estimation method, noise estimation program, and recording medium | |
| EP2763134B1 (en) | Method and apparatus for voice recognition | |
| EP3410392A1 (en) | Image processing system and medical information processing system | |
| KR101266894B1 (en) | Apparatus and method for processing an audio signal for speech emhancement using a feature extraxtion | |
| CN108922513B (en) | Voice distinguishing method and device, computer equipment and storage medium | |
| CN109616139A (en) | Pronunciation signal noise power spectral density estimation method and device | |
| CN109036470B (en) | Voice distinguishing method, device, computer equipment and storage medium | |
| WO2019026973A1 (en) | Signal processing device using neural network, signal processing method using neural network, and signal processing program | |
| EP1995723A1 (en) | Neuroevolution training system | |
| Borowicz et al. | Signal subspace approach for psychoacoustically motivated speech enhancement | |
| EP4391422A1 (en) | Determination of signal characteristics | |
| US12598008B2 (en) | Determination of signal characteristics | |
| Rosenkranz et al. | Integrating recursive minimum tracking and codebook-based noise estimation for improved reduction of non-stationary noise | |
| CN114141266B (en) | Speech enhancement method based on PESQ-driven reinforcement learning to estimate prior signal-to-noise ratio | |
| Ondusko et al. | Blind signal-to-noise ratio estimation of speech based on vector quantizer classifiers and decision level fusion | |
| Yang et al. | Deep learning-based speech presence probability estimation for noise PSD estimation in single-channel speech enhancement | |
| US20240242726A1 (en) | Multi-pass neural network for speech enhancement | |
| Chinaev et al. | Improved noise power spectral density tracking by a MAP-based postprocessor | |
| CN116299196A (en) | An electromagnetic interference identification method, device, equipment and readable storage medium | |
| US20250284990A1 (en) | Systems And Methods for Quantum Linear Prediction |
Legal Events
| Date | Code | Title | Description |
|---|---|---|---|
| PUAI | Public reference made under article 153(3) epc to a published international application that has entered the european phase |
Free format text: ORIGINAL CODE: 0009012 |
|
| STAA | Information on the status of an ep patent application or granted ep patent |
Free format text: STATUS: THE APPLICATION HAS BEEN PUBLISHED |
|
| AK | Designated contracting states |
Kind code of ref document: A1 Designated state(s): AL AT BE BG CH CY CZ DE DK EE ES FI FR GB GR HR HU IE IS IT LI LT LU LV MC ME MK MT NL NO PL PT RO RS SE SI SK SM TR |
|
| STAA | Information on the status of an ep patent application or granted ep patent |
Free format text: STATUS: REQUEST FOR EXAMINATION WAS MADE |
|
| 17P | Request for examination filed |
Effective date: 20241217 |
|
| STAA | Information on the status of an ep patent application or granted ep patent |
Free format text: STATUS: EXAMINATION IS IN PROGRESS |
|
| 17Q | First examination report despatched |
Effective date: 20250916 |