EP4354446A1 - Information processing device, information processing method, and program - Google Patents
Information processing device, information processing method, and program Download PDFInfo
- Publication number
- EP4354446A1 EP4354446A1 EP22820308.9A EP22820308A EP4354446A1 EP 4354446 A1 EP4354446 A1 EP 4354446A1 EP 22820308 A EP22820308 A EP 22820308A EP 4354446 A1 EP4354446 A1 EP 4354446A1
- Authority
- EP
- European Patent Office
- Prior art keywords
- gene
- disease
- genes
- data
- feature space
- Prior art date
- Legal status (The legal status is an assumption and is not a legal conclusion. Google has not performed a legal analysis and makes no representation as to the accuracy of the status listed.)
- Pending
Links
- 230000010365 information processing Effects 0.000 title claims abstract description 41
- 238000003672 processing method Methods 0.000 title claims description 14
- 108090000623 proteins and genes Proteins 0.000 claims abstract description 336
- 201000010099 disease Diseases 0.000 claims abstract description 120
- 208000037265 diseases, disorders, signs and symptoms Diseases 0.000 claims abstract description 120
- 206010002026 amyotrophic lateral sclerosis Diseases 0.000 claims description 168
- 230000014509 gene expression Effects 0.000 claims description 134
- 101000648663 Homo sapiens Transmembrane protein 71 Proteins 0.000 claims description 56
- 102100028869 Transmembrane protein 71 Human genes 0.000 claims description 56
- 102100029846 Glutaminyl-peptide cyclotransferase Human genes 0.000 claims description 53
- 101000585315 Homo sapiens Glutaminyl-peptide cyclotransferase Proteins 0.000 claims description 53
- 101001026573 Homo sapiens cAMP-dependent protein kinase type I-alpha regulatory subunit Proteins 0.000 claims description 50
- 102100037490 cAMP-dependent protein kinase type I-alpha regulatory subunit Human genes 0.000 claims description 43
- 238000003745 diagnosis Methods 0.000 claims description 17
- 238000004458 analytical method Methods 0.000 claims description 14
- 238000012417 linear regression Methods 0.000 claims description 10
- 238000010586 diagram Methods 0.000 description 67
- 210000004027 cell Anatomy 0.000 description 34
- 210000002569 neuron Anatomy 0.000 description 20
- 238000000034 method Methods 0.000 description 17
- 238000002474 experimental method Methods 0.000 description 16
- 239000000090 biomarker Substances 0.000 description 12
- 238000011156 evaluation Methods 0.000 description 10
- 210000003819 peripheral blood mononuclear cell Anatomy 0.000 description 10
- 101150108055 CHMP2B gene Proteins 0.000 description 9
- 102100038279 Charged multivesicular body protein 2b Human genes 0.000 description 9
- 230000008569 process Effects 0.000 description 9
- 210000001778 pluripotent stem cell Anatomy 0.000 description 8
- 206010006542 Bulbar palsy Diseases 0.000 description 7
- 201000002241 progressive bulbar palsy Diseases 0.000 description 7
- 230000004083 survival effect Effects 0.000 description 7
- 230000009885 systemic effect Effects 0.000 description 7
- 239000013598 vector Substances 0.000 description 7
- 102100023067 Casein kinase I isoform gamma-3 Human genes 0.000 description 6
- 102100031635 Cytoplasmic dynein 1 heavy chain 1 Human genes 0.000 description 6
- 101001049879 Homo sapiens Casein kinase I isoform gamma-3 Proteins 0.000 description 6
- 101000866326 Homo sapiens Cytoplasmic dynein 1 heavy chain 1 Proteins 0.000 description 6
- 101710150875 TAR DNA-binding protein 43 Proteins 0.000 description 6
- 102100040347 TAR DNA-binding protein 43 Human genes 0.000 description 6
- 238000004364 calculation method Methods 0.000 description 6
- 238000004891 communication Methods 0.000 description 6
- 230000000694 effects Effects 0.000 description 6
- 238000007477 logistic regression Methods 0.000 description 6
- 230000008506 pathogenesis Effects 0.000 description 6
- 208000024827 Alzheimer disease Diseases 0.000 description 4
- 101150000326 Prkar1a gene Proteins 0.000 description 4
- 230000006870 function Effects 0.000 description 4
- 210000002161 motor neuron Anatomy 0.000 description 4
- 108091032973 (ribonucleotides)n+m Proteins 0.000 description 3
- 102000008130 Cyclic AMP-Dependent Protein Kinases Human genes 0.000 description 3
- 102000003642 glutaminyl-peptide cyclotransferase Human genes 0.000 description 3
- 108010081484 glutaminyl-peptide cyclotransferase Proteins 0.000 description 3
- 239000003446 ligand Substances 0.000 description 3
- 102100037685 60S ribosomal protein L22 Human genes 0.000 description 2
- 102100027790 ATP synthase subunit e, mitochondrial Human genes 0.000 description 2
- 241001261858 Alsodes Species 0.000 description 2
- 102100025971 F-actin-capping protein subunit alpha-2 Human genes 0.000 description 2
- 101001097555 Homo sapiens 60S ribosomal protein L22 Proteins 0.000 description 2
- 101000936958 Homo sapiens ATP synthase subunit e, mitochondrial Proteins 0.000 description 2
- 101000933166 Homo sapiens F-actin-capping protein subunit alpha-2 Proteins 0.000 description 2
- 101001094700 Homo sapiens POU domain, class 5, transcription factor 1 Proteins 0.000 description 2
- 101000713275 Homo sapiens Solute carrier family 22 member 3 Proteins 0.000 description 2
- 101100046483 Homo sapiens TMEM71 gene Proteins 0.000 description 2
- 101000653679 Homo sapiens Translationally-controlled tumor protein Proteins 0.000 description 2
- 108700021430 Kruppel-Like Factor 4 Proteins 0.000 description 2
- -1 L-Myc Proteins 0.000 description 2
- 241000699670 Mus sp. Species 0.000 description 2
- ZBZXYUYUUDZCNB-UHFFFAOYSA-N N-cyclohexa-1,3-dien-1-yl-N-phenyl-4-[4-(N-[4-[4-(N-[4-[4-(N-phenylanilino)phenyl]phenyl]anilino)phenyl]phenyl]anilino)phenyl]aniline Chemical compound C1=CCCC(N(C=2C=CC=CC=2)C=2C=CC(=CC=2)C=2C=CC(=CC=2)N(C=2C=CC=CC=2)C=2C=CC(=CC=2)C=2C=CC(=CC=2)N(C=2C=CC=CC=2)C=2C=CC(=CC=2)C=2C=CC(=CC=2)N(C=2C=CC=CC=2)C=2C=CC=CC=2)=C1 ZBZXYUYUUDZCNB-UHFFFAOYSA-N 0.000 description 2
- 102100035423 POU domain, class 5, transcription factor 1 Human genes 0.000 description 2
- 208000018737 Parkinson disease Diseases 0.000 description 2
- 101150035356 Qpct gene Proteins 0.000 description 2
- 101150018550 Qptc gene Proteins 0.000 description 2
- 101100247004 Rattus norvegicus Qsox1 gene Proteins 0.000 description 2
- 108020004459 Small interfering RNA Proteins 0.000 description 2
- 108010021188 Superoxide Dismutase-1 Proteins 0.000 description 2
- 102100038836 Superoxide dismutase [Cu-Zn] Human genes 0.000 description 2
- 102100029887 Translationally-controlled tumor protein Human genes 0.000 description 2
- SHGAZHPCJJPHSC-YCNIQYBTSA-N all-trans-retinoic acid Chemical compound OC(=O)\C=C(/C)\C=C\C=C(/C)\C=C\C1=C(C)CCCC1(C)C SHGAZHPCJJPHSC-YCNIQYBTSA-N 0.000 description 2
- 210000004369 blood Anatomy 0.000 description 2
- 239000008280 blood Substances 0.000 description 2
- 238000004422 calculation algorithm Methods 0.000 description 2
- 238000005401 electroluminescence Methods 0.000 description 2
- 239000000284 extract Substances 0.000 description 2
- 208000003532 hypothyroidism Diseases 0.000 description 2
- 230000002989 hypothyroidism Effects 0.000 description 2
- 230000028993 immune response Effects 0.000 description 2
- 238000011813 knockout mouse model Methods 0.000 description 2
- 101150111214 lin-28 gene Proteins 0.000 description 2
- 238000010801 machine learning Methods 0.000 description 2
- 230000004770 neurodegeneration Effects 0.000 description 2
- 238000012545 processing Methods 0.000 description 2
- 238000011160 research Methods 0.000 description 2
- 229930002330 retinoic acid Natural products 0.000 description 2
- 210000000278 spinal cord Anatomy 0.000 description 2
- UCSJYZPVAKXKNQ-HZYVHMACSA-N streptomycin Chemical compound CN[C@H]1[C@H](O)[C@@H](O)[C@H](CO)O[C@H]1O[C@@H]1[C@](C=O)(O)[C@H](C)O[C@H]1O[C@@H]1[C@@H](NC(N)=N)[C@H](O)[C@@H](NC(N)=N)[C@H](O)[C@H]1O UCSJYZPVAKXKNQ-HZYVHMACSA-N 0.000 description 2
- 229960001727 tretinoin Drugs 0.000 description 2
- DGVVWUTYPXICAM-UHFFFAOYSA-N β‐Mercaptoethanol Chemical compound OCCS DGVVWUTYPXICAM-UHFFFAOYSA-N 0.000 description 2
- 101150094738 ALS3 gene Proteins 0.000 description 1
- 101150037123 APOE gene Proteins 0.000 description 1
- 102100029470 Apolipoprotein E Human genes 0.000 description 1
- 239000012583 B-27 Supplement Substances 0.000 description 1
- 102000008096 B7-H1 Antigen Human genes 0.000 description 1
- 108010074708 B7-H1 Antigen Proteins 0.000 description 1
- 102000004219 Brain-derived neurotrophic factor Human genes 0.000 description 1
- 108090000715 Brain-derived neurotrophic factor Proteins 0.000 description 1
- AQGNHMOJWBZFQQ-UHFFFAOYSA-N CT 99021 Chemical compound CC1=CNC(C=2C(=NC(NCCNC=3N=CC(=CC=3)C#N)=NC=2)C=2C(=CC(Cl)=CC=2)Cl)=N1 AQGNHMOJWBZFQQ-UHFFFAOYSA-N 0.000 description 1
- 229940123320 Cyclase inhibitor Drugs 0.000 description 1
- DWJXYEABWRJFSP-XOBRGWDASA-N DAPT Chemical compound N([C@@H](C)C(=O)N[C@H](C(=O)OC(C)(C)C)C=1C=CC=CC=1)C(=O)CC1=CC(F)=CC(F)=C1 DWJXYEABWRJFSP-XOBRGWDASA-N 0.000 description 1
- 102100037373 DNA-(apurinic or apyrimidinic site) endonuclease Human genes 0.000 description 1
- 102000018233 Fibroblast Growth Factor Human genes 0.000 description 1
- 108050007372 Fibroblast Growth Factor Proteins 0.000 description 1
- 102000034615 Glial cell line-derived neurotrophic factor Human genes 0.000 description 1
- 108091010837 Glial cell line-derived neurotrophic factor Proteins 0.000 description 1
- 241000282412 Homo Species 0.000 description 1
- 101000776160 Homo sapiens Alsin Proteins 0.000 description 1
- 101000806846 Homo sapiens DNA-(apurinic or apyrimidinic site) endonuclease Proteins 0.000 description 1
- 101000836337 Homo sapiens Probable helicase senataxin Proteins 0.000 description 1
- 101001059454 Homo sapiens Serine/threonine-protein kinase MARK2 Proteins 0.000 description 1
- 101000823931 Homo sapiens Spatacsin Proteins 0.000 description 1
- 208000023105 Huntington disease Diseases 0.000 description 1
- ZDXPYRJPNDTMRX-VKHMYHEASA-N L-glutamine Chemical compound OC(=O)[C@@H](N)CCC(N)=O ZDXPYRJPNDTMRX-VKHMYHEASA-N 0.000 description 1
- 229930182816 L-glutamine Natural products 0.000 description 1
- 241000124008 Mammalia Species 0.000 description 1
- 241000699666 Mus <mouse, genus> Species 0.000 description 1
- 102000004230 Neurotrophin 3 Human genes 0.000 description 1
- 108090000742 Neurotrophin 3 Proteins 0.000 description 1
- 229930182555 Penicillin Natural products 0.000 description 1
- JGSARLDLIJGVTE-MBNYWOFBSA-N Penicillin G Chemical compound N([C@H]1[C@H]2SC([C@@H](N2C1=O)C(O)=O)(C)C)C(=O)CC1=CC=CC=C1 JGSARLDLIJGVTE-MBNYWOFBSA-N 0.000 description 1
- 102100027178 Probable helicase senataxin Human genes 0.000 description 1
- 102100028904 Serine/threonine-protein kinase MARK2 Human genes 0.000 description 1
- 108091027967 Small hairpin RNA Proteins 0.000 description 1
- 238000000692 Student's t-test Methods 0.000 description 1
- 230000002159 abnormal effect Effects 0.000 description 1
- 238000009825 accumulation Methods 0.000 description 1
- 239000000853 adhesive Substances 0.000 description 1
- 230000001070 adhesive effect Effects 0.000 description 1
- 230000006907 apoptotic process Effects 0.000 description 1
- 238000013459 approach Methods 0.000 description 1
- 238000003491 array Methods 0.000 description 1
- 229940077737 brain-derived neurotrophic factor Drugs 0.000 description 1
- 101710093418 cAMP-dependent protein kinase type I-alpha regulatory subunit Proteins 0.000 description 1
- 230000011496 cAMP-mediated signaling Effects 0.000 description 1
- 230000024245 cell differentiation Effects 0.000 description 1
- 230000004663 cell proliferation Effects 0.000 description 1
- 230000008859 change Effects 0.000 description 1
- 238000006243 chemical reaction Methods 0.000 description 1
- 230000001276 controlling effect Effects 0.000 description 1
- 238000012937 correction Methods 0.000 description 1
- 210000004748 cultured cell Anatomy 0.000 description 1
- 230000007547 defect Effects 0.000 description 1
- 230000001419 dependent effect Effects 0.000 description 1
- 238000011161 development Methods 0.000 description 1
- 230000018109 developmental process Effects 0.000 description 1
- 238000012631 diagnostic technique Methods 0.000 description 1
- 230000004069 differentiation Effects 0.000 description 1
- XHBVYDAKJHETMP-UHFFFAOYSA-N dorsomorphin Chemical compound C=1C=C(C2=CN3N=CC(=C3N=C2)C=2C=CN=CC=2)C=CC=1OCCN1CCCCC1 XHBVYDAKJHETMP-UHFFFAOYSA-N 0.000 description 1
- 238000007876 drug discovery Methods 0.000 description 1
- 238000011977 dual antiplatelet therapy Methods 0.000 description 1
- 230000007831 electrophysiology Effects 0.000 description 1
- 238000002001 electrophysiology Methods 0.000 description 1
- 210000001671 embryonic stem cell Anatomy 0.000 description 1
- 210000002257 embryonic structure Anatomy 0.000 description 1
- 238000005516 engineering process Methods 0.000 description 1
- 230000007613 environmental effect Effects 0.000 description 1
- 239000003797 essential amino acid Substances 0.000 description 1
- 235000020776 essential amino acid Nutrition 0.000 description 1
- 230000001747 exhibiting effect Effects 0.000 description 1
- 238000010195 expression analysis Methods 0.000 description 1
- 210000002950 fibroblast Anatomy 0.000 description 1
- 229940126864 fibroblast growth factor Drugs 0.000 description 1
- 230000002068 genetic effect Effects 0.000 description 1
- 210000004602 germ cell Anatomy 0.000 description 1
- 208000005017 glioblastoma Diseases 0.000 description 1
- 230000036541 health Effects 0.000 description 1
- 210000004263 induced pluripotent stem cell Anatomy 0.000 description 1
- 230000006698 induction Effects 0.000 description 1
- 230000010354 integration Effects 0.000 description 1
- 230000003993 interaction Effects 0.000 description 1
- 231100000518 lethal Toxicity 0.000 description 1
- 230000001665 lethal effect Effects 0.000 description 1
- 239000004973 liquid crystal related substance Substances 0.000 description 1
- 108010082117 matrigel Proteins 0.000 description 1
- 230000007246 mechanism Effects 0.000 description 1
- 230000004060 metabolic process Effects 0.000 description 1
- 238000002493 microarray Methods 0.000 description 1
- 230000004048 modification Effects 0.000 description 1
- 238000012986 modification Methods 0.000 description 1
- 201000006417 multiple sclerosis Diseases 0.000 description 1
- 210000005036 nerve Anatomy 0.000 description 1
- 230000001537 neural effect Effects 0.000 description 1
- 208000015122 neurodegenerative disease Diseases 0.000 description 1
- 230000004112 neuroprotection Effects 0.000 description 1
- 229940032018 neurotrophin 3 Drugs 0.000 description 1
- 238000010606 normalization Methods 0.000 description 1
- 238000010449 nuclear transplantation Methods 0.000 description 1
- 230000037361 pathway Effects 0.000 description 1
- 238000000059 patterning Methods 0.000 description 1
- 229940049954 penicillin Drugs 0.000 description 1
- 210000005259 peripheral blood Anatomy 0.000 description 1
- 239000011886 peripheral blood Substances 0.000 description 1
- 230000026731 phosphorylation Effects 0.000 description 1
- 238000006366 phosphorylation reaction Methods 0.000 description 1
- 102000054765 polymorphisms of proteins Human genes 0.000 description 1
- 230000002265 prevention Effects 0.000 description 1
- 238000003753 real-time PCR Methods 0.000 description 1
- 230000008439 repair process Effects 0.000 description 1
- 230000008672 reprogramming Effects 0.000 description 1
- 238000010839 reverse transcription Methods 0.000 description 1
- 238000003757 reverse transcription PCR Methods 0.000 description 1
- 201000000980 schizophrenia Diseases 0.000 description 1
- 230000019491 signal transduction Effects 0.000 description 1
- 239000004055 small Interfering RNA Substances 0.000 description 1
- 238000007619 statistical method Methods 0.000 description 1
- 238000013179 statistical model Methods 0.000 description 1
- 210000000130 stem cell Anatomy 0.000 description 1
- 229960005322 streptomycin Drugs 0.000 description 1
- 238000006467 substitution reaction Methods 0.000 description 1
- 208000024891 symptom Diseases 0.000 description 1
- 230000000946 synaptic effect Effects 0.000 description 1
- 208000011580 syndromic disease Diseases 0.000 description 1
- 238000012360 testing method Methods 0.000 description 1
- 230000001225 therapeutic effect Effects 0.000 description 1
- 102000035160 transmembrane proteins Human genes 0.000 description 1
- 108091005703 transmembrane proteins Proteins 0.000 description 1
- 108700026220 vif Genes Proteins 0.000 description 1
Images


Classifications
-
- G—PHYSICS
- G16—INFORMATION AND COMMUNICATION TECHNOLOGY [ICT] SPECIALLY ADAPTED FOR SPECIFIC APPLICATION FIELDS
- G16B—BIOINFORMATICS, i.e. INFORMATION AND COMMUNICATION TECHNOLOGY [ICT] SPECIALLY ADAPTED FOR GENETIC OR PROTEIN-RELATED DATA PROCESSING IN COMPUTATIONAL MOLECULAR BIOLOGY
- G16B40/00—ICT specially adapted for biostatistics; ICT specially adapted for bioinformatics-related machine learning or data mining, e.g. knowledge discovery or pattern finding
Definitions
- the present invention relates to an information processing device, an information processing method, and a program.
- ALS Amyotrophic lateral sclerosis
- Patent Document 1 Japanese Patent Application No. 2017-29116
- ALS Since ALS is diagnosed based on clinical findings and electrophysiology studies after clinical symptoms progress, molecular biomarkers for digital diagnosis of ALS are necessary. However, in sporadic ALS, which makes up 90 to 95% of ALS, genes that can serve as molecular biomarkers are still unknown. These challenges are not limited to ALS, but also apply to other multifactorial diseases and sporadic diseases such as Alzheimer's disease and Parkinson's disease which is sporadic in most patients.
- An object of the present invention is to provide an information processing device, an information processing method, and a program that can identify genes that can be used to diagnose a multifactorial disease or a sporadic disease.
- One aspect of the present invention relates to an information processing device including a processor configured to calculate, for combinations of genes included in a gene data set, a scale of dependence of a multifactorial disease or a sporadic disease on causative genes, and the multifactorial disease or the sporadic disease on related genes, and select a combination including a predetermined number of genes from among the data set based on the scale.
- FIG. 1 is a diagram illustrating an overview of the present embodiment.
- PBMCs peripheral blood mononuclear cells
- a high-dimensional nonlinear model is used to select gene combinations for classifying healthy subjects and patients with a multifactorial disease or a sporadic disease based on the genes expression amounts.
- Multifactorial diseases or sporadic diseases include, but are not limited to, for example, ALS, and include Alzheimer's disease and Parkinson's disease.
- sporadic ALS may be exemplified.
- a multifactorial disease or a sporadic disease will be described as "sporadic ALS.”
- a “multifactorial disease” is defined as a disease that is considered to develop due to the interaction between genetic factors and environmental factors
- a "sporadic disease” is defined as a disease with no recognized family history.
- sporadic disease is defined as a disease with no recognized family history.
- Sporadic ALS is also a multifactorial disease.
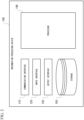
- FIG. 2 is a diagram showing an example of a configuration of an information processing device 100 according to an embodiment.
- the information processing device 100 includes, for example, a communication interface 110, an input interface 120, an output interface 130, a processor 140, and a storage 150.
- the communication interface 110 communicates with an external device via a network, for example, a wide area network (WAN) or a local area network (LAN).
- a network for example, a wide area network (WAN) or a local area network (LAN).
- the communication interface 110 includes a network interface card (NIC), a wireless communication module and the like.
- the external device may be, for example, a personal computer or a server installed in facilities where research or drug discovery development is performed (for example, research institutes, universities, and companies).
- the input interface 120 receives various input operations from a user, and outputs electrical signals corresponding to the received input operations to the processor 140.
- the input interface 120 is a mouse, a keyboard, a touch panel, a drag ball, a switch, a button or the like.
- the output interface 130 is, for example, a display or a speaker.
- the display may be, for example, a liquid crystal display (LCD) or an organic electro luminescence (EL) display.
- the display may be a touch panel formed integrally with the input interface 120.
- the processor 140 is realized by, for example, a processor such as a central processing unit (CPU) or a graphics processing unit (GPU) executing a program stored in the storage 150. Some or all of the functions of the processor 140 may be realized by hardware such as a large scale integration (LSI), an application specific integrated circuit (ASIC), or a field-programmable gate array (FPGA), or may be realized in cooperation of software and hardware. Respective functions of the processor 140 will be described below.
- LSI large scale integration
- ASIC application specific integrated circuit
- FPGA field-programmable gate array
- the storage 150 is realized by, for example, a hard disc drive (HDD), a flash memory, an electrically erasable programmable read only memory (EEPROM), a read only memory (ROM), or a random access memory (RAM).
- the storage 150 stores various programs such as a firmware and application programs.
- FIG. 3 is a flowchart showing a flow of a series of processes performed by the processor 140 for identifying a combination of genes according to an embodiment.
- the processor 140 selects combinations including a predetermined number of genes from among the ALS causative gene group (Step S100).
- ALS causative genes for example, 33 genes including SOD1, ALS2, ALS3, and SETX are known (refer to FIG. 7 below for details).
- the processor 140 selects combinations including a predetermined number of genes from among 33 causative genes.
- the predetermined number is preferably 3, but the number is not limited thereto and it may be, for example, 2 or 4 or more.
- the predetermined number is "3" will be described.
- the processor 140 may select 5,456 combinations.
- the processor 140 calculates a scale of dependence (or independence) between the causative genes combined in S100 (Step S102).
- linear models such as linear logistic regression and Hotelling's t2 test are generally used.
- life phenomena are considered as nonlinear science, and the pathogenesis of diseases cannot be explained by a single factor. Therefore, in the present embodiment, gene expression is analyzed using a nonlinear model.
- the processor 140 calculates an HSIC score as a dependence scale of a combination of causative genes using a Hilbert-Schmidt independence criterion (HSIC) which is a type of machine learning and with which a nonlinear structure can be detected in high-dimensional data.
- HSIC Hilbert-Schmidt independence criterion
- FIG. 4 is a diagram illustrating a method of calculating an HSIC score.
- the processor 140 distributes combinations of ALS causative genes (vector data representing respective three causative genes) in a (reproducing kernel) Hilbert space (a feature space in the drawing), and calculates the HSIC score between causative genes on the Hilbert space. For example, the processor 140 calculates HSIC scores for all 5,456 combinations.
- the processor 140 selects combinations including a predetermined number of genes from among the ALS related gene group (Step S104).
- the ALS related genes for example, in addition to the above causative genes, additionally, 126 genes such as APEX1, APOE, AR, and CCS are known (refer to FIG. 7 below for details).
- the processor 140 selects combinations including a predetermined number of genes from among 126 related genes.
- the predetermined number is preferably 3, but the number is not limited thereto, and may be, for example, 2 or 4 or more. For example, when any three genes are selected from among 126 related genes, the processor 140 may select 325,500 combinations.
- the processor 140 calculates a scale of dependence (or independence) between the related genes combined in S104 (Step S 106).
- the processor 140 calculates HSIC scores for all 325,500 combinations as in the case of the causative genes.
- the processor 140 selects a gene combination with the highest HSIC score from among the gene combinations for which the HSIC score is calculated (Step S108).
- the processor 140 performs linear regression analysis such as logistic regression, and selects or extracts a specific combination including genes with a high appearance frequency (number of appearances) from a set of a plurality of combinations for which the HSIC score is calculated (hereinafter referred to as a combination population). For example, the processor 140 may select or extract a combination including genes whose appearance frequency is equal to or more than a threshold value as a specific combination (in other words, a combination to be excluded).
- the threshold value is, for example, 10, but the value is not limited thereto, and any other value may be used.
- the processor 140 excludes the specific combination including genes with a high appearance frequency from the combination population.
- the processor 140 selects the gene combination with the highest HSIC score from among the combination population from which the specific combination is excluded.
- a combination of PRKAR1A, QPCT, and TMEM71 is selected from among the combinations of ALS causative genes or related genes. Accordingly, a series of processes related to identification of gene combinations are completed.
- FIG. 5 is a flowchart showing a flow of a series of processes performed by the processor 140 for generating molecular biomarkers for digital diagnosis according to an embodiment.
- the processor 140 distributes, based on expression amounts of PRKAR1A, QPCT, and TMEM71 of a plurality of respective healthy subjects (hereinafter referred to as a healthy subject group), gene data of the healthy subjects in a three-dimensional feature space whose dimensions are expression amounts of these three genes (Step S200).
- the gene data of the healthy subjects distributed in the feature space may be represented as a three-dimensional vector (e1, e2, e3) including the expression amount of PRKAR1A as a first element e1, the expression amount of QPCT as a second element e2, and the expression amount of TMEM71 as a third element e3.
- the processor 140 distributes, based on expression amounts of PRKAR1A, QPCT, and TMEM71 of a plurality of respective ALS patients (hereinafter referred to as an ALS patient group), gene data of the ALS patients in a three-dimensional feature space whose dimensions are expression amounts of these three genes (Step S202).
- the gene data of the ALS patients distributed in the feature space may be represented as a three-dimensional vector (e1, e2, e3) like the gene data of healthy subjects.
- the processor 140 clusters the gene data of healthy subjects and the gene data of ALS patients in the three-dimensional feature space (Step S204). For example, as shown in FIG. 19A and FIG. 19B in examples to be described below, in a three-dimensional feature space whose dimensions are the expression amount of RKAR1A, the expression amount of QPCT, and the expression amount of TMEM71, the processor 140 classifies the gene data of healthy subjects (Health Control in the drawing) and the gene data of ALS patients (ALS in the drawing) into clusters.
- the processor 140 stores clusters of gene data of healthy subjects and clusters of gene data of ALS patients formed in the feature space as molecular biomarkers for digital diagnosis in the storage 150 (Step S206). Accordingly, a series of processes related to generation of molecular biomarkers for digital diagnosis are completed.
- FIG. 6 is a flowchart showing a flow of a series of processes performed by the processor 140 for determining ALS onset according to an embodiment.
- the processor 140 acquires gene data of a subject for diagnosis of ALS (Step S300).
- the gene data of the subject may be represented as a three-dimensional vector (e1, e2, e3) in the same manner as above.
- the processor 140 distributes the gene data of the subject in a feature space in which clusters (clusters of healthy subjects and clusters of ALS patients) are formed as molecular biomarkers (Step S302).
- the processor 140 calculates, on the feature space, a distance D1 between the gene data of the subject and the cluster of the healthy subjects and calculates a distance D2 between the gene data of the subject and the cluster of ALS patients (Step S304).
- the processor 140 determines whether the subject will develop ALS at some point in the future or whether the subject has already developed ALS at the present time based on the respective distance of two clusters (Step S306).
- the processor 140 may determine that the subject will develop ALS at some point in the future or the subject had already developed ALS at the present time.
- the processor 140 may determine that the subject will not develop ALS at some point in the future and the subject has not developed ALS at the present time.
- Step S308 the processor 140 outputs the determination result regarding whether the subject has developed ALS.
- the processor 140 may transmit the determination result to an external device via the communication interface 110 or may output the determination result via the output interface 130 (for example, a display). Accordingly, a series of processes related to the determination of ALS onset are completed.
- the information processing device 100 calculates, for combinations of ALS causative genes or related genes, a scale (for example, HSIC score) of dependence between the genes included in the combinations, and selects a combination with the highest scale from among the plurality of combinations (that is, from among the combination population) for which the scale is calculated. Accordingly, it is possible to identify genes that can be used to diagnose ALS.
- a scale for example, HSIC score
- the information processing device 100 distributes the gene data of healthy subjects in the feature space based on expression amounts of the genes derived from the healthy subjects (genes included in the above combination with the highest scale) and additionally, distributes the gene data of ALS patients in the same feature space based on expression amounts of the genes derived from the ALS patients (genes included in the above combination with the highest scale). Then, the information processing device 100 clusters the gene data of healthy subjects and the gene data of ALS patients on the feature space. Accordingly, it is possible to generate molecular biomarkers for digital diagnosis on the feature space.
- the information processing device 100 acquires gene data of a subject for diagnosis of ALS and distributes the gene data of the subject in the feature space in which the clusters of healthy subjects and ALS patients are formed.
- the information processing device 100 calculates the distance between each cluster and the gene data of the subject on the feature space, and determines, based on the distance, whether the subject will develop ALS at some point in the future or whether the subject has already developed ALS at the present time. Accordingly, it is possible to accurately determine whether ALS has developed.
- An information processing device including a processor configured to calculate, for combinations of genes included in a gene data set, a scale of dependence of a multifactorial disease or a sporadic disease on causative genes, and the multifactorial disease or the sporadic disease on related genes, and select a combination including a predetermined number of genes from among the data set based on the scale.
- An information processing method using a computer including:
- Gene expression data (GSE112676, 233 ALS and 508 CTL) was used for HSIC analysis.
- Gene expression signals were normalized by downloading raw expression intensities and detected p-values (GSE112676_HT12_V3_preQC_nonnormalized.txt) and using R limma package (v3. 32.10) function (background Correct and normalize Between Arrays).
- R limma package v3. 32.10 function (background Correct and normalize Between Arrays).
- the ComBat algorithm implemented in the R sva package (v3. 35.2) was used.
- One sample (GSM3077426) with an abnormal value even after batch effect correction was excluded from further analysis.
- ALS related genes in ALS online database (ALSoD, https://alsod.ac.uk/) were used. Unbiased HSIC prediction was performed using the top 1,000 variable genes among the detectably expressed genes of 20% or more of samples.
- Pluripotent stem cells were prepared.
- Examples of pluripotent stem cells included embryonic stem cells (ES cells), induced pluripotent stem cells (iPS cells), embryonic stem (ntES) cells derived from cloned embryos obtained by nuclear transplantation, sperm stem cells (GS cells), and embryonic germ cells (EG cells).
- ES cells embryonic stem cells
- iPS cells induced pluripotent stem cells
- ntES embryonic stem cells derived from cloned embryos obtained by nuclear transplantation
- GS cells sperm stem cells
- EG cells embryonic germ cells
- Preferable pluripotent stem cells were ES cells, iPS cells or ntES cells. More preferable pluripotent stem cells were human pluripotent stem cells, and human ES cells and human iPS cells were particularly preferable.
- the cells that could be used in the present invention were not only pluripotent stem cells but also cell groups induced by socalled "direct reprogramming," which were induced to directly differentiate into desired cells without passing through pluripotent stem cells.
- human iPS cells were used.
- iPS cells were human iPS cells.
- iPS cells were prepared from fibroblasts or PBMCs from healthy subjects and sporadic ALS patients using OCT3/4, Sox2, Klf4, L-Myc, Lin28 and dominant negative p53 episomal vectors, or OCT3/4, Sox2, Klf4, L-Myc, Lin28 and shRNA for p53.
- the cells were cultured in a feeder-free and xeno-free culture system using StemFit (Ajinomoto) to which penicillin/streptomycin were added.
- iPS cells were dissociated into single cells, and rapidly reaggregated in a low-cell adhesive U-shaped 96-well plate (Lipidule-Coated Plate A-U96, NOF Corporation, Tokyo, Japan).
- Aggregates were treated using 5% KSR (Invitrogen, Waltham, MA), minimum essential medium-non-essential amino acid (Invitrogen), L-glutamine (Sigma-Aldrich, St. Louis, MO), 2-mercaptoethanol (Wako, Osaka, Japan), 2 ⁇ M dorsomorphin (Sigma-Aldrich), 10 ⁇ M SB431542 (Cayman, Ann Arbor, MI), 3 ⁇ M CHIR99021 (Cayman), and 12.5 ng/mL fibroblast growth factor (Wako) in a nerve induction stage for 11 days.
- the adhered cells were cultured in a neural base medium containing 10 ng/ml brain-derived neurotrophic factor (R&D Systems, Minneapolis, MN), 10 ng/ml glial cell line-derived neurotrophic factor (R&D Systems), and 10 ng/ml neurotrophin-3 (R&D Systems) for 8 days. On the 21 st day, the cells were dissociated into single cells using Accumax and seeded in an iMatrix-coated 24-well plate (Corning) at 2 ⁇ 105 cells/well.
- RNA of the cultured cells was extracted using RNeasy Plus Mini kit (QIAGEN). 1 ⁇ g of RNA was reversely transcribed using ReverTra Ace (TOYOBO, Osaka, Japan). Quantitative PCR analysis was performed using SYBR Premix Ex TaqII (TAKARA) according to a reverse transcription reaction using StepOnePlus (Thermo Fisher Scientific).
- PBMCs peripheral blood mononuclear cells
- FIG. 7 is a diagram showing a list of ALS causative genes or related genes. For example, from the genes shown in FIG. 7 , 33 causative genes known as ALS causative gene were selected, and additionally, combinations of three genes were selected from among the 33 causative genes.
- FIG. 8 is a diagram showing calculation results of HSIC scores for combinations of three causative genes.
- FIG. 8 shows only the top 15 combinations with the highest HSIC score.
- the causative gene combination with the highest HSIC score included SPG11, CHMP2B, and VCP (an HSIC score of 0.0988).
- FIG. 9 is a diagram showing evaluation results of ROC for combinations of causative genes. As shown in FIG. 9 , the combination of SPG1 1, CHMP2B, and VCP with the highest HSIC score had an AUC (area under the curve) of 0.75 in ROC. Therefore, in the result, there was a statistically significant difference in AUC.
- FIG. 10 is a diagram showing calculation results of HSIC scores for combinations of three related genes. Like FIG. 8 , FIG. 10 shows only the top 15 combinations with the highest HSIC score.
- the related gene combination with the highest HSIC score included CSNK1G3, CHMP2B, and DYNC1H1 (an HSIC score of 0.11365).
- FIG. 11 is a diagram showing evaluation results of ROC for combinations of related genes. As shown in FIG. 11 , the combination of CSNK1G3, CHMP2B, and DYNC1H1 with the highest HSIC score had an AUC (AUC for classifying the healthy subject group and the ALS patient group) of 0.75 in ROC. Therefore, in the result, there was a statistically significant difference in AUC.
- FIG. 12 is a list of combinations of genes listed in descending order of HSIC scores.
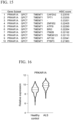
- FIG. 13 is a list of combinations of genes listed in descending order of AUC determined by logistic regression.
- FIG. 14 is a diagram showing the top 50 genes with the highest appearance frequency. As shown in FIG. 14 , TPT1 appeared 25 times, ATP5I appeared 39 times, CAPZA2 appeared 17 times, and RPL22 appeared 11 times.
- FIG. 15 is a diagram showing calculation results of HSIC scores when the number of genes combined is increased to 4. When four genes were combined, the HSIC score did not change significantly compared to when three genes were combined. Therefore, a combination of three genes was selected.
- FIG. 16 is a diagram showing expression levels of PRKAR1A in respective healthy subjects and ALS patients.
- FIG. 17 is a diagram showing expression levels of QPCT in respective healthy subjects and ALS patients.
- FIG. 18 is a diagram showing expression levels of TMEM71 in respective healthy subjects and ALS patients. The expression levels of all three genes were higher in the ALS patients than in the healthy subjects.
- FIG. 19A and FIG. 19B are diagrams showing a feature space. As shown in FIG. 19A and FIG. 19B , on the three-dimensional feature space, the genes of the healthy subjects were classified into the same cluster, and the genes of the ALS patients were classified into the same cluster.
- FIG. 20 is a diagram showing evaluation results of ROC for combinations of PRKAR1A, QPCT, and TMEM71.
- AUC AUC for classifying the healthy subject group and the ALS patient group
- FIG. 21A is a diagram showing the correlation between expression amounts of PRKAR1A and survival periods.
- FIG. 21B is a diagram showing the correlation between expression amounts of QPCT and survival periods.
- FIG. 21C is a diagram showing the correlation between expression amounts of TMEM71 and survival periods.
- FIG. 22A is a diagram showing the correlation between expression amounts of PRKAR1A and ages of onset.
- FIG. 22B is a diagram showing correlation between expression amounts of QPCT and ages of onset.
- FIG. 22C is a diagram showing the correlation between expression amounts of TMEM71 and ages of onset.
- FIG. 23A is a diagram showing the correlation between expression amounts of PRKAR1A and a bulbar palsy type and a systemic type.
- FIG. 23B is a diagram showing the correlation between expression amounts of QPCT and a bulbar palsy type and a systemic type.
- FIG. 23C is a diagram showing the correlation between expression amounts of TMEM71 and a bulbar palsy type and a systemic type.
- the gene expression amounts of PRKAR1A and TMEM71 did not have a significant correlation in QPCT, but they had a correlation in the survival period.
- FIGS. 22A, 22B, and 22C there was no correlation between the age of onset and the expression amounts of the three genes.
- FIGS. 23A, 23B , and 23C there was no difference in QPCT, but systemic type ALS patients showed significantly higher expression amounts of PRKAR1A and TMEM71 than bulbar palsy type ALS patients.
- FIG. 24A is a diagram comparing expression amounts of PRKAR1A in healthy subjects and expression amounts of PRKAR1A in ALS patients.
- FIG. 24B is a diagram comparing expression amounts of QPCT in healthy subjects and expression amounts of QPCT in ALS patients.
- FIG. 24C is a diagram comparing expression amounts of TMEM71 in healthy subjects and expression amounts of TMEM71 in ALS patients. As shown in FIGS. 24A , 24B, and 24C , it was observed that the expression amounts of PRKAR1A and QPCT were significantly higher in the ALS patients than in the healthy subjects, and the expression amount of TMEM71 tended to be higher in the ALS patients.
- FIG. 25 is a diagram showing evaluation results of ROC for combinations of PRKAR1A, QPCT, and TMEM71 extracted from a small number of examples.
- the expression amounts of the three genes PRKAR1A, QPCT, and TMEM71 were combined, even with a small number of examples of 12 ALS patients and 12 healthy subjects, the AUC for classifying the healthy subjects and the ALS patients was 0.85. Based on these results, it was confirmed that, when the expression amounts of the three genes in the PBMCs were examined, it was possible to distinguish the ALS patient group and the healthy subject group.
- FIG. 26 shows an image of iPS cells and a captured image of motor nerve cells obtained from the iPS cells.
- FIG. 27A is a diagram comparing expression amounts of PRKAR1A between motor nerve cells of healthy subjects and motor nerve cells of ALS patients.
- FIG. 27B is a diagram comparing expression amounts of QPCT between motor nerve cells of healthy subjects and motor nerve cells of ALS patients.
- FIG. 27C is a diagram comparing expression amounts of TMEM71 between motor nerve cells of healthy subjects and motor nerve cells of ALS patients.
- FIG. 28 is a diagram showing evaluation results of ROC for combinations of PRKAR1A, QPCT, and TMEM71 extracted from motor nerve cells.
- FIG. 29 is a diagram showing an example of relative expression amounts of TDP-43 for respective genes PRKAR1A, QPCT, and TMEM71.
- PRKAR1A, QPCT, and TMEM71 were knock-downed with siRNA, the expression amount of TDP-43 significantly increased in motor nerve cells derived from both healthy subjects and ALS patients.
- FIG. 30A is a graph showing expression amounts of PRKAR1A extracted from respective healthy subjects and ALS patients.
- FIG. 30B is a graph showing expression amounts of QPCT extracted from respective healthy subjects and ALS patients.
- FIG. 30C is a graph showing expression amounts of TMEM71 extracted from respective healthy subjects and ALS patients.
- the vertical axis represents gene expression amount, and the horizontal axis represents case.
- FIG. 31A is a graph showing expression amounts of SPG11 extracted from ALS causative genes and ALS related genes.
- FIG. 31B is a graph showing expression amounts of CHMP2B extracted from ALS causative genes and ALS related genes.
- FIG. 31C is a graph showing expression amounts of CSNK1G3 extracted from ALS causative genes and ALS related genes.
- FIG. 31D is a graph showing expression amounts of DYNC1H1 extracted from ALS causative genes and ALS related genes.
- the vertical axis represents gene expression amount
- the horizontal axis represents case.
- HSIC machine learning algorithm
- the HSIC was used to measure a statistical dependence between two random vectors, the two random vectors were converted into two reproducing kernel Hilbert spaces (RKHS), and the statistical dependence was measured using a Hilbert-Schmidt (HS) operator of these two RKHSs.
- ALS is a heterogeneous disease exhibiting nonlinear biological phenomena, and its pathogenesis cannot be explained by a single factor. Therefore, this model was applied, and a combination of genes for classifying ALS patients and healthy subjects was searched for using blood sample data.
- a nonlinear model was used, a combination of novel genes, PRKAR1A, QPCT, and TMEM71, was successfully found.
- the PRKAR1A gene is a gene encoding a serine/threonine kinase, cAMP-dependent protein kinase type I-alpha regulatory subunit, which is a major mediator of cAMP signaling in mammals. Phosphorylation through the cAMP/PKA signal pathway was induced by various physiological ligands within cells, and critically involved in controlling of metabolism, cell proliferation, differentiation, and apoptosis. Loss of one or both allelic genes for this gene caused multiple sclerosis syndromes in humans and embryonic lethal defects in mice.
- the Gene ID of the PRKAR1A gene, an example of NCBI Reference Sequence, and the address of the NCBI reference site are as follows.
- the QPTC gene encodes glutaminyl-peptide cyclotransferase. It has been reported that the expression of glutaminyl cyclase increased in the peripheral blood of patients with Alzheimer's disease, and the glutaminyl cyclase inhibitor could be a measure for improving Alzheimer's disease. In addition, it has been reported that QPCT was identified as a therapeutic target for Huntington's disease, and polymorphisms of the QPCT gene were related to susceptibility to schizophrenia. Although the relationship with the pathogenesis of ALS was unclear, the increased QPCT gene expression could be related to a common pathway in neurodegeneration.
- the Gene ID of the QPTC gene, an example of NCBI Reference Sequence, and the address of the NCBI reference site are as follows.
- TMEM71 encodes transmembrane proteins, but its functions have not been clearly elucidated. Knock-out mice exhibited slight hypothyroidism, but no phenotype. The expression of TMEM71 increased in glioblastoma and was related with the immune response, and TMEM71 exhibited a high positive correlation with PD-1 and PD-L1. Knock-out mice exhibited only slight hypothyroidism, but no phenotype. The increased TMEM71 gene expression could be related to the immune response to ALS.
- the Gene ID of the TMEM71 gene, an example of NCBI Reference Sequence, and the address of the NCBI reference site are as follows.
Abstract
An information processing device includes a processor configured to calculate, for combinations of genes included in a gene data set, a scale of dependence of a multifactorial disease or a sporadic disease on causative genes, and the multifactorial disease or the sporadic disease on related genes, and select a combination including a predetermined number of genes from among the data set based on the scale.
Description
- The present invention relates to an information processing device, an information processing method, and a program.
- Priority is claimed on
U.S. Provisional Application No. 63/208,509, filed June 9, 2021 - Amyotrophic lateral sclerosis (ALS) is a fatal neurodegenerative disease caused by loss of motor neurons, and there is an urgent need to develop diagnostic techniques for ALS.
- [Patent Document 1]
Japanese Patent Application No. 2017-29116 - Since ALS is diagnosed based on clinical findings and electrophysiology studies after clinical symptoms progress, molecular biomarkers for digital diagnosis of ALS are necessary. However, in sporadic ALS, which makes up 90 to 95% of ALS, genes that can serve as molecular biomarkers are still unknown. These challenges are not limited to ALS, but also apply to other multifactorial diseases and sporadic diseases such as Alzheimer's disease and Parkinson's disease which is sporadic in most patients.
- An object of the present invention is to provide an information processing device, an information processing method, and a program that can identify genes that can be used to diagnose a multifactorial disease or a sporadic disease.
- One aspect of the present invention relates to an information processing device including a processor configured to calculate, for combinations of genes included in a gene data set, a scale of dependence of a multifactorial disease or a sporadic disease on causative genes, and the multifactorial disease or the sporadic disease on related genes, and select a combination including a predetermined number of genes from among the data set based on the scale.
- According to one aspect of the present invention, it is possible to identify genes that can be used to diagnose a multifactorial disease or a sporadic disease.
-
-
FIG. 1 is a diagram illustrating an overview of an embodiment. -
FIG. 2 is a diagram showing an example of a configuration of an information processing device according to an embodiment. -
FIG. 3 is a flowchart showing a flow of a series of processes performed by a processor for identifying a combination of genes according to an embodiment. -
FIG. 4 is a diagram illustrating a method of calculating an HSIC score. -
FIG. 5 is a flowchart showing a flow of a series of processes performed by a processor for generating molecular biomarkers for digital diagnosis according to an embodiment. -
FIG. 6 is a flowchart showing a flow of a series of processes performed by a processor for determining ALS onset according to an embodiment. -
FIG. 7 is a diagram showing a list of ALS causative genes or related genes. -
FIG. 8 is a diagram showing calculation results of HSIC scores for combinations of three causative genes. -
FIG. 9 is a diagram showing evaluation results of ROC for combinations of causative genes. -
FIG. 10 is a diagram showing calculation results of HSIC scores for combinations of three related genes. -
FIG. 11 is a diagram showing evaluation results of ROC for combinations of related genes. -
FIG. 12 is a list of combinations of genes listed in descending order of HSIC scores. -
FIG. 13 is a list of combinations of genes listed in descending order of AUC determined by logistic regression. -
FIG. 14 is a diagram showing the top 50 genes with the highest appearance frequency. -
FIG. 15 is a diagram showing calculation results of HSIC scores when the number of genes combined is increased to 4. -
FIG. 16 is a diagram showing expression levels of PRKAR1A in respective healthy subjects and ALS patients. -
FIG. 17 is a diagram showing expression levels of QPCT in respective healthy subjects and ALS patients. -
FIG. 18 is a diagram showing expression levels of TMEM71 in respective healthy subjects and ALS patients. -
FIG. 19A is a diagram showing a feature space. -
FIG. 19B is a diagram showing a feature space. -
FIG. 20 is a diagram showing evaluation results of ROC for combinations of PRKAR1A, QPCT, and TMEM71. -
FIG. 21A is a diagram showing the correlation between expression amounts of PRKAR1A and survival periods. -
FIG. 21B is a diagram showing the correlation between expression amounts of QPCT and survival periods. -
FIG. 21C is a diagram showing the correlation between expression amounts of TMEM71 and survival periods. -
FIG. 22A is a diagram showing the correlation between expression amounts of PRKAR1A and ages of onset. -
FIG. 22B is a diagram showing correlation between expression amounts of QPCT and ages of onset. -
FIG. 22C is a diagram showing the correlation between expression amounts of TMEM71 and ages of onset. -
FIG. 23A is a diagram showing the correlation between expression amounts of PRKAR1A and a bulbar palsy type and a systemic type. -
FIG. 23B is a diagram showing the correlation between expression amounts of QPCT and a bulbar palsy type and a systemic type. -
FIG. 23C is a diagram showing the correlation between expression amounts of TMEM71 and a bulbar palsy type and a systemic type. -
FIG. 24A is a diagram comparing expression amounts of PRKAR1A in healthy subjects and expression amounts of PRKAR1A in ALS patients. -
FIG. 24B is a diagram comparing expression amounts of QPCT in healthy subjects and expression amounts of QPCT in ALS patients. -
FIG. 24C is a diagram comparing expression amounts of TMEM71 in healthy subjects and expression amounts of TMEM71 in ALS patients. -
FIG. 25 is a diagram showing evaluation results of ROC for combinations of PRKAR1A, QPCT, and TMEM71 extracted from a small number of examples. -
FIG. 26 shows an image of iPS cells and a captured image of motor nerve cells obtained from the iPS cells. -
FIG. 27A is a diagram comparing expression amounts of PRKAR1A between motor nerve cells of healthy subjects and motor nerve cells of ALS patients. -
FIG. 27B is a diagram comparing expression amounts of QPCT between motor nerve cells of healthy subjects and motor nerve cells of ALS patients. -
FIG. 27C is a diagram comparing gene expression amounts of TMEM71 between motor nerve cells of healthy subjects and motor nerve cells of ALS patients. -
FIG. 28 is a diagram showing evaluation results of ROC for combinations of PRKAR1A, QPCT, and TMEM71 extracted from motor nerve cells. -
FIG. 29 is a diagram showing an example of relative expression amounts of TDP-43 for respective genes PRKAR1A, QPCT, and TMEM71. -
FIG. 30A is a graph showing expression amounts of PRKAR1A extracted from respective healthy subjects and ALS patients. -
FIG. 30B is a graph showing expression amounts of QPCT extracted from respective healthy subjects and ALS patients. -
FIG. 30C is a graph showing expression amounts of TMEM71 extracted from respective healthy subjects and ALS patients. -
FIG. 31A is a graph showing expression amounts of SPG11 extracted from ALS causative genes and ALS related genes. -
FIG. 31B is a graph showing expression amounts of CHMP2B extracted from ALS causative genes and ALS related genes. -
FIG. 31C is a graph showing expression amounts of CSNK1G3 extracted from ALS causative genes and ALS related genes. -
FIG. 31D is a graph showing expression amounts of DYNC1H1 extracted from ALS causative genes and ALS related genes. - Hereinafter, an information processing device, an information processing method, and a program according to embodiments will be described with reference to the drawings.
-
FIG. 1 is a diagram illustrating an overview of the present embodiment. As shown inFIG. 1 , in the present embodiment, expression amounts of genes in peripheral blood mononuclear cells (PBMCs) of respective healthy subjects and patients with a multifactorial disease or a sporadic disease are analyzed, and a high-dimensional nonlinear model is used to select gene combinations for classifying healthy subjects and patients with a multifactorial disease or a sporadic disease based on the genes expression amounts. Multifactorial diseases or sporadic diseases include, but are not limited to, for example, ALS, and include Alzheimer's disease and Parkinson's disease. Preferably, sporadic ALS may be exemplified. Hereinafter, as an example, a multifactorial disease or a sporadic disease will be described as "sporadic ALS." - Here, a "multifactorial disease" is defined as a disease that is considered to develop due to the interaction between genetic factors and environmental factors, and a "sporadic disease" is defined as a disease with no recognized family history. However, there are so many cases in which the same disease corresponds to both a "multifactorial disease" and a "sporadic disease" that the "multifactorial disease" and the "sporadic disease" are used almost interchangeably in the field. "Sporadic ALS" is also a multifactorial disease.
-
FIG. 2 is a diagram showing an example of a configuration of aninformation processing device 100 according to an embodiment. As shown, theinformation processing device 100 includes, for example, acommunication interface 110, aninput interface 120, anoutput interface 130, aprocessor 140, and astorage 150. - The
communication interface 110 communicates with an external device via a network, for example, a wide area network (WAN) or a local area network (LAN). For example, thecommunication interface 110 includes a network interface card (NIC), a wireless communication module and the like. The external device may be, for example, a personal computer or a server installed in facilities where research or drug discovery development is performed (for example, research institutes, universities, and companies). - The
input interface 120 receives various input operations from a user, and outputs electrical signals corresponding to the received input operations to theprocessor 140. For example, theinput interface 120 is a mouse, a keyboard, a touch panel, a drag ball, a switch, a button or the like. - The
output interface 130 is, for example, a display or a speaker. The display may be, for example, a liquid crystal display (LCD) or an organic electro luminescence (EL) display. The display may be a touch panel formed integrally with theinput interface 120. - The
processor 140 is realized by, for example, a processor such as a central processing unit (CPU) or a graphics processing unit (GPU) executing a program stored in thestorage 150. Some or all of the functions of theprocessor 140 may be realized by hardware such as a large scale integration (LSI), an application specific integrated circuit (ASIC), or a field-programmable gate array (FPGA), or may be realized in cooperation of software and hardware. Respective functions of theprocessor 140 will be described below. - The
storage 150 is realized by, for example, a hard disc drive (HDD), a flash memory, an electrically erasable programmable read only memory (EEPROM), a read only memory (ROM), or a random access memory (RAM). Thestorage 150 stores various programs such as a firmware and application programs. -
FIG. 3 is a flowchart showing a flow of a series of processes performed by theprocessor 140 for identifying a combination of genes according to an embodiment. - First, the
processor 140 selects combinations including a predetermined number of genes from among the ALS causative gene group (Step S100). As ALS causative genes, for example, 33 genes including SOD1, ALS2, ALS3, and SETX are known (refer toFIG. 7 below for details). Theprocessor 140 selects combinations including a predetermined number of genes from among 33 causative genes. The predetermined number is preferably 3, but the number is not limited thereto and it may be, for example, 2 or 4 or more. Hereinafter, as an example, a case in which the predetermined number is "3" will be described. For example, when any three genes are selected from among 33 causative genes, theprocessor 140 may select 5,456 combinations. - Next, the
processor 140 calculates a scale of dependence (or independence) between the causative genes combined in S100 (Step S102). - For gene expression analysis, linear models such as linear logistic regression and Hotelling's t2 test are generally used. However, life phenomena are considered as nonlinear science, and the pathogenesis of diseases cannot be explained by a single factor. Therefore, in the present embodiment, gene expression is analyzed using a nonlinear model.
- For example, the
processor 140 calculates an HSIC score as a dependence scale of a combination of causative genes using a Hilbert-Schmidt independence criterion (HSIC) which is a type of machine learning and with which a nonlinear structure can be detected in high-dimensional data. -
FIG. 4 is a diagram illustrating a method of calculating an HSIC score. As shown, theprocessor 140 distributes combinations of ALS causative genes (vector data representing respective three causative genes) in a (reproducing kernel) Hilbert space (a feature space in the drawing), and calculates the HSIC score between causative genes on the Hilbert space. For example, theprocessor 140 calculates HSIC scores for all 5,456 combinations. - Next, the
processor 140 selects combinations including a predetermined number of genes from among the ALS related gene group (Step S104). As the ALS related genes, for example, in addition to the above causative genes, additionally, 126 genes such as APEX1, APOE, AR, and CCS are known (refer toFIG. 7 below for details). Theprocessor 140 selects combinations including a predetermined number of genes from among 126 related genes. As described above, the predetermined number is preferably 3, but the number is not limited thereto, and may be, for example, 2 or 4 or more. For example, when any three genes are selected from among 126 related genes, theprocessor 140 may select 325,500 combinations. - Next, the
processor 140 calculates a scale of dependence (or independence) between the related genes combined in S104 (Step S 106). Theprocessor 140 calculates HSIC scores for all 325,500 combinations as in the case of the causative genes. - Next, the
processor 140 selects a gene combination with the highest HSIC score from among the gene combinations for which the HSIC score is calculated (Step S108). - For example, in order to eliminate the influence of multicollinearity, the
processor 140 performs linear regression analysis such as logistic regression, and selects or extracts a specific combination including genes with a high appearance frequency (number of appearances) from a set of a plurality of combinations for which the HSIC score is calculated (hereinafter referred to as a combination population). For example, theprocessor 140 may select or extract a combination including genes whose appearance frequency is equal to or more than a threshold value as a specific combination (in other words, a combination to be excluded). The threshold value is, for example, 10, but the value is not limited thereto, and any other value may be used. - The
processor 140 excludes the specific combination including genes with a high appearance frequency from the combination population. Theprocessor 140 selects the gene combination with the highest HSIC score from among the combination population from which the specific combination is excluded. As will be described in examples below, as the gene combination with the highest HSIC score, a combination of PRKAR1A, QPCT, and TMEM71 is selected from among the combinations of ALS causative genes or related genes. Accordingly, a series of processes related to identification of gene combinations are completed. -
FIG. 5 is a flowchart showing a flow of a series of processes performed by theprocessor 140 for generating molecular biomarkers for digital diagnosis according to an embodiment. - First, the
processor 140 distributes, based on expression amounts of PRKAR1A, QPCT, and TMEM71 of a plurality of respective healthy subjects (hereinafter referred to as a healthy subject group), gene data of the healthy subjects in a three-dimensional feature space whose dimensions are expression amounts of these three genes (Step S200). For example, the gene data of the healthy subjects distributed in the feature space may be represented as a three-dimensional vector (e1, e2, e3) including the expression amount of PRKAR1A as a first element e1, the expression amount of QPCT as a second element e2, and the expression amount of TMEM71 as a third element e3. - Next, the
processor 140 distributes, based on expression amounts of PRKAR1A, QPCT, and TMEM71 of a plurality of respective ALS patients (hereinafter referred to as an ALS patient group), gene data of the ALS patients in a three-dimensional feature space whose dimensions are expression amounts of these three genes (Step S202). The gene data of the ALS patients distributed in the feature space may be represented as a three-dimensional vector (e1, e2, e3) like the gene data of healthy subjects. - Next, the
processor 140 clusters the gene data of healthy subjects and the gene data of ALS patients in the three-dimensional feature space (Step S204). For example, as shown inFIG. 19A and FIG. 19B in examples to be described below, in a three-dimensional feature space whose dimensions are the expression amount of RKAR1A, the expression amount of QPCT, and the expression amount of TMEM71, theprocessor 140 classifies the gene data of healthy subjects (Health Control in the drawing) and the gene data of ALS patients (ALS in the drawing) into clusters. - Next, the
processor 140 stores clusters of gene data of healthy subjects and clusters of gene data of ALS patients formed in the feature space as molecular biomarkers for digital diagnosis in the storage 150 (Step S206). Accordingly, a series of processes related to generation of molecular biomarkers for digital diagnosis are completed. -
FIG. 6 is a flowchart showing a flow of a series of processes performed by theprocessor 140 for determining ALS onset according to an embodiment. - First, the
processor 140 acquires gene data of a subject for diagnosis of ALS (Step S300). The gene data of the subject may be represented as a three-dimensional vector (e1, e2, e3) in the same manner as above. - Next, the
processor 140 distributes the gene data of the subject in a feature space in which clusters (clusters of healthy subjects and clusters of ALS patients) are formed as molecular biomarkers (Step S302). - Next, the
processor 140 calculates, on the feature space, a distance D1 between the gene data of the subject and the cluster of the healthy subjects and calculates a distance D2 between the gene data of the subject and the cluster of ALS patients (Step S304). - Next, the
processor 140 determines whether the subject will develop ALS at some point in the future or whether the subject has already developed ALS at the present time based on the respective distance of two clusters (Step S306). - For example, when the distance D2 to the cluster of ALS patients is shorter than the distance D1 to the cluster of healthy subjects (D1>D2), that is, when the gene data of the subject is closer to the cluster of ALS patients than the cluster of healthy subjects, the
processor 140 may determine that the subject will develop ALS at some point in the future or the subject had already developed ALS at the present time. - On the other hand, when the distance D2 to the cluster of ALS patients is longer than the distance D1 to the cluster of healthy subjects (D1<D2), that is, when the gene data of the subject is closer to the cluster of healthy subjects than the cluster of ALS patients, the
processor 140 may determine that the subject will not develop ALS at some point in the future and the subject has not developed ALS at the present time. - Next, the
processor 140 outputs the determination result regarding whether the subject has developed ALS (Step S308). - For example, the
processor 140 may transmit the determination result to an external device via thecommunication interface 110 or may output the determination result via the output interface 130 (for example, a display). Accordingly, a series of processes related to the determination of ALS onset are completed. - According to the embodiment described above, the
information processing device 100 calculates, for combinations of ALS causative genes or related genes, a scale (for example, HSIC score) of dependence between the genes included in the combinations, and selects a combination with the highest scale from among the plurality of combinations (that is, from among the combination population) for which the scale is calculated. Accordingly, it is possible to identify genes that can be used to diagnose ALS. - In addition, according to the above embodiment, the
information processing device 100 distributes the gene data of healthy subjects in the feature space based on expression amounts of the genes derived from the healthy subjects (genes included in the above combination with the highest scale) and additionally, distributes the gene data of ALS patients in the same feature space based on expression amounts of the genes derived from the ALS patients (genes included in the above combination with the highest scale). Then, theinformation processing device 100 clusters the gene data of healthy subjects and the gene data of ALS patients on the feature space. Accordingly, it is possible to generate molecular biomarkers for digital diagnosis on the feature space. - In addition, according to the above embodiment, the
information processing device 100 acquires gene data of a subject for diagnosis of ALS and distributes the gene data of the subject in the feature space in which the clusters of healthy subjects and ALS patients are formed. Theinformation processing device 100 calculates the distance between each cluster and the gene data of the subject on the feature space, and determines, based on the distance, whether the subject will develop ALS at some point in the future or whether the subject has already developed ALS at the present time. Accordingly, it is possible to accurately determine whether ALS has developed. - While forms for implementing the present invention have been described above with reference to embodiments, the present invention is not limited to limited to the embodiments at all, and various modifications and substitutions can be made without departing from the spirit and scope of the present invention.
- The above embodiments can be expressed as follows.
- An information processing device, including
a processor configured to calculate, for combinations of genes included in a gene data set, a scale of dependence of a multifactorial disease or a sporadic disease on causative genes, and the multifactorial disease or the sporadic disease on related genes, and select a combination including a predetermined number of genes from among the data set based on the scale. - The information processing device according to
Appendix 2, - wherein the processor distributes, based on an expression amount of a first gene which is a gene derived from a healthy subject, data of the first gene on a certain feature space,
- distributes, based on an expression amount of a second gene which is a gene derived from a patient with the multifactorial disease or the sporadic disease, data of the second gene on the feature space,
- clusters, based on the expression amount of the first gene, the data of the first gene on the feature space, and
- clusters, based on the expression amount of the second gene, the data of the second gene on the feature space.
- The information processing device according to
Appendix 2, - wherein the processor distributes, in the feature space in which the clusters of the healthy subject and the patient are formed, data of a third gene which is a gene derived from a subject for diagnosis of the multifactorial disease or the sporadic disease,
- calculates a distance between the data of the third gene and the cluster on the feature space, and
- based on the distance, determines whether the subject will develop the multifactorial disease or the sporadic disease, or determines whether the subject has developed the multifactorial disease or the sporadic disease.
- The information processing device according to
Appendix 1 of 2, - wherein the multifactorial disease or the sporadic disease includes amyotrophic lateral sclerosis,
- wherein the predetermined number is 3, and
- wherein the combination including the predetermined number of genes includes at least PRKAR1A, QPCT, and TMEM71.
- The information processing device according to
Appendix - wherein the processor
- performs linear regression analysis and excludes a specific combination including genes whose appearance frequency is equal to or more than a threshold value from a population which is a set of the gene combinations for which the scale is calculated, and
- selects the gene combination with the highest scale from the population from which the specific combination is excluded.
- The information processing device according to
Appendix 1 of 2, - wherein the processor
- distributes the data set on a Hilbert space,
- for the gene combinations included in the data set distributed on the Hilbert space, calculates a Hilbert-Schmidt dependence scale as the scale, and
- selects the combination with the highest Hilbert-Schmidt dependence scale from among the plurality of combinations for which the Hilbert-Schmidt dependence scale is calculated.
- An information processing method using a computer, including:
- calculating, for combinations of genes included in a gene data set, a scale of dependence of a multifactorial disease or a sporadic disease on causative genes, and the multifactorial disease or the sporadic disease on related genes; and
- selecting a combination including a predetermined number of genes from among the data set based on the scale.
- The information processing method according to
Appendix 7, further including: - distributing, based on an expression amount of a first gene which is a gene derived from a healthy subject, data of the first gene on a certain feature space;
- distributing, based on an expression amount of a second gene which is a gene derived from a patient with the multifactorial disease or the sporadic disease, data of the second gene on the feature space;
- clustering, based on the expression amount of the first gene, the data of the first gene on the feature space; and
- clustering, based on the expression amount of the second gene, the data of the second gene on the feature space.
- The information processing method according to
Appendix 8, further including: - distributing, in the feature space in which the clusters of the healthy subject and the patient are formed, data of a third gene which is a gene derived from a subject for diagnosis of the multifactorial disease or the sporadic disease;
- calculating a distance between the data of the third gene and the cluster on the feature space; and
- based on the distance, determining whether the subject will develop the multifactorial disease or the sporadic disease, or determining whether the subject has developed the multifactorial disease or the sporadic disease.
- The information processing method according to
Appendix - wherein the multifactorial disease or the sporadic disease includes amyotrophic lateral sclerosis,
- wherein the predetermined number is 3, and
- wherein the combination including the predetermined number of genes includes at least PRKAR1A, QPCT, and TMEM71.
- The information processing method according to
Appendix - performing linear regression analysis and excluding a specific combination including genes whose appearance frequency is equal to or more than a threshold value from a population which is a set of the gene combinations for which the scale is calculated; and
- selecting the gene combination with the highest scale from the population from which the specific combination is excluded.
- A program causing a computer to execute:
- calculating, for combinations of genes included in a gene data set, a scale of dependence of a multifactorial disease or a sporadic disease on causative genes, and the multifactorial disease or the sporadic disease on related genes; and
- selecting a combination including a predetermined number of genes from among the data set based on the scale.
- The program according to
Appendix 12, further including: - distributing, based on an expression amount of a first gene which is a gene derived from a healthy subject, data of the first gene on a certain feature space;
- distributing, based on an expression amount of a second gene which is a gene derived from a patient with the multifactorial disease or the sporadic disease, data of the second gene on the feature space;
- clustering, based on the expression amount of the first gene, the data of the first gene on the feature space; and
- clustering, based on the expression amount of the second gene, the data of the second gene on the feature space.
- The program according to
Appendix 13, further including: - distributing, in the feature space in which the clusters of the healthy subject and the patient are formed, data of a third gene which is a gene derived from a subject for diagnosis of the multifactorial disease or the sporadic disease;
- calculating a distance between the data of the third gene and the cluster on the feature space; and
- based on the distance, determining whether the subject will develop the multifactorial disease or the sporadic disease, or determining whether the subject has developed the multifactorial disease or the sporadic disease.
- The program according to
Appendix - wherein the multifactorial disease or the sporadic disease includes amyotrophic lateral sclerosis,
- wherein the predetermined number is 3, and
- wherein the combination including the predetermined number of genes includes at least PRKAR 1A, QPCT, and TMEM71.
- The program according to
Appendix - performing linear regression analysis and excluding a specific combination including genes whose appearance frequency is equal to or more than a threshold value from a population which is a set of the gene combinations for which the scale is calculated; and
- selecting the gene combination with the highest scale from the population from which the specific combination is excluded.
- A computer-readable storage medium in which the program according to
Appendix - Gene expression data (GSE112676, 233 ALS and 508 CTL) was used for HSIC analysis. Gene expression signals were normalized by downloading raw expression intensities and detected p-values (GSE112676_HT12_V3_preQC_nonnormalized.txt) and using R limma package (v3. 32.10) function (background Correct and normalize Between Arrays). In order to remove a batch effect, the ComBat algorithm implemented in the R sva package (v3. 35.2) was used. One sample (GSM3077426) with an abnormal value even after batch effect correction was excluded from further analysis. For the above HSIC prediction in
FIG. 1 , ALS related genes in ALS online database (ALSoD, https://alsod.ac.uk/) were used. Unbiased HSIC prediction was performed using the top 1,000 variable genes among the detectably expressed genes of 20% or more of samples. - Pluripotent stem cells were prepared. Examples of pluripotent stem cells included embryonic stem cells (ES cells), induced pluripotent stem cells (iPS cells), embryonic stem (ntES) cells derived from cloned embryos obtained by nuclear transplantation, sperm stem cells (GS cells), and embryonic germ cells (EG cells). Preferable pluripotent stem cells were ES cells, iPS cells or ntES cells. More preferable pluripotent stem cells were human pluripotent stem cells, and human ES cells and human iPS cells were particularly preferable. In addition, the cells that could be used in the present invention were not only pluripotent stem cells but also cell groups induced by socalled "direct reprogramming," which were induced to directly differentiate into desired cells without passing through pluripotent stem cells. In this experiment, human iPS cells were used. Hereinafter, unless otherwise specified, iPS cells were human iPS cells.
- iPS cells were prepared from fibroblasts or PBMCs from healthy subjects and sporadic ALS patients using OCT3/4, Sox2, Klf4, L-Myc, Lin28 and dominant negative p53 episomal vectors, or OCT3/4, Sox2, Klf4, L-Myc, Lin28 and shRNA for p53. The cells were cultured in a feeder-free and xeno-free culture system using StemFit (Ajinomoto) to which penicillin/streptomycin were added.
- Motor neurons were differentiated from iPS cells. Specifically, the iPS cells were dissociated into single cells, and rapidly reaggregated in a low-cell adhesive U-shaped 96-well plate (Lipidule-Coated Plate A-U96, NOF Corporation, Tokyo, Japan).
- Aggregates were treated using 5% KSR (Invitrogen, Waltham, MA), minimum essential medium-non-essential amino acid (Invitrogen), L-glutamine (Sigma-Aldrich, St. Louis, MO), 2-mercaptoethanol (Wako, Osaka, Japan), 2 µM dorsomorphin (Sigma-Aldrich), 10 µM SB431542 (Cayman, Ann Arbor, MI), 3 µM CHIR99021 (Cayman), and 12.5 ng/mL fibroblast growth factor (Wako) in a nerve induction stage for 11 days.
- On the 4th day, 100 nM retinoic acid (Sigma-Aldrich) and 500 nM Smoothened ligand (Enzo Life Sciences, Farmingdale, NY) were added. After patterning with a neurobase medium to which B27 Supplement (Thermo Fisher Scientific), 100 nM retinoic acid, 500 nM Smoothened ligand, and 10 µM DAPT (Selleck, Houston, TX) were added, on the 16th day, aggregates were separated using Accumax (Innovative Cell Technologies, San Diego, CA) and dissociated into single cells, and adhered to a dish coated with matrigel (BD Biosciences, Franklin Lakes, NJ).
- The adhered cells were cultured in a neural base medium containing 10 ng/ml brain-derived neurotrophic factor (R&D Systems, Minneapolis, MN), 10 ng/ml glial cell line-derived neurotrophic factor (R&D Systems), and 10 ng/ml neurotrophin-3 (R&D Systems) for 8 days. On the 21st day, the cells were dissociated into single cells using Accumax and seeded in an iMatrix-coated 24-well plate (Corning) at 2×10⁵ cells/well.
- Total RNA of the cultured cells was extracted using RNeasy Plus Mini kit (QIAGEN). 1 µg of RNA was reversely transcribed using ReverTra Ace (TOYOBO, Osaka, Japan). Quantitative PCR analysis was performed using SYBR Premix Ex TaqII (TAKARA) according to a reverse transcription reaction using StepOnePlus (Thermo Fisher Scientific).
- The results were analyzed using Student's t-test, and the statistical significance was determined. A difference of p<0.05 was considered significant. The analysis was performed using GraphPad Prism software version 8.0 for Windows (GraphPad Software, SanDiego, CA).
- Gene combinations for classifying healthy subjects and ALS patients were selected by analyzing gene expression amounts of peripheral blood mononuclear cells (PBMCs). As described in the above embodiment, the gene expression amounts were analyzed using a nonlinear model, and HSIC was used for the analysis.
- Gene combinations with differences between healthy subjects and ALS patients had a high HSIC score, and on the other hand, gene combinations with no differences had an HSIC score close to 0. When a combination with a high HSIC score was identified, genes for classifying healthy subjects and ALS patients were extracted.
- First, the validity of the method described in the present embodiment was verified using a gene group known to be associated with ALS.
FIG. 7 is a diagram showing a list of ALS causative genes or related genes. For example, from the genes shown inFIG. 7 , 33 causative genes known as ALS causative gene were selected, and additionally, combinations of three genes were selected from among the 33 causative genes. - The HSIC score was calculated as a scale for classifying the healthy subject group and the ALS patient group based on expression amounts of the three genes.
FIG. 8 is a diagram showing calculation results of HSIC scores for combinations of three causative genes.FIG. 8 shows only the top 15 combinations with the highest HSIC score. The causative gene combination with the highest HSIC score included SPG11, CHMP2B, and VCP (an HSIC score of 0.0988). - Among all combinations (5,456 combinations) of 33 ALS causative genes, the causative gene combination with the highest HSIC score included SPG11, CHMP2B, and VCP (an HSIC score of 0.0988). The combination of these three causative genes was evaluated using Receiver Operating Characteristics (ROC).
FIG. 9 is a diagram showing evaluation results of ROC for combinations of causative genes. As shown inFIG. 9 , the combination ofSPG1 1, CHMP2B, and VCP with the highest HSIC score had an AUC (area under the curve) of 0.75 in ROC. Therefore, in the result, there was a statistically significant difference in AUC. - Next, a combination of three genes was similarly selected from among 126 ALS related genes (refer to
FIG. 7 ). In the healthy subject group, the HSIC score of the combination of three related genes was calculated, and in the ALS patient group, the HSIC score of the combination of three related genes was calculated.FIG. 10 is a diagram showing calculation results of HSIC scores for combinations of three related genes. LikeFIG. 8 ,FIG. 10 shows only the top 15 combinations with the highest HSIC score. The related gene combination with the highest HSIC score included CSNK1G3, CHMP2B, and DYNC1H1 (an HSIC score of 0.11365). - Among all combinations (325,500 combinations) of 126 related genes, the related gene combination with the highest HSIC score included CSNK1G3, CHMP2B, and DYNC1H1 (an HSIC score of 0.11365). The combination of these three related genes was evaluated using ROC.
FIG. 11 is a diagram showing evaluation results of ROC for combinations of related genes. As shown inFIG. 11 , the combination of CSNK1G3, CHMP2B, and DYNC1H1 with the highest HSIC score had an AUC (AUC for classifying the healthy subject group and the ALS patient group) of 0.75 in ROC. Therefore, in the result, there was a statistically significant difference in AUC. - According to these results, the validity of the method of the present embodiment for finding a gene set for classifying the healthy subject group and the ALS patient group was demonstrated.
- In order to examine unknown factors of ALS, the HSIC scores of gene combinations among genes (unrelated genes) not known to be associated with ALS were calculated. In order to avoid multicollinearity, which causes a problem in the multivariate regression model, analysis was performed using linear regression, and genes that repeatedly appeared (genes with a high appearance frequency) in the list of genes extracted through the analysis were excluded from the ALS causative genes or related genes.
- On the other hand, combinations of genes that distinguish between healthy subjects and ALS patients were listed up using logistic regression, which is a linear regression model.
FIG. 12 is a list of combinations of genes listed in descending order of HSIC scores. - When frequently appearing genes were examined using logistic regression, it was found that there was a bias in the gene appearance frequency.
FIG. 13 is a list of combinations of genes listed in descending order of AUC determined by logistic regression.FIG. 14 is a diagram showing the top 50 genes with the highest appearance frequency. As shown inFIG. 14 , TPT1 appeared 25 times, ATP5I appeared 39 times, CAPZA2 appeared 17 times, and RPL22 appeared 11 times. - In order to eliminate the influence of multicollinearity, among the gene combinations with a high HSIC score, genes that repeatedly appeared 10 times or more in the linear regression were excluded. In the results of
FIG. 14 , since TPT1, ATP5I, CAPZA2, and RPL22 all appeared 10 times or more, when combinations including any one of these four genes were excluded, the gene combination with the highest HSIC score included PRKAR1A, QPCT, and TMEM71 (the 9th combination from the top inFIG. 12 ). - In addition, it was examined whether the ALS classification accuracy increased when the number of genes in the combination was increased to 4 (the predetermined number was changed from 3 to 4).
FIG. 15 is a diagram showing calculation results of HSIC scores when the number of genes combined is increased to 4. When four genes were combined, the HSIC score did not change significantly compared to when three genes were combined. Therefore, a combination of three genes was selected. - Next, expression levels of PRKAR1A, QPCT, and TMEM71 in PBMCs of healthy subjects and ALS patients were compared.
FIG. 16 is a diagram showing expression levels of PRKAR1A in respective healthy subjects and ALS patients.FIG. 17 is a diagram showing expression levels of QPCT in respective healthy subjects and ALS patients.FIG. 18 is a diagram showing expression levels of TMEM71 in respective healthy subjects and ALS patients. The expression levels of all three genes were higher in the ALS patients than in the healthy subjects. - In addition, in a three-dimensional feature space whose dimensions were expression amounts of respective PRKAR1A, QPCT, and TMEM71, the genes of the healthy subjects and the genes of the ALS patients were distributed separately.
FIG. 19A and FIG. 19B are diagrams showing a feature space. As shown inFIG. 19A and FIG. 19B , on the three-dimensional feature space, the genes of the healthy subjects were classified into the same cluster, and the genes of the ALS patients were classified into the same cluster. - The combination of PRKAR1A, QPCT, and TMEM71 was evaluated using ROC.
FIG. 20 is a diagram showing evaluation results of ROC for combinations of PRKAR1A, QPCT, and TMEM71. As shown inFIG. 20 , the combination of PRKAR1A, QPCT, and TMEM71 had an AUC (AUC for classifying the healthy subject group and the ALS patient group) of 0.83 in ROC. Therefore, in the result, there was a statistically significant difference in AUC. - In addition, the relationship between the expression levels of genes PRKAR1A, QPCT, and TMEM71 and clinical information on ALS obtained from published data was examined.
FIG. 21A is a diagram showing the correlation between expression amounts of PRKAR1A and survival periods.FIG. 21B is a diagram showing the correlation between expression amounts of QPCT and survival periods.FIG. 21C is a diagram showing the correlation between expression amounts of TMEM71 and survival periods.FIG. 22A is a diagram showing the correlation between expression amounts of PRKAR1A and ages of onset.FIG. 22B is a diagram showing correlation between expression amounts of QPCT and ages of onset.FIG. 22C is a diagram showing the correlation between expression amounts of TMEM71 and ages of onset.FIG. 23A is a diagram showing the correlation between expression amounts of PRKAR1A and a bulbar palsy type and a systemic type.FIG. 23B is a diagram showing the correlation between expression amounts of QPCT and a bulbar palsy type and a systemic type.FIG. 23C is a diagram showing the correlation between expression amounts of TMEM71 and a bulbar palsy type and a systemic type. - As shown in
FIGS. 21A, 21B, and 21C , the gene expression amounts of PRKAR1A and TMEM71 did not have a significant correlation in QPCT, but they had a correlation in the survival period. As shown inFIGS. 22A, 22B, and 22C , there was no correlation between the age of onset and the expression amounts of the three genes. As shown inFIGS. 23A, 23B , and23C , there was no difference in QPCT, but systemic type ALS patients showed significantly higher expression amounts of PRKAR1A and TMEM71 than bulbar palsy type ALS patients. - In addition, the expression amounts of the three genes PRKAR1A, QPCT, and TMEM71 were confirmed using PBMCs of healthy subjects and PBMCs of ALS patients that we had. PBMCs were collected from 12 ALS patients and 12 healthy subjects, and RNA was extracted.
FIG. 24A is a diagram comparing expression amounts of PRKAR1A in healthy subjects and expression amounts of PRKAR1A in ALS patients.FIG. 24B is a diagram comparing expression amounts of QPCT in healthy subjects and expression amounts of QPCT in ALS patients.FIG. 24C is a diagram comparing expression amounts of TMEM71 in healthy subjects and expression amounts of TMEM71 in ALS patients. As shown inFIGS. 24A ,24B, and 24C , it was observed that the expression amounts of PRKAR1A and QPCT were significantly higher in the ALS patients than in the healthy subjects, and the expression amount of TMEM71 tended to be higher in the ALS patients. -
FIG. 25 is a diagram showing evaluation results of ROC for combinations of PRKAR1A, QPCT, and TMEM71 extracted from a small number of examples. As shown inFIG. 25 , when the expression amounts of the three genes PRKAR1A, QPCT, and TMEM71 were combined, even with a small number of examples of 12 ALS patients and 12 healthy subjects, the AUC for classifying the healthy subjects and the ALS patients was 0.85. Based on these results, it was confirmed that, when the expression amounts of the three genes in the PBMCs were examined, it was possible to distinguish the ALS patient group and the healthy subject group. - Expression of three genes in motor nerve cells obtained from iPS cells established from 26 healthy subjects and 18 ALS patients was examined.
FIG. 26 shows an image of iPS cells and a captured image of motor nerve cells obtained from the iPS cells.FIG. 27A is a diagram comparing expression amounts of PRKAR1A between motor nerve cells of healthy subjects and motor nerve cells of ALS patients.FIG. 27B is a diagram comparing expression amounts of QPCT between motor nerve cells of healthy subjects and motor nerve cells of ALS patients.FIG. 27C is a diagram comparing expression amounts of TMEM71 between motor nerve cells of healthy subjects and motor nerve cells of ALS patients.FIG. 28 is a diagram showing evaluation results of ROC for combinations of PRKAR1A, QPCT, and TMEM71 extracted from motor nerve cells. As shown inFIGS. 27A, 27B , and27C , there was no difference in the expression amount of each of genes PRKAR1A, QPCT, and TMEM71 between motor nerve cells of healthy subjects and motor nerve cells of ALS patients. As shown inFIG. 28 , when the expression amounts of the three genes were compared as a set, the AUC was 0.79 and it was possible to classify the healthy subjects and ALS patients. - In addition, since accumulation of TDP-43 was deeply involved in the pathogenesis of ALS, the relationship between the three genes and TDP-43 was examined.
FIG. 29 is a diagram showing an example of relative expression amounts of TDP-43 for respective genes PRKAR1A, QPCT, and TMEM71. As shown inFIG. 29 , when PRKAR1A, QPCT, and TMEM71 were knock-downed with siRNA, the expression amount of TDP-43 significantly increased in motor nerve cells derived from both healthy subjects and ALS patients. Based on these results, although the relationship of the gene group identified using the HSIC in the method of the present embodiment with the pathogenesis of ALS is still not known, a possibility of a new player in the pathogenesis of ALS was found according to this experiment. - The expression amounts of the three genes extracted from respective healthy subjects and ALS patients were shown in a graph.
FIG. 30A is a graph showing expression amounts of PRKAR1A extracted from respective healthy subjects and ALS patients.FIG. 30B is a graph showing expression amounts of QPCT extracted from respective healthy subjects and ALS patients.FIG. 30C is a graph showing expression amounts of TMEM71 extracted from respective healthy subjects and ALS patients. In the drawings, the vertical axis represents gene expression amount, and the horizontal axis represents case. - In each of PRKAR1A, QPCT, and TMEM71, the expression amount of ALS patients tended to be higher than that of healthy subjects, but there was a large variation between samples, and the expression amount of each gene alone could not be used to classify healthy subjects and ALS.
- On the other hand, as described in the above embodiment, when the expression amounts of these three genes PRKAR1A, QPCT, and TMEM71 were combined, it was possible to classify the healthy subjects and the ALS patients. Therefore, the usefulness of the combination of three genes extracted by the HSIC was demonstrated.
- Similarly, the expression amounts of genes extracted from ALS causative genes and ALS related genes were shown in a graph.
FIG. 31A is a graph showing expression amounts of SPG11 extracted from ALS causative genes and ALS related genes.FIG. 31B is a graph showing expression amounts of CHMP2B extracted from ALS causative genes and ALS related genes.FIG. 31C is a graph showing expression amounts of CSNK1G3 extracted from ALS causative genes and ALS related genes.FIG. 31D is a graph showing expression amounts of DYNC1H1 extracted from ALS causative genes and ALS related genes. In the drawings, the vertical axis represents gene expression amount, and the horizontal axis represents case. Regarding these genes SPG11, CHMP2B, CSNK1G3, and DYNC1H1, it was not possible to classify the healthy subjects and the ALS patients using each gene alone, and the usefulness of the method of separating healthy subjects and ALS patients using a combination of the three genes PRKAR1A, QPCT, and TMEM71 was demonstrated. - As described above, using a machine learning algorithm called HSIC, which is a high-dimensional nonlinear statistical model, blood molecular biomarkers necessary for digital diagnosis of ALS from actual data were discovered. The identified molecular biomarkers have not been receiving focus for ALS so far. However, it was found that, when expression of these genes was controlled with siRNA, the expression level of TDP-43, which is an important key molecule in ALS, changed, and a possibility of these markers being related to ALS was demonstrated.
- The HSIC was used to measure a statistical dependence between two random vectors, the two random vectors were converted into two reproducing kernel Hilbert spaces (RKHS), and the statistical dependence was measured using a Hilbert-Schmidt (HS) operator of these two RKHSs. ALS is a heterogeneous disease exhibiting nonlinear biological phenomena, and its pathogenesis cannot be explained by a single factor. Therefore, this model was applied, and a combination of genes for classifying ALS patients and healthy subjects was searched for using blood sample data. When a nonlinear model was used, a combination of novel genes, PRKAR1A, QPCT, and TMEM71, was successfully found.
- The PRKAR1A gene is a gene encoding a serine/threonine kinase, cAMP-dependent protein kinase type I-alpha regulatory subunit, which is a major mediator of cAMP signaling in mammals. Phosphorylation through the cAMP/PKA signal pathway was induced by various physiological ligands within cells, and critically involved in controlling of metabolism, cell proliferation, differentiation, and apoptosis. Loss of one or both allelic genes for this gene caused multiple sclerosis syndromes in humans and embryonic lethal defects in mice. Although the relationship between the PRKAR1A gene and ALS has not been clarified, it has been reported that the PKA activity increased in the spinal cord of ALS patients and the spinal cord of SOD1 mice, and in ALS, the cAMP/PKA synaptic repair promoted activity-dependent neuroprotection of motor neurons. Accordingly, when the expression of the PRKAR1A gene increased, an ALS prevention effect was expected. The Gene ID of the PRKAR1A gene, an example of NCBI Reference Sequence, and the address of the NCBI reference site are as follows.
-
- Gene ID: 5573
- NM_001276289.2, NM_212472.1
- https://www.ncbi.nlm.nih.gov/gene/5573
- The QPTC gene encodes glutaminyl-peptide cyclotransferase. It has been reported that the expression of glutaminyl cyclase increased in the peripheral blood of patients with Alzheimer's disease, and the glutaminyl cyclase inhibitor could be a measure for improving Alzheimer's disease. In addition, it has been reported that QPCT was identified as a therapeutic target for Huntington's disease, and polymorphisms of the QPCT gene were related to susceptibility to schizophrenia. Although the relationship with the pathogenesis of ALS was unclear, the increased QPCT gene expression could be related to a common pathway in neurodegeneration. The Gene ID of the QPTC gene, an example of NCBI Reference Sequence, and the address of the NCBI reference site are as follows.
-
- Gene ID: 25797
- NM_012413.4, NM_012413.3
- https://www.ncbi.nlm.nih.gov/gene/25797
- TMEM71 encodes transmembrane proteins, but its functions have not been clearly elucidated. Knock-out mice exhibited slight hypothyroidism, but no phenotype. The expression of TMEM71 increased in glioblastoma and was related with the immune response, and TMEM71 exhibited a high positive correlation with PD-1 and PD-L1. Knock-out mice exhibited only slight hypothyroidism, but no phenotype. The increased TMEM71 gene expression could be related to the immune response to ALS. The Gene ID of the TMEM71 gene, an example of NCBI Reference Sequence, and the address of the NCBI reference site are as follows.
-
- Gene ID: 137835
- NM_001145153.2, NM_144649.1
- https://www.ncbi.nlm.nih.gov/gene/137835
- The inventors found a combination of genes for classifying ALS using the nonlinear model HSIC and actual data. This method not only helps with identification of molecular biomarkers for digital diagnosis of ALS but may also lead to a completely new ALS onset mechanism beyond human idea-driven approaches. In addition, this method can be applied not only to ALS but also other multifactorial diseases or sporadic diseases.
-
- 100 Information processing device
- 110 Communication interface
- 120 Input interface
- 130 Output interface
- 140 Processor
- 150 Storage
Claims (15)
- An information processing device, comprising
a processor configured to calculate, for combinations of genes included in a gene data set, a scale of dependence of a multifactorial disease or a sporadic disease on causative genes, and the multifactorial disease or the sporadic disease on related genes, and select a combination including a predetermined number of genes from among the data set based on the scale. - The information processing device according to claim 1,wherein the processor distributes, based on an expression amount of a first gene which is a gene derived from a healthy subject, data of the first gene on a certain feature space,distributes, based on an expression amount of a second gene which is a gene derived from a patient with the multifactorial disease or the sporadic disease, data of the second gene on the feature space,clusters, based on the expression amount of the first gene, the data of the first gene on the feature space, andclusters, based on the expression amount of the second gene, the data of the second gene on the feature space.
- The information processing device according to claim 2,wherein the processor distributes, in the feature space in which the clusters of the healthy subject and the patient are formed, data of a third gene which is a gene derived from a subject for diagnosis of the multifactorial disease or the sporadic disease,calculates a distance between the data of the third gene and the cluster on the feature space, andbased on the distance, determines whether the subject will develop the multifactorial disease or the sporadic disease, or determines whether the subject has developed the multifactorial disease or the sporadic disease.
- The information processing device according to claim 1 or 2,wherein the multifactorial disease or the sporadic disease includes amyotrophic lateral sclerosis,wherein the predetermined number is 3, andwherein the combination including the predetermined number of genes includes at least PRKAR 1 A, QPCT, and TMEM71.
- The information processing device according to claim 1 or 2,wherein the processorperforms linear regression analysis and excludes a specific combination including genes whose appearance frequency is equal to or more than a threshold value from a population which is a set of the gene combinations for which the scale is calculated, andselects the gene combination with the highest scale from the population from which the specific combination is excluded.
- An information processing method using a computer, comprising:calculating, for combinations of genes included in a gene data set, a scale of dependence of a multifactorial disease or a sporadic disease on causative genes, and the multifactorial disease or the sporadic disease on related genes; andselecting a combination including a predetermined number of genes from among the data set based on the scale.
- The information processing method according to claim 6, further comprising:distributing, based on an expression amount of a first gene which is a gene derived from a healthy subject, data of the first gene on a certain feature space;distributing, based on an expression amount of a second gene which is a gene derived from a patient with the multifactorial disease or the sporadic disease, data of the second gene on the feature space;clustering, based on the expression amount of the first gene, the data of the first gene on the feature space; andclustering, based on the expression amount of the second gene, the data of the second gene on the feature space.
- The information processing method according to claim 7, further comprising:distributing, in the feature space in which the clusters of the healthy subject and the patient are formed, data of a third gene which is a gene derived from a subject for diagnosis of the multifactorial disease or the sporadic disease;calculating a distance between the data of the third gene and the cluster on the feature space; andbased on the distance, determining whether the subject will develop the multifactorial disease or the sporadic disease, or determining whether the subject has developed the multifactorial disease or the sporadic disease.
- The information processing method according to claim 7 or 8,wherein the multifactorial disease or the sporadic disease includes amyotrophic lateral sclerosis,wherein the predetermined number is 3, andwherein the combination including the predetermined number of genes includes at least PRKAR1A, QPCT, and TMEM71.
- The information processing method according to claim 7 or 8, further comprising:performing linear regression analysis and excluding a specific combination including genes whose appearance frequency is equal to or more than a threshold value from a population which is a set of the gene combinations for which the scale is calculated; andselecting the gene combination with the highest scale from the population from which the specific combination is excluded.
- A program causing a computer to execute:calculating, for combinations of genes included in a gene data set, a scale of dependence of a multifactorial disease or a sporadic disease on causative genes, and the multifactorial disease or the sporadic disease on related genes; andselecting a combination including a predetermined number of genes from among the data set based on the scale.
- The program according to claim 11, further comprising:distributing, based on an expression amount of a first gene which is a gene derived from a healthy subject, data of the first gene on a certain feature space;distributing, based on an expression amount of a second gene which is a gene derived from a patient with the multifactorial disease or the sporadic disease, data of the second gene on the feature space;clustering, based on the expression amount of the first gene, the data of the first gene on the feature space; andclustering, based on the expression amount of the second gene, the data of the second gene on the feature space.
- The program according to claim 12, further comprising:distributing, in the feature space in which the clusters of the healthy subject and the patient are formed, data of a third gene which is a gene derived from a subject for diagnosis of the multifactorial disease or the sporadic disease;calculating a distance between the data of the third gene and the cluster on the feature space; andbased on the distance, determining whether the subject will develop the multifactorial disease or the sporadic disease, or determining whether the subject has developed the multifactorial disease or the sporadic disease.
- The program according to claim 11 or 12,wherein the multifactorial disease or the sporadic disease includes amyotrophic lateral sclerosis,wherein the predetermined number is 3, andwherein the combination including the predetermined number of genes includes at least PRKAR1A, QPCT, and TMEM71.
- The program according to claim 11 or 12, further comprising:performing linear regression analysis and excluding a specific combination including genes whose appearance frequency is equal to or more than a threshold value from a population which is a set of the gene combinations for which the scale is calculated; andselecting the gene combination with the highest scale from the population from which the specific combination is excluded.
Applications Claiming Priority (2)
| Application Number | Priority Date | Filing Date | Title |
|---|---|---|---|
| US202163208509P | 2021-06-09 | 2021-06-09 | |
| PCT/JP2022/023287 WO2022260129A1 (en) | 2021-06-09 | 2022-06-09 | Information processing device, information processing method, and program |
Publications (1)
| Publication Number | Publication Date |
|---|---|
| EP4354446A1 true EP4354446A1 (en) | 2024-04-17 |
Family
ID=84424586
Family Applications (1)
| Application Number | Title | Priority Date | Filing Date |
|---|---|---|---|
| EP22820308.9A Pending EP4354446A1 (en) | 2021-06-09 | 2022-06-09 | Information processing device, information processing method, and program |
Country Status (4)
| Country | Link |
|---|---|
| EP (1) | EP4354446A1 (en) |
| JP (1) | JPWO2022260129A1 (en) |
| CN (1) | CN117425932A (en) |
| WO (1) | WO2022260129A1 (en) |
Family Cites Families (4)
| Publication number | Priority date | Publication date | Assignee | Title |
|---|---|---|---|---|
| JP2005218421A (en) * | 2004-02-03 | 2005-08-18 | Masahiro Kasahara | Method for producing contig from dna fragmented sequential data by total genom shot gun method and recording medium |
| AU2009291577A1 (en) * | 2008-09-12 | 2010-03-18 | Navigenics, Inc. | Methods and systems for incorporating multiple environmental and genetic risk factors |
| US8442924B2 (en) * | 2009-11-13 | 2013-05-14 | Beckman Coulter, Inc. | Systems and methods for detecting the presence of a biological status using clustering |
| JP6143233B2 (en) | 2015-08-05 | 2017-06-07 | 国立大学法人京都大学 | Method for examining motor neuron disease and method for screening therapeutic agent |
-
2022
- 2022-06-09 EP EP22820308.9A patent/EP4354446A1/en active Pending
- 2022-06-09 WO PCT/JP2022/023287 patent/WO2022260129A1/en active Application Filing
- 2022-06-09 JP JP2023527920A patent/JPWO2022260129A1/ja active Pending
- 2022-06-09 CN CN202280040883.1A patent/CN117425932A/en active Pending
Also Published As
| Publication number | Publication date |
|---|---|
| JPWO2022260129A1 (en) | 2022-12-15 |
| WO2022260129A1 (en) | 2022-12-15 |
| CN117425932A (en) | 2024-01-19 |
Similar Documents
| Publication | Publication Date | Title |
|---|---|---|
| Stubbs et al. | Multi-tissue DNA methylation age predictor in mouse | |
| Krumm et al. | A de novo convergence of autism genetics and molecular neuroscience | |
| Haydar et al. | Trisomy 21 and early brain development | |
| Vilardell et al. | Meta-analysis of heterogeneous Down Syndrome data reveals consistent genome-wide dosage effects related to neurological processes | |
| Simonson et al. | Genetic determinants of Tibetan high-altitude adaptation | |
| Helsmoortel et al. | A SWI/SNF-related autism syndrome caused by de novo mutations in ADNP | |
| Ehret | Genome-wide association studies: contribution of genomics to understanding blood pressure and essential hypertension | |
| Shao et al. | The roles of genes in the neuronal migration and neurite outgrowth network in developmental dyslexia: single-and multiple-risk genetic variants | |
| Ding et al. | Reconstructing differentiation networks and their regulation from time series single-cell expression data | |
| Sánchez-Morán et al. | Genetic association study of dyslexia and ADHD candidate genes in a Spanish cohort: Implications of comorbid samples | |
| Klein et al. | Uncovering the role of the methylome in dementia and neurodegeneration | |
| Zeng et al. | Edge biomarkers for classification and prediction of phenotypes | |
| Perzel Mandell et al. | Characterizing the dynamic and functional DNA methylation landscape in the developing human cortex | |
| Lim et al. | Orgo-Seq integrates single-cell and bulk transcriptomic data to identify cell type specific-driver genes associated with autism spectrum disorder | |
| Natri et al. | Cell type-specific and disease-associated eQTL in the human lung | |
| Bressan et al. | The Foundational Data Initiative for Parkinson Disease: Enabling efficient translation from genetic maps to mechanism | |
| Lin et al. | Predicting the risk genes of autism spectrum disorders | |
| Zreika et al. | Evidence for close molecular proximity between reverting and undifferentiated cells | |
| Pujol-Gualdo et al. | Integrating genomics and transcriptomics: Towards deciphering ADHD | |
| EP4354446A1 (en) | Information processing device, information processing method, and program | |
| Joshi et al. | The m6A-methylome in major depression: A bioinformatic analysis of publicly available datasets | |
| Volk et al. | Expression signature as a biomarker for prenatal diagnosis of trisomy 21 | |
| Pividori et al. | Projecting genetic associations through gene expression patterns highlights disease etiology and drug mechanisms | |
| Dai et al. | Core transcriptional networks in Williams syndrome: IGF1-PI3K-AKT-mTOR, MAPK and actin signaling at the synapse echo autism | |
| Bressan et al. | The Foundational data initiative for Parkinson’s disease (FOUNDIN-PD): enabling efficient translation from genetic maps to mechanism |
Legal Events
| Date | Code | Title | Description |
|---|---|---|---|
| STAA | Information on the status of an ep patent application or granted ep patent |
Free format text: STATUS: THE INTERNATIONAL PUBLICATION HAS BEEN MADE |
|
| PUAI | Public reference made under article 153(3) epc to a published international application that has entered the european phase |
Free format text: ORIGINAL CODE: 0009012 |
|
| STAA | Information on the status of an ep patent application or granted ep patent |
Free format text: STATUS: REQUEST FOR EXAMINATION WAS MADE |
|
| 17P | Request for examination filed |
Effective date: 20240104 |
|
| AK | Designated contracting states |
Kind code of ref document: A1 Designated state(s): AL AT BE BG CH CY CZ DE DK EE ES FI FR GB GR HR HU IE IS IT LI LT LU LV MC MK MT NL NO PL PT RO RS SE SI SK SM TR |