EP4345744A2 - Bildanalyseverfahren und -system - Google Patents
Bildanalyseverfahren und -system Download PDFInfo
- Publication number
- EP4345744A2 EP4345744A2 EP24150725.0A EP24150725A EP4345744A2 EP 4345744 A2 EP4345744 A2 EP 4345744A2 EP 24150725 A EP24150725 A EP 24150725A EP 4345744 A2 EP4345744 A2 EP 4345744A2
- Authority
- EP
- European Patent Office
- Prior art keywords
- features
- image
- machine learning
- trained
- disease
- Prior art date
- Legal status (The legal status is an assumption and is not a legal conclusion. Google has not performed a legal analysis and makes no representation as to the accuracy of the status listed.)
- Pending
Links
Images


Classifications
-
- G—PHYSICS
- G06—COMPUTING OR CALCULATING; COUNTING
- G06T—IMAGE DATA PROCESSING OR GENERATION, IN GENERAL
- G06T7/00—Image analysis
- G06T7/0002—Inspection of images, e.g. flaw detection
- G06T7/0012—Biomedical image inspection
-
- G—PHYSICS
- G06—COMPUTING OR CALCULATING; COUNTING
- G06F—ELECTRIC DIGITAL DATA PROCESSING
- G06F17/00—Digital computing or data processing equipment or methods, specially adapted for specific functions
- G06F17/10—Complex mathematical operations
- G06F17/18—Complex mathematical operations for evaluating statistical data, e.g. average values, frequency distributions, probability functions, regression analysis
-
- G—PHYSICS
- G06—COMPUTING OR CALCULATING; COUNTING
- G06F—ELECTRIC DIGITAL DATA PROCESSING
- G06F18/00—Pattern recognition
- G06F18/20—Analysing
- G06F18/24—Classification techniques
-
- G—PHYSICS
- G06—COMPUTING OR CALCULATING; COUNTING
- G06N—COMPUTING ARRANGEMENTS BASED ON SPECIFIC COMPUTATIONAL MODELS
- G06N20/00—Machine learning
-
- G—PHYSICS
- G06—COMPUTING OR CALCULATING; COUNTING
- G06N—COMPUTING ARRANGEMENTS BASED ON SPECIFIC COMPUTATIONAL MODELS
- G06N3/00—Computing arrangements based on biological models
- G06N3/02—Neural networks
- G06N3/04—Architecture, e.g. interconnection topology
- G06N3/0464—Convolutional networks [CNN, ConvNet]
-
- G—PHYSICS
- G06—COMPUTING OR CALCULATING; COUNTING
- G06N—COMPUTING ARRANGEMENTS BASED ON SPECIFIC COMPUTATIONAL MODELS
- G06N3/00—Computing arrangements based on biological models
- G06N3/02—Neural networks
- G06N3/04—Architecture, e.g. interconnection topology
- G06N3/047—Probabilistic or stochastic networks
-
- G—PHYSICS
- G06—COMPUTING OR CALCULATING; COUNTING
- G06N—COMPUTING ARRANGEMENTS BASED ON SPECIFIC COMPUTATIONAL MODELS
- G06N3/00—Computing arrangements based on biological models
- G06N3/02—Neural networks
- G06N3/08—Learning methods
- G06N3/09—Supervised learning
-
- G—PHYSICS
- G06—COMPUTING OR CALCULATING; COUNTING
- G06T—IMAGE DATA PROCESSING OR GENERATION, IN GENERAL
- G06T7/00—Image analysis
- G06T7/10—Segmentation; Edge detection
-
- G—PHYSICS
- G06—COMPUTING OR CALCULATING; COUNTING
- G06T—IMAGE DATA PROCESSING OR GENERATION, IN GENERAL
- G06T2207/00—Indexing scheme for image analysis or image enhancement
- G06T2207/10—Image acquisition modality
- G06T2207/10072—Tomographic images
- G06T2207/10081—Computed x-ray tomography [CT]
-
- G—PHYSICS
- G06—COMPUTING OR CALCULATING; COUNTING
- G06T—IMAGE DATA PROCESSING OR GENERATION, IN GENERAL
- G06T2207/00—Indexing scheme for image analysis or image enhancement
- G06T2207/20—Special algorithmic details
- G06T2207/20081—Training; Learning
-
- G—PHYSICS
- G06—COMPUTING OR CALCULATING; COUNTING
- G06T—IMAGE DATA PROCESSING OR GENERATION, IN GENERAL
- G06T2207/00—Indexing scheme for image analysis or image enhancement
- G06T2207/20—Special algorithmic details
- G06T2207/20084—Artificial neural networks [ANN]
-
- G—PHYSICS
- G06—COMPUTING OR CALCULATING; COUNTING
- G06T—IMAGE DATA PROCESSING OR GENERATION, IN GENERAL
- G06T2207/00—Indexing scheme for image analysis or image enhancement
- G06T2207/30—Subject of image; Context of image processing
- G06T2207/30004—Biomedical image processing
- G06T2207/30008—Bone
- G06T2207/30012—Spine; Backbone
Definitions
- the present invention relates to an image analysis method and system, of particular but by no means exclusive application in medical imaging, such as to diagnose and monitor diseases or conditions in (e.g. musculoskeletal) imaging.
- the region of interest may be a 2D region or 3D volume in such medical images.
- Possible medical imaging applications include Computed Tomography (CT), Magnetic Resonance (MR), Ultrasound, and Pathology Scanner imaging.
- musculoskeletal related diseases are increasing, in part because longevity increases the proportion of the old population. Early detection of musculoskeletal disease facilitates intervention that may reduce disease progression or minimize negative consequences (such as bone fractures).
- bone biopsy is used to detect bone cancer or other bone diseases, and can measure the characteristic of tissues accurately.
- bone biopsies are invasive and can cause pain and scaring.
- musculoskeletal diseases are assessed by analysing musculoskeletal images to identify or quantify abnormalities, the images collected with various imaging modalities-including DXA (Dual-energy X-ray Absorptiometry), CT (Computed Tomography), MRI (Magnetic Resonance Imaging) and X-ray scanner.
- DXA Dual-energy X-ray Absorptiometry
- CT Computerized Tomography
- MRI Magnetic Resonance Imaging
- X-ray scanner X-ray scanner.
- Each modality has specific advantages in the screening and evaluation of musculoskeletal diseases (such as bone fragility, osteoarthritis, rheumatoid arthritis, osteomalacia and bone deformity).
- HRpQCT High-Resolution peripheral Quantitative Computed Tomography
- the BMB (Bone Marrow Burden) score is an MRI scoring method for manually assessing the extent of bone marrow involvement in Gaucher disease.
- Radiologists measure a BMB score with an MRI image of lumbar spine and femur, using signal intensity and distribution according to ranking criteria. For example, one known score ranges from 0 to 8 for the lumbar spine and from 0 to 8 for the femurs, for an overall score of 0 to 16. A higher total BMB score indicates more severe bone marrow involvement.
- Measuring bone mineral density using DXA images is performed semi-manually.
- the spine or hip are scanned by DXA.
- the radiologist or doctor selects the region of interest (such as different spine sections on the spine scan and femoral neck on the hip scan).
- the bone mineral density of the selected regions is determined based on a predefined density calibration formula.
- the measured density value is converted to a T score by comparing it with measurements from a population of young adults of the same sex with peak bone mass.
- a T score of ⁇ -1 is considered normal; a T score -2.5 ⁇ T ⁇ -1 is classified as osteopenia; a T score of ⁇ -2.5 is defined as osteoporosis.
- the T score is considered by a clinician when her she is assessing the risk of fracture development and whether treatment should be recommended.
- Patent No. 9,064,320 entitled “Method and system for image analysis of selected tissue structures”. This method automatically analyses and assesses a musculoskeletal image, such as a wrist CT scan. The method can be used automatically to extract the radius bone from the wrist CT scan, segment the radius bone into microstructures (viz. compact cortex, transitional zone and trabecular region), and quantify the cortical porosity and trabecular density.
- microstructures viz. compact cortex, transitional zone and trabecular region
- the BMB score assesses the involvement of bone marrow only in Gaucher disease; the BMD score evaluates the contributions of bone mineral density only to the fracture risk; cortical porosity measures an important attribute of the bone but does not provide complete information on bone microstructure.
- US 2019/139641 discloses a machine-learned network for estimating physiological parameters, in which a patient's pressure-volume loop is estimated in real-time.
- Synthetic data (such as generated by a generative adversarial network) is used to machine train the network, in addition to or instead of actual patient data.
- US 2019/027252 discloses a medical analytics system that includes a machine learning model for processing patient tissue images for either training the machine learning model or for clinical use (e.g. for assisting with diagnosis).
- a user interface allows users to assist in diagnosing at least a part of the tissue captured in the patient image.
- US 2018/247020 discloses a method for assessing a subject's bone health, including extracting features of interest (from non-invasive subject data, medical images and subject-specific bone turnover marker values), and using a surrogate model and the features of interest to predict measures of interest related to bone health.
- a computer-implemented image analysis method comprising:
- the present invention can be used to diagnose and monitor diseases or conditions in medical imaging, such as musculoskeletal images.
- the method includes receiving the image, segmenting one or more features from the image, and identifying the features segmented from the image.
- the method includes receiving the image with features segmented therefrom, and identifying the features segmented from the image.
- the segmenting and identifying are implemented with a machine learning algorithm trained segmentation and identification model configured to segment and identify the features from the image.
- the trained segmentation and identification model comprises a deep convolutional neural network trained model.
- the trained machine learning model comprises a disease classification model.
- the trained machine learning model comprises a model trained using features extracted from patient data and labels or annotations indicating disease or non-disease.
- the trained machine learning model comprises a deep learning neural network or other machine learning algorithms (such as a Support Vector Machine, Decision Tree or AdaBoost).
- a deep learning neural network or other machine learning algorithms (such as a Support Vector Machine, Decision Tree or AdaBoost).
- the trained machine learning model is a model trained to diagnose and/or monitor one or more (e.g. musculoskeletal) diseases.
- the method further comprises (i) training the trained machine learning model, and/or (ii) updating (such as continually) the trained machine learning model with additional labelled data derived from new or newly analysed subject data.
- the results comprise one or more disease classifications and/or probabilities.
- the method further comprises generating a report based on at least the results.
- the method includes generating the report based additionally on information from a domain knowledge database.
- the assessing comprises a bone fragility assessment.
- the results include one or more fracture risk scores.
- an image analysis system comprising:
- the system further comprises a segmenter and identifier configured to receive the image, segment one or more features from the image, and identify the features segmented from the image.
- the segmenter and identifier comprises a segmentation and identification model (that is, a segmentation and identification model trained using a machine learning algorithm) configured to segment and identify the features from the image.
- the trained segmentation and identification model may comprise a deep convolutional neural network trained model.
- the trained machine learning model comprises a disease classification model.
- the trained machine learning model comprises a model trained using features extracted from patient data and labels or annotations indicating disease or non-disease.
- the trained machine learning model comprises a deep learning neural network or other machine learning algorithms.
- the trained machine learning model is a model trained to diagnose and/or monitor one or more (e.g. musculoskeletal) diseases.
- system further comprises a machine learning model trainer configured to update (such as continually) the trained machine learning model with additional labelled data derived from new or newly analysed subject data.
- the results comprise one or more disease classifications and/or probabilities.
- the system further comprises a report generator configured to generate a report based on at least the results.
- the report generator is configured to generate the report based additionally on information from a domain knowledge database (such as of the system).
- the feature assessor is configured to assess bone fragility.
- the results include one or more fracture risk scores.
- a second aspect of the present invention there is provided computer program code comprising instructions configured, when executed by one or more computing device, to implement the image analysis method of the first aspect.
- This aspect also provides a computer-readable medium (which may be non-transitory) comprising such computer program code.
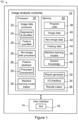
- Figure 1 is a schematic view of an image analysis system in the form of a medical image analysis system 10 according to an embodiment of the present invention.
- system 10 comprises an image analysis controller 12 and a user interface 14 (including a GUI 16).
- User interface 14 typically comprises one or more displays (on one or more of which may be displayed the GUI 16), a keyboard and a mouse, and optionally a printer.
- Image analysis controller 12 includes at least one processor 18 and a memory 20.
- System 10 may be implemented, for example, as a combination of software and hardware on a computer (such as a personal computer or mobile computing device), or as a dedicated image segmentation system. System 10 may optionally be distributed; for example, some or all of the components of memory 20 may be located remotely from processor 18; user interface 14 may be located remotely from memory 20 and/or from processor 18 and, indeed, may comprise a web browser and a mobile device application.
- Memory 20 is in data communication with processor 18, and typically comprises both volatile and non-volatile memory (and may include more than one of each type of memory), including RAM (Random Access Memory), ROM and one or more mass storage devices.
- RAM Random Access Memory
- ROM Read Only Memory
- processor 18 includes an image data processor 22 (which includes a segmenter and identifier 24 and a feature quantifier 25), a non-image data processor 26, a feature assessor 28 (which includes a precedent comparator 29), a machine learning model trainer 30, a report generator 32, an I/O interface 34 and an output in the form of a results output 36.
- Memory 20 includes program code 38, image data 40, non-image data 42, training data 44, trained machine learning models 46, and domain knowledge 48.
- Image analysis controller 12 is implemented, at least in part, by processor 18 executing program code 38 from memory 20.
- I/O interface 34 is configured to read or receive image data and non-image data (such as in DICOM format) pertaining to subjects or patients into image data 40 and non-image data 42 of memory 20 for analysis.
- Image data processor 22 using segmenter and identifier 24 and feature quantifier 25, segments (i.e. extracts) and quantifies features from the image data
- non-image data processor 26 extracts features from the non-image data
- feature assessor 28 processes the features with one or more of machine learning models 46, then I/O interface 34 outputs the result of the analysis to, for example, results output 36 and/orto GUI 16.
- System 10 employs artificial intelligence (such as a deep neural network), other machine learning algorithms and computer vision algorithms, to automate-accurately and reproducibly-feature extraction and quantification of image features, of particular value in analysing musculoskeletal images.
- artificial intelligence such as a deep neural network
- Other machine learning algorithms and computer vision algorithms to automate-accurately and reproducibly-feature extraction and quantification of image features, of particular value in analysing musculoskeletal images.
- the results are suitable for subsequent use in locating sites of musculoskeletal disease, for diagnosing musculoskeletal disease, and for monitoring disease progression.
- system 10 is configured to receive two types of subject or patient data: image data (e.g. medical images acquired by one or more image modalities at one or more anatomical sites) and non-image data (structured patient data, such as clinical history data and questionnaire data, and unstructured patient data, such as doctors' notes and voice records).
- image data e.g. medical images acquired by one or more image modalities at one or more anatomical sites
- non-image data structured patient data, such as clinical history data and questionnaire data, and unstructured patient data, such as doctors' notes and voice records.
- System 10 stores these data in image data 40 and non-image data 42, respectively.
- the different data forms and structures of the non-image data determine the operation of non-image data processor 26.
- Image data processor 22 comprises two components: segmenter and identifier 24 is configured to perform segmentation and identification, and feature quantifier 25 configured to perform feature quantification.
- the image data 40 are processed by image data processor 22 which, using segmenter and identifier 24, automatically segments and identifies clinically relevant structures, features or materials from, in this embodiment, the medical image of the subject or patient, then feature quantifier 25 quantifies the segmented and identified the clinically relevant structures, features, material or combinations thereof.
- system 10 may be configured to receive images that have already been segmented (with, optionally, the segmented features already identified), such that segmenter and identifier 24, or its use, may be omitted.
- the segmentation and identification is implemented with a conventional (i.e. non-machine learning) image processing method, such as thresholding, contour detection, or blob detection, or according to the method disclosed in U.S. Patent No. 9,064,320 (entitled “Method and system for image analysis of selected tissue structures”).
- a conventional (i.e. non-machine learning) image processing method such as thresholding, contour detection, or blob detection, or according to the method disclosed in U.S. Patent No. 9,064,320 (entitled “Method and system for image analysis of selected tissue structures").
- segmenter and identifier 24 comprises a machine learning algorithm trained segmentation and identification model configured to segment and identify the structures or features of interest from the image.
- a machine learning algorithm trained segmentation and identification model configured to segment and identify the structures or features of interest from the image.
- a model-trained using a deep convolutional neural network may be used to segment and identify radius bone from a wrist HRpQCT scan; the training data may be annotated wrist HRpQCT scans that distinguish the voxels of the radius bone, ulna bone, and surrounding material.
- the non-image data are processed by non-image data processor 26, which extracts clinically relevant features from the non-image data.
- Machine learning model 46 is pre-trained using training data with labels, that is, annotations that constitute the 'ground truth' for machine learning.
- the training data typically comprises original images and the corresponding ground truth, hence the images in which the bones have been annotated.
- the training data typically comprises the features extracted from patient data and the corresponding ground truth, which are the labels/annotations indicating disease or non-disease.
- the terms 'label' and 'annotation' are essentially interchangeably, but 'label' is generally reserved herein for a disease or condition, with 'annotation' generally reserved for image annotation in image segmentation/ identification machine learning models.
- processor 18 includes a machine learning model trainer 30, configured to train machine learning models 46 (and to retrain or update train machine learning models 46, as discussed below) using training data 44 (which may include new subject data).
- machine learning model trainer 30 may be configured or used only to retrain or update train machine learning models 46.
- machine learning algorithms may be used to train the machine learning models 46 employed in this embodiment to diagnose and monitor musculoskeletal diseases, etc., such as a deep learning neural network (which is preferred) or other machine learning algorithms such as Support Vector Machine, Decision Tree and AdaBoost.
- a deep learning neural network which is preferred
- AdaBoost AdaBoost
- a pre-trained machine learning model 46 is updated continually with additional labelled data derived from newly analysed patient data.
- feature assessor 28 evaluates and assesses the features using a machine learning model 46, and then outputs results (in the form of, for example, classifications and probabilities) to report generator 32.
- Report generator 32 generates a report based on these results.
- Report generator 32 may also pull additional information from domain knowledge 48, and combine that information with the results, both being presented in the report.
- feature assessor 28-using a machine learning model 46- may output a result comprising a fracture risk score.
- Report generator 32 may be configured to pull information indicated by this score from domain knowledge 48, such as information to assist in the interpretation of the score. Report generator 32 can then present both the score and the information in a report.
- the ultimate report is outputted via results output 36 and/or user interface 14.
- Figures 2A and 2B are schematic views of exemplary image data, as stored in image data 40.
- the image data comprise clinically relevant medical images of the subject or patient, typically images acquired by one or more imaging modalities at one or more anatomical sites.
- the input image data may comprise a wrist HRPpQCT scan 50, as illustrated in Figure 2A .
- the input image data may comprise a wrist HRpQCT scan 50, a leg HRpQCT scan 52, a spine DXA scan 54, and a hip DXAscan 56 (and, if bone marrow information is optionally incorporated, a hip MRI scan 58).
- Figures 3A and 3B depict schematically examples of non-image data 42, unpopulated and populated respectively.
- the non-image data received by system 10 and stored in non-image data 42 may include a significant quantity of useful data indicative of musculoskeletal diseases.
- the non-image data may include patient information from various sources of structured and unstructured data, which are collected-for example-during a subject or patent's medical consultations and treatment.
- the structured data may include basic patient information, such as sex, age, weight, height, laboratory test results (such as blood test results and DNA test results), treatment data (such as types of medication and dosage), and questionnaire data (such as smoking and drinking habits and fracture history).
- the unstructured data may include text documents of laboratory results, doctors' notes and radiological reports.
- the non-image data in non-image data 42 may be in a variety of formats, such as structured video 62, text 64, numbers 66, and/or voice 68, and unstructured video 72, text 74, numbers 76 and/or voice 78.
- Figure 3B depicts an exemplary scenario, in which the non-image data comprises structured text 64 in the form of clinical information and history 80, structured numbers 66 in the form of patient measurements 82, unstructured video 72 in the form of video of the patient while walking 84, unstructured text 74 in the form of doctors' notes 86, and unstructured voice 78 in the form of patient interviews 88.
- Non-image data processor 26 is configured with and employs different data processing and feature extraction techniques in processing the non-image data, in each case according to the structure and form of each portion of that data.
- Figure 4 is a schematic representation 90 of the operation of image data processor 22, in a bone fragility application.
- the radius bone is identified and segmented 92 from a wrist HRpQCT scan using a pre-trained deep neural network model.
- the radius bone is then segmented and identified by segmenter and identifier 24, into compact cortex 94, transitional zone 96, and trabecular region 98.
- vBMD the volumetric bone mineral density of the entire radius bone
- cortical porosity the percentages of pores in the bone volume
- transitional region vBMD the volumetric bone mineral density of the transitional region
- trabecular region vBMD the volumetric bone mineral density of the trabecular region
- matrix mineralization level the average percentage of the mineralized material
- marrow adiposity the density of marrow adiposity in the trabecular region
- cortical thickness the average thickness of compact cortex
- trabecular tissue separation the average separation of trabecular tissues
- Figure 5 a schematic representation 120 of the operation of non-image data processor 26 on exemplary non-image data 42 that includes structured and unstructured data.
- Non-image data processor 26 extracts features from the non-image data with a variety of tools each adapted to extract types of non-image data of different structure and form.
- Structured data 122 are typically stored and maintained in structured data storage such as database tables, .json files, .xml files and .csv files.
- Non-image data processor 26 extracts features from the structured data by querying 124 the required parameters and attributes from the sources of the data, and thereby extracting the information of interest from the structured data sources. It should be noted that, in some cases, the structured data may be of complete in itself and of interest, such that no querying is required.
- Unstructured data 126 may comprise doctors' notes, voice record and graphic reports, etc. so, before feature extraction, non-image data processor 26 typically converts 128 the unstructured data 126 into structured data.
- the conversion method employed by non-image data processor 26 is specific to each source or type of unstructured data.
- non-image data processor 26 may include or employ and employ a trained model of optical character recognition (OCR) to convert 128 the notes to text recognisable by system 10.
- OCR optical character recognition
- Non-image data processor 26 then parses the text (using keywords such as "fractures", "pain", “fall”, etc).
- non-image data processor 26 may comprise or employ a trained model of speech recognition to convert 128 the recorded voice from an interview to text recognisable by system 10. Non-image data processor 26 then segments and organises the converted text into structured data by referring to the original interview questions.
- the non-image data may include a video as, for example, studies have shown that patterns of walking gait are associated with fracture risk.
- Non-image data processor 26 processes the video and extracts 130 gait features therefrom.
- non-image data processor 26 extracts features from the (previously unstructured) structured data by querying 124 the required parameters and attributes from the sources of the data. As discussed above, however, if the now structured data is complete in itself and of interest, no querying will be required; in the above example of video of walking, after converting the video into gait features-which constitute structured data-no such query 124 is required.
- non-image data processor 26 extracts features 130 such as sex 132, age 134, smoking habit 136, fracture history 138, treatment history 140 and gait 142.
- Figure 6 is a schematic view 144 of the (offline) training of the model or models in machine learning models 46.
- training data are accessed or selected for processing from a database of training data 44.
- the training data may comprise subject image data and/or subject non-image data. Data with various attributes are selected for training to represent the target population.
- the training data are processed by, at step 148, extracting features and, at step 150, quantifying the extracted features, using the methods described above.
- the training data then comprises a set of quantitative features.
- the training data are annotated (by a human operator) with the correct diagnosis results.
- the training data represented by the extracted features combined with the diagnosis labels are fed into one or more machine learning algorithms of machine learning model trainer 30 to train one or more model(s).
- various machine learning algorithms may be suitable to train the model(s).
- It may be a black-box algorithm (e.g. a neural network) such that the process of decision making is not human-readable.
- It may alternatively be a white-box algorithm, (e.g. a decision tree, support vector machine, or linear discriminant analysis) such that a human can interpret the decision-making process of the model.
- It may also comprise a hybrid algorithm that combines both white-box and black-box algorithms.
- the model or models-now trained-are deployed for use typically by being stored in machine learning models 46.
- the features extracted from new patient data are fed into the now trained machine learning model 46.
- a machine learning model 46 assesses the features and outputs one or more results.
- the results may be binary classifications, scores, or probabilities.
- the new patient data may be added (at optional step 158) to training data 44, to be used in retraining or updating model 46.
- model training and its utility is specific to the domain; hence, so are each of the resulting machine learning models 46.
- Each of model 46 depends on the data and targeted conditions (e.g. a condition, such as bone fragility; a disease, such as osteoporosis, an infection, such as a particular bacterial infection).
- one of models 46 is trained and used to diagnose one or more diseases or conditions, by generating one or more disease probability scores.
- a plurality of models 46 may be trained and used to diagnose respective diseases.
- one of models 46 may be trained to generate a prediction of the likelihood of the expression of one or more symptoms (e.g. bone fracture), or a plurality of models 46 may be trained and used to generate respective predictions of the likelihood of the expression of the respective symptoms.
- Figure 7 is a schematic view of report generator 32, which generates reports based on at least the results 162 obtained from machine learning model 46.
- Report generator 32 may also, in generating the report, use information stored in domain knowledge 48. This information may include, for example, information of value to a doctor in interpreting the results outputted by features assessor 28 (such as diagnosis and treatment guidelines). For example, in the application of system 10 to the assessment of bone fractures, a doctor may be presented with treatment guidelines pertinent to different levels of bone fracture risk.
- the report may then include both a plurality of results generated by features assessor 28 and characterizing a bone of a subject or patient (such as a fragility score, a porosity score and a trabecular score), but also with information of use in interpreting those scores and in selecting a treatment.
- features assessor 28 includes an optional precedent comparator 29, configured to compare the results (in particular numerical results such as scores) generated by machine learning model 46 with such information from domain knowledge 48, to automatically form a diagnosis (by assigning a probability-or respective probabilities-that the subject has the disease or diseases) and therapy/treatment recommendation based on that comparison, and to output these to report generator 32 for inclusion in the report.
- the report may also include the results of the monitoring of disease progression and the efficacy of treatment. For example, the effectiveness of the treatment may be shown if the treated subject or patient's bone fracture risk is seen to decrease in a follow-up test.
- the report may also display similar or opposite cases. Presenting similar or opposite cases can be of value to a medical practitioner in assessing prognosis and determining treatment. The presentation of similar or opposite cases can be useful in training inexperienced users, or assist users to confirm the results generated from model 46. Moreover, by studying similar or opposite cases to see how past subjects or patients responded to different treatment options, a medical practitioner can assess the efficacy of a treatment (or likely efficacy of a proposed treatment) on the current patient.
- results and information 164 are included in the report 166 by report generator 32, which then delivers the report 166 (via results output 36) to user interface 14 (such as a web browser, a PC application or a mobile device application) for perusal by a user or users.
- user interface 14 such as a web browser, a PC application or a mobile device application
- Figure 8 illustrates an exemplary operation of system 10 in a bone fragility application.
- the image data comprises a wrist HRpQCT scan 172 and the non-image data comprises basic patient information 174.
- Non-image data processor 26 employs a query 184 to extractsex 186 and age 188 from basic patient information 174 of the non-image data.
- Feature assessor 28 receives the four features cortical porosity 180, trabecular density 182, sex 186 and age 188.
- Feature assessor 28 employs anothertrained model 46" (in the form of, in this example, a bone decay model) to generate a structural fragility score 190 by assessing the four aforementioned features 180, 182, 186, 188.
- bone decay model 46" may be trained using an algorithm such as that described by Zebaze et al.
- Fragility score 190 and other information are used by report generator 32 to generate a report 166, which is ultimately outputted to a user interface 14 in the form of, in this example, a web browser.
- Figure 9 is an exemplary report 200, generated by report generator 32 of system 10.
- Report 200 includes several registers: a subject/patient details register 202, a Bone Volume Fraction Map register 204, a Scores register 206 and a Score Graphs register 208.
- Subject/patient details register 202 typically includes biographical details (such as name, date of birth, sex and age), doctor's name (or doctors' names), the date of the acquisition of the data, and the date of the processing of the data (which is also the date of the report 200).
- Bone Volume Fraction Map register 204 includes a false colour 3D reconstruction 210 of, in this example, the patient's radius bone volume, a false colour 3D reconstruction 212 of a corresponding reference (and typically healthy) radius bone volume, and a false colour key 214. (Note that, in figure 9 , the colours are reproduced as a greyscale.)
- the false colour is used to indicate "bone volume fraction", which is the volume of mineralised bone per unit volume of the sample.
- the report 200 presents the reconstructions 210, 212 adjacent to one another so that a medical practitioner can readily evaluate the extent and distribution of-in this example-bone loss.
- Scores register 206 includes scores generated by features assessor 28.
- these scores are a fragility score 216, a porosity score 218 and a trabecular score 220, expressed as percentages.
- Fragility score 216 is indicative of the level of coexisting cortical and trabecular deterioration.
- Porosity score 218 is indicative of the porosity of cortex bone.
- Trabecular score 220 is a score indicative of the density of the trabecular region.
- these scores 216, 218, 220 may be presented graphically on respective bars 222, 224, 226 with the score represented-for example-as a slider 228, 230, 232.
- Each bar in this example, is labelled with three values: low and high values indicating the scores of the ends of the bar, and a third value indicating a division between lower and higher risk (or normal and abnormal) ranges.
- these three values are, in the illustrated example of bar 222 of fragility score 216, respectively 20%, 90% and 70%.
- bar 226 of trabecular score 220 respectively 0%, 10% and 2%.
- the bars 222, 224, 226 may optionally be coloured or shaded to indicate the regions of lower risk 234 and higher risk 236, so that it is immediately visually clear whether a respective slider 228, 230, 232 (and hence score 216, 218, 220) corresponds to precedent data associated with high or low risk subjects.
- a denser shading is used to indicate the region of higher risk.
- the report 200 gives a fragility score 216 of 75% (indicated to be higher risk), a porosity score of 37% (indicated to be lower risk), and a trabecular score of 1% (indicated to be higher risk).
- These scores neither individually nor in combination, constitute a diagnosis, as they do not identify a specific disease or affliction. However, they give the user a useful indication of symptoms and of how pronounced are those symptoms.
- Score Graphs register 208 presents plots 240, 242, 244 of fragility score (FS((%)), porosity score (PS((%)), and trabecular score (TS((%)), respectfully, evolving over time T.
- the time axis divisions are typically a day or two, but in general each division will represent the time between scans (which also means that the divisions in a single graph may not represent a constant time difference).
- plots 240, 242, 244 first indicate the scores of Scores register 206, followed in each case by subsequent scores obtained in a series of follow-up consultations; plots 240, 242, 244 thereby allow a medical practitioner to quickly assess changes in the subject, whether spontaneous, in response to treatment, or otherwise.
Landscapes
- Engineering & Computer Science (AREA)
- Physics & Mathematics (AREA)
- Theoretical Computer Science (AREA)
- General Physics & Mathematics (AREA)
- Data Mining & Analysis (AREA)
- Computer Vision & Pattern Recognition (AREA)
- Software Systems (AREA)
- Mathematical Physics (AREA)
- General Engineering & Computer Science (AREA)
- General Health & Medical Sciences (AREA)
- Health & Medical Sciences (AREA)
- Artificial Intelligence (AREA)
- Evolutionary Computation (AREA)
- Life Sciences & Earth Sciences (AREA)
- Medical Informatics (AREA)
- Computing Systems (AREA)
- Radiology & Medical Imaging (AREA)
- Quality & Reliability (AREA)
- Nuclear Medicine, Radiotherapy & Molecular Imaging (AREA)
- Biomedical Technology (AREA)
- Biophysics (AREA)
- Computational Linguistics (AREA)
- Molecular Biology (AREA)
- Pure & Applied Mathematics (AREA)
- Computational Mathematics (AREA)
- Mathematical Optimization (AREA)
- Mathematical Analysis (AREA)
- Evolutionary Biology (AREA)
- Bioinformatics & Computational Biology (AREA)
- Bioinformatics & Cheminformatics (AREA)
- Probability & Statistics with Applications (AREA)
- Algebra (AREA)
- Databases & Information Systems (AREA)
- Operations Research (AREA)
- Image Analysis (AREA)
- Apparatus For Radiation Diagnosis (AREA)
- Medical Treatment And Welfare Office Work (AREA)
- Measuring And Recording Apparatus For Diagnosis (AREA)
Applications Claiming Priority (2)
| Application Number | Priority Date | Filing Date | Title |
|---|---|---|---|
| US16/448,460 US11087463B2 (en) | 2019-06-21 | 2019-06-21 | Image analysis method and system for assessing bone fragility |
| EP20177205.0A EP3754599B8 (de) | 2019-06-21 | 2020-05-28 | Bildanalyseverfahren und -system |
Related Parent Applications (2)
| Application Number | Title | Priority Date | Filing Date |
|---|---|---|---|
| EP20177205.0A Division EP3754599B8 (de) | 2019-06-21 | 2020-05-28 | Bildanalyseverfahren und -system |
| EP20177205.0A Division-Into EP3754599B8 (de) | 2019-06-21 | 2020-05-28 | Bildanalyseverfahren und -system |
Publications (2)
| Publication Number | Publication Date |
|---|---|
| EP4345744A2 true EP4345744A2 (de) | 2024-04-03 |
| EP4345744A3 EP4345744A3 (de) | 2024-06-12 |
Family
ID=70921807
Family Applications (2)
| Application Number | Title | Priority Date | Filing Date |
|---|---|---|---|
| EP24150725.0A Pending EP4345744A3 (de) | 2019-06-21 | 2020-05-28 | Bildanalyseverfahren und -system |
| EP20177205.0A Active EP3754599B8 (de) | 2019-06-21 | 2020-05-28 | Bildanalyseverfahren und -system |
Family Applications After (1)
| Application Number | Title | Priority Date | Filing Date |
|---|---|---|---|
| EP20177205.0A Active EP3754599B8 (de) | 2019-06-21 | 2020-05-28 | Bildanalyseverfahren und -system |
Country Status (5)
| Country | Link |
|---|---|
| US (3) | US11087463B2 (de) |
| EP (2) | EP4345744A3 (de) |
| JP (2) | JP7645052B2 (de) |
| CN (1) | CN112116552A (de) |
| ES (1) | ES2980813T3 (de) |
Families Citing this family (39)
| Publication number | Priority date | Publication date | Assignee | Title |
|---|---|---|---|---|
| WO2018176000A1 (en) | 2017-03-23 | 2018-09-27 | DeepScale, Inc. | Data synthesis for autonomous control systems |
| US10671349B2 (en) | 2017-07-24 | 2020-06-02 | Tesla, Inc. | Accelerated mathematical engine |
| US11157441B2 (en) | 2017-07-24 | 2021-10-26 | Tesla, Inc. | Computational array microprocessor system using non-consecutive data formatting |
| US11893393B2 (en) | 2017-07-24 | 2024-02-06 | Tesla, Inc. | Computational array microprocessor system with hardware arbiter managing memory requests |
| US11409692B2 (en) | 2017-07-24 | 2022-08-09 | Tesla, Inc. | Vector computational unit |
| JP7224757B2 (ja) * | 2017-10-13 | 2023-02-20 | キヤノン株式会社 | 診断支援装置、情報処理方法、診断支援システム及びプログラム |
| US12307350B2 (en) | 2018-01-04 | 2025-05-20 | Tesla, Inc. | Systems and methods for hardware-based pooling |
| US11561791B2 (en) | 2018-02-01 | 2023-01-24 | Tesla, Inc. | Vector computational unit receiving data elements in parallel from a last row of a computational array |
| US11215999B2 (en) | 2018-06-20 | 2022-01-04 | Tesla, Inc. | Data pipeline and deep learning system for autonomous driving |
| US11361457B2 (en) | 2018-07-20 | 2022-06-14 | Tesla, Inc. | Annotation cross-labeling for autonomous control systems |
| US11636333B2 (en) | 2018-07-26 | 2023-04-25 | Tesla, Inc. | Optimizing neural network structures for embedded systems |
| US11562231B2 (en) | 2018-09-03 | 2023-01-24 | Tesla, Inc. | Neural networks for embedded devices |
| CA3115784A1 (en) | 2018-10-11 | 2020-04-16 | Matthew John COOPER | Systems and methods for training machine models with augmented data |
| US11196678B2 (en) | 2018-10-25 | 2021-12-07 | Tesla, Inc. | QOS manager for system on a chip communications |
| US11816585B2 (en) | 2018-12-03 | 2023-11-14 | Tesla, Inc. | Machine learning models operating at different frequencies for autonomous vehicles |
| US11537811B2 (en) | 2018-12-04 | 2022-12-27 | Tesla, Inc. | Enhanced object detection for autonomous vehicles based on field view |
| US11610117B2 (en) | 2018-12-27 | 2023-03-21 | Tesla, Inc. | System and method for adapting a neural network model on a hardware platform |
| US11150664B2 (en) | 2019-02-01 | 2021-10-19 | Tesla, Inc. | Predicting three-dimensional features for autonomous driving |
| US10997461B2 (en) | 2019-02-01 | 2021-05-04 | Tesla, Inc. | Generating ground truth for machine learning from time series elements |
| US11567514B2 (en) | 2019-02-11 | 2023-01-31 | Tesla, Inc. | Autonomous and user controlled vehicle summon to a target |
| US10956755B2 (en) | 2019-02-19 | 2021-03-23 | Tesla, Inc. | Estimating object properties using visual image data |
| US12429853B2 (en) * | 2019-12-20 | 2025-09-30 | Basf Se | Method for controlling and/or monitoring a chemical production plant |
| WO2021153592A1 (ja) * | 2020-01-29 | 2021-08-05 | キヤノン株式会社 | 画像処理装置、放射線撮影装置、画像処理方法及びプログラム |
| US20210304896A1 (en) * | 2020-03-31 | 2021-09-30 | Shanghai United Imaging Intelligence Co., Ltd. | Systems and methods for medical diagnosis |
| KR102321427B1 (ko) * | 2021-01-20 | 2021-11-04 | 메디컬아이피 주식회사 | 의료영상을 이용한 인체성분 분석 방법 및 그 장치 |
| CN112951412A (zh) * | 2021-03-11 | 2021-06-11 | 深圳大学 | 一种辅助诊断方法及其应用 |
| US12094114B2 (en) * | 2021-03-24 | 2024-09-17 | Ping An Technology (Shenzhen) Co., Ltd. | Method, system, and storage medium for opportunistic screening of osteoporosis using plain film chest X-ray (CXR) |
| CN115120262B (zh) * | 2021-03-24 | 2025-05-06 | 陈海冰 | 基于超声图像的识别装置 |
| CN113223699B (zh) * | 2021-04-01 | 2024-10-18 | 复旦大学附属华山医院 | 构建腰椎骨量减少和骨质疏松筛查模型的方法和系统 |
| JP2024513400A (ja) * | 2021-04-02 | 2024-03-25 | アノード アイピー エルエルシー | 診断用途または介入用途のための電子医用画像を処理するシステムおよび方法 |
| US12147583B2 (en) * | 2021-04-15 | 2024-11-19 | BicDroid Inc. | System and method for protecting deep image classifiers |
| US12462575B2 (en) | 2021-08-19 | 2025-11-04 | Tesla, Inc. | Vision-based machine learning model for autonomous driving with adjustable virtual camera |
| US12522243B2 (en) | 2021-08-19 | 2026-01-13 | Tesla, Inc. | Vision-based system training with simulated content |
| JPWO2023054287A1 (de) * | 2021-10-01 | 2023-04-06 | ||
| US12014807B2 (en) * | 2021-12-10 | 2024-06-18 | Merative Us L.P. | Automated report generation using artificial intelligence algorithms |
| CN115629072A (zh) * | 2022-10-28 | 2023-01-20 | 新乡医学院 | 一种骨髓涂片图像分析诊断方法及病理切片扫描仪装置 |
| WO2024225785A1 (ko) * | 2023-04-25 | 2024-10-31 | 주식회사 메디컬에이아이 | 생체 정보를 식별하는 사용자 맞춤형 신경망 모델을 획득하는 방법, 프로그램 및 장치 |
| GB2630963A (en) * | 2023-06-15 | 2024-12-18 | Intelligent Ultrasound Ltd | Apparatus for analysing medical images |
| WO2025034749A2 (en) * | 2023-08-07 | 2025-02-13 | Mandel Shlomo | Automated musculoskeletal disorder diagnosis and therapy recommendation |
Citations (4)
| Publication number | Priority date | Publication date | Assignee | Title |
|---|---|---|---|---|
| US9064320B2 (en) | 2009-09-11 | 2015-06-23 | Straxcorp Pty Ltd | Method and system for image analysis of selected tissue structures |
| US20180247020A1 (en) | 2017-02-24 | 2018-08-30 | Siemens Healthcare Gmbh | Personalized Assessment of Bone Health |
| US20190027252A1 (en) | 2016-07-12 | 2019-01-24 | Mindshare Medical, Inc. | Medical analytics system |
| US20190139641A1 (en) | 2017-11-03 | 2019-05-09 | Siemens Healthcare Gmbh | Artificial intelligence for physiological quantification in medical imaging |
Family Cites Families (12)
| Publication number | Priority date | Publication date | Assignee | Title |
|---|---|---|---|---|
| US906432A (en) | 1908-02-01 | 1908-12-08 | Charles Elmer Jackson | Reamer. |
| US6442287B1 (en) | 1998-08-28 | 2002-08-27 | Arch Development Corporation | Method and system for the computerized analysis of bone mass and structure |
| WO2000072452A2 (en) | 1999-05-26 | 2000-11-30 | Health Hero Network, Inc. | Converting unstructured information into structured information |
| EP1546982A1 (de) * | 2002-09-16 | 2005-06-29 | Imaging Therapeutics, Inc. | Bildgebungsmarker für muskelskelettkrankheiten |
| EP1636731A2 (de) | 2003-06-25 | 2006-03-22 | Siemens Medical Solutions USA, Inc. | Anordnungen und verfahren zur automatisierten diagnose und entscheidungsunterstützung für mammographie |
| WO2014070753A2 (en) | 2012-10-29 | 2014-05-08 | Health Fidelity, Inc. | Methods for processing clinical information |
| US9265441B2 (en) | 2013-07-12 | 2016-02-23 | Siemens Aktiengesellschaft | Assessment of traumatic brain injury |
| EP3043806A4 (de) * | 2013-09-11 | 2017-05-17 | University Of Southern California | Zusammensetzung von stammzellen mit hochexprimiertem fas-liganden |
| US10593035B2 (en) | 2015-03-18 | 2020-03-17 | University Of South Florida | Image-based automated measurement model to predict pelvic organ prolapse |
| US10111632B2 (en) | 2017-01-31 | 2018-10-30 | Siemens Healthcare Gmbh | System and method for breast cancer detection in X-ray images |
| JP6930283B2 (ja) | 2017-08-18 | 2021-09-01 | コニカミノルタ株式会社 | 画像処理装置、画像処理装置の作動方法、及び画像処理プログラム |
| US11636288B2 (en) | 2017-11-06 | 2023-04-25 | University Health Network | Platform, device and process for annotation and classification of tissue specimens using convolutional neural network |
-
2019
- 2019-06-21 US US16/448,460 patent/US11087463B2/en active Active
-
2020
- 2020-05-28 EP EP24150725.0A patent/EP4345744A3/de active Pending
- 2020-05-28 EP EP20177205.0A patent/EP3754599B8/de active Active
- 2020-05-28 ES ES20177205T patent/ES2980813T3/es active Active
- 2020-06-10 JP JP2020101124A patent/JP7645052B2/ja active Active
- 2020-06-19 CN CN202010564495.6A patent/CN112116552A/zh active Pending
-
2021
- 2021-07-08 US US17/370,455 patent/US11727562B2/en active Active
-
2023
- 2023-06-26 US US18/214,104 patent/US20230351588A1/en active Pending
-
2025
- 2025-01-17 JP JP2025007003A patent/JP2025072403A/ja active Pending
Patent Citations (4)
| Publication number | Priority date | Publication date | Assignee | Title |
|---|---|---|---|---|
| US9064320B2 (en) | 2009-09-11 | 2015-06-23 | Straxcorp Pty Ltd | Method and system for image analysis of selected tissue structures |
| US20190027252A1 (en) | 2016-07-12 | 2019-01-24 | Mindshare Medical, Inc. | Medical analytics system |
| US20180247020A1 (en) | 2017-02-24 | 2018-08-30 | Siemens Healthcare Gmbh | Personalized Assessment of Bone Health |
| US20190139641A1 (en) | 2017-11-03 | 2019-05-09 | Siemens Healthcare Gmbh | Artificial intelligence for physiological quantification in medical imaging |
Also Published As
| Publication number | Publication date |
|---|---|
| US20200402226A1 (en) | 2020-12-24 |
| EP4345744A3 (de) | 2024-06-12 |
| ES2980813T3 (es) | 2024-10-03 |
| EP3754599B1 (de) | 2024-05-22 |
| US11087463B2 (en) | 2021-08-10 |
| EP3754599C0 (de) | 2024-05-22 |
| US20230351588A1 (en) | 2023-11-02 |
| US20210334968A1 (en) | 2021-10-28 |
| CN112116552A (zh) | 2020-12-22 |
| EP3754599A1 (de) | 2020-12-23 |
| JP7645052B2 (ja) | 2025-03-13 |
| US11727562B2 (en) | 2023-08-15 |
| JP2025072403A (ja) | 2025-05-09 |
| EP3754599B8 (de) | 2024-10-30 |
| JP2021000442A (ja) | 2021-01-07 |
Similar Documents
| Publication | Publication Date | Title |
|---|---|---|
| EP3754599B1 (de) | Bildanalyseverfahren und -system | |
| US12217418B2 (en) | Method and system for machine learning classification based on structure or material segmentation in an image | |
| AU2023270223B2 (en) | Image Analysis Method and System | |
| Hennessey et al. | Artificial intelligence in veterinary diagnostic imaging: A literature review | |
| Cruz et al. | Artificial intelligence on the identification of risk groups for osteoporosis, a general review | |
| Kang et al. | Prediction of bone mineral density in CT using deep learning with explainability | |
| Dzierżak et al. | The Influence of the Normalisation of Spinal CT Images on the Significance of Textural Features in the Identification of Defects in the Spongy Tissue Structure | |
| Bhat et al. | Identification of intracranial hemorrhage using ResNeXt model | |
| AU2019204380C1 (en) | A Method and System for Machine Learning Classification Based on Structure or Material Segmentation in an Image | |
| Zaman et al. | RETRACTED ARTICLE: Diagnosing osteoporosis using deep neural networkassisted optical image processing method | |
| Krithika et al. | Automated Boneage Analysis Using Machine Learning | |
| Ramos | Analysis of medical images to support decision-making in the musculoskeletal field | |
| US20250086784A1 (en) | Biological Age and Survival Risk Determination from Imaging Biomarkers | |
| Hovakimyan et al. | Artificial Intelligence Methods in Osteoporosis Prediction Problem | |
| Chawla et al. | AI-Powered Diagnostic Tool for Early Osteoporosis Prediction: Development and Insights | |
| Misch et al. | Artificial Intelligence and Carpal Tunnel Syndrome: A systematic review and contemporary update on imaging techniques | |
| Alekseeva et al. | Intelligent Decision Support System for Differential Diagnosis of Chronic Odontogenic Rhinosinusitis Based on U-Net Segmentation. Electronics 2023, 12, 1202 | |
| Norena | Evaluation of The Use of a Deep Active Learning Model in Anatomic Segmentation Tasks in Canine Thoracic Radiographs | |
| KR20250057319A (ko) | 딥 러닝 기반 골 강도 예측 방법 | |
| Rodríguez Martín | Predictive modelling of femur fracture from dxa scans using radiomics and machine learning | |
| Recenti | Machine Learning Predictive System Based on Transaxial Mid-femur Computed Tomography Images | |
| Jayawardena et al. | Towards a Unified Facial Tissue Thickness Model from Neuroimaging Data for Selected Age Groups of Sri Lankan Adult Population | |
| Patel et al. | DO NOT POLLUTE! AVOID PRINTING, OR PRINT 2-SIDED MULTIPAGE. |
Legal Events
| Date | Code | Title | Description |
|---|---|---|---|
| PUAI | Public reference made under article 153(3) epc to a published international application that has entered the european phase |
Free format text: ORIGINAL CODE: 0009012 |
|
| STAA | Information on the status of an ep patent application or granted ep patent |
Free format text: STATUS: THE APPLICATION HAS BEEN PUBLISHED |
|
| AC | Divisional application: reference to earlier application |
Ref document number: 3754599 Country of ref document: EP Kind code of ref document: P |
|
| AK | Designated contracting states |
Kind code of ref document: A2 Designated state(s): AL AT BE BG CH CY CZ DE DK EE ES FI FR GB GR HR HU IE IS IT LI LT LU LV MC MK MT NL NO PL PT RO RS SE SI SK SM TR |
|
| PUAL | Search report despatched |
Free format text: ORIGINAL CODE: 0009013 |
|
| AK | Designated contracting states |
Kind code of ref document: A3 Designated state(s): AL AT BE BG CH CY CZ DE DK EE ES FI FR GB GR HR HU IE IS IT LI LT LU LV MC MK MT NL NO PL PT RO RS SE SI SK SM TR |
|
| RIC1 | Information provided on ipc code assigned before grant |
Ipc: G06T 7/00 20170101AFI20240508BHEP |
|
| STAA | Information on the status of an ep patent application or granted ep patent |
Free format text: STATUS: REQUEST FOR EXAMINATION WAS MADE |
|
| 17P | Request for examination filed |
Effective date: 20241211 |