EP4345470A1 - State estimation method, state estimation device, and storage medium storing a program - Google Patents
State estimation method, state estimation device, and storage medium storing a program Download PDFInfo
- Publication number
- EP4345470A1 EP4345470A1 EP23196049.3A EP23196049A EP4345470A1 EP 4345470 A1 EP4345470 A1 EP 4345470A1 EP 23196049 A EP23196049 A EP 23196049A EP 4345470 A1 EP4345470 A1 EP 4345470A1
- Authority
- EP
- European Patent Office
- Prior art keywords
- state
- measurement data
- rechargeable battery
- impedances
- test
- Prior art date
- Legal status (The legal status is an assumption and is not a legal conclusion. Google has not performed a legal analysis and makes no representation as to the accuracy of the status listed.)
- Granted
Links
Images





Classifications
-
- G—PHYSICS
- G01—MEASURING; TESTING
- G01R—MEASURING ELECTRIC VARIABLES; MEASURING MAGNETIC VARIABLES
- G01R31/00—Arrangements for testing electric properties; Arrangements for locating electric faults; Arrangements for electrical testing characterised by what is being tested not provided for elsewhere
- G01R31/36—Arrangements for testing, measuring or monitoring the electrical condition of accumulators or electric batteries, e.g. capacity or state of charge [SoC]
- G01R31/392—Determining battery ageing or deterioration, e.g. state of health
-
- G—PHYSICS
- G01—MEASURING; TESTING
- G01R—MEASURING ELECTRIC VARIABLES; MEASURING MAGNETIC VARIABLES
- G01R23/00—Arrangements for measuring frequencies; Arrangements for analysing frequency spectra
- G01R23/16—Spectrum analysis; Fourier analysis
-
- G—PHYSICS
- G01—MEASURING; TESTING
- G01R—MEASURING ELECTRIC VARIABLES; MEASURING MAGNETIC VARIABLES
- G01R31/00—Arrangements for testing electric properties; Arrangements for locating electric faults; Arrangements for electrical testing characterised by what is being tested not provided for elsewhere
- G01R31/36—Arrangements for testing, measuring or monitoring the electrical condition of accumulators or electric batteries, e.g. capacity or state of charge [SoC]
- G01R31/3644—Constructional arrangements
- G01R31/3648—Constructional arrangements comprising digital calculation means, e.g. for performing an algorithm
-
- G—PHYSICS
- G01—MEASURING; TESTING
- G01R—MEASURING ELECTRIC VARIABLES; MEASURING MAGNETIC VARIABLES
- G01R31/00—Arrangements for testing electric properties; Arrangements for locating electric faults; Arrangements for electrical testing characterised by what is being tested not provided for elsewhere
- G01R31/36—Arrangements for testing, measuring or monitoring the electrical condition of accumulators or electric batteries, e.g. capacity or state of charge [SoC]
- G01R31/367—Software therefor, e.g. for battery testing using modelling or look-up tables
-
- G—PHYSICS
- G01—MEASURING; TESTING
- G01R—MEASURING ELECTRIC VARIABLES; MEASURING MAGNETIC VARIABLES
- G01R31/00—Arrangements for testing electric properties; Arrangements for locating electric faults; Arrangements for electrical testing characterised by what is being tested not provided for elsewhere
- G01R31/36—Arrangements for testing, measuring or monitoring the electrical condition of accumulators or electric batteries, e.g. capacity or state of charge [SoC]
- G01R31/382—Arrangements for monitoring battery or accumulator variables, e.g. SoC
-
- G—PHYSICS
- G01—MEASURING; TESTING
- G01R—MEASURING ELECTRIC VARIABLES; MEASURING MAGNETIC VARIABLES
- G01R31/00—Arrangements for testing electric properties; Arrangements for locating electric faults; Arrangements for electrical testing characterised by what is being tested not provided for elsewhere
- G01R31/36—Arrangements for testing, measuring or monitoring the electrical condition of accumulators or electric batteries, e.g. capacity or state of charge [SoC]
- G01R31/389—Measuring internal impedance, internal conductance or related variables
-
- G—PHYSICS
- G01—MEASURING; TESTING
- G01R—MEASURING ELECTRIC VARIABLES; MEASURING MAGNETIC VARIABLES
- G01R31/00—Arrangements for testing electric properties; Arrangements for locating electric faults; Arrangements for electrical testing characterised by what is being tested not provided for elsewhere
- G01R31/36—Arrangements for testing, measuring or monitoring the electrical condition of accumulators or electric batteries, e.g. capacity or state of charge [SoC]
- G01R31/396—Acquisition or processing of data for testing or for monitoring individual cells or groups of cells within a battery
-
- H—ELECTRICITY
- H01—ELECTRIC ELEMENTS
- H01M—PROCESSES OR MEANS, e.g. BATTERIES, FOR THE DIRECT CONVERSION OF CHEMICAL ENERGY INTO ELECTRICAL ENERGY
- H01M10/00—Secondary cells; Manufacture thereof
- H01M10/05—Accumulators with non-aqueous electrolyte
- H01M10/052—Li-accumulators
- H01M10/0525—Rocking-chair batteries, i.e. batteries with lithium insertion or intercalation in both electrodes; Lithium-ion batteries
-
- H—ELECTRICITY
- H01—ELECTRIC ELEMENTS
- H01M—PROCESSES OR MEANS, e.g. BATTERIES, FOR THE DIRECT CONVERSION OF CHEMICAL ENERGY INTO ELECTRICAL ENERGY
- H01M10/00—Secondary cells; Manufacture thereof
- H01M10/42—Methods or arrangements for servicing or maintenance of secondary cells or secondary half-cells
- H01M10/48—Accumulators combined with arrangements for measuring, testing or indicating the condition of cells, e.g. the level or density of the electrolyte
-
- Y—GENERAL TAGGING OF NEW TECHNOLOGICAL DEVELOPMENTS; GENERAL TAGGING OF CROSS-SECTIONAL TECHNOLOGIES SPANNING OVER SEVERAL SECTIONS OF THE IPC; TECHNICAL SUBJECTS COVERED BY FORMER USPC CROSS-REFERENCE ART COLLECTIONS [XRACs] AND DIGESTS
- Y02—TECHNOLOGIES OR APPLICATIONS FOR MITIGATION OR ADAPTATION AGAINST CLIMATE CHANGE
- Y02E—REDUCTION OF GREENHOUSE GAS [GHG] EMISSIONS, RELATED TO ENERGY GENERATION, TRANSMISSION OR DISTRIBUTION
- Y02E60/00—Enabling technologies; Technologies with a potential or indirect contribution to GHG emissions mitigation
- Y02E60/10—Energy storage using batteries
Definitions
- the present disclosure relates to a state estimation method, a state estimation device, and a recording medium recording a program.
- JP-A No. 2021-140991 discloses a method of analyzing a state of deterioration from changes in voltage after current is disconnected from an all-solid-state battery.
- JP-A No. 2020-167069 and WO2012/095913 disclose methods that use alternating current (AC) impedance methods to analyze states of deterioration.
- AC alternating current
- Deterioration due to charging and discharging of a rechargeable battery includes chemical deterioration, in which battery performance declines due to chemical side reactions of structural materials such as an active material, a solid-state electrolyte and the like, and physical deterioration, in which battery performance declines due to weakening contact between structural materials resulting from expansion and contraction of an active material and the like.
- Physical deteriorations such as cracks forming between an active material and a solid-state electrolyte and between one solid-state electrolyte and another solid-state electrolyte are important factors in the deterioration of all-solid-state batteries.
- estimating a state of deterioration from a resistance value obtained by an AC impedance method is disclosed.
- the higher a resistance value the lower a battery capacity is estimated to be.
- a relationship between resistance values and battery capacities is not always clear. Particularly with an all-solid-state battery, it may not be possible to estimate a battery capacity accurately.
- JP-A No. 2021-140991 discloses the method of using a change in voltage after current is disconnected to estimate a state of deterioration
- JP-A No. 2020-167079 discloses the method of using an estimation of resistance based on the AC impedance method to estimate a state of deterioration.
- JP-A Nos. 2021-140991 and 2020-167069 and WO2012/095913 no consideration is given to physical deteriorations that are particular to all-solid-state batteries, such as cracks forming between an active material and a solid-state electrolyte or between solid-state electrolytes, and so forth.
- An object of the present disclosure is to provide a state estimation method, a state estimation device and a program that may estimate a state of a rechargeable battery employing a solid-state electrolyte with consideration for physical deterioration.
- a first aspect is a state estimation method for estimating a state of a rechargeable battery that uses a solid-state electrolyte, the state estimation method including: acquiring measurement data and states of a reference rechargeable battery before and after a test that causes deterioration to progress, the measurement data being impedances at respective frequencies that are measured by an impedance method, and the states being found in advance; computing peak frequencies before and after the test from arc-shaped curves in graphs plotting the impedances at the respective frequencies represented by the measurement data; based on the computed peak frequencies before and after the test and the states found in advance, obtaining a model that represents a relationship between the peak frequencies and the states; acquiring measurement data of an estimation target rechargeable battery, the measurement data being impedances at respective frequencies that are measured by the impedance method; computing a peak frequency from an arc-shaped curve in a graph plotting the impedances at the respective frequencies represented by the measurement data; and estimating a state of the estimation target rechargeable battery from the peak frequency of the
- the measurement data and states found in advance of the reference rechargeable battery are acquired.
- the measurement data is impedances at respective frequencies, measured by the impedance method before and after the test that causes deterioration to progress.
- Examples of the "test that causes deterioration to progress" include a cycling test in which charging and discharging of the rechargeable battery is repeated under predetermined conditions, a test that holds the rechargeable battery at a constant state of charge, and so forth.
- the peak frequencies before and after the test are computed from arc-shaped curves in the graphs plotting the impedances at the respective frequencies represented by the measurement data.
- graph as used herein is intended to include a graph plotting the impedances for the respective frequencies with real components of the impedances on a horizontal axis and imaginary components of the impedances on a vertical axis.
- peak frequency as used herein is intended to include a frequency that produces a peak on the arc-shaped curve of the graph, at which absolute values of the imaginary values are at a maximum.
- a model representing the relationship between peak frequencies and states is obtained.
- measurement data is acquired, which is impedances at respective frequencies measured by the impedance method, and a peak frequency is computed from an arc-shaped curve in a graph plotting the impedances at the respective frequencies represented by this measurement data.
- the state of the estimation target rechargeable battery is then estimated from the peak frequency of the estimation target rechargeable battery.
- the model representing the relationship between peak frequencies and states is found on the basis of the peak frequencies computed for before and after the test that causes deterioration of the reference rechargeable battery to progress and the states that are found in advance.
- the peak frequency of the estimation target rechargeable battery is computed from the arc-shaped curve in the graph plotting the impedances at the respective frequencies represented by the measurement data acquired for the estimation target rechargeable battery. Because the model is used to estimate the state of the estimation target rechargeable battery from this peak frequency, the state of a rechargeable battery employing a solid-state electrolyte may be estimated with consideration for physical deterioration.
- the states are capacities.
- a model representing a relationship between peak frequencies and capacities is found on the basis of the peak frequencies computed for before and after the test that causes deterioration of the reference rechargeable battery to progress and capacities that are found in advance.
- the peak frequency of the estimation target rechargeable battery is computed from the arc-shaped curve in the graph plotting the impedances at the respective frequencies represented by the measurement data acquired for the estimation target rechargeable battery.
- the model is used to estimate a capacity of the estimation target rechargeable battery from this peak frequency. Therefore, the capacity of a rechargeable battery employing a solid-state electrolyte may be estimated with consideration for physical deterioration.
- the peak frequency of the estimation target rechargeable battery is computed from the arc-shaped curve in the graph plotting the impedances at the respective frequencies represented by the measurement data acquired for the estimation target rechargeable battery.
- a fifth aspect is a state estimation method for estimating a state of a rechargeable battery that uses a solid-state electrolyte, the state estimation method including: acquiring measurement data of a reference rechargeable battery before and after a test that causes deterioration to progress, the measurement data being impedances at respective frequencies that are measured by an impedance method; computing peak frequencies and arc chord lengths before and after the test from arc-shaped curves in graphs plotting the impedances at the respective frequencies represented by the measurement data; basedon the computed peak frequencies and the arc chord lengths before and after the test, obtaining a model that represents a relationship between the peak frequencies and the arc chord lengths; acquiring measurement data of an estimation target rechargeable battery, the measurement data being impedances at respective frequencies that are measured by the impedance method; computing a peak frequency and an arc chord length from an arc-shaped curve in a graph plotting the impedances at the respective frequencies represented by the measurement data; and estimating a state of the estimation target rechargeable
- the measurement data of the reference rechargeable battery which is impedances at respective frequencies measured by the impedance method before and after the test that causes deterioration to progress, is acquired.
- the peak frequencies and arc chord lengths before and after the test are computed from arc-shaped curves in graphs plotting the impedances at the respective frequencies represented by the measurement data.
- arc chord length as used herein is not strictly necessarily a mathematical chord length and may include, for example, a difference between the real components of respective points that are closest to the real axis approximately at the two ends of an arc-shaped curve in a graph.
- a peak frequency and arc chord length are computed from an arc-shaped curve in a graph plotting the impedances at the respective frequencies represented by this measurement data.
- the state of the estimation target rechargeable battery is estimated from the peak frequency and arc chord length of the estimation target rechargeable battery.
- the model representing the relationship between peak frequencies and arc chord lengths is found on the basis of the peak frequencies and arc chord lengths computed for before and after the test that causes deterioration of the reference rechargeable battery to progress.
- the peak frequency and arc chord length of the estimation target rechargeable battery are computed from the arc-shaped curve in the graph plotting the impedances at the respective frequencies represented by the measurement data acquired for the estimation target rechargeable battery. Because the model is used to estimate the state of the estimation target rechargeable battery from this peak frequency and arc chord length, the state of a rechargeable battery employing a solid-state electrolyte may be estimated with consideration for physical deterioration.
- the test is a test that causes deterioration in accordance with chemical change to progress
- the state is a degree of physical deterioration
- the peak frequency and arc chord length of the estimation target rechargeable battery are computed from the arc-shaped curve in the graph plotting the impedances at the respective frequencies represented by the measurement data acquired for the estimation target rechargeable battery.
- the test that causes deterioration in accordance with chemical change to progress is a test that holds a constant voltage in a charged state.
- a tenth aspect is a state estimation device that estimates a state of a rechargeable battery that uses a solid-state electrolyte, the state estimation device including: a first acquisition section that acquires measurement data and states of a reference rechargeable battery before and after a test that causes deterioration to progress, the measurement data being impedances at respective frequencies that are measured by an impedance method, and the states being found in advance; a derivation section that computes peak frequencies before and after the test from arc-shaped curves in graphs plotting the impedances at the respective frequencies represented by the measurement data and, based on the computed peak frequencies before and after the test and the states found in advance, obtains a model that represents a relationship between the peak frequencies and the states; a second acquisition section that acquires measurement data of an estimation target rechargeable battery, the measurement data being impedances at respective frequencies that are measured by the impedance method; a computation section that computes a peak frequency from an arc-shaped curve in a graph plotting the impedances at
- the first acquisition section acquires the measurement data and states found in advance of the reference rechargeable battery.
- the measurement data is impedances at respective frequencies, measured by the impedance method before and after the test that causes deterioration to progress.
- the derivation section computes peak frequencies before and after the test from arc-shaped curves in graphs plotting the impedances at the respective frequencies represented by the measurement data. On the basis of the computed peak frequencies and the states found in advance from before and after the test, the computation section obtains a model representing the relationship between peak frequencies and states.
- the second acquisition section acquires measurement data for the estimation target rechargeable battery that is impedances at respective frequencies measured by the impedance method.
- the computation section computes a peak frequency from an arc-shaped curve in a graph plotting the impedances at the respective frequencies represented by this measurement data.
- the estimation section uses the model to estimate the state of the estimation target rechargeable battery from the peak frequency of the estimation target rechargeable battery.
- the model representing the relationship between peak frequencies and states is found on the basis of the peak frequencies computed for before and after the test that causes deterioration of the reference rechargeable battery to progress and the states that are found in advance.
- the peak frequency of the estimation target rechargeable battery is computed from the arc-shaped curve in the graph plotting the impedances at the respective frequencies represented by the measurement data acquired for the estimation target rechargeable battery. Because the model is used to estimate the state of the estimation target rechargeable battery from this peak frequency, the state of a rechargeable battery employing a solid-state electrolyte may be estimated with consideration for physical deterioration.
- An eleventh aspect is a state estimation device that estimates a state of a rechargeable battery that uses a solid-state electrolyte, the state estimation device including: a first acquisition section that acquires measurement data of a reference rechargeable battery before and after a test that causes deterioration to progress, the measurement data being impedances at respective frequencies that are measured by an impedance method; a derivation section that computes peak frequencies and arc chord lengths before and after the test from arc-shaped curves in graphs plotting the impedances at the respective frequencies represented by the measurement data and, based on the computed peak frequencies and the arc chord lengths before and after the test, obtains a model that represents a relationship between the peak frequencies and the arc chord lengths; a second acquisition section that acquires measurement data of an estimation target rechargeable battery, the measurement data being impedances at respective frequencies that are measured by the impedance method; a computation section that computes a peak frequency and an arc chord length from an arc-shaped curve in a graph plotting
- the first acquisition section acquires the measurement data of the reference rechargeable battery.
- the measurement data is impedances at respective frequencies, measured by the impedance method before and after the test that causes deterioration to progress.
- the derivation section computes peak frequencies and arc chord lengths before and after the test from arc-shaped curves in graphs plotting the impedances at the respective frequencies represented by the measurement data. On the basis of the computed peak frequencies and arc chord lengths from before and after the test, the computation section obtains a model representing the relationship between peak frequencies and arc chord lengths.
- the second acquisition section acquires measurement data for the estimation target rechargeable battery that is impedances at respective frequencies measured by the impedance method.
- the computation section computes a peak frequency and arc chord length from an arc-shaped curve in a graph plotting the impedances at the respective frequencies represented by this measurement data.
- the estimation section uses the model to estimate the state of the estimation target rechargeable battery from the peak frequency and arc chord length of the estimation target rechargeable battery.
- the model representing the relationship between peak frequencies and arc chord lengths is found on the basis of the peak frequencies and arc chord lengths computed for before and after the test that causes deterioration of the reference rechargeable battery to progress.
- the peak frequency and arc chord length for the estimation target rechargeable battery are computed from the arc-shaped curve in the graph plotting the impedances at the respective frequencies represented by the measurement data acquired for the estimation target rechargeable battery. Because the model is used to estimate the state of the estimation target rechargeable battery from this peak frequency and arc chord length, the state of a rechargeable battery employing a solid-state electrolyte may be estimated with consideration for physical deterioration.
- a twelfth aspect is a program stored at a non-transitory storage medium, which program is for estimating a state of a rechargeable battery that uses a solid-state electrolyte, the program being executable by a computer to perform processing, the processing including: acquiring measurement data and states of a reference rechargeable battery before and after a test that causes deterioration to progress, the measurement data being impedances at respective frequencies that are measured by an impedance method, and the states being found in advance; computing peak frequencies before and after the test from arc-shaped curves in graphs plotting the impedances at the respective frequencies represented by the measurement data; based on the computed peak frequencies before and after the test and the states found in advance, obtaining a model that represents a relationship between the peak frequencies and the states; acquiring measurement data of an estimation target rechargeable battery, the measurement data being impedances at respective frequencies that are measured by the impedance method; computing a peak frequency from an arc-shaped curve in a graph plotting the impedances at
- a computer executing the program stored at the non-transitory storage medium acquires the measurement data and states found in advance of the reference rechargeable battery.
- the measurement data is impedances at respective frequencies, measured by the impedance method before and after the test that causes deterioration to progress.
- the computer computes peak frequencies before and after the test from arc-shaped curves in graphs plotting the impedances at the respective frequencies represented by the measurement data.
- the computer obtains a model representing the relationship between peak frequencies and states.
- the computer acquires measurement data for the estimation target rechargeable battery that is impedances at respective frequencies measured by the impedance method.
- the computer computes a peak frequency from an arc-shaped curve in a graph plotting the impedances at the respective frequencies represented by this measurement data.
- the computer uses the model to estimate the state of the estimation target rechargeable battery from the peak frequency of the estimation target rechargeable battery.
- the model representing the relationship between peak frequencies and states is found on the basis of the peak frequencies computed for before and after the test that causes deterioration of the reference rechargeable battery to progress and the states that are found in advance.
- the peak frequency of the estimation target rechargeable battery is computed from the arc-shaped curve in the graph plotting the impedances at the respective frequencies represented by the measurement data acquired for the estimation target rechargeable battery. Because the model is used to estimate the state of the estimation target rechargeable battery from this peak frequency, the state of a rechargeable battery employing a solid-state electrolyte may be estimated with consideration for physical deterioration.
- a thirteenth aspect is a program stored at a non-transitory storage medium, which program is for estimating a state of a rechargeable battery that uses a solid-state electrolyte, the program being executable by a computer to perform processing, the processing including: acquiring measurement data of a reference rechargeable battery before and after a test that causes deterioration to progress, the measurement data being impedances at respective frequencies that are measured by an impedance method; computing peak frequencies and arc chord lengths before and after the test from arc-shaped curves in graphs plotting the impedances at the respective frequencies represented by the measurement data; based on the computed peak frequencies and the arc chord lengths before and after the test, obtaining a model that represents a relationship between the peak frequencies and the arc chord lengths; acquiring measurement data of an estimation target rechargeable battery, the measurement data being impedances at respective frequencies that are measured by the impedance method; computing a peak frequency and an arc chord length from an arc-shaped curve in a graph plotting the im
- a computer executing the program stored at the non-transitory storage medium acquires the measurement data of the reference rechargeable battery.
- the measurement data is impedances at respective frequencies, measured by the impedance method before and after the test that causes deterioration to progress.
- the computer computes peak frequencies and arc chord lengths before and after the test from arc-shaped curves in graphs plotting the impedances at the respective frequencies represented by the measurement data.
- the computer obtains a model representing the relationship between peak frequencies and arc chord lengths.
- the computer acquires measurement data for the estimation target rechargeable battery that is impedances at respective frequencies measured by the impedance method.
- the computer computes a peak frequency and arc chord length from an arc-shaped curve in a graph plotting the impedances at the respective frequencies represented by this measurement data.
- the computer uses the model to estimate the state of the estimation target rechargeable battery from the peak frequency and arc chord length of the estimation target rechargeable battery.
- the model representing the relationship between peak frequencies and arc chord lengths is found on the basis of the peak frequencies and arc chord lengths computed for before and after the test that causes deterioration of the reference rechargeable battery to progress.
- the peak frequency and arc chord length of the estimation target rechargeable battery are computed from the arc-shaped curve in the graph plotting the impedances at the respective frequencies represented by the measurement data acquired for the estimation target rechargeable battery. Because the model is used to estimate the state of the estimation target rechargeable battery from this peak frequency and arc chord length, the state of a rechargeable battery employing a solid-state electrolyte may be estimated with consideration for physical deterioration.
- a state of a rechargeable battery employing a solid-state electrolyte may be estimated with consideration for physical deterioration.
- Fig. 1 is a block diagram showing hardware structures of a state estimation device 10 according to a first exemplary embodiment.
- the state estimation device 10 includes a central processing unit (CPU) 11, read-only memory (ROM) 12, random access memory (RAM) 13, storage 14, an entry unit 15, a display unit 16 and a communications interface 17. These structures are connected to be capable of communicating with one another via a bus 19.
- the CPU 11 is an example of a processor
- the RAM 13 is an example of memory.
- the CPU 11 is a central arithmetic processing unit that executes various programs and controls respective parts. That is, the CPU 11 reads a program from the ROM 12 or the storage 14, and executes the program using the RAM 13 as a workspace. The CPU 11 performs control of the structures described above and various kinds of computational processing and the like in accordance with programs memorized in the ROM 12 or the storage 14.
- a state estimation program 100 is stored in the storage 14.
- the state estimation program 100 may be a single program, and may be plural programs or a program group structured by modules.
- the ROM 12 stores various programs and various kinds of data.
- the RAM 13 serves as a workspace, temporarily memorizing programs and data.
- the storage 14 is constituted by a hard disk drive (HDD) or solid state drive (SSD).
- the storage 14 stores various programs, including an operating system, and various kinds of data.
- the entry unit 15 includes a pointing device such as a mouse or the like and a keyboard, and is used for various kinds of entry.
- the entry unit 15 accepts combinations of measurement data and capacities of the all-solid-state battery for before and after a test that causes deterioration of a reference all-solid-state battery to progress.
- the measurement data is impedances at respective frequencies, measured by an impedance method.
- the capacities are found in advance.
- an all-solid-state battery as illustrated below is fabricated, structured with a positive electrode layer, a solid-state electrolyte layer and a negative electrode layer.
- the positive electrode layer is constituted with LiNi 0.5 Co 0.2 Mn 0.3 O 2 , a sulfide solid-state electrolyte with an argyrodite structure, conductive carbon and a binder.
- the solid-state electrolyte layer is constituted with a sulfide solid-state electrolyte with an argyrodite structure and a binder.
- the negative electrode layer is constituted with graphite, a sulfide solid-state electrolyte with an argyrodite structure, and a binder.
- a slurry in which the constituent materials of the positive electrode layer are dispersed in an organic solvent is coated onto an aluminium foil and then dried to fabricate a positive electrode layer sheet.
- a slurry in which the constituent materials of the solid-state electrolyte layer are dispersed in an organic solvent is coated onto a gold foil and then dried to fabricate a solid-state electrolyte layer sheet.
- a slurry in which the constituent materials of the negative electrode layer are dispersed in an organic solvent is coated onto a gold foil and then dried to fabricate a negative electrode layer sheet.
- the coated surfaces of the solid-state electrolyte sheet and the negative electrode sheet are opposed with one another and pressed to transfer the solid-state electrolyte layer onto the negative electrode layer.
- the negative electrode sheet onto which the solid-state electrolyte has been transferred and the positive electrode sheet are superposed such that the positive electrode layer, solid-state electrolyte layer and negative electrode layer are laminated in this order, and are pressed.
- the layers are joined to one another and the positive electrode layer, solid-state electrolyte layer and negative electrode layer are densified.
- This is then sealed in a lamination film to provide an all-solid-state battery.
- the all-solid-state battery is confined in a jig that applies predetermined surface pressure to the electrode surfaces.
- a charging and discharging test is carried out to electrically charge and discharge the all-solid-state battery fabricated as described above under predetermined conditions (for example, 25°C, charge rate 0.1C), and a capacity of the all-solid-state battery is calculated. Subsequently, the State of Charge (SoC) is adjusted to 50%, and AC impedance measurements are conducted at 25°C to obtain measurement data.
- SoC State of Charge
- a cycling test is then conducted to charge and discharge the all-solid-state battery under conditions of 60°C, 1C. After 100 cycles and after 200 cycles, the all-solid-state battery is removed, the charging and discharging test is conducted at 25°C, 0.1 C, and the capacity of the all-solid-state battery is calculated. AC impedance measurements are carried out with an SoC of 50% to obtain measurement data.
- combinations of measurement data which is impedances at respective frequencies measured by the impedance method, with capacities of the all-solid-state battery that are found in advance are prepared for a reference all-solid-state battery for before and after a test that causes deterioration to progress.
- the entry unit 15 accepts the combinations of measurement data and capacities of the reference all-solid-state battery from before and after the test that causes deterioration to progress.
- the entry unit 15 accepts entries that are measurement data, which is impedances at respective frequencies measured by the impedance method, of an estimation target all-solid-state battery whose capacity is unknown.
- a charging and discharging test is carried out to charge and discharge the estimation target all-solid-state battery, which is fabricated in a similar manner to the reference all-solid-state battery described above, under predetermined conditions (for example, 25°C, 0.1C), after which the SoC is adjusted to 50%, and AC impedance measurements are conducted at 25°C to obtain measurement data.
- predetermined conditions for example, 25°C, 0.1C
- the display unit 16 is, for example, a liquid crystal display and displays various kinds of information.
- the display unit 16 that is employed may be a touch panel and may also function as the entry unit 15.
- the communications interface 17 is an interface for communicating with other equipment and employs a standard such as, for example, Ethernet (registered trademark), Fiber Distributed Data Interface (FDDI), Wi-Fi (registered trademark) or the like.
- Ethernet registered trademark
- FDDI Fiber Distributed Data Interface
- Wi-Fi registered trademark
- a battery capacity in practice depends on the capacity of the active material itself and on battery resistance.
- the reason the battery resistance has an effect is that when the resistance is larger, over-voltages during charging and discharging are larger.
- an upper limit voltage may be reached during charging before a limit capacity of the active material is reached, and a lower limit voltage may be reached during discharging.
- the AC impedance method is a simple technique for measuring resistance of a battery.
- a Cole-Cole plot is illustrated in which real components of impedances obtained by this measurement method are plotted on the horizontal axis and imaginary components are plotted on the vertical axis.
- a curve with an arc shape caused by the resistance of battery reactions is obtained.
- a chord length of this arc may be used as an index of resistance of battery reactions.
- the resistance expressed as the arc chord length incorporates the effects of a rise in charge transfer resistance caused by the formation of a resistance layer at a boundary face between an active material and an electrolyte, a fall in contact area of the boundary face between the active material and the electrolyte, and a rise in ionic conduction resistance in the thickness direction of an electrode.
- the peak frequency decreases with the rise in charge transfer resistance but the peak frequency is substantially constant when the contact area and the ionic conduction resistance change. It is thought that a reason for the strong correlation between capacity and peak frequency is that a rise in charge transfer resistance caused by the formation of a resistance layer has a large effect contributing to a decrease in capacity, and thus charge transfer resistance strongly correlates with peak frequency.
- the CPU 11 of the state estimation device 10 executes the state estimation program 100 and functions as a first acquisition section 150, a derivation section 160, a second acquisition section 170, a computation section 180 and an estimation section 190.
- the first acquisition section 150 acquires measurement data and capacities of a reference all-solid-state battery.
- the measurement data is impedances at respective frequencies measured by the impedance method before and after a test that causes deterioration to progress.
- the capacities are found in advance.
- a Cole-Cole plot obtained from AC impedance measurements before a cycling test is illustrated in Fig. 3 .
- a relationship between peak frequencies of arcs and imaginary components of impedance is illustrated in Fig. 4 .
- the relationship in Fig. 3 may be expressed in the form of the following relationship between logarithms of frequency (represented by f) and absolute values of the imaginary components Z".
- Z " k log f 2 + l log f + m
- k, 1 and m are constants, which are found by the least squares method.
- is found to serve as the peak frequency x, which is used as the peak frequency from before the cycling test.
- a difference between the real components of points at the two ends of the arc that are closest to the real value axis in Fig. 3 is computed to serve as the arc chord length y, which serves as the arc chord length from before the cycling test.
- the second acquisition section 170 acquires measurement data of an estimation target rechargeable battery, which is impedances at respective frequencies measured by the impedance method.
- the computation section 180 computes a peak frequency from an arc-shaped curve in a graph plotting the impedances at the respective frequencies represented by the measurement data acquired by the second acquisition section 170.
- the estimation section 190 substitutes the peak frequency of the estimation target rechargeable battery into relational expression 1 and estimates the capacity of the estimation target rechargeable battery.
- the estimated capacity is displayed through the display unit 16.
- Fig. 6 is a flowchart showing a flow of state estimation processing by the state estimation device 10.
- the CPU 11 implements the state estimation processing by reading the state estimation program 100 from the storage 14, loading the state estimation program 100 to the RAM 13 and executing the state estimation program 100.
- Combinations for the reference all-solid-state battery from before and after the test that causes deterioration to progress, of the measurement data that is impedances at respective frequencies measured by the impedance method and the capacities that are found in advance, are entered into the state estimation device 10 and stored at the storage 14.
- the measurement data of the estimation target all-solid-state battery that is impedances at respective frequencies measured by the impedance method is also entered into the state estimation device 10 and stored at the storage 14.
- step S100 the CPU 11 serves as the first acquisition section 150 and acquires the measurement data of the reference all-solid-state battery that is impedances at respective frequencies measured by the impedance method before and after the test that causes deterioration to progress and capacities that are found in advance.
- step S102 the CPU 11 serves as the derivation section 160 and, in graphs plotting the impedances at respective frequencies represented by the measurement data acquired in step S 100, computes peak frequencies from arc-shaped curves.
- step S 106 the CPU 11 serves as the second acquisition section 170 and acquires the measurement data of the estimation target all-solid-state battery that is impedances at respective frequencies measured by the impedance method.
- step S108 the CPU 11 serves as the computation section 180 and, in a graph plotting the impedances at respective frequencies represented by the measurement data acquired in step S 106, computes a peak frequency from an arc-shaped curve.
- step S 110 the CPU 11 serves as the estimation section 190, uses relational expression 1 to estimate a capacity of the estimation target all-solid-state battery from the peak frequency of the estimation target all-solid-state battery, displays the estimated capacity with the display unit 16, and ends the state estimation processing.
- Cells with the same specifications as a reference all-solid-state battery were used as estimation target all-solid-state batteries, one cell being subjected to 300 cycles of a cycling test at 60°C, 1C (condition 1) and one cell being subjected to 300 cycles of the cycling test at 25°C, 1C (condition 2).
- Capacities w1, peak frequencies x1 and arc chord lengths y1 were acquired by methods the same as the methods described above for the first exemplary embodiment.
- Fig. 7 The relationship between measured values of peak frequency and capacity and the relationship between estimated values of peak frequency and capacity are illustrated in Fig. 7 . As can be seen in Fig. 7 , the capacities may be accurately estimated with the estimated values being close to the measured values.
- the state estimation device 10 finds a relational expression representing a relationship between peak frequencies and capacities, on the basis of peak frequencies computed for before and after the test that causes deterioration of a reference all-solid-state battery to progress, and capacities that are found in advance.
- the state estimation device 10 uses the relational expression to estimate a capacity of an estimation target all-solid-state battery from a peak frequency computed from an arc chord length in a graph plotting impedances at respective frequencies represented by acquired measurement data of the estimation target all-solid-state battery.
- the capacity of the all-solid-state battery may be estimated with consideration for physical deterioration.
- a state estimation device has similar structures to the first exemplary embodiment, and is accordingly described with the same reference symbols being assigned.
- Fig. 1 is a block diagram showing hardware structures of the state estimation device 10 according to the second exemplary embodiment.
- the state estimation device 10 includes the CPU 11, the ROM 12, the RAM 13, the storage 14, the entry unit 15, the display unit 16 and the communications interface 17.
- the entry unit 15 accepts, before and after a test that causes deterioration of a reference all-solid-state battery to progress in accordance with chemical changes, measurement data that is impedances at respective frequencies measured by the impedance method.
- an all-solid-state battery structured with a positive electrode layer, a solid-state electrolyte layer and a negative electrode layer is fabricated in the same manner as in the first exemplary embodiment.
- the fabricated battery is conditioned by charging and discharging under predetermined conditions. Subsequently, the SoC is adjusted to 50%, and AC impedance measurements are conducted at 25°C.
- the battery is charged to SoC 100% at 60°C, and the voltage is held for 48 hours at 100% SoC. Subsequently, the SoC is adjusted to 50% and AC impedance measurements are carried out at 25°C. The same procedure is repeated, and respective AC impedance measurements are carried out for total holding durations of 120 hours and 240 hours.
- measurement data which is impedances at respective frequencies measured by the impedance method before and after a test that causes deterioration to progress in accordance with chemical changes is prepared for a reference all-solid-state battery.
- the entry unit 15 receives the measurement data of the reference all-solid-state battery from before and after the test that causes deterioration to progress in accordance with chemical changes.
- the entry unit 15 accepts entries that are measurement data, which is impedances at respective frequencies measured by the impedance method, of an estimation target all-solid-state battery whose capacity is unknown.
- a charging and discharging test is carried out to charge and discharge the estimation target all-solid-state battery, which is fabricated in a similar manner to the reference all-solid-state battery described above, under predetermined conditions, after which the SoC is adjusted to 50% and AC impedance measurements are conducted at 25°C to obtain the measurement data.
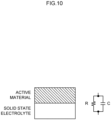
- an impedance caused by a charge transfer reaction at a boundary face between an active material and a solid-state electrolyte may be considered as an equivalent circuit constituted by a parallel circuit of a resistance R and a capacitance C that is shown in Fig. 10 , which depicts the boundary face schematically.
- the arc chord length corresponds with the value of R and the peak frequency (which is referred to as the characteristic frequency) corresponds with 1/(2 ⁇ RC).
- the resistance R corresponds with a resistance associated with the charge transfer reaction, and is a portion of resistance of the battery.
- the resistance R of the boundary surface increases, as a result of which the peak frequency 1/(2 ⁇ RC) decreases.
- the value of C may change in association with changes in the chemical state of the boundary face.
- the peak frequency changes little in association with deterioration. Therefore, the effect of changes in C is thought to be limited.
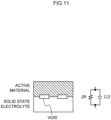
- FIG. 11 A state in which a contact proportion of the boundary face between the electrolyte and the solid-state electrode has decreased is schematically shown in Fig. 11 .
- the contact proportion falls by half, the resistance R of the equivalent circuit doubles, while the capacitance C halves.
- the peak frequency 1/(2 ⁇ RC) is unchanged but the arc chord length is doubled.
- FIG. 12 A conceptual image of a fall in ionic conductance associated with the formation of voids in an electrode and a solid-state electrolyte is shown in Fig. 12 .
- active material particles and solid-state electrolyte particles are mixed and pressed in an electrode layer, producing a state in which the active material is dispersed in the solid-state electrolyte, forming a three-dimensional network.
- a conductive material such as conductive carbon or the like may also be included in order to improve electron conductivity and a binder may be included in order to improve binding strength.
- An equivalent circuit of impedance at a boundary face between an electrode and a solid-state electrolyte may be understood as a circuit in which, as shown in Fig.
- resistances r CT and capacitances c are connected up in a ladder pattern in the thickness direction with lithium ion resistances r i disposed therebetween.
- a single arc due to charge transfer resistance appears in a Cole-Cole plot.
- a value of the chord length of the arc is influenced by the charge transfer resistance and the lithium ion resistance.
- the lithium ion resistance r i can be expected to increase, in which case the arc chord length increases with the increase in the lithium ion resistance r i .
- the peak frequency is substantially constant.
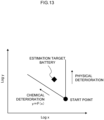
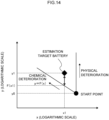
- a plot (identified as (x1, y1)) of an all-solid-state battery that is an estimation target is compared with the straight line representing chemical deterioration by comparison of y1 and F(x1) as illustrated in Fig. 14 .
- the difference between F(x1) and y0 may be theoretically understood as the contribution of chemical deterioration, and the difference between y1 and F(x1) as the contribution of physical deterioration. Therefore, a judgment more credibly based in theory may be made.
- a value y1/F(x1) that is y1 divided by F(x1) may be regarded as an index indicating a ratio of increase in resistance due to the contribution of physical deterioration. It may be possible to repair physical deterioration by putting a separated boundary face back into contact by re-pressing the battery. As a result, it should be possible to reduce a resistance that has risen to y1 down to F(x1).
- Fig. 15 Cole-Cole plots for respective holding durations in this test are shown in Fig. 15 , in which the real components of obtained impedances are plotted on the horizontal axis and the imaginary components are plotted on the vertical axis.
- Graphs in which frequencies are plotted on the horizontal axis and imaginary components of impedance are plotted on the vertical axis are shown in Fig. 16 . From Fig. 15 , it can be seen that arc-shaped curves thought to be due to charging and discharging reactions are apparent and that the arcs become larger with the holding duration. From Fig. 16 , it can be seen that the peak frequency decreases with increasing holding duration.
- the charging and discharging reactions that contribute to these arcs are respective reactions at the positive electrode and the negative electrode.
- the reactions at the positive electrode and negative electrode are each constituted by plural elementary reactions and that each arc is the sum of these reactions.
- this may be regarded as approximating a single curve, in which case the extent of physical deterioration at the whole of the positive electrode and negative electrode can be estimated.
- the arcs may be clearly separated, depending on electrode materials and the like, in which case similar operations may be conducted for the respective arcs and an amount of physical deterioration relating to the elemental reactions may be estimated.
- the CPU 11 by executing the state estimation program 100, the CPU 11 functions as the first acquisition section 150, the derivation section 160, the second acquisition section 170, the computation section 180 and the estimation section 190.
- the first acquisition section 150 acquires the measurement data of the reference all-solid-state battery, which is impedances at respective frequencies measured by the impedance method before and after the test that causes deterioration to progress in accordance with chemical changes.
- the terms k, l and m in a relational expression between logarithms of the frequencies f and the imaginary components Z" are found by the least squares method, and the frequency f that produces the greatest value of
- a difference between the real components of points at the two ends of each arc that are closest to the real value axis in the above-described Fig. 3 is computed to serve as the arc chord length y.
- log x and log y have a linear relationship ( Fig. 17 ), and a relational expression is obtained by the least squares method.
- log y b ⁇ logx + c
- the second acquisition section 170 acquires measurement data of an estimation target rechargeable battery, which is impedances at respective frequencies measured by the impedance method.
- the computation section 180 computes a peak frequency and arc chord length from an arc-shaped curve in a graph plotting the impedances at the respective frequencies represented by the measurement data acquired by the second acquisition section 170.
- the estimation section 190 uses relational expression 2 to estimate a degree of physical deterioration of the estimation target rechargeable battery.
- the estimated degree of physical deterioration is displayed through the display unit 16.
- a value y1/y2 in which y1 is divided by y2 is computed to serve as the degree of physical deterioration. Then, if y1/y2 is at least a pre-specified judgment reference value, re-pressing is judged to be necessary. If y1/y2 is less than the judgment reference value, re-pressing is judged to not be necessary. The result of this judgment is displayed at the display unit 16.
- Fig. 18 is a flowchart showing a flow of state estimation processing by the state estimation device 10.
- the CPU 11 implements the state estimation processing by reading the state estimation program 100 from the storage 14, loading the state estimation program 100 to the RAM 13 and executing the state estimation program 100.
- Measurement data of the reference all-solid-state battery that is impedances at respective frequencies measured by the impedance method before and after the test is entered into the state estimation device 10 and stored at the storage 14.
- the measurement data of the estimation target all-solid-state battery that is impedances at respective frequencies measured by the impedance method is also entered into the state estimation device 10 and stored at the storage 14.
- step S200 the CPU 11 serves as the first acquisition section 150 and acquires the measurement data of the reference all-solid-state battery that is impedances at respective frequencies measured by the impedance method before and after the test that causes deterioration to progress in accordance with chemical changes.
- step S202 the CPU 11 serves as the derivation section 160 and, in graphs plotting the impedances at respective frequencies represented by the measurement data acquired in step S200, computes peak frequencies and arc chord lengths from arc-shaped curves.
- step S206 the CPU 11 serves as the second acquisition section 170 and acquires the measurement data of the estimation target all-solid-state battery that is impedances at respective frequencies measured by the impedance method.
- step S208 the CPU 11 serves as the computation section 180 and, in a graph plotting the impedances at respective frequencies represented by the measurement data acquired in step S206, computes a peak frequency and arc chord length from an arc-shaped curve.
- step S210 the CPU 11 serves as the estimation section 190, uses relational expression 2 to estimate a degree of physical change of the estimation target all-solid-state battery from the peak frequency and arc chord length of the estimation target all-solid-state battery, displays the estimated degree of physical change with the display unit 16, and ends the state estimation processing.
- the state estimation device 10 finds a relational expression representing a relationship between peak frequencies and arc chord lengths on the basis of peak frequencies and arc chord lengths computed before and after the test that causes deterioration of a reference all-solid-state battery to progress, and the state estimation device 10 uses the relational expression to estimate a state of an estimation target all-solid-state battery from an arc chord length and a peak frequency computed from an arc chord length in a graph plotting impedances at respective frequencies represented by acquired measurement data of the estimation target all-solid-state battery.
- physical deterioration may be considered and a degree of physical deterioration of the all-solid-state battery may be estimated.
- a relational expression representing a relationship between peak frequencies and capacities is obtained and the relational expression is used to estimate a capacity of an estimation target all-solid-state battery
- this is not limiting.
- a trained model which is a neural network or the like that inputs a peak frequency and outputs a capacity may be obtained, and the trained model may be used to estimate a capacity of an estimation target all-solid-state battery.
- a relational expression representing a relationship between peak frequencies and arc chord lengths is obtained and the relational expression is used to estimate a degree of physical deterioration of an estimation target all-solid-state battery
- a trained model which is a neural network or the like that inputs a peak frequency and outputs an arc chord length may be obtained, and the trained model may be used to estimate a degree of physical deterioration of an estimation target all-solid-state battery.
- the CPU 11 reads and executes software (a program) but various processes may be executed by various kinds of processor other than a CPU.
- processors in these cases include a PLD (programmable logic device) in which a circuit configuration can be modified after manufacturing, such as an FPGA (field programmable gate array) or the like, a dedicated electronic circuit which is a processor with a circuit configuration that is specially designed to execute specific processing, such as an ASIC (application-specific integrated circuit) or the like, and so forth.
- the processing described above may be executed by one of these various kinds of processors, and may be executed by a combination of two or more processors of the same or different kinds (for example, plural FPGAs, a combination of a CPU with an FPGA, or the like).
- Hardware structures of these various kinds of processors are, to be more specific, electronic circuits combining circuit components such as semiconductor components and the like.
- a program is memorized in advance (installed) on a computer readable non-transitory recording medium.
- the state estimation program 100 of the state estimation device 10 is memorized in advance at the storage 14.
- a program may be provided in a mode of being recorded on a non-transitory recording medium such as a CD-ROM (compact disc read-only memory), DVD-ROM (digital versatile disc read-only memory), USB (universal serial bus) memory or the like.
- Modes are also possible in which a program is downloaded from external equipment via a network.
Landscapes
- Physics & Mathematics (AREA)
- General Physics & Mathematics (AREA)
- Chemical & Material Sciences (AREA)
- Engineering & Computer Science (AREA)
- Electrochemistry (AREA)
- Chemical Kinetics & Catalysis (AREA)
- Manufacturing & Machinery (AREA)
- General Chemical & Material Sciences (AREA)
- Materials Engineering (AREA)
- Mathematical Physics (AREA)
- Secondary Cells (AREA)
- Tests Of Electric Status Of Batteries (AREA)
- Life Sciences & Earth Sciences (AREA)
- Sustainable Development (AREA)
- Sustainable Energy (AREA)
Abstract
Description
- The present disclosure relates to a state estimation method, a state estimation device, and a recording medium recording a program.
- In recent years, applications of rechargeable batteries in electric vehicles and the like have rapidly expanded. Reusing rechargeable batteries that have been used for vehicles as rechargeable batteries for fixed equipment and the like is increasingly important from the perspective of effective utilization of natural resources and the like. When a rechargeable battery is to be reused, its state of deterioration must be accurately determined in order to judge whether or not reuse is possible. Technologies have been disclosed that estimate states of deterioration of lithium-ion batteries (for example, Japanese Patent Application Laid-Open (
JP-A) Nos. 2021-140991 2020-167069 WO2012/095913 ). -
JP-A No. 2021-140991 JP-A No. 2020-167069 WO2012/095913 disclose methods that use alternating current (AC) impedance methods to analyze states of deterioration. - In recent years, there have been expectations for all-solid-state batteries, which utilize solid-state electrolytes as their electrolytes, to be employed as high-performance rechargeable batteries in place of liquid-based lithium-ion batteries. Similarly to conventional liquid-based lithium-ion batteries, effective utilization through reuse of used all-solid-state batteries is important.
- Deterioration due to charging and discharging of a rechargeable battery includes chemical deterioration, in which battery performance declines due to chemical side reactions of structural materials such as an active material, a solid-state electrolyte and the like, and physical deterioration, in which battery performance declines due to weakening contact between structural materials resulting from expansion and contraction of an active material and the like. Physical deteriorations such as cracks forming between an active material and a solid-state electrolyte and between one solid-state electrolyte and another solid-state electrolyte are important factors in the deterioration of all-solid-state batteries.
- In the method recited in
WO2012/095913 , estimating a state of deterioration from a resistance value obtained by an AC impedance method is disclosed. In general, the higher a resistance value, the lower a battery capacity is estimated to be. However, a relationship between resistance values and battery capacities is not always clear. Particularly with an all-solid-state battery, it may not be possible to estimate a battery capacity accurately. -
JP-A No. 2021-140991 JP-A No. 2020-167079 - Thus, in
JP-A Nos. 2021-140991 2020-167069 WO2012/095913 , no consideration is given to physical deteriorations that are particular to all-solid-state batteries, such as cracks forming between an active material and a solid-state electrolyte or between solid-state electrolytes, and so forth. - An object of the present disclosure is to provide a state estimation method, a state estimation device and a program that may estimate a state of a rechargeable battery employing a solid-state electrolyte with consideration for physical deterioration.
- A first aspect is a state estimation method for estimating a state of a rechargeable battery that uses a solid-state electrolyte, the state estimation method including: acquiring measurement data and states of a reference rechargeable battery before and after a test that causes deterioration to progress, the measurement data being impedances at respective frequencies that are measured by an impedance method, and the states being found in advance; computing peak frequencies before and after the test from arc-shaped curves in graphs plotting the impedances at the respective frequencies represented by the measurement data; based on the computed peak frequencies before and after the test and the states found in advance, obtaining a model that represents a relationship between the peak frequencies and the states; acquiring measurement data of an estimation target rechargeable battery, the measurement data being impedances at respective frequencies that are measured by the impedance method; computing a peak frequency from an arc-shaped curve in a graph plotting the impedances at the respective frequencies represented by the measurement data; and estimating a state of the estimation target rechargeable battery from the peak frequency of the estimation target rechargeable battery, the estimating including using the model.
- In the state estimation method according to the first aspect, the measurement data and states found in advance of the reference rechargeable battery are acquired. The measurement data is impedances at respective frequencies, measured by the impedance method before and after the test that causes deterioration to progress. Examples of the "test that causes deterioration to progress" include a cycling test in which charging and discharging of the rechargeable battery is repeated under predetermined conditions, a test that holds the rechargeable battery at a constant state of charge, and so forth.
- The peak frequencies before and after the test are computed from arc-shaped curves in the graphs plotting the impedances at the respective frequencies represented by the measurement data. The meaning of the term "graph" as used herein is intended to include a graph plotting the impedances for the respective frequencies with real components of the impedances on a horizontal axis and imaginary components of the impedances on a vertical axis. The meaning of the term "peak frequency" as used herein is intended to include a frequency that produces a peak on the arc-shaped curve of the graph, at which absolute values of the imaginary values are at a maximum.
- On the basis of the computed peak frequencies and the states found in advance from before and after the test, a model representing the relationship between peak frequencies and states is obtained. Hence, for an estimation target rechargeable battery, measurement data is acquired, which is impedances at respective frequencies measured by the impedance method, and a peak frequency is computed from an arc-shaped curve in a graph plotting the impedances at the respective frequencies represented by this measurement data. Using the model, the state of the estimation target rechargeable battery is then estimated from the peak frequency of the estimation target rechargeable battery.
- In this state estimation method, the model representing the relationship between peak frequencies and states is found on the basis of the peak frequencies computed for before and after the test that causes deterioration of the reference rechargeable battery to progress and the states that are found in advance. The peak frequency of the estimation target rechargeable battery is computed from the arc-shaped curve in the graph plotting the impedances at the respective frequencies represented by the measurement data acquired for the estimation target rechargeable battery. Because the model is used to estimate the state of the estimation target rechargeable battery from this peak frequency, the state of a rechargeable battery employing a solid-state electrolyte may be estimated with consideration for physical deterioration.
- In a state estimation method according to a second aspect, in the state estimation method according to the first aspect, the states are capacities.
- In the state estimation method according to the second aspect, a model representing a relationship between peak frequencies and capacities is found on the basis of the peak frequencies computed for before and after the test that causes deterioration of the reference rechargeable battery to progress and capacities that are found in advance. The peak frequency of the estimation target rechargeable battery is computed from the arc-shaped curve in the graph plotting the impedances at the respective frequencies represented by the measurement data acquired for the estimation target rechargeable battery. The model is used to estimate a capacity of the estimation target rechargeable battery from this peak frequency. Therefore, the capacity of a rechargeable battery employing a solid-state electrolyte may be estimated with consideration for physical deterioration.
- In a state estimation method according to a third aspect, in the state estimation method according to the second aspect, the model is a relational expression w=F(x) representing a relationship between peak frequencies x and capacities w.
- In the state estimation method according to the third aspect, the relational expression w=F(x) representing the relationship between peak frequencies x and capacities w is found on the basis of the peak frequencies computed for before and after the test that causes deterioration of the reference rechargeable battery to progress and the states that are found in advance. The peak frequency of the estimation target rechargeable battery is computed from the arc-shaped curve in the graph plotting the impedances at the respective frequencies represented by the measurement data acquired for the estimation target rechargeable battery. The relational expression w=F(x) is used to estimate a state of the estimation target rechargeable battery from this peak frequency. Therefore, the capacity of a rechargeable battery employing a solid-state electrolyte may be estimated accurately by using the relational expression w=F(x) representing the relationship between peak frequencies x and capacities w.
- In a state estimation method according to a fourth aspect, in the state estimation method according to the third aspect, the relational expression w=F(x) includes a term a·logx and a term b, a and b being constants.
- In the state estimation method according to the fourth aspect, the relational expression w=F(x) representing the relationship between peak frequencies x and capacities w includes the term a·logx and the term b. Consequently, the state of a rechargeable battery employing a solid-state electrolyte may be estimated more accurately.
- A fifth aspect is a state estimation method for estimating a state of a rechargeable battery that uses a solid-state electrolyte, the state estimation method including: acquiring measurement data of a reference rechargeable battery before and after a test that causes deterioration to progress, the measurement data being impedances at respective frequencies that are measured by an impedance method; computing peak frequencies and arc chord lengths before and after the test from arc-shaped curves in graphs plotting the impedances at the respective frequencies represented by the measurement data; basedon the computed peak frequencies and the arc chord lengths before and after the test, obtaining a model that represents a relationship between the peak frequencies and the arc chord lengths; acquiring measurement data of an estimation target rechargeable battery, the measurement data being impedances at respective frequencies that are measured by the impedance method; computing a peak frequency and an arc chord length from an arc-shaped curve in a graph plotting the impedances at the respective frequencies represented by the measurement data; and estimating a state of the estimation target rechargeable battery from the peak frequency and an arc chord length of the estimation a target rechargeable battery, the estimating including using the model.
- In the state estimation method according to the fifth aspect, the measurement data of the reference rechargeable battery, which is impedances at respective frequencies measured by the impedance method before and after the test that causes deterioration to progress, is acquired. The peak frequencies and arc chord lengths before and after the test are computed from arc-shaped curves in graphs plotting the impedances at the respective frequencies represented by the measurement data. The meaning of the term "arc chord length" as used herein is not strictly necessarily a mathematical chord length and may include, for example, a difference between the real components of respective points that are closest to the real axis approximately at the two ends of an arc-shaped curve in a graph.
- On the basis of the computed peak frequencies and arc chord lengths from before and after the test, a model representing the relationship between peak frequencies and arc chord lengths is obtained. For an estimation target rechargeable battery, measurement data that is impedances at respective frequencies measured by the impedance method is acquired.
- A peak frequency and arc chord length are computed from an arc-shaped curve in a graph plotting the impedances at the respective frequencies represented by this measurement data. Using the model, the state of the estimation target rechargeable battery is estimated from the peak frequency and arc chord length of the estimation target rechargeable battery.
- In this state estimation method, the model representing the relationship between peak frequencies and arc chord lengths is found on the basis of the peak frequencies and arc chord lengths computed for before and after the test that causes deterioration of the reference rechargeable battery to progress. The peak frequency and arc chord length of the estimation target rechargeable battery are computed from the arc-shaped curve in the graph plotting the impedances at the respective frequencies represented by the measurement data acquired for the estimation target rechargeable battery. Because the model is used to estimate the state of the estimation target rechargeable battery from this peak frequency and arc chord length, the state of a rechargeable battery employing a solid-state electrolyte may be estimated with consideration for physical deterioration.
- In a state estimation method according to a sixth aspect, in the state estimation method according to the fifth aspect, the test is a test that causes deterioration in accordance with chemical change to progress, the state is a degree of physical deterioration, the model is a relational expression y=F(x) representing a relationship between peak frequencies x and arc chord lengths y, and the degree of physical deterioration of the estimation target rechargeable battery is estimated based on a comparison between the peak frequency and the arc chord length of the estimation target rechargeable battery and the relational expression y=F(x).
- In the state estimation method according to the sixth aspect, the relational expression y=F(x) representing the relationship between peak frequencies x and arc chord lengths y is found on the basis of the peak frequencies and arc chord lengths computed for before and after the test that causes deterioration of the reference rechargeable battery to progress in accordance with chemical change. The peak frequency and arc chord length of the estimation target rechargeable battery are computed from the arc-shaped curve in the graph plotting the impedances at the respective frequencies represented by the measurement data acquired for the estimation target rechargeable battery. The degree of physical deterioration of the estimation target rechargeable battery is estimated on the basis of a comparison of the computed peak frequency and arc chord length with the relational expression y=F(x). Therefore, the degree of physical deterioration of a rechargeable battery employing a solid-state electrolyte may be estimated.
- In a state estimation method according to a seventh aspect, in the state estimation method according to the sixth aspect, estimating the degree of physical deterioration of the estimation target rechargeable battery includes estimating the degree of physical deterioration based on a comparison between an arc chord length y1 of the estimation target rechargeable battery and an arc chord length y2 that is obtained by substituting a peak frequency x1 of the estimation target rechargeable battery into the relational expression y=F(x).
- In the state estimation method according to the seventh aspect, the arc chord length y2 is obtained by substituting the peak frequency x1 of the estimation target rechargeable battery into the relational expression y=F(x), and the degree of physical deterioration of the estimation target rechargeable battery is estimated on the basis of a comparison between the arc chord length y1 of the estimation target rechargeable battery and the arc chord length y2. Therefore, the degree of physical deterioration of a rechargeable battery employing a solid-state electrolyte may be estimated accurately.
- In a state estimation method according to an eighth aspect, in the state estimation method according to the seventh aspect, the relational expression y=F(x) includes a term axb, a and b being constants.
- In the state estimation method according to the eighth aspect, the relational expression y=F(x) representing the relationship between peak frequencies x and arc chord lengths y includes the term axb, in which a and b are constants. Consequently, the degree of physical deterioration of a rechargeable battery employing a solid-state electrolyte may be estimated more accurately.
- In a state estimation method according to a ninth aspect, in the state estimation method according to any one of the sixth to eighth aspects, the test that causes deterioration in accordance with chemical change to progress is a test that holds a constant voltage in a charged state.
- In the state estimation method according to the ninth aspect, the test that holds the reference rechargeable battery at a constant voltage in the charged state and causes deterioration of the reference rechargeable battery to progress in accordance with chemical changes is conducted, and the measurement data that is impedances at respective frequencies measured by the impedance method is acquired. Therefore, the relational expression y=F(x) representing the relationship between peak frequencies x and arc chord lengths y may be found accurately.
- A tenth aspect is a state estimation device that estimates a state of a rechargeable battery that uses a solid-state electrolyte, the state estimation device including: a first acquisition section that acquires measurement data and states of a reference rechargeable battery before and after a test that causes deterioration to progress, the measurement data being impedances at respective frequencies that are measured by an impedance method, and the states being found in advance; a derivation section that computes peak frequencies before and after the test from arc-shaped curves in graphs plotting the impedances at the respective frequencies represented by the measurement data and, based on the computed peak frequencies before and after the test and the states found in advance, obtains a model that represents a relationship between the peak frequencies and the states; a second acquisition section that acquires measurement data of an estimation target rechargeable battery, the measurement data being impedances at respective frequencies that are measured by the impedance method; a computation section that computes a peak frequency from an arc-shaped curve in a graph plotting the impedances at the respective frequencies represented by the measurement data; and an estimation section that uses the model to estimate a state of the estimation target rechargeable battery from the peak frequency of the estimation target rechargeable battery.
- In the state estimation device according to the tenth aspect, the first acquisition section acquires the measurement data and states found in advance of the reference rechargeable battery. The measurement data is impedances at respective frequencies, measured by the impedance method before and after the test that causes deterioration to progress.
- The derivation section computes peak frequencies before and after the test from arc-shaped curves in graphs plotting the impedances at the respective frequencies represented by the measurement data. On the basis of the computed peak frequencies and the states found in advance from before and after the test, the computation section obtains a model representing the relationship between peak frequencies and states.
- The second acquisition section acquires measurement data for the estimation target rechargeable battery that is impedances at respective frequencies measured by the impedance method. The computation section computes a peak frequency from an arc-shaped curve in a graph plotting the impedances at the respective frequencies represented by this measurement data. The estimation section then uses the model to estimate the state of the estimation target rechargeable battery from the peak frequency of the estimation target rechargeable battery.
- In this state estimation device, the model representing the relationship between peak frequencies and states is found on the basis of the peak frequencies computed for before and after the test that causes deterioration of the reference rechargeable battery to progress and the states that are found in advance. The peak frequency of the estimation target rechargeable battery is computed from the arc-shaped curve in the graph plotting the impedances at the respective frequencies represented by the measurement data acquired for the estimation target rechargeable battery. Because the model is used to estimate the state of the estimation target rechargeable battery from this peak frequency, the state of a rechargeable battery employing a solid-state electrolyte may be estimated with consideration for physical deterioration.
- An eleventh aspect is a state estimation device that estimates a state of a rechargeable battery that uses a solid-state electrolyte, the state estimation device including: a first acquisition section that acquires measurement data of a reference rechargeable battery before and after a test that causes deterioration to progress, the measurement data being impedances at respective frequencies that are measured by an impedance method; a derivation section that computes peak frequencies and arc chord lengths before and after the test from arc-shaped curves in graphs plotting the impedances at the respective frequencies represented by the measurement data and, based on the computed peak frequencies and the arc chord lengths before and after the test, obtains a model that represents a relationship between the peak frequencies and the arc chord lengths; a second acquisition section that acquires measurement data of an estimation target rechargeable battery, the measurement data being impedances at respective frequencies that are measured by the impedance method; a computation section that computes a peak frequency and an arc chord length from an arc-shaped curve in a graph plotting the impedances at the respective frequencies represented by the measurement data; and an estimation section that uses the model to estimate a state of the estimation target rechargeable battery from the peak frequency and an arc chord length of the estimation target rechargeable battery.
- In the state estimation device according to the eleventh aspect, the first acquisition section acquires the measurement data of the reference rechargeable battery. The measurement data is impedances at respective frequencies, measured by the impedance method before and after the test that causes deterioration to progress.
- The derivation section computes peak frequencies and arc chord lengths before and after the test from arc-shaped curves in graphs plotting the impedances at the respective frequencies represented by the measurement data. On the basis of the computed peak frequencies and arc chord lengths from before and after the test, the computation section obtains a model representing the relationship between peak frequencies and arc chord lengths.
- The second acquisition section acquires measurement data for the estimation target rechargeable battery that is impedances at respective frequencies measured by the impedance method. The computation section computes a peak frequency and arc chord length from an arc-shaped curve in a graph plotting the impedances at the respective frequencies represented by this measurement data. The estimation section uses the model to estimate the state of the estimation target rechargeable battery from the peak frequency and arc chord length of the estimation target rechargeable battery.
- In this state estimation device, the model representing the relationship between peak frequencies and arc chord lengths is found on the basis of the peak frequencies and arc chord lengths computed for before and after the test that causes deterioration of the reference rechargeable battery to progress. The peak frequency and arc chord length for the estimation target rechargeable battery are computed from the arc-shaped curve in the graph plotting the impedances at the respective frequencies represented by the measurement data acquired for the estimation target rechargeable battery. Because the model is used to estimate the state of the estimation target rechargeable battery from this peak frequency and arc chord length, the state of a rechargeable battery employing a solid-state electrolyte may be estimated with consideration for physical deterioration.
- A twelfth aspect is a program stored at a non-transitory storage medium, which program is for estimating a state of a rechargeable battery that uses a solid-state electrolyte, the program being executable by a computer to perform processing, the processing including: acquiring measurement data and states of a reference rechargeable battery before and after a test that causes deterioration to progress, the measurement data being impedances at respective frequencies that are measured by an impedance method, and the states being found in advance; computing peak frequencies before and after the test from arc-shaped curves in graphs plotting the impedances at the respective frequencies represented by the measurement data; based on the computed peak frequencies before and after the test and the states found in advance, obtaining a model that represents a relationship between the peak frequencies and the states; acquiring measurement data of an estimation target rechargeable battery, the measurement data being impedances at respective frequencies that are measured by the impedance method; computing a peak frequency from an arc-shaped curve in a graph plotting the impedances at the respective frequencies represented by the measurement data; and estimating a state of the estimation target rechargeable battery from the peak frequency of the estimation target rechargeable battery, the estimating including using the model.
- A computer executing the program stored at the non-transitory storage medium according to the twelfth aspect acquires the measurement data and states found in advance of the reference rechargeable battery. The measurement data is impedances at respective frequencies, measured by the impedance method before and after the test that causes deterioration to progress. The computer computes peak frequencies before and after the test from arc-shaped curves in graphs plotting the impedances at the respective frequencies represented by the measurement data. On the basis of the computed peak frequencies and the states found in advance from before and after the test, the computer obtains a model representing the relationship between peak frequencies and states. The computer acquires measurement data for the estimation target rechargeable battery that is impedances at respective frequencies measured by the impedance method. The computer computes a peak frequency from an arc-shaped curve in a graph plotting the impedances at the respective frequencies represented by this measurement data. The computer uses the model to estimate the state of the estimation target rechargeable battery from the peak frequency of the estimation target rechargeable battery.
- In this program, the model representing the relationship between peak frequencies and states is found on the basis of the peak frequencies computed for before and after the test that causes deterioration of the reference rechargeable battery to progress and the states that are found in advance. The peak frequency of the estimation target rechargeable battery is computed from the arc-shaped curve in the graph plotting the impedances at the respective frequencies represented by the measurement data acquired for the estimation target rechargeable battery. Because the model is used to estimate the state of the estimation target rechargeable battery from this peak frequency, the state of a rechargeable battery employing a solid-state electrolyte may be estimated with consideration for physical deterioration.
- A thirteenth aspect is a program stored at a non-transitory storage medium, which program is for estimating a state of a rechargeable battery that uses a solid-state electrolyte, the program being executable by a computer to perform processing, the processing including: acquiring measurement data of a reference rechargeable battery before and after a test that causes deterioration to progress, the measurement data being impedances at respective frequencies that are measured by an impedance method; computing peak frequencies and arc chord lengths before and after the test from arc-shaped curves in graphs plotting the impedances at the respective frequencies represented by the measurement data; based on the computed peak frequencies and the arc chord lengths before and after the test, obtaining a model that represents a relationship between the peak frequencies and the arc chord lengths; acquiring measurement data of an estimation target rechargeable battery, the measurement data being impedances at respective frequencies that are measured by the impedance method; computing a peak frequency and an arc chord length from an arc-shaped curve in a graph plotting the impedances at the respective frequencies represented by the measurement data; and estimating a state of the estimation target rechargeable battery from the peak frequency and an arc chord length of the estimation target rechargeable battery, the estimating including using the model.
- A computer executing the program stored at the non-transitory storage medium according to the thirteenth aspect acquires the measurement data of the reference rechargeable battery. The measurement data is impedances at respective frequencies, measured by the impedance method before and after the test that causes deterioration to progress. The computer computes peak frequencies and arc chord lengths before and after the test from arc-shaped curves in graphs plotting the impedances at the respective frequencies represented by the measurement data. On the basis of the computed peak frequencies and arc chord lengths from before and after the test, the computer obtains a model representing the relationship between peak frequencies and arc chord lengths. The computer acquires measurement data for the estimation target rechargeable battery that is impedances at respective frequencies measured by the impedance method. The computer computes a peak frequency and arc chord length from an arc-shaped curve in a graph plotting the impedances at the respective frequencies represented by this measurement data. The computer uses the model to estimate the state of the estimation target rechargeable battery from the peak frequency and arc chord length of the estimation target rechargeable battery.
- In this program, the model representing the relationship between peak frequencies and arc chord lengths is found on the basis of the peak frequencies and arc chord lengths computed for before and after the test that causes deterioration of the reference rechargeable battery to progress. The peak frequency and arc chord length of the estimation target rechargeable battery are computed from the arc-shaped curve in the graph plotting the impedances at the respective frequencies represented by the measurement data acquired for the estimation target rechargeable battery. Because the model is used to estimate the state of the estimation target rechargeable battery from this peak frequency and arc chord length, the state of a rechargeable battery employing a solid-state electrolyte may be estimated with consideration for physical deterioration.
- According to the present disclosure, a state of a rechargeable battery employing a solid-state electrolyte may be estimated with consideration for physical deterioration.
- Exemplary embodiments of the present disclosure will be described in detail based on the following figures, wherein:
-
Fig. 1 is a schematic block diagram of an example of a computer that functions as a state estimation device according to a present exemplary embodiment; -
Fig. 2 is a block diagram showing functional structures of the state estimation device according to the present exemplary embodiment; -
Fig. 3 is a diagram showing an example of a graph plotting impedances at respective frequencies; -
Fig. 4 is a diagram describing a peak frequency; -
Fig. 5 is a graph showing a relationship between peak frequencies and capacities; -
Fig. 6 is a flowchart showing a flow of state estimation processing that is executed at a state estimation device according to a first exemplary embodiment; -
Fig. 7 is a graph showing a relationship between peak frequencies and capacities in Example 1; -
Fig. 8 is a graph showing a relationship between arc chord lengths and capacities in Example 1; -
Fig. 9 is a graph showing a relationship between peak frequencies and capacities in Example 1; -
Fig. 10 is a diagram schematically showing a boundary face between an active material and a solid-state electrolyte; -
Fig. 11 is a diagram schematically showing a state in which a contact proportion between the active material and the solid-state electrolyte has decreased; -
Fig. 12 is a diagram showing an equivalent circuit of impedance at a boundary face between an active material and a solid-state electrolyte; -
Fig. 13 is a graph showing a relationship between peak frequencies and arc chord lengths; -
Fig. 14 is a diagram describing a method for estimating a degree of physical deterioration through a comparison with a straight line representing a relationship between peak frequencies and arc chord lengths; -
Fig. 15 is a diagram showing an example of a graph plotting impedances at respective frequencies for total holding durations; -
Fig. 16 is a graph showing a relationship between frequencies and imaginary components of impedances; -
Fig. 17 is a graph showing a relationship between peak frequencies and arc chord lengths; -
Fig. 18 is a flowchart showing a flow of state estimation processing that is executed at a state estimation device according to a second exemplary embodiment; and -
Fig. 19 is a graph showing a relationship between peak frequencies and arc chord lengths in Example 2. -
Fig. 1 is a block diagram showing hardware structures of astate estimation device 10 according to a first exemplary embodiment. - As shown in
Fig. 1 , thestate estimation device 10 includes a central processing unit (CPU) 11, read-only memory (ROM) 12, random access memory (RAM) 13,storage 14, anentry unit 15, adisplay unit 16 and acommunications interface 17. These structures are connected to be capable of communicating with one another via abus 19. TheCPU 11 is an example of a processor, and theRAM 13 is an example of memory. - The
CPU 11 is a central arithmetic processing unit that executes various programs and controls respective parts. That is, theCPU 11 reads a program from theROM 12 or thestorage 14, and executes the program using theRAM 13 as a workspace. TheCPU 11 performs control of the structures described above and various kinds of computational processing and the like in accordance with programs memorized in theROM 12 or thestorage 14. In the present exemplary embodiment, astate estimation program 100 is stored in thestorage 14. Thestate estimation program 100 may be a single program, and may be plural programs or a program group structured by modules. - The
ROM 12 stores various programs and various kinds of data. TheRAM 13 serves as a workspace, temporarily memorizing programs and data. Thestorage 14 is constituted by a hard disk drive (HDD) or solid state drive (SSD). Thestorage 14 stores various programs, including an operating system, and various kinds of data. - The
entry unit 15 includes a pointing device such as a mouse or the like and a keyboard, and is used for various kinds of entry. - As entries, the
entry unit 15 accepts combinations of measurement data and capacities of the all-solid-state battery for before and after a test that causes deterioration of a reference all-solid-state battery to progress. The measurement data is impedances at respective frequencies, measured by an impedance method. The capacities are found in advance. - More specifically, first an all-solid-state battery as illustrated below is fabricated, structured with a positive electrode layer, a solid-state electrolyte layer and a negative electrode layer.
- The positive electrode layer is constituted with LiNi0.5Co0.2Mn0.3O2, a sulfide solid-state electrolyte with an argyrodite structure, conductive carbon and a binder. The solid-state electrolyte layer is constituted with a sulfide solid-state electrolyte with an argyrodite structure and a binder. The negative electrode layer is constituted with graphite, a sulfide solid-state electrolyte with an argyrodite structure, and a binder.
- A slurry in which the constituent materials of the positive electrode layer are dispersed in an organic solvent is coated onto an aluminium foil and then dried to fabricate a positive electrode layer sheet. A slurry in which the constituent materials of the solid-state electrolyte layer are dispersed in an organic solvent is coated onto a gold foil and then dried to fabricate a solid-state electrolyte layer sheet. A slurry in which the constituent materials of the negative electrode layer are dispersed in an organic solvent is coated onto a gold foil and then dried to fabricate a negative electrode layer sheet.
- Subsequently, the coated surfaces of the solid-state electrolyte sheet and the negative electrode sheet are opposed with one another and pressed to transfer the solid-state electrolyte layer onto the negative electrode layer. The negative electrode sheet onto which the solid-state electrolyte has been transferred and the positive electrode sheet are superposed such that the positive electrode layer, solid-state electrolyte layer and negative electrode layer are laminated in this order, and are pressed. Thus, the layers are joined to one another and the positive electrode layer, solid-state electrolyte layer and negative electrode layer are densified. This is then sealed in a lamination film to provide an all-solid-state battery. In order to assure performance of the all-solid-state battery, the all-solid-state battery is confined in a jig that applies predetermined surface pressure to the electrode surfaces.
- A charging and discharging test is carried out to electrically charge and discharge the all-solid-state battery fabricated as described above under predetermined conditions (for example, 25°C, charge rate 0.1C), and a capacity of the all-solid-state battery is calculated. Subsequently, the State of Charge (SoC) is adjusted to 50%, and AC impedance measurements are conducted at 25°C to obtain measurement data.
- A cycling test is then conducted to charge and discharge the all-solid-state battery under conditions of 60°C, 1C. After 100 cycles and after 200 cycles, the all-solid-state battery is removed, the charging and discharging test is conducted at 25°C, 0.1 C, and the capacity of the all-solid-state battery is calculated. AC impedance measurements are carried out with an SoC of 50% to obtain measurement data.
- Thus, combinations of measurement data, which is impedances at respective frequencies measured by the impedance method, with capacities of the all-solid-state battery that are found in advance are prepared for a reference all-solid-state battery for before and after a test that causes deterioration to progress. The
entry unit 15 accepts the combinations of measurement data and capacities of the reference all-solid-state battery from before and after the test that causes deterioration to progress. - Hence, the
entry unit 15 accepts entries that are measurement data, which is impedances at respective frequencies measured by the impedance method, of an estimation target all-solid-state battery whose capacity is unknown. - More specifically, a charging and discharging test is carried out to charge and discharge the estimation target all-solid-state battery, which is fabricated in a similar manner to the reference all-solid-state battery described above, under predetermined conditions (for example, 25°C, 0.1C), after which the SoC is adjusted to 50%, and AC impedance measurements are conducted at 25°C to obtain measurement data.
- The
display unit 16 is, for example, a liquid crystal display and displays various kinds of information. Thedisplay unit 16 that is employed may be a touch panel and may also function as theentry unit 15. - The
communications interface 17 is an interface for communicating with other equipment and employs a standard such as, for example, Ethernet (registered trademark), Fiber Distributed Data Interface (FDDI), Wi-Fi (registered trademark) or the like. - Now, in a Cole-Cole plot of results obtained by an AC impedance method from an all-solid-state battery, in which real components Z' of the results are plotted on the horizontal axis and imaginary components Z" are plotted on the vertical axis, an arc-shaped curve appears due to resistance in charging and discharging reactions of the battery. When the all-solid-state battery deteriorates, a chord length of this arc increases and a frequency (below referred to as "the peak frequency") that produces a peak of the arc (a point at which absolute values of the imaginary components are at a maximum) decreases. The capacity of the all-solid-state battery decreases along with the deterioration. The inventors of the present disclosure have discovered that a relationship between peak frequencies x and capacities w that change as the deterioration progresses may be mathematically expressed in the form w=F(x), regardless of charging and discharging conditions that lead to the deterioration, and have further discovered that a good approximation is provided in the form w=a·logx+b (in which a and b are constants). To improve the precision of this approximation, a correction term may be included in the form w=a·logx+b+D (in which D is the correction term).
- In theory, this may be explained as follows.
- Generally, a battery capacity in practice depends on the capacity of the active material itself and on battery resistance. The reason the battery resistance has an effect is that when the resistance is larger, over-voltages during charging and discharging are larger. Thus, an upper limit voltage may be reached during charging before a limit capacity of the active material is reached, and a lower limit voltage may be reached during discharging.
- The AC impedance method is a simple technique for measuring resistance of a battery. A Cole-Cole plot is illustrated in which real components of impedances obtained by this measurement method are plotted on the horizontal axis and imaginary components are plotted on the vertical axis. In this plot, a curve with an arc shape caused by the resistance of battery reactions is obtained. A chord length of this arc may be used as an index of resistance of battery reactions. However, because measurement conditions differ from actual battery resistances during charging and discharging, resistances during charging and discharging commonly do not match and magnitude relationships of battery capacities do not necessarily correlate.
- In a deteriorating battery, the resistance expressed as the arc chord length incorporates the effects of a rise in charge transfer resistance caused by the formation of a resistance layer at a boundary face between an active material and an electrolyte, a fall in contact area of the boundary face between the active material and the electrolyte, and a rise in ionic conduction resistance in the thickness direction of an electrode. Of these factors, it is theoretically understood that the peak frequency decreases with the rise in charge transfer resistance but the peak frequency is substantially constant when the contact area and the ionic conduction resistance change. It is thought that a reason for the strong correlation between capacity and peak frequency is that a rise in charge transfer resistance caused by the formation of a resistance layer has a large effect contributing to a decrease in capacity, and thus charge transfer resistance strongly correlates with peak frequency.
- Accordingly, in the present exemplary embodiment as illustrated in
Fig. 2 , theCPU 11 of thestate estimation device 10 executes thestate estimation program 100 and functions as afirst acquisition section 150, aderivation section 160, asecond acquisition section 170, acomputation section 180 and anestimation section 190. - The
first acquisition section 150 acquires measurement data and capacities of a reference all-solid-state battery. The measurement data is impedances at respective frequencies measured by the impedance method before and after a test that causes deterioration to progress. The capacities are found in advance. - The
derivation section 160 computes peak frequencies from the arc-shaped curves in the graphs plotting the impedances at the respective frequencies represented by the measurement data acquired by thefirst acquisition section 150, and finds a relational expression w=F(x) representing the relationship between peak frequencies x and capacities w. This relational expression w=F(x) includes the terms a·logx and the term b, in which a and b are constants. - To be specific, a Cole-Cole plot obtained from AC impedance measurements before a cycling test is illustrated in
Fig. 3 . A relationship between peak frequencies of arcs and imaginary components of impedance is illustrated inFig. 4 . The relationship inFig. 3 may be expressed in the form of the following relationship between logarithms of frequency (represented by f) and absolute values of the imaginary components Z".
- The terms k, 1 and m are constants, which are found by the least squares method. The frequency f that produces the greatest value of |Z"| is found to serve as the peak frequency x, which is used as the peak frequency from before the cycling test. A difference between the real components of points at the two ends of the arc that are closest to the real value axis in
Fig. 3 is computed to serve as the arc chord length y, which serves as the arc chord length from before the cycling test. - The arc chord length and peak frequency from after the cycling test are computed by the same procedure.
- The peak frequencies x found by the method described above and their logarithms, the arc chord lengths y and their logarithms, and the capacities w are illustrated in table 1 as relative values, with the values from before the cycling test being set to 1.
Table 1 Cycles Peak frequency x Log of peak frequency x Arc chord length y Log of arc chord length y Discharge capacity w 0 1.000 0.00 1.000 0.00 1.000 100 0.206 -0.69 3.461 0.54 0.816 200 0.102 -0.99 5.650 0.75 0.740 - A correspondence relationship between the relative values of the logarithms log x of the peak frequencies x and the relative values of the capacities w can be represented by a straight line as illustrated in
Fig. 5 . Through the least squares method, for example, the followingrelational expression 1 is obtained.
- The
second acquisition section 170 acquires measurement data of an estimation target rechargeable battery, which is impedances at respective frequencies measured by the impedance method. - The
computation section 180 computes a peak frequency from an arc-shaped curve in a graph plotting the impedances at the respective frequencies represented by the measurement data acquired by thesecond acquisition section 170. - The
estimation section 190 substitutes the peak frequency of the estimation target rechargeable battery intorelational expression 1 and estimates the capacity of the estimation target rechargeable battery. The estimated capacity is displayed through thedisplay unit 16. - Now, operation of the
state estimation device 10 according to the first exemplary embodiment is described. -
Fig. 6 is a flowchart showing a flow of state estimation processing by thestate estimation device 10. TheCPU 11 implements the state estimation processing by reading thestate estimation program 100 from thestorage 14, loading thestate estimation program 100 to theRAM 13 and executing thestate estimation program 100. Combinations for the reference all-solid-state battery from before and after the test that causes deterioration to progress, of the measurement data that is impedances at respective frequencies measured by the impedance method and the capacities that are found in advance, are entered into thestate estimation device 10 and stored at thestorage 14. - The measurement data of the estimation target all-solid-state battery that is impedances at respective frequencies measured by the impedance method is also entered into the
state estimation device 10 and stored at thestorage 14. - In step S100, the
CPU 11 serves as thefirst acquisition section 150 and acquires the measurement data of the reference all-solid-state battery that is impedances at respective frequencies measured by the impedance method before and after the test that causes deterioration to progress and capacities that are found in advance. - In step S102, the
CPU 11 serves as thederivation section 160 and, in graphs plotting the impedances at respective frequencies represented by the measurement data acquired instep S 100, computes peak frequencies from arc-shaped curves. - In step S104, the
CPU 11 serves as thederivation section 160 and obtains the relational expression w=F(x) representing the relationship between peak frequencies and capacities. - In step S 106, the
CPU 11 serves as thesecond acquisition section 170 and acquires the measurement data of the estimation target all-solid-state battery that is impedances at respective frequencies measured by the impedance method. - In step S108, the
CPU 11 serves as thecomputation section 180 and, in a graph plotting the impedances at respective frequencies represented by the measurement data acquired in step S 106, computes a peak frequency from an arc-shaped curve. - In step S 110, the
CPU 11 serves as theestimation section 190, usesrelational expression 1 to estimate a capacity of the estimation target all-solid-state battery from the peak frequency of the estimation target all-solid-state battery, displays the estimated capacity with thedisplay unit 16, and ends the state estimation processing. - An Example in which the
state estimation device 10 according to the first exemplary embodiment described above is used to estimate a capacity is described. - Cells with the same specifications as a reference all-solid-state battery were used as estimation target all-solid-state batteries, one cell being subjected to 300 cycles of a cycling test at 60°C, 1C (condition 1) and one cell being subjected to 300 cycles of the cycling test at 25°C, 1C (condition 2). Capacities w1, peak frequencies x1 and arc chord lengths y1 were acquired by methods the same as the methods described above for the first exemplary embodiment.
- To simulate deterioration resulting from a reduction in contact area between particles due to expansion and contraction of an active material, cells were fabricated in which boundary contact performance of structural materials is intentionally lowered by a reduction in electrode pressing pressure during battery fabrication. The capacity w1, peak frequency x1 and arc chord length y1 without the cycling test were acquired by methods the same as the methods described above for the first exemplary embodiment (condition 3).
- Results of using
relational expression 1 to compute estimated capacities w2 for the peak frequencies x1 obtained fromconditions 1 to 3 are shown in table 2.Table 2 History before estimation Peak frequency x1 Log of peak frequency x1 Arc chord length y1 Log of arc chord length y1 Measured capacity w1 Estimated capacity w2 Condition 1 60°C, 300 cycles 0.071 -1.15 7.312 0.86 0.679 0.697 Condition 225°C, 300 cycles 0.602 -0.22 1.565 0.19 0.951 0.941 Condition 3 Low pressing pressure 0.559 -0.25 23.80 0 1.38 0.930 0.933 - The relationship between measured values of peak frequency and capacity and the relationship between estimated values of peak frequency and capacity are illustrated in
Fig. 7 . As can be seen inFig. 7 , the capacities may be accurately estimated with the estimated values being close to the measured values. - Now, the relationship between arc chord length and capacity is described. In general, when a battery resistance is high, the capacity tends to be lower. Therefore, it is thought possible to estimate the capacity from the arc chord length that is associated with a battery resistance component. When the relationship between logarithms of arc chord length and capacities is illustrated for all of the data described above for the present exemplary embodiment, as in
Fig. 8 , a broadly linear relationship can be seen. However, one point is distant from the linear relationship (see the arrow inFig. 8 ). This distant data corresponds to condition 3 in which the pressing pressure was lowered. Thus, it can be understood that it may not be possible to accurately estimate the capacity for a deterioration in which physical contact performance within electrodes is lowered. - However, when a relationship between the logarithms of peak frequencies and capacities is illustrated as in
Fig. 9 , it can be seen that the capacity may be estimated accurately for a deterioration in which physical contact performance is lowered. - The
state estimation device 10 according to the present exemplary embodiment finds a relational expression representing a relationship between peak frequencies and capacities, on the basis of peak frequencies computed for before and after the test that causes deterioration of a reference all-solid-state battery to progress, and capacities that are found in advance. Thestate estimation device 10 uses the relational expression to estimate a capacity of an estimation target all-solid-state battery from a peak frequency computed from an arc chord length in a graph plotting impedances at respective frequencies represented by acquired measurement data of the estimation target all-solid-state battery. Thus, the capacity of the all-solid-state battery may be estimated with consideration for physical deterioration. - A state estimation device according to a second exemplary embodiment has similar structures to the first exemplary embodiment, and is accordingly described with the same reference symbols being assigned.
- The aforementioned
Fig. 1 is a block diagram showing hardware structures of thestate estimation device 10 according to the second exemplary embodiment. - As shown in the aforementioned
Fig. 1 , similarly to the first exemplary embodiment, thestate estimation device 10 according to the second exemplary embodiment includes theCPU 11, theROM 12, theRAM 13, thestorage 14, theentry unit 15, thedisplay unit 16 and thecommunications interface 17. - As entries, the
entry unit 15 accepts, before and after a test that causes deterioration of a reference all-solid-state battery to progress in accordance with chemical changes, measurement data that is impedances at respective frequencies measured by the impedance method. - More specifically, first an all-solid-state battery structured with a positive electrode layer, a solid-state electrolyte layer and a negative electrode layer is fabricated in the same manner as in the first exemplary embodiment.
- The fabricated battery is conditioned by charging and discharging under predetermined conditions. Subsequently, the SoC is adjusted to 50%, and AC impedance measurements are conducted at 25°C.
- Then, the battery is charged to
SoC 100% at 60°C, and the voltage is held for 48 hours at 100% SoC. Subsequently, the SoC is adjusted to 50% and AC impedance measurements are carried out at 25°C. The same procedure is repeated, and respective AC impedance measurements are carried out for total holding durations of 120 hours and 240 hours. - Thus, measurement data, which is impedances at respective frequencies measured by the impedance method before and after a test that causes deterioration to progress in accordance with chemical changes is prepared for a reference all-solid-state battery. The
entry unit 15 receives the measurement data of the reference all-solid-state battery from before and after the test that causes deterioration to progress in accordance with chemical changes. - Hence, the
entry unit 15 accepts entries that are measurement data, which is impedances at respective frequencies measured by the impedance method, of an estimation target all-solid-state battery whose capacity is unknown. - More specifically, a charging and discharging test is carried out to charge and discharge the estimation target all-solid-state battery, which is fabricated in a similar manner to the reference all-solid-state battery described above, under predetermined conditions, after which the SoC is adjusted to 50% and AC impedance measurements are conducted at 25°C to obtain the measurement data.
- Now, in a Cole-Cole plot that plots the real components of results obtained by the AC impedance method from an all-solid-state battery on the horizontal axis and the imaginary components on the vertical axis, the arc-shaped curve caused by resistance in charging and discharging reactions of the battery appears. When the all-solid-state battery deteriorates, the chord length y of this arc increases and the peak frequency x (a point at which the absolute values of the imaginary components are at a maximum) decreases. The inventors of the present disclosure have discovered that when deterioration progresses under matching conditions with only duration and a number of cycles changing, the relationship between peak frequencies x and arc chord lengths y that change as the deterioration progresses may be mathematically expressed in the form y=F(x), and have further discovered that a good approximation is provided in the form y= axb (in which a and b are constants). To improve the precision of this approximation, a correction term D may be included in the form y= axb+D (in which D is the correction term).
- Chemical deterioration at a boundary surface between an active material and a solid-state electrolyte, which is the site of a charge transfer reaction, is thought to be a cause of the peak frequency of the arc decreasing in accordance with deterioration. This may be theoretically understood as follows.
- In general, an impedance caused by a charge transfer reaction at a boundary face between an active material and a solid-state electrolyte may be considered as an equivalent circuit constituted by a parallel circuit of a resistance R and a capacitance C that is shown in
Fig. 10 , which depicts the boundary face schematically. The arc chord length corresponds with the value of R and the peak frequency (which is referred to as the characteristic frequency) corresponds with 1/(2πRC). The resistance R corresponds with a resistance associated with the charge transfer reaction, and is a portion of resistance of the battery. When chemical deterioration progresses at the boundary face, the resistance R of the boundary surface increases, as a result of which thepeak frequency 1/(2πRC) decreases. The value of C may change in association with changes in the chemical state of the boundary face. However, in practice the peak frequency changes little in association with deterioration. Therefore, the effect of changes in C is thought to be limited. - Meanwhile, the effects of physical deterioration on impedance may be theoretically understood as follows. Specific phenomena of physical deterioration that can be mentioned are that a contact area of the boundary face between the active material and the solid-state electrolyte decreases in association with expansion and contraction of the active material, and that ionic conduction resistance falls in association with the formation of voids in electrode layers and in the solid-state electrolyte.
- A state in which a contact proportion of the boundary face between the electrolyte and the solid-state electrode has decreased is schematically shown in
Fig. 11 . When, for example, the contact proportion falls by half, the resistance R of the equivalent circuit doubles, while the capacitance C halves. As a result, thepeak frequency 1/(2πRC) is unchanged but the arc chord length is doubled. - A conceptual image of a fall in ionic conductance associated with the formation of voids in an electrode and a solid-state electrolyte is shown in
Fig. 12 . In general, active material particles and solid-state electrolyte particles are mixed and pressed in an electrode layer, producing a state in which the active material is dispersed in the solid-state electrolyte, forming a three-dimensional network. A conductive material such as conductive carbon or the like may also be included in order to improve electron conductivity and a binder may be included in order to improve binding strength. An equivalent circuit of impedance at a boundary face between an electrode and a solid-state electrolyte may be understood as a circuit in which, as shown inFig. 12 , resistances rCT and capacitances c are connected up in a ladder pattern in the thickness direction with lithium ion resistances ri disposed therebetween. In this situation too, a single arc due to charge transfer resistance appears in a Cole-Cole plot. A value of the chord length of the arc is influenced by the charge transfer resistance and the lithium ion resistance. When voids are formed in the electrolyte due to physical deterioration as illustrated inFig. 12 , the lithium ion resistance ri can be expected to increase, in which case the arc chord length increases with the increase in the lithium ion resistance ri. For the purpose of calculations, the peak frequency is substantially constant. - The relationships between peak frequencies x and arc chord lengths y for chemical deterioration and physical deterioration can be collectively represented by the conceptual diagram in
Fig. 13 . In deterioration of an all-solid-state battery that is an estimation target, both chemical deterioration and physical deterioration progress simultaneously. Therefore, deterioration can be plotted between the two arrows inFig. 13 . From the descriptions above, a deterioration may be compared with the straight line representing chemical deterioration and an amount of divergence may be quantified. The amount of divergence may be used as an index of physical deterioration. - A plot (identified as (x1, y1)) of an all-solid-state battery that is an estimation target is compared with the straight line representing chemical deterioration by comparison of y1 and F(x1) as illustrated in
Fig. 14 . If the arc chord length at the start point is y0, the difference between F(x1) and y0 may be theoretically understood as the contribution of chemical deterioration, and the difference between y1 and F(x1) as the contribution of physical deterioration. Therefore, a judgment more credibly based in theory may be made. For example, a value y1/F(x1) that is y1 divided by F(x1) may be regarded as an index indicating a ratio of increase in resistance due to the contribution of physical deterioration. It may be possible to repair physical deterioration by putting a separated boundary face back into contact by re-pressing the battery. As a result, it should be possible to reduce a resistance that has risen to y1 down to F(x1). - To perform the comparison described above, it is desirable if a test that causes deterioration to progress in accordance with chemical changes (chemical deterioration) features as little physical deterioration as possible and is close to chemical deterioration alone. That is, the gradient of the straight-line y=F(x) in
Fig. 14 being closer to horizontal is desirable. From results of performing this test under various conditions, it can be seen that a method of holding a constant voltage in a charged state exhibits a deterioration mechanism that is closest to chemical deterioration alone. Accordingly, in the present exemplary embodiment, a test that holds a constant voltage in the charged state is utilized as the test that causes deterioration to progress in accordance with chemical changes. - Cole-Cole plots for respective holding durations in this test are shown in
Fig. 15 , in which the real components of obtained impedances are plotted on the horizontal axis and the imaginary components are plotted on the vertical axis. Graphs in which frequencies are plotted on the horizontal axis and imaginary components of impedance are plotted on the vertical axis are shown inFig. 16 . FromFig. 15 , it can be seen that arc-shaped curves thought to be due to charging and discharging reactions are apparent and that the arcs become larger with the holding duration. FromFig. 16 , it can be seen that the peak frequency decreases with increasing holding duration. The charging and discharging reactions that contribute to these arcs are respective reactions at the positive electrode and the negative electrode. It is thought that the reactions at the positive electrode and negative electrode are each constituted by plural elementary reactions and that each arc is the sum of these reactions. In the present disclosure, this may be regarded as approximating a single curve, in which case the extent of physical deterioration at the whole of the positive electrode and negative electrode can be estimated. The arcs may be clearly separated, depending on electrode materials and the like, in which case similar operations may be conducted for the respective arcs and an amount of physical deterioration relating to the elemental reactions may be estimated. - Accordingly, in the
state estimation device 10 according to the present exemplary embodiment as illustrated inFig. 2 described above, by executing thestate estimation program 100, theCPU 11 functions as thefirst acquisition section 150, thederivation section 160, thesecond acquisition section 170, thecomputation section 180 and theestimation section 190. - The
first acquisition section 150 acquires the measurement data of the reference all-solid-state battery, which is impedances at respective frequencies measured by the impedance method before and after the test that causes deterioration to progress in accordance with chemical changes. - The
derivation section 160 computes the peak frequencies and arc chord lengths from the arc-shaped curves in the graphs plotting the impedances at the respective frequencies represented by the measurement data acquired by thefirst acquisition section 150, and finds the relational expression y=F(x) representing the relationship between peak frequencies x and arc chord lengths y. This relational expression y=F(x) includes the term axb, in which a and b are constants. - To be specific, similarly to the first exemplary embodiment described above, the terms k, l and m in a relational expression between logarithms of the frequencies f and the imaginary components Z" are found by the least squares method, and the frequency f that produces the greatest value of |Z"| is found to serve as the peak frequency x. A difference between the real components of points at the two ends of each arc that are closest to the real value axis in the above-described
Fig. 3 is computed to serve as the arc chord length y. - The arc chord length and peak frequency after the cycling test are computed by the same procedure.
- The peak frequencies x found by the method described above and their logarithms and the arc chord lengths y and their logarithms are illustrated in table 3 as relative values, with the values from before the voltage holding being set to 1.
Table 3 Condition Voltage holding duration (hours) x (relative value) log x y (relative value) log y A 0 1.000 0.00 1.00 0.00 B 48 0.174 -0.76 2.88 0.46 C 120 0.081 -1.09 4.73 0.68 D 240 0.047 -1.33 7.49 0.87 - The values of log x and log y have a linear relationship (
Fig. 17 ), and a relational expression is obtained by the least squares method.
- This expression is rearranged to obtain
relational expression 2.
- The
second acquisition section 170 acquires measurement data of an estimation target rechargeable battery, which is impedances at respective frequencies measured by the impedance method. - The
computation section 180 computes a peak frequency and arc chord length from an arc-shaped curve in a graph plotting the impedances at the respective frequencies represented by the measurement data acquired by thesecond acquisition section 170. - From the peak frequency and arc chord length of the estimation target rechargeable battery, the
estimation section 190 usesrelational expression 2 to estimate a degree of physical deterioration of the estimation target rechargeable battery. The estimated degree of physical deterioration is displayed through thedisplay unit 16. - To be specific, the degree of physical deterioration of the estimation target rechargeable battery is estimated on the basis of a comparison between the arc chord length y1 of the estimation target rechargeable battery and an arc chord length y2 that is obtained by substituting the peak frequency x1 of the estimation target rechargeable battery into the relational expression y=F(x).
- Even more specifically, a value y1/y2 in which y1 is divided by y2 is computed to serve as the degree of physical deterioration. Then, if y1/y2 is at least a pre-specified judgment reference value, re-pressing is judged to be necessary. If y1/y2 is less than the judgment reference value, re-pressing is judged to not be necessary. The result of this judgment is displayed at the
display unit 16. - Now, operation of the
state estimation device 10 according to the second exemplary embodiment is described. -
Fig. 18 is a flowchart showing a flow of state estimation processing by thestate estimation device 10. TheCPU 11 implements the state estimation processing by reading thestate estimation program 100 from thestorage 14, loading thestate estimation program 100 to theRAM 13 and executing thestate estimation program 100. Measurement data of the reference all-solid-state battery that is impedances at respective frequencies measured by the impedance method before and after the test is entered into thestate estimation device 10 and stored at thestorage 14. - The measurement data of the estimation target all-solid-state battery that is impedances at respective frequencies measured by the impedance method is also entered into the
state estimation device 10 and stored at thestorage 14. - In step S200, the
CPU 11 serves as thefirst acquisition section 150 and acquires the measurement data of the reference all-solid-state battery that is impedances at respective frequencies measured by the impedance method before and after the test that causes deterioration to progress in accordance with chemical changes. - In step S202, the
CPU 11 serves as thederivation section 160 and, in graphs plotting the impedances at respective frequencies represented by the measurement data acquired in step S200, computes peak frequencies and arc chord lengths from arc-shaped curves. - In step S204, the
CPU 11 serves as thederivation section 160 and obtains the relational expression y=F(x) representing the relationship between peak frequencies x and arc chord lengths y. - In step S206, the
CPU 11 serves as thesecond acquisition section 170 and acquires the measurement data of the estimation target all-solid-state battery that is impedances at respective frequencies measured by the impedance method. - In step S208, the
CPU 11 serves as thecomputation section 180 and, in a graph plotting the impedances at respective frequencies represented by the measurement data acquired in step S206, computes a peak frequency and arc chord length from an arc-shaped curve. - In step S210, the
CPU 11 serves as theestimation section 190, usesrelational expression 2 to estimate a degree of physical change of the estimation target all-solid-state battery from the peak frequency and arc chord length of the estimation target all-solid-state battery, displays the estimated degree of physical change with thedisplay unit 16, and ends the state estimation processing. - An Example in which the
state estimation device 10 according to the second exemplary embodiment described above is used to estimate a capacity is described. - Cells with the same specifications as a reference all-solid-state battery were used as estimation target all-solid-state batteries and the cycling test was performed under various conditions simulating usage with repeated charging and discharging. Arc chord lengths y1 and peak frequencies x1 of the cells after the cycling test were found.
- The cycling test conditions, arc chord lengths y1 and peak frequencies x1 are shown in table 4. These values are shown on a graph in
Fig. 19 . The same as in table 3, the values of x1 and y1 are shown as relative values, with values before the voltage holding being set to 1.Table 4 Condition Cycling test conditions Peak frequency x1 (relative value) log x1 Arc chord length y1 (relative value) log y1 Temperature Voltage Cycles E 60 3-4.35 V 100 0.206 -0.69 3.46 0.54 F 200 0.102 -0.99 5.65 0.75 G 300 0..74 -1.13 7.56 0.88 H 60 3-4.2 V 100 0.705 -0.15 1.72 0.23 I 200 0.438 -0.36 2.46 0.39 J 300 0.346 -0.46 2.94 0.47 K 25 3-4.35 V 100 0.758 -0.12 1.31 0.12 L 200 0.656 -0.18 1.49 0.17 M 300 0.601 -0.22 1.61 0.21 - In
Fig. 19 , all points from after the cycling test are plotted higher than the straight line ofrelational expression 2. Therefore, it can be seen that the test that accelerated deterioration by holding a constant voltage in the charged state, which was conducted in order to obtainrelational expression 2, was close to chemical deterioration alone without featuring physical deterioration, as intended. - Arc chord lengths y2 (y2=F(x1)) that are due to chemical changes were computed by substituting the peak frequencies x1 under the respective conditions obtained as described above into relational expression 2 (table 5). This is equivalent to computing arc chord lengths at the points E', F' and G' in
Fig. 19 . Then, each value y1 was divided by y2 to compute y1/y2 (table 5). Each value y1/y2 is a numerical value representing a proportional increase of the resistance component due to physical deterioration. The larger this numerical value, the greater the contribution of physical deterioration.Table 5 Conditio n Cycling test conditions y2 (relative value) y1/y2 With judgment reference 1.2, re-pressing needed? Temperature Voltage Cycles E 60 3-4.35 V 100 2.71 1.28 Yes F 200 4.27 1.32 Yes G 300 5.26 1.44 Yes H 60 3-4.2 V 100 1.22 1.41 Yes I 200 1.66 1.48 Yes J 300 1.93 1.52 Yes K 25 3-4.35 V 100 1.16 1.12 No L 200 1.28 1.16 No M 300 1.35 1.19 No - When y1/y2 is greater, the contribution of physical deterioration is greater, which means that a restoration of performance by re-pressing can be expected. For example, cells requiring re-pressing may be identified (table 5) by setting the judgment reference value to 1.2.
- The
state estimation device 10 according to the present exemplary embodiment finds a relational expression representing a relationship between peak frequencies and arc chord lengths on the basis of peak frequencies and arc chord lengths computed before and after the test that causes deterioration of a reference all-solid-state battery to progress, and thestate estimation device 10 uses the relational expression to estimate a state of an estimation target all-solid-state battery from an arc chord length and a peak frequency computed from an arc chord length in a graph plotting impedances at respective frequencies represented by acquired measurement data of the estimation target all-solid-state battery. Thus, physical deterioration may be considered and a degree of physical deterioration of the all-solid-state battery may be estimated. - In the exemplary embodiments described above, examples are described in which capacities and degrees of physical deterioration of all-solid-state batteries are estimated, but this is not limiting. As long as a rechargeable battery uses a solid-state electrolyte, the battery need not be an all-solid-state battery. For example, capacities and degrees of physical deterioration of semi-solid-state batteries may be estimated.
- In the first exemplary embodiment described above, an example is described in which a relational expression representing a relationship between peak frequencies and capacities is obtained and the relational expression is used to estimate a capacity of an estimation target all-solid-state battery, but this is not limiting. For example, a trained model which is a neural network or the like that inputs a peak frequency and outputs a capacity may be obtained, and the trained model may be used to estimate a capacity of an estimation target all-solid-state battery.
- In the second exemplary embodiment described above, an example is described in which a relational expression representing a relationship between peak frequencies and arc chord lengths is obtained and the relational expression is used to estimate a degree of physical deterioration of an estimation target all-solid-state battery, but this is not limiting. For example, a trained model which is a neural network or the like that inputs a peak frequency and outputs an arc chord length may be obtained, and the trained model may be used to estimate a degree of physical deterioration of an estimation target all-solid-state battery.
- In the exemplary embodiment described above, the
CPU 11 reads and executes software (a program) but various processes may be executed by various kinds of processor other than a CPU. Examples of processors in these cases include a PLD (programmable logic device) in which a circuit configuration can be modified after manufacturing, such as an FPGA (field programmable gate array) or the like, a dedicated electronic circuit which is a processor with a circuit configuration that is specially designed to execute specific processing, such as an ASIC (application-specific integrated circuit) or the like, and so forth. The processing described above may be executed by one of these various kinds of processors, and may be executed by a combination of two or more processors of the same or different kinds (for example, plural FPGAs, a combination of a CPU with an FPGA, or the like). Hardware structures of these various kinds of processors are, to be more specific, electronic circuits combining circuit components such as semiconductor components and the like. - In the exemplary embodiment described above, modes are described in which a program is memorized in advance (installed) on a computer readable non-transitory recording medium. For example, the
state estimation program 100 of thestate estimation device 10 is memorized in advance at thestorage 14. However, this is not limiting and a program may be provided in a mode of being recorded on a non-transitory recording medium such as a CD-ROM (compact disc read-only memory), DVD-ROM (digital versatile disc read-only memory), USB (universal serial bus) memory or the like. Modes are also possible in which a program is downloaded from external equipment via a network. - The flows of processing described in the above exemplary embodiments are examples. Unnecessary steps may be removed, new steps may be added, and processing sequences may be rearranged within a scope not departing from the gist of the disclosure.
Claims (13)
- A state estimation method for estimating a state of a rechargeable battery that uses a solid-state electrolyte, the state estimation method comprising:acquiring measurement data and states of a reference rechargeable battery before and after a test that causes deterioration to progress, the measurement data being impedances at respective frequencies that are measured by an impedance method, and the states being found in advance;computing peak frequencies before and after the test from arc-shaped curves in graphs plotting the impedances at the respective frequencies represented by the measurement data;based on the computed peak frequencies before and after the test and the states found in advance, obtaining a model that represents a relationship between the peak frequencies and the states;acquiring measurement data of an estimation target rechargeable battery, the measurement data being impedances at respective frequencies that are measured by the impedance method;computing a peak frequency from an arc-shaped curve in a graph plotting the impedances at the respective frequencies represented by the measurement data; andestimating a state of the estimation target rechargeable battery from the peak frequency of the estimation target rechargeable battery, the estimating including using the model.
- The state estimation method according to claim 1, wherein the states are capacities.
- The state estimation method according to claim 2, wherein the model is a relational expression w=F(x) representing a relationship between peak frequencies x and capacities w.
- The state estimation method according to claim 3, wherein the relational expression w=F(x) includes a term a·logx and a term b, a and b being constants.
- A state estimation method for estimating a state of a rechargeable battery that uses a solid-state electrolyte, the state estimation method comprising:acquiring measurement data of a reference rechargeable battery before and after a test that causes deterioration to progress, the measurement data being impedances at respective frequencies that are measured by an impedance method;computing peak frequencies and arc chord lengths before and after the test from arc-shaped curves in graphs plotting the impedances at the respective frequencies represented by the measurement data;based on the computed peak frequencies and the arc chord lengths before and after the test, obtaining a model that represents a relationship between the peak frequencies and the arc chord lengths;acquiring measurement data of an estimation target rechargeable battery, the measurement data being impedances at respective frequencies that are measured by the impedance method;computing a peak frequency and an arc chord length from an arc-shaped curve in a graph plotting the impedances at the respective frequencies represented by the measurement data; andestimating a state of the estimation target rechargeable battery from the peak frequency and an arc chord length of the estimation target rechargeable battery, the estimating including using the model.
- The state estimation method according to claim 5, wherein:the test is a test that causes deterioration in accordance with chemical change to progress,the state is a degree of physical deterioration,the model is a relational expression y=F(x) representing a relationship between peak frequencies x and arc chord lengths y, andthe degree of physical deterioration of the estimation target rechargeable battery is estimated based on a comparison betweenthe peak frequency and the arc chord length of the estimation target rechargeable battery andthe relational expression y=F(x).
- The state estimation method according to claim 6, wherein estimating the degree of physical deterioration of the estimation target rechargeable battery includes estimating the degree of physical deterioration based on a comparison between:
an arc chord length y1 of the estimation target rechargeable battery and an arc chord length y2 that is obtained by substituting a peak frequency x1 of the estimation target rechargeable battery into the relational expression y=F(x). - The state estimation method according to claim 6, wherein the relational expression y=F(x) includes a term axb, a and b being constants.
- The state estimation method according to any one of claims 6 to 8, wherein the test that causes deterioration in accordance with chemical change to progress is a test that holds a constant voltage in a charged state.
- A state estimation device that estimates a state of a rechargeable battery that uses a solid-state electrolyte, the state estimation device comprising:a first acquisition section that acquires measurement data and states of a reference rechargeable battery before and after a test that causes deterioration to progress, the measurement data being impedances at respective frequencies that are measured by an impedance method, and the states being found in advance;a derivation section that computes peak frequencies before and after the test from arc-shaped curves in graphs plotting the impedances at the respective frequencies represented by the measurement data and, based on the computed peak frequencies before and after the test and the states found in advance, obtains a model that represents a relationship between the peak frequencies and the states;a second acquisition section that acquires measurement data of an estimation target rechargeable battery, the measurement data being impedances at respective frequencies that are measured by the impedance method;a computation section that computes a peak frequency from an arc-shaped curve in a graph plotting the impedances at the respective frequencies represented by the measurement data; andan estimation section that uses the model to estimate a state of the estimation target rechargeable battery from the peak frequency of the estimation target rechargeable battery.
- A state estimation device that estimates a state of a rechargeable battery that uses a solid-state electrolyte, the state estimation device comprising:a first acquisition section that acquires measurement data of a reference rechargeable battery before and after a test that causes deterioration to progress, the measurement data being impedances at respective frequencies that are measured by an impedance method;a derivation section that computes peak frequencies and arc chord lengths before and after the test from arc-shaped curves in graphs plotting the impedances at the respective frequencies represented by the measurement data and, based on the computed peak frequencies and the arc chord lengths before and after the test, obtains a model that represents a relationship between the peak frequencies and the arc chord lengths;a second acquisition section that acquires measurement data of an estimation target rechargeable battery, the measurement data being impedances at respective frequencies that are measured by the impedance method;a computation section that computes a peak frequency and an arc chord length from an arc-shaped curve in a graph plotting the impedances at the respective frequencies represented by the measurement data; andan estimation section that uses the model to estimate a state of the estimation target rechargeable battery from the peak frequency and an arc chord length of the estimation target rechargeable battery.
- A non-transitory storage medium storing a program for estimating a state of a rechargeable battery that uses a solid-state electrolyte, the program being executable by a computer to perform processing, the processing comprising:acquiring measurement data and states of a reference rechargeable battery before and after a test that causes deterioration to progress, the measurement data being impedances at respective frequencies that are measured by an impedance method, and the states being found in advance;computing peak frequencies before and after the test from arc-shaped curves in graphs plotting the impedances at the respective frequencies represented by the measurement data;based on the computed peak frequencies before and after the test and the states found in advance, obtaining a model that represents a relationship between the peak frequencies and the states;acquiring measurement data of an estimation target rechargeable battery, the measurement data being impedances at respective frequencies that are measured by the impedance method;computing a peak frequency from an arc-shaped curve in a graph plotting the impedances at the respective frequencies represented by the measurement data; andestimating a state of the estimation target rechargeable battery from the peak frequency of the estimation target rechargeable battery, the estimating including using the model.
- A non-transitory storage medium storing a program for estimating a state of a rechargeable battery that uses a solid-state electrolyte, the program being executable by a computer to perform processing, the processing comprising:acquiring measurement data of a reference rechargeable battery before and after a test that causes deterioration to progress, the measurement data being impedances at respective frequencies that are measured by an impedance method;computing peak frequencies and arc chord lengths before and after the test from arc-shaped curves in graphs plotting the impedances at the respective frequencies represented by the measurement data;based on the computed peak frequencies and the arc chord lengths before and after the test, obtaining a model that represents a relationship between the peak frequencies and the arc chord lengths;acquiring measurement data of an estimation target rechargeable battery, the measurement data being impedances at respective frequencies that are measured by the impedance method;computing a peak frequency and an arc chord length from an arc-shaped curve in a graph plotting the impedances at the respective frequencies represented by the measurement data; andestimating a state of the estimation target rechargeable battery from the peak frequency and an arc chord length of the estimation target rechargeable battery, the estimating including using the model.
Applications Claiming Priority (1)
| Application Number | Priority Date | Filing Date | Title |
|---|---|---|---|
| JP2022158511A JP7670013B2 (en) | 2022-09-30 | 2022-09-30 | State estimation method, state estimation device, and program |
Publications (2)
| Publication Number | Publication Date |
|---|---|
| EP4345470A1 true EP4345470A1 (en) | 2024-04-03 |
| EP4345470B1 EP4345470B1 (en) | 2025-03-19 |
Family
ID=87971915
Family Applications (1)
| Application Number | Title | Priority Date | Filing Date |
|---|---|---|---|
| EP23196049.3A Active EP4345470B1 (en) | 2022-09-30 | 2023-09-07 | State estimation method, state estimation device, and storage medium storing a program |
Country Status (5)
| Country | Link |
|---|---|
| US (1) | US20240110994A1 (en) |
| EP (1) | EP4345470B1 (en) |
| JP (1) | JP7670013B2 (en) |
| KR (2) | KR20240046001A (en) |
| CN (1) | CN117805648A (en) |
Cited By (1)
| Publication number | Priority date | Publication date | Assignee | Title |
|---|---|---|---|---|
| CN119628172A (en) * | 2025-02-11 | 2025-03-14 | 武汉大全能源技术股份有限公司 | A charging cabinet charging and discharging control method and system |
Families Citing this family (1)
| Publication number | Priority date | Publication date | Assignee | Title |
|---|---|---|---|---|
| WO2025243354A1 (en) * | 2024-05-20 | 2025-11-27 | 日産自動車株式会社 | Secondary battery inspection method |
Citations (7)
| Publication number | Priority date | Publication date | Assignee | Title |
|---|---|---|---|---|
| WO2012095913A1 (en) | 2011-01-14 | 2012-07-19 | パナソニック株式会社 | Method for evaluating deterioration of lithium ion secondary cell, and cell pack |
| EP3229298B1 (en) * | 2016-04-04 | 2018-12-12 | Panasonic Corporation | Membrane electrode assembly and solid oxide fuel cell |
| WO2019017991A1 (en) * | 2017-07-21 | 2019-01-24 | Quantumscape Corporation | Predictive model for estimating battery states |
| JP2020167069A (en) | 2019-03-29 | 2020-10-08 | 日産自動車株式会社 | Internal short-circuit state estimation device and internal short-circuit state estimation method for all-solid-state lithium-ion secondary battery, and charging device for all-solid-state lithium-ion secondary battery system and all-solid-state lithium-ion secondary battery. |
| JP2020167079A (en) | 2019-03-29 | 2020-10-08 | 古河電池株式会社 | Lead-acid battery |
| US20200393518A1 (en) * | 2018-04-17 | 2020-12-17 | Mitsubishi Electric Corporation | Storage cell diagnostic device and storage cell diagnostic method, and storage cell control system |
| JP2021140991A (en) | 2020-03-06 | 2021-09-16 | 本田技研工業株式会社 | Diagnostic device of secondary battery |
Family Cites Families (9)
| Publication number | Priority date | Publication date | Assignee | Title |
|---|---|---|---|---|
| JP3654469B2 (en) * | 1996-09-10 | 2005-06-02 | 松下電器産業株式会社 | Rechargeable battery remaining capacity detection method |
| JP5912884B2 (en) * | 2012-06-04 | 2016-04-27 | 日置電機株式会社 | Equivalent circuit analysis apparatus and equivalent circuit analysis method |
| JP6565675B2 (en) * | 2013-07-23 | 2019-08-28 | 株式会社Gsユアサ | Deterioration state detection device for storage element, deterioration state detection method, and storage system |
| JP2016090330A (en) * | 2014-10-31 | 2016-05-23 | カルソニックカンセイ株式会社 | Battery parameter estimation device |
| JP6828739B2 (en) * | 2016-04-12 | 2021-02-10 | 株式会社村田製作所 | Analytical devices, analysis methods, power storage devices, power storage systems, electronic devices, electric vehicles and electric power systems |
| US10422836B2 (en) * | 2016-12-29 | 2019-09-24 | Automotive Research & Testing Center | Device and method for estimating state-of-health of battery |
| JP2022108675A (en) * | 2021-01-13 | 2022-07-26 | 学校法人東海大学 | Battery deterioration determination device and battery deterioration determination method |
| KR102877563B1 (en) * | 2021-11-22 | 2025-10-28 | 삼성전자주식회사 | Electronic device for estimating battery state and method for operating method thereof |
| EP4336199A1 (en) * | 2022-09-07 | 2024-03-13 | Mahle International GmbH | A method and a system for estimating the state of health of a rechargeable battery, in particular for a vehicle |
-
2022
- 2022-09-30 JP JP2022158511A patent/JP7670013B2/en active Active
-
2023
- 2023-08-22 KR KR1020230110055A patent/KR20240046001A/en not_active Ceased
- 2023-09-07 CN CN202311149623.0A patent/CN117805648A/en active Pending
- 2023-09-07 EP EP23196049.3A patent/EP4345470B1/en active Active
- 2023-09-08 US US18/243,868 patent/US20240110994A1/en active Pending
-
2025
- 2025-12-08 KR KR1020250192591A patent/KR20260006487A/en active Pending
Patent Citations (7)
| Publication number | Priority date | Publication date | Assignee | Title |
|---|---|---|---|---|
| WO2012095913A1 (en) | 2011-01-14 | 2012-07-19 | パナソニック株式会社 | Method for evaluating deterioration of lithium ion secondary cell, and cell pack |
| EP3229298B1 (en) * | 2016-04-04 | 2018-12-12 | Panasonic Corporation | Membrane electrode assembly and solid oxide fuel cell |
| WO2019017991A1 (en) * | 2017-07-21 | 2019-01-24 | Quantumscape Corporation | Predictive model for estimating battery states |
| US20200393518A1 (en) * | 2018-04-17 | 2020-12-17 | Mitsubishi Electric Corporation | Storage cell diagnostic device and storage cell diagnostic method, and storage cell control system |
| JP2020167069A (en) | 2019-03-29 | 2020-10-08 | 日産自動車株式会社 | Internal short-circuit state estimation device and internal short-circuit state estimation method for all-solid-state lithium-ion secondary battery, and charging device for all-solid-state lithium-ion secondary battery system and all-solid-state lithium-ion secondary battery. |
| JP2020167079A (en) | 2019-03-29 | 2020-10-08 | 古河電池株式会社 | Lead-acid battery |
| JP2021140991A (en) | 2020-03-06 | 2021-09-16 | 本田技研工業株式会社 | Diagnostic device of secondary battery |
Cited By (2)
| Publication number | Priority date | Publication date | Assignee | Title |
|---|---|---|---|---|
| CN119628172A (en) * | 2025-02-11 | 2025-03-14 | 武汉大全能源技术股份有限公司 | A charging cabinet charging and discharging control method and system |
| CN119628172B (en) * | 2025-02-11 | 2025-05-16 | 武汉大全能源技术股份有限公司 | Charging cabinet charging and discharging control method and system |
Also Published As
| Publication number | Publication date |
|---|---|
| EP4345470B1 (en) | 2025-03-19 |
| JP2024052064A (en) | 2024-04-11 |
| CN117805648A (en) | 2024-04-02 |
| KR20240046001A (en) | 2024-04-08 |
| KR20260006487A (en) | 2026-01-13 |
| US20240110994A1 (en) | 2024-04-04 |
| JP7670013B2 (en) | 2025-04-30 |
Similar Documents
| Publication | Publication Date | Title |
|---|---|---|
| EP4345470A1 (en) | State estimation method, state estimation device, and storage medium storing a program | |
| EP2762908B1 (en) | Battery cell performance estimation method and battery cell performance estimation apparatus | |
| Yang et al. | State of charge estimation for pulse discharge of a LiFePO4 battery by a revised Ah counting | |
| US8378687B2 (en) | Method of measuring characteristics regarding safety of battery | |
| US10539621B2 (en) | Method and apparatus for identifying a battery model | |
| CN104142477B (en) | The battery condition estimator of solid-state concentration models coupling experience equivalent-circuit model | |
| JP6337233B2 (en) | Battery evaluation method and battery characteristic evaluation apparatus | |
| US20110060538A1 (en) | Estimation of State-Of-Health in Batteries | |
| CN103884996A (en) | Residual electricity quantity calculation method of lithium iron phosphate battery | |
| KR101282687B1 (en) | Method for estimating battery SOC of vehicle | |
| CN105378498A (en) | State Estimation Method for Electric Storage Device | |
| TW201534949A (en) | Battery state calculation device and battery state calculation method | |
| CN111062137A (en) | Lithium ion battery performance prediction model and construction method and application thereof | |
| KR102483644B1 (en) | Method and apparatus of predicting capacity fade rate of a rechargeable battery | |
| KR102754579B1 (en) | Method for inspecting wettability of electrolyte in battery | |
| Bartlett et al. | Model-based state of charge estimation and observability analysis of a composite electrode lithium-ion battery | |
| JP7103105B2 (en) | Secondary battery life prediction method and its equipment | |
| Zuo et al. | Aging characteristics of lithium-ion battery under fast charging based on electrochemical-thermal-mechanical coupling model | |
| KR102764344B1 (en) | Apparatus, method and system for diagnosing battery | |
| Huo et al. | Characterization of cathode degradation and development of a coupled electrochemical-aging model for sulfide-based all-solid-state batteries | |
| Ma et al. | Establishment and simulation of an electrode averaged model for a lithium-ion battery based on kinetic reactions | |
| KR20150034593A (en) | Method and apparatus for state of charge estimation of battery | |
| CN116324447A (en) | Method for predicting life characteristics of lithium secondary battery | |
| CN110412482B (en) | Inspection method and manufacturing method of all-solid-state battery, and manufacturing method of battery pack | |
| Wahyuddin et al. | Energy Inefficiency on Battery Internal Resistance and Applications |
Legal Events
| Date | Code | Title | Description |
|---|---|---|---|
| PUAI | Public reference made under article 153(3) epc to a published international application that has entered the european phase |
Free format text: ORIGINAL CODE: 0009012 |
|
| STAA | Information on the status of an ep patent application or granted ep patent |
Free format text: STATUS: REQUEST FOR EXAMINATION WAS MADE |
|
| 17P | Request for examination filed |
Effective date: 20230922 |
|
| AK | Designated contracting states |
Kind code of ref document: A1 Designated state(s): AL AT BE BG CH CY CZ DE DK EE ES FI FR GB GR HR HU IE IS IT LI LT LU LV MC ME MK MT NL NO PL PT RO RS SE SI SK SM TR |
|
| GRAP | Despatch of communication of intention to grant a patent |
Free format text: ORIGINAL CODE: EPIDOSNIGR1 |
|
| STAA | Information on the status of an ep patent application or granted ep patent |
Free format text: STATUS: GRANT OF PATENT IS INTENDED |
|
| INTG | Intention to grant announced |
Effective date: 20241014 |
|
| GRAS | Grant fee paid |
Free format text: ORIGINAL CODE: EPIDOSNIGR3 |
|
| GRAA | (expected) grant |
Free format text: ORIGINAL CODE: 0009210 |
|
| STAA | Information on the status of an ep patent application or granted ep patent |
Free format text: STATUS: THE PATENT HAS BEEN GRANTED |
|
| AK | Designated contracting states |
Kind code of ref document: B1 Designated state(s): AL AT BE BG CH CY CZ DE DK EE ES FI FR GB GR HR HU IE IS IT LI LT LU LV MC ME MK MT NL NO PL PT RO RS SE SI SK SM TR |
|
| REG | Reference to a national code |
Ref country code: GB Ref legal event code: FG4D |
|
| REG | Reference to a national code |
Ref country code: CH Ref legal event code: EP |
|
| REG | Reference to a national code |
Ref country code: DE Ref legal event code: R096 Ref document number: 602023002482 Country of ref document: DE |
|
| REG | Reference to a national code |
Ref country code: IE Ref legal event code: FG4D |
|
| P01 | Opt-out of the competence of the unified patent court (upc) registered |
Free format text: CASE NUMBER: APP_20540/2025 Effective date: 20250430 |
|
| PG25 | Lapsed in a contracting state [announced via postgrant information from national office to epo] |
Ref country code: RS Free format text: LAPSE BECAUSE OF FAILURE TO SUBMIT A TRANSLATION OF THE DESCRIPTION OR TO PAY THE FEE WITHIN THE PRESCRIBED TIME-LIMIT Effective date: 20250619 |
|
| PG25 | Lapsed in a contracting state [announced via postgrant information from national office to epo] |
Ref country code: FI Free format text: LAPSE BECAUSE OF FAILURE TO SUBMIT A TRANSLATION OF THE DESCRIPTION OR TO PAY THE FEE WITHIN THE PRESCRIBED TIME-LIMIT Effective date: 20250319 |
|
| REG | Reference to a national code |
Ref country code: LT Ref legal event code: MG9D |
|
| PG25 | Lapsed in a contracting state [announced via postgrant information from national office to epo] |
Ref country code: NO Free format text: LAPSE BECAUSE OF FAILURE TO SUBMIT A TRANSLATION OF THE DESCRIPTION OR TO PAY THE FEE WITHIN THE PRESCRIBED TIME-LIMIT Effective date: 20250619 |
|
| PG25 | Lapsed in a contracting state [announced via postgrant information from national office to epo] |
Ref country code: HR Free format text: LAPSE BECAUSE OF FAILURE TO SUBMIT A TRANSLATION OF THE DESCRIPTION OR TO PAY THE FEE WITHIN THE PRESCRIBED TIME-LIMIT Effective date: 20250319 |
|
| PG25 | Lapsed in a contracting state [announced via postgrant information from national office to epo] |
Ref country code: LV Free format text: LAPSE BECAUSE OF FAILURE TO SUBMIT A TRANSLATION OF THE DESCRIPTION OR TO PAY THE FEE WITHIN THE PRESCRIBED TIME-LIMIT Effective date: 20250319 |
|
| PG25 | Lapsed in a contracting state [announced via postgrant information from national office to epo] |
Ref country code: BG Free format text: LAPSE BECAUSE OF FAILURE TO SUBMIT A TRANSLATION OF THE DESCRIPTION OR TO PAY THE FEE WITHIN THE PRESCRIBED TIME-LIMIT Effective date: 20250319 Ref country code: GR Free format text: LAPSE BECAUSE OF FAILURE TO SUBMIT A TRANSLATION OF THE DESCRIPTION OR TO PAY THE FEE WITHIN THE PRESCRIBED TIME-LIMIT Effective date: 20250620 |
|
| REG | Reference to a national code |
Ref country code: NL Ref legal event code: MP Effective date: 20250319 |
|
| REG | Reference to a national code |
Ref country code: AT Ref legal event code: MK05 Ref document number: 1777360 Country of ref document: AT Kind code of ref document: T Effective date: 20250319 |
|
| PG25 | Lapsed in a contracting state [announced via postgrant information from national office to epo] |
Ref country code: NL Free format text: LAPSE BECAUSE OF FAILURE TO SUBMIT A TRANSLATION OF THE DESCRIPTION OR TO PAY THE FEE WITHIN THE PRESCRIBED TIME-LIMIT Effective date: 20250319 |
|
| PG25 | Lapsed in a contracting state [announced via postgrant information from national office to epo] |
Ref country code: SE Free format text: LAPSE BECAUSE OF FAILURE TO SUBMIT A TRANSLATION OF THE DESCRIPTION OR TO PAY THE FEE WITHIN THE PRESCRIBED TIME-LIMIT Effective date: 20250319 |
|
| REG | Reference to a national code |
Ref country code: DE Ref legal event code: R084 Ref document number: 602023002482 Country of ref document: DE |
|
| PG25 | Lapsed in a contracting state [announced via postgrant information from national office to epo] |
Ref country code: SM Free format text: LAPSE BECAUSE OF FAILURE TO SUBMIT A TRANSLATION OF THE DESCRIPTION OR TO PAY THE FEE WITHIN THE PRESCRIBED TIME-LIMIT Effective date: 20250319 |
|
| PG25 | Lapsed in a contracting state [announced via postgrant information from national office to epo] |
Ref country code: ES Free format text: LAPSE BECAUSE OF FAILURE TO SUBMIT A TRANSLATION OF THE DESCRIPTION OR TO PAY THE FEE WITHIN THE PRESCRIBED TIME-LIMIT Effective date: 20250319 Ref country code: PT Free format text: LAPSE BECAUSE OF FAILURE TO SUBMIT A TRANSLATION OF THE DESCRIPTION OR TO PAY THE FEE WITHIN THE PRESCRIBED TIME-LIMIT Effective date: 20250721 |
|
| PGFP | Annual fee paid to national office [announced via postgrant information from national office to epo] |
Ref country code: DE Payment date: 20250730 Year of fee payment: 3 |
|
| PG25 | Lapsed in a contracting state [announced via postgrant information from national office to epo] |
Ref country code: IT Free format text: LAPSE BECAUSE OF FAILURE TO SUBMIT A TRANSLATION OF THE DESCRIPTION OR TO PAY THE FEE WITHIN THE PRESCRIBED TIME-LIMIT Effective date: 20250319 Ref country code: PL Free format text: LAPSE BECAUSE OF FAILURE TO SUBMIT A TRANSLATION OF THE DESCRIPTION OR TO PAY THE FEE WITHIN THE PRESCRIBED TIME-LIMIT Effective date: 20250319 |
|
| PG25 | Lapsed in a contracting state [announced via postgrant information from national office to epo] |
Ref country code: AT Free format text: LAPSE BECAUSE OF FAILURE TO SUBMIT A TRANSLATION OF THE DESCRIPTION OR TO PAY THE FEE WITHIN THE PRESCRIBED TIME-LIMIT Effective date: 20250319 |
|
| PGFP | Annual fee paid to national office [announced via postgrant information from national office to epo] |
Ref country code: FR Payment date: 20250808 Year of fee payment: 3 |
|
| PG25 | Lapsed in a contracting state [announced via postgrant information from national office to epo] |
Ref country code: EE Free format text: LAPSE BECAUSE OF FAILURE TO SUBMIT A TRANSLATION OF THE DESCRIPTION OR TO PAY THE FEE WITHIN THE PRESCRIBED TIME-LIMIT Effective date: 20250319 Ref country code: CZ Free format text: LAPSE BECAUSE OF FAILURE TO SUBMIT A TRANSLATION OF THE DESCRIPTION OR TO PAY THE FEE WITHIN THE PRESCRIBED TIME-LIMIT Effective date: 20250319 |
|
| PG25 | Lapsed in a contracting state [announced via postgrant information from national office to epo] |
Ref country code: RO Free format text: LAPSE BECAUSE OF FAILURE TO SUBMIT A TRANSLATION OF THE DESCRIPTION OR TO PAY THE FEE WITHIN THE PRESCRIBED TIME-LIMIT Effective date: 20250319 |
|
| PG25 | Lapsed in a contracting state [announced via postgrant information from national office to epo] |
Ref country code: SK Free format text: LAPSE BECAUSE OF FAILURE TO SUBMIT A TRANSLATION OF THE DESCRIPTION OR TO PAY THE FEE WITHIN THE PRESCRIBED TIME-LIMIT Effective date: 20250319 |
|
| PG25 | Lapsed in a contracting state [announced via postgrant information from national office to epo] |
Ref country code: IS Free format text: LAPSE BECAUSE OF FAILURE TO SUBMIT A TRANSLATION OF THE DESCRIPTION OR TO PAY THE FEE WITHIN THE PRESCRIBED TIME-LIMIT Effective date: 20250719 |
|
| REG | Reference to a national code |
Ref country code: DE Ref legal event code: R097 Ref document number: 602023002482 Country of ref document: DE |
|
| PG25 | Lapsed in a contracting state [announced via postgrant information from national office to epo] |
Ref country code: DK Free format text: LAPSE BECAUSE OF FAILURE TO SUBMIT A TRANSLATION OF THE DESCRIPTION OR TO PAY THE FEE WITHIN THE PRESCRIBED TIME-LIMIT Effective date: 20250319 |
|
| PLBE | No opposition filed within time limit |
Free format text: ORIGINAL CODE: 0009261 |
|
| STAA | Information on the status of an ep patent application or granted ep patent |
Free format text: STATUS: NO OPPOSITION FILED WITHIN TIME LIMIT |
|
| REG | Reference to a national code |
Ref country code: CH Ref legal event code: L10 Free format text: ST27 STATUS EVENT CODE: U-0-0-L10-L00 (AS PROVIDED BY THE NATIONAL OFFICE) Effective date: 20260128 |
|
| 26N | No opposition filed |
Effective date: 20251222 |