EP4307307A2 - Verfahren zur analyse von massiv parallelen sequenzierungsdaten - Google Patents
Verfahren zur analyse von massiv parallelen sequenzierungsdaten Download PDFInfo
- Publication number
- EP4307307A2 EP4307307A2 EP23205000.5A EP23205000A EP4307307A2 EP 4307307 A2 EP4307307 A2 EP 4307307A2 EP 23205000 A EP23205000 A EP 23205000A EP 4307307 A2 EP4307307 A2 EP 4307307A2
- Authority
- EP
- European Patent Office
- Prior art keywords
- text strings
- unique
- mps
- noise
- representing
- Prior art date
- Legal status (The legal status is an assumption and is not a legal conclusion. Google has not performed a legal analysis and makes no representation as to the accuracy of the status listed.)
- Pending
Links
Images




Classifications
-
- G—PHYSICS
- G16—INFORMATION AND COMMUNICATION TECHNOLOGY [ICT] SPECIALLY ADAPTED FOR SPECIFIC APPLICATION FIELDS
- G16B—BIOINFORMATICS, i.e. INFORMATION AND COMMUNICATION TECHNOLOGY [ICT] SPECIALLY ADAPTED FOR GENETIC OR PROTEIN-RELATED DATA PROCESSING IN COMPUTATIONAL MOLECULAR BIOLOGY
- G16B30/00—ICT specially adapted for sequence analysis involving nucleotides or amino acids
-
- G—PHYSICS
- G16—INFORMATION AND COMMUNICATION TECHNOLOGY [ICT] SPECIALLY ADAPTED FOR SPECIFIC APPLICATION FIELDS
- G16B—BIOINFORMATICS, i.e. INFORMATION AND COMMUNICATION TECHNOLOGY [ICT] SPECIALLY ADAPTED FOR GENETIC OR PROTEIN-RELATED DATA PROCESSING IN COMPUTATIONAL MOLECULAR BIOLOGY
- G16B45/00—ICT specially adapted for bioinformatics-related data visualisation, e.g. displaying of maps or networks
-
- G—PHYSICS
- G16—INFORMATION AND COMMUNICATION TECHNOLOGY [ICT] SPECIALLY ADAPTED FOR SPECIFIC APPLICATION FIELDS
- G16B—BIOINFORMATICS, i.e. INFORMATION AND COMMUNICATION TECHNOLOGY [ICT] SPECIALLY ADAPTED FOR GENETIC OR PROTEIN-RELATED DATA PROCESSING IN COMPUTATIONAL MOLECULAR BIOLOGY
- G16B30/00—ICT specially adapted for sequence analysis involving nucleotides or amino acids
- G16B30/10—Sequence alignment; Homology search
Definitions
- the present disclosure relates to methods of analyzing data derived from massively parallel sequencing (MPS), including methods of displaying data derived from MPS.
- MPS massively parallel sequencing
- VNTR variable number tandem repeats
- STRs short tandem repeats
- tandem repeat analysis is in forensics or human identity testing.
- highly polymorphic STRs are identified using a deoxyribonucleic acid (DNA) sample from an individual and DNA amplification steps, such as polymerase chain reaction (PCR), to provide amplified samples of partial DNA sequences, or amplicons, from the individual's DNA.
- the amplicons can then be matched by size (i.e., repeat numbers) to reference databases, such as the sequences stored in national or local DNA databases.
- amplicons that originate from STR loci can be matched to reference STR databases, including the Federal Bureau of Investigation (FBI) Combined DNA Index System (CODIS) database in the United States, or the National DNA Database (NDNAD) in the United Kingdom, to identify the individual by matching to the STR alleles specific to that individual.
- FBI Federal Bureau of Investigation
- CODIS Combined DNA Index System
- NDNAD National DNA Database
- Forensic DNA analysis is about to cross a threshold where DNA samples will begin to be analyzed routinely by MPS (also sometimes referred to in the art as “nextgeneration” or “current-generation” sequencing).
- MPS also sometimes referred to in the art as "nextgeneration” or "current-generation” sequencing.
- the advent of routine MPS for forensic DNA analysis will create large quantities of nucleotide sequence data that may enable richer exploitation of DNA in forensic applications.
- the resulting nucleotide sequence data should be formatted for exchange among law enforcement entities.
- Data files created by MPS workflows can be larger than 1 gigaByte (GB), making them difficult to transmit or store.
- GB gigaByte
- these files, while text-based, are not human-readable in any practical sense because of their large size. Thus, other human readable representations of the data from MPS workflows are needed.
- a method may comprise selecting a first plurality of text strings that each represent a nucleotide sequence that was read by a massively parallel sequencing (MPS) instrument, wherein the nucleotide sequences represented by the selected first plurality of text strings each correspond to a first target locus, comparing the selected first plurality of text strings to one another to determine an abundance count for each unique text string included in the selected first plurality of text strings, identifying a first number of unique text strings included in the selected first plurality of text strings as representing noise responses, and determining a method detection limit (MDL) as a function of the abundance counts for the first number of unique text strings identified as representing noise responses.
- MDL method detection limit
- the method may further comprise identifying one or more unique text strings included in the selected first plurality of text strings as representing one or more true alleles for the first target locus.
- the first number of unique text strings identified as representing noise responses may include all of the unique text strings included in the selected first plurality of text strings that were not identified as representing the one or more true alleles for the first target locus.
- Identifying one or more unique text strings as representing the one or more true alleles for the first target locus may comprise identifying a unique text string that represents either a short tandem repeat (STR) or a single nucleotide polymorphism (SNP).
- STR short tandem repeat
- SNP single nucleotide polymorphism
- the method may further comprise identifying one or more unique text strings included in the selected first plurality of text strings as representing one or more true alleles for the first target locus and identifying one or more unique text strings included in the selected first plurality of text strings as each representing an artifact.
- the first number of unique text strings identified as representing noise responses may include all of the unique text strings included in the selected first plurality of text strings that were not identified as representing either the one or more true alleles for the first target locus or an artifact.
- Identifying one or more unique text strings as representing the one or more true alleles for the first target locus may comprise identifying a unique text string that represents a short tandem repeat (STR), and identifying one or more unique text strings as representing an artifact comprises identifying a unique text string that represents a stutter artifact of the STR.
- STR short tandem repeat
- determining the MDL may comprise doubling a difference between (i) a largest abundance count for the first number of unique text strings identified as representing noise responses and (ii) a smallest abundance count for the first number of unique text strings identified as representing noise responses. In other embodiments, determining the MDL comprises calculating a product of (i) a constant and (ii) a standard deviation of the abundance counts for the first number of unique text strings identified as representing noise responses. Determining the MDL may further comprise adding a mean of the abundance counts for the first number of unique text strings identified as representing noise responses to the product.
- determining the MDL may comprise calculating a ratio between (i) a mean of the abundance counts for the first number of unique text strings identified as representing noise responses and (ii) a standard deviation of the abundance counts for the first number of unique text strings identified as representing noise responses.
- the method may further comprise selecting a second plurality of text strings that each represent a nucleotide sequence that was read by the MPS instrument, wherein the nucleotide sequences represented by the selected second plurality of text strings each correspond to a second target locus, comparing the selected second plurality of text strings to one another to determine an abundance count for each unique text string included in the selected second plurality of text strings, and identifying a second number of unique text strings included in the selected second plurality of text strings as representing noise responses.
- determining the MDL may comprise determining the MDL as a function of both the abundance counts for the first number of unique text strings identified as representing noise responses and the abundance counts for the second number of unique text strings identified as representing noise responses.
- a method may comprise selecting a first plurality of text strings that each represent a nucleotide sequence that was read by a massively parallel sequencing (MPS) instrument, wherein the nucleotide sequences represented by the selected first plurality of text strings each correspond to a first target locus, comparing the selected first plurality of text strings to one another to determine an abundance count for each unique text string included in the selected first plurality of text strings, and outputting a graphical display, wherein the graphical display comprises a first plurality of graphical elements that each correspond to one of the unique text strings included in the selected first plurality of text strings and that each represent the abundance count determined for the corresponding unique text string.
- MPS massively parallel sequencing
- the graphical display may be a bar graph comprising a plurality of bars that each correspond to one of the unique text strings included in the selected first plurality of text strings, each of the plurality of bars having a height indicative of the abundance count determined for the corresponding unique text string.
- the bar graph may further comprise a label associated with each of the plurality of bars, each label designating the nucleotide sequence represented by the corresponding unique text string.
- the plurality of bars may comprise one or more bars that each represent a true allele for the first target locus.
- the plurality of bars may be arranged in order of decreasing height.
- the plurality of bars may represent a full set of noise responses for the first target locus.
- the plurality of bars may be arranged in a random order.
- the method may further comprise selecting a second plurality of text strings that each represent a nucleotide sequence that was read by the MPS instrument, wherein the nucleotide sequences represented by the selected second plurality of text strings each correspond to a second target locus, and comparing the selected second plurality of text strings to one another to determine an abundance count for each unique text string included in the selected second plurality of text strings.
- the graphical display may further comprise a second plurality of graphical elements that each correspond to one of the unique text strings included in the selected second plurality of text strings and that each represent the abundance count determined for the corresponding unique text string.
- the method may further comprise sequencing a sample using the MPS instrument to generate text strings that each represent a nucleotide sequence that was read by the MPS instrument.
- selecting the first plurality of text strings for which the represented nucleotide sequences each correspond to the first target locus may comprise selecting the first plurality of text strings from among the text strings generated by the MPS instrument.
- references in the specification to "one embodiment,” “an embodiment,” “an illustrative embodiment,” et cetera, indicate that the embodiment described may include a particular feature, structure, or characteristic, but every embodiment may or may not necessarily include that particular feature, structure, or characteristic. Moreover, such phrases are not necessarily referring to the same embodiment. Further, when a particular feature, structure, or characteristic is described in connection with an embodiment, it is submitted that it is within the knowledge of one skilled in the art to effect such feature, structure, or characteristic in connection with other embodiments whether or not explicitly described.
- the disclosed embodiments may be implemented, in some cases, in hardware, firmware, software, or any combination thereof.
- the disclosed embodiments may also be implemented as instructions carried by or stored on a transitory or non-transitory computer-readable storage medium, which may be read and executed by one or more processors.
- a computer-readable storage medium may be embodied as any storage device, mechanism, or other physical structure for storing or transmitting information in a form readable by a computing device (e.g., a volatile or non-volatile memory, a media disc, or other media device).
- STR loci exist in multiple nucleotide sequence states, called alleles.
- SNP loci exist in multiple single nucleotide states (usually two), which may also be called alleles.
- a "nucleotide sequence" may include one or more nucleotides. Alleles can be identical (as in homozygous conditions) or differ from one another by nucleotide sequence. In addition, STR alleles often differ from one another by sequence length (whereas the length of an SNP allele is always one, i.e., a single nucleotide).
- Allelotyping is the process of identifying the one or more "true” alleles present at one or more loci in a given sample (by way of example, for a sample from one human, the one "true” allele for each hemizygous locus, the two identical "true” alleles for each homozygous locus, or the two non-identical "true” alleles for each heterozygous locus).
- the FBI and other law enforcement agencies around the world have selected about twenty-four specific STR loci for use in forensic DNA analysis applications. These STR loci have been selected because they are highly polymorphic, i.e., multiple alleles exist within the relevant populations. For example, the thirteen STR loci considered by the FBI as their "core" loci each exhibit at least eight different common allelic forms.
- a typical MPS process starts with a DNA sample, which is typically amplified using PCR (however, it will be appreciated that certain DNA samples can also be directly sequenced by MPS instruments without pre-amplification).
- the output of the MPS process typically takes the form of one or more computer files containing text strings representing the nucleotide sequences that were determined by the MPS instrument.
- the parallel nature of MPS results in numerous replicates of the nucleotide sequence of each allele. This is particularly true when the DNA is pre-amplified by PCR, where the number of replicates of each allelic sequence may number in the tens of thousands.
- both the PCR pre-amplification process and the sequencing process itself have non-trivial error rates.
- a first error type is the replacement of a correct nucleotide with an incorrect nucleotide (for example, where the MPS instrument incorrectly reads the nucleotide).
- a second error type is the erroneous insertion or deletion of one or more nucleotides. This second type of error is more common in DNA sequences where homopolymeric stretches of the same nucleotide occur.
- a third error type occurs when additional motifs in a tandem repeat sequence are inserted or deleted.
- This third type of error is more frequent in long stretches of tandem repeats than in shorter ones and occurs as a result of a strand-slippage mechanism during DNA polymerase replication as part of PCR amplification or during sequencing processes that employ DNA polymerase.
- Strand slippage error is commonly referred to as "stutter” in forensic science. While stutter is an error, in common forensic science practice, stutter is often differentiated from the instrumental noise baseline and is instead typically called an "artifact.” Other artifacts, such as contamination from contributors other than the intended subject and instrument- or method-specific artifacts, are also possible. As described further below, such artifacts may optionally be considered (or not be considered) to be “noise” responses, depending on the particular embodiment of the present disclosure.
- the diversity of unique nucleotide sequences generated by a PCR-MPS workflow can be illustrated using an experiment performed on a DNA sample from an anonymous human subject.
- This anonymous human subject was known to contain allele numbers 15 and 16 (with known sequences TCTA [TCTG] 2 [TCTA] 12 and TCTA [TCTG] 3 [TCTA] 12 , respectively) at the D3S1358 locus.
- the MPS instrument returned approximately 130,000 replicate sequences for the two alleles at this locus (i.e., an average of 65,000 replicate sequences per allele). In the absence of error, only these two "true" allele nucleotide sequences would have been returned in the data generated by the MPS instrument.
- FIG. 2 shows twenty of the 2108 unique nucleotide sequences output by the MPS instrument (the top ten most abundant nucleotide sequences and ten "singleton" nucleotide sequences that each occurred only once).
- the two most abundant unique nucleotide sequences correspond to the "true” alleles (particularly, allele numbers 15 and 16), and the next three most abundant unique nucleotide sequences correspond to PCR stutter artifacts (which may optionally be considered to be “noise” responses).
- the less abundant unique nucleotide sequences exhibit a wide range of mutations, including sequence truncations and base substitution errors, and are all considered to be “noise” responses.
- an instrumental analysis method should have an objective method detection limit (MDL) above which responses representing meaningful information can be reliably discriminated from background noise responses.
- MDL generally refers to the detection limit based on the entire analytical method including sample preparation and instrumental analysis.
- An instrument detection limit (IDL) is a similar concept, but it is typically limited to considerations of the instrument/detector system.
- level of detection (LOD) is often used synonymously with both MDL and IDL. It will be appreciated that specific fields may use alternate terminology specific to their applications.
- LOD level of detection
- the MDL is often termed an analytical threshold (AT). While the present disclosure will generally refer to the determination of an MDL from MPS data, those of skill in the art will appreciate that the concepts of the present disclosure are also applicable to the determination of similar values, regardless of the specific terminology used.
- an alpha level of 0.1 may be selected for a 99% confidence level.
- MDL k ⁇ ⁇ b
- k is a constant (often 3)
- ⁇ b is the standard deviation of the intercept
- An instrument response baseline is an expression of noise responses as a function of a dependent variable, often time.
- the use of noise baselines facilitates the multiple measurements needed for calculating error variability, but without the need to re-analyze the same sample(s) multiple times.
- signal corresponds to instrument responses in time intervals where analyte responses are found, while background noise corresponds to instrument responses in time intervals where analyte responses are absent.
- Time intervals where signal is present may also contain noise, which is why the classical measure of signal corresponds to the mean of multiple measurements (thereby, averaging out noise variation).
- time intervals where signal is absent contain only noise.
- This method has particular application when the instrumental analysis involves chromatography or electrophoresis and a natural noise baseline is formed by formatting data along an axis that represents time (as in retention time) or distance (as in migration distance).
- MPS data are of a different form and format from the data generated by current standard forensic DNA analysis techniques for STR, SNP, and mitochondrial DNA (mtDNA) markers.
- STR analysis techniques the various alleles are discriminated using CE, with alleles of different sizes exhibiting differential electrophoretic retention times.
- time windows in electropherograms where signal and artifacts are absent present natural noise baselines useful for analysis.
- STR alleles can be sequenced using previous-generation Sanger sequencing, described further below.
- Current SNP analysis techniques include PCR-based methods, DNA microarray-based methods, and sequencing-based methods (such as previous-generation Sanger sequencing).
- PCR- and microarray-based methods of analyzing SNP markers produce data forms that can be analyzed for background noise using repeated measures methods.
- neither of these methods produces a usable dimension-dependent (e.g., time-dependent or distance-dependent) noise baseline.
- Current mtDNA analysis techniques rely primarily on previous-generation Sanger sequencing.
- the previous-generation Sanger sequencing method is a time-dependent process and, therefore, the data produced by this method includes a noise baseline suitable for noisebaseline-based analyses.
- the Sanger sequencing process uses CE through which DNA sequences are deciphered one nucleotide at a time as detected by retention time differences of one-nucleotide different DNA fragments.
- the noise baseline is clearly observable in Sanger sequencing electropherograms as minor fluorescence responses underlying the fluorescence responses of the analytes (DNA fragments). Pure noise baselines in the absence of signal are also available in time windows where target analyte is not present.
- the low-level raw data generated by MPS instruments does have a time dimension in fluorescence or hydrogen ion detection (depending upon the particular sequencing technology used by the MPS instrument).
- On-board software in MPS instruments typically performs primary analysis of this raw data to produce nucleotide calls for each position of the sequence strand, along with quality scores that estimate the confidence in each nucleotide call.
- the large volume and random nature of the sequence reads produced by MPS instruments makes direct interpretation of this primary data by forensic or medical analysts impractical. Rather, secondary analysis of the sequence reads is necessary.
- the main method currently used for such secondary analysis is alignment of the sequence reads to one or more reference sequences, along with variant calling, where differences between the sequence reads and the reference sequence(s) are identified.
- nucleotide-position-dependent signal and noise baseline This alignment produces a nucleotide-position-dependent signal and noise baseline, which can be visualized in the pileup presentation available in most alignment software.
- the x-axis of a read pileup is reference nucleotide position. Any given DNA reference nucleotide position can be represented in the sequence reads by five different primary analysis results (nucleotide states): A (adenine), C (cytosine), G (guanine), T (thymine), or N (unknown).
- A adenine
- C cytosine
- G guanine
- T thymine
- N unknown
- the present disclosure relates to methods of analyzing MPS data to determine MDLs for MPS-based workflows (which may then be used in secondary analysis of MPS data resulting from these MPS-based workflows).
- the presently disclosed methods express MPS data in a way that creates an intuitive categorization of signal and background noise and, further, allows background noise to be viewed in a manner consistent with a noise baseline. As such, these methods will allow forensic and/or medical analysts to perform secondary analysis of MPS data using familiar signal-to-noise-based considerations.
- MPS instrument responses are expressed as a function of "unique nucleotide sequence.”
- "unique nucleotide sequence” as type of quantity (i.e., a measurable real property) having a dimension of one, consistent with its status as a counting quantity.
- the present disclosure also relates to methods of displaying MPS data that utilize MPS instrument responses being expressed as a function of "unique nucleotide sequence.”
- the present disclosure proposes a new type of graphical display for MPS data in which the independent variable (typically represented on the ordinate or y-axis) is abundance count and the dependent variable (typically represented on the abscissa or x-axis) is unique nucleotide sequence.
- the present disclosure uses the term "kopiagram” to refer to such graphical displays. The kopiagram formats both signal and noise as counting quantities that are expressed on the same basis, allowing these quantities to be directly related and compared.
- the kopiagram also allows the expression of a proper noise baseline in which the unique nucleotide sequences are categorized. As a counted quantity, unique nucleotide sequence has no particular order of display. As such, unique nucleotide sequences can be presented in any desired order in a kopiagram (e.g., in order of decreasing/increasing abundance count, fragment length, lexographic order, random order, etc.).
- the method 100 may be implemented as one or more software routines executed by one or more processors.
- the method 100 may be performed by a processor of the MPS instrument analyzing the sample, in some embodiments, or by a processor of a separate computing device that receives nucleotide sequence data generated by the MPS instrument (for instance, in the form of a text-based computer file, such as a FASTA or FASTQ formatted file), in other embodiments.
- the method 100 is illustrated in FIG. 1 as a number of blocks 102-120, which will be described in detail below. It will be appreciated that, although the method 100 is generally shown in FIG. 1 and described below as having a linear workflow, the method 100 may be implemented using any number of workflows (including, by way of example, workflows in which various portions of the method 100 are performed in parallel).
- the method 100 begins with block 102 in which a sample is sequenced using an MPS instrument to generate a number of text strings that each represent a nucleotide sequence read by the MPS instrument.
- a positive or negative control sample may be sequenced using the MPS instrument.
- block 102 may involve receiving a text-based computer file that contains a number of text strings that each represent a nucleotide sequence read by an MPS instrument. In either case, the text strings will each contain a number of characters that each represent a single nucleotide of a nucleotide sequence read by the MPS instrument.
- block 102 may involve receiving such a FASTA or FASTQ file and reading a number of text strings that each represent a nucleotide sequence from that file. In other embodiments, block 102 may involve receiving files in different formats (other than FASTA or FASTQ).
- each of the received text strings is evaluated to determine whether it includes characters that represent a known flanking nucleotide sequence associated with a target locus.
- the nucleotide sequence of each target locus is generally flanked, on both the 5' and 3' ends, by particular flanking nucleotide sequences. These complex flanking nucleotide sequences can be rare or unique in the DNA analyzed by the MPS instrument.
- flanking nucleotide sequences may indicate the presence of a target locus in the nucleotide sequence represented by the text string. It is contemplated that, in other embodiments, the text strings may be searched for other specific nucleotide sequences (e.g., the forward or reverse primer binding sites used to PCR amplify each target locus).
- the presently disclosed methods may be applied to any molecular diagnostics application where specific target loci are being assayed (by way of illustrative example, forensic DNA analysis, medical diagnostics, and the like) and may be applied to any class of target locus, including, but not limited to, STR and SNP loci, mtDNA fragments used to determine haplotypes, and autosomal DNA haplotype fragments including microhap fragments.
- flanking nucleotide sequences, or other specific nucleotide sequences, used in block 104 may be any length. Longer sequences are more likely to be unique, but increasing length should be balanced against the slower bioinformatic processing inherent to longsequence matching routines. Moreover, the longer a sequence, the more likely that reads which should contain the sequence will contain an error, reducing the sequence's value as an identifier.
- block 104 may reference an external, updatable library of flanking nucleotide sequences (or other specific nucleotide sequences).
- the text string matching routine used in block 104 can be stringent (e.g., exact character matching) or flexible (e.g., close, overall matching).
- Block 104 may use any number of bioinformatic approaches, including, but not limited to, string matching routines built into common programming languages (e.g., Java, C++, Perl or Python), regular expression routines built into some programming languages (e.g., Perl) or available as modules for other programming languages, or the like.
- each text string determined to correspond to a particular target locus may be grouped or segregated by locus.
- each text string determined to correspond to a particular target locus may be tagged with specific metadata indicating this relationship.
- text strings that are not identified as corresponding to a target locus e.g., where the text string does not contain a known flanking nucleotide sequence associated with any of the target loci being assayed
- blocks 106-116 of the method 100 are generally performed on a locus-by-locus basis. As indicated in the illustrative embodiment of FIG. 1 , blocks 106-116 may be repeated for multiple target loci identified as present in the sample in block 104. In some embodiments, block 106 may involve selecting a locus-specific list containing all of the text strings determined in block 104 to contain characters that represent a known flanking nucleotide sequence associated with a particular target locus. In other embodiments, block 106 may involve selecting all text strings that were tagged with specific metadata in block 104.
- each of the text strings selected in block 106 are trimmed to remove characters that do not represent the nucleotide sequence of interest. For instance, in some embodiments, all characters except those representing the particular target locus (e.g., the STR, the SNP, the mtDNA fragment, or other genetic marker) may be removed from each of the selected text strings. It will be appreciated that, where the target locus is an SNP, the text strings may each contain only a single text character (representing a single nucleotide) after block 108.
- the target locus is an SNP
- the text strings may each contain only a single text character (representing a single nucleotide) after block 108.
- the characters representing the 5' and 3' flanking nucleotide sequences are removed from each of the selected text strings in block 108.
- the selected text strings remain identified with the particular target locus due to the grouping, metadata tagging, or other segregation procedure performed in block 104. It is contemplated that, in some embodiments of the method 100, block 108 may be omitted where all characters in the selected text strings represent the nucleotide sequence of interest.
- block 110 determines an abundance count for each unique nucleotide sequence represented by the selected text strings.
- block 110 involves comparing the selected text strings to one another to determine each unique text string and its abundance within the group of selected text strings. Block 110 may be performed by applying a stringent text string matching routine (e.g., exact character matching) to the selected text strings.
- a stringent text string matching routine e.g., exact character matching
- Block 110 may also involve sorting the unique text strings, each representing a unique nucleotide sequence read by the MPS instrument, into a list according to their abundance counts.
- FIG. 2 illustrates top and bottom portions of such a list, in which the hundreds of unique nucleotide sequences output by an MPS instrument and determined to be associated with the D3S1358 locus were sorted by abundance count.
- FIG. 3 illustrates similar lists for two SNP loci.
- the unique nucleotide sequences output by an MPS instrument and determined to be associated with the rs 1805007 and rs1681982 loci, respectively, have been sorted by abundance count in FIG. 3 . It will be appreciated that the exact-matching scheme used in block 110 will result in an abundance count (i.e., a number of occurrences) for each even slightly different nucleotide sequence.
- the method 100 proceeds to block 112 in which the unique text strings representing noise responses are identified from among the selected text strings.
- the unique text strings representing noise responses may be identified in block 112 in any number of ways.
- the sample may be a known standard with a known informative signal profile that can be removed, leaving only the noise responses.
- the method 100 might be used to analyze a known standard having a genotype of alleles sized 10 and 14 at a given locus.
- block 112 may involve removing or ignoring the unique text strings representing size 10 and 14 alleles (and, optionally, stutter artifacts of those alleles) and identifying all of the remaining unique text strings as representing noise responses.
- block 112 may involve block 114 in which the unique text strings representing the "true” allele(s) are identified from among the selected text strings.
- Block 114 may involve an allelotyping algorithm used to identify the unique text strings representing the "true” allele(s) based on the abundance counts determined in block 110. For instance, in some embodiments, any of the allelotyping methods described in U.S. Patent Application No.
- block 112 may be used to identify the unique text strings representing the "true” allele(s) for the target locus.
- identification of the unique text strings representing "true” allele(s) may be performed prior to identification of the unique text strings representing noise responses, to ensure that the "true” alleles are not identified as noise responses.
- block 112 may involve identifying all unique text strings determined not to represent a "true” allele as instead representing a noise response.
- block 112 may also involve block 116 (in addition to block 114) in which the unique text strings representing artifacts are identified from among the selected text strings.
- block 116 may involve an allelotyping algorithm used to identify the unique text strings representing such artifacts based on the abundance counts determined in block 110. For instance, in some embodiments, any of the allelotyping methods described in U.S. Patent Application No.
- block 112 may be used to identify the unique text strings representing artifacts.
- identification of the unique text strings representing "true” allele(s) and artifacts may be performed prior to identification of the unique text strings representing noise responses, to ensure that the "true” alleles and artifacts are not identified as noise responses.
- block 112 may involve identifying all unique text strings determined not to represent either a "true” allele or an artifact as instead representing a noise response.
- the method 100 may optionally return to block 106 in which the text strings representing nucleotide sequences associated with another particular target locus are selected for processing in blocks 106-116 in the same manner described above.
- the method 100 may involve performing the blocks 106-116 for each of the target loci (in either an iterative or parallel fashion).
- block 118 determining an MDL
- block 120 outputting a graphical display
- blocks 118, 120 may each be based upon the results of blocks 106-116 from any number of samples or tests.
- an MDL is determined as function of the abundance counts determined in block 110 for the unique text strings identified as representing noise responses in block 112. It is contemplated that the MDL may be determined in block 118 by any number of methods using the abundance counts associated with the noise responses. For instance, any of the approaches or techniques described above for determining an MDL associated with an analytical method may be applied in block 118. In some embodiments, block 118 may involve applying a form of Equation (5) to the abundance counts associated with the noise responses (e.g., the MDL may be calculated by subtracting the smallest abundance count associated with a noise response from the largest abundance count associated with a noise response and multiplying that difference by two).
- block 118 may involve applying a form of Equation (6) to the abundance counts associated with the noise responses (e.g., the MDL may be calculated by multiplying the standard deviation of the abundance counts associated with the noise responses by a constant and adding that product to the mean of the abundance counts associated with the noise responses).
- the abundance counts used in determining the MDL in block 118 may be associated with noise responses corresponding to one or more target loci, one or more samples, and/or one or more tests.
- a graphical display representing the one or more target loci (corresponding to the text strings selected in one or more iterations of block 106) is output.
- "outputting the graphical display” may involve outputting electronic signals containing data necessary to cause a display device (local or remote) to render the graphical display.
- the graphical display output in block 120 may take any number of forms. Generally described, however, this graphical display will comprise a plurality of graphical elements that each correspond to one of the unique text strings for which an abundance count was determined in block 110 and that each graphically represent that abundance count.
- the data derived from MPS-based workflows is of a fundamentally different form.
- CE-based analysis reports the sizes (lengths) of the target PCR amplicons (which are aggregated by size, regardless of nucleotide sequence)
- MPS-based analysis reports the actual nucleotide sequences of the target PCR amplicons.
- the presently disclosed "kopiagrams" take account of this fundamental difference by organizing the data by unique nucleotide sequence.
- block 120 involves the output of such a kopiagram, examples of which are shown in FIGS. 4-7 (further described below).
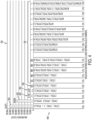
- FIG. 4 One illustrative example of a kopiagram 400 is shown in FIG. 4 .
- the kopiagram 400 graphically represents the exemplary data contained in FIG. 2 .
- the kopiagram 400 is illustratively embodied as a bar graph that includes a plurality of bars 402-406.
- Each of the bars 402-406 corresponds to a unique text string (included in the text strings selected in block 106 as corresponding to the D3S1358 locus).
- the bars 402-406 correspond to the ten unique text strings (representing ten unique nucleotide sequences) that were determined to have the ten highest abundance counts in block 110 and to ten additional unique text strings (representing another ten unique nucleotide sequences) that appear as singletons in the data set.
- Bars 402 correspond to the two "true” alleles for the particular locus represented by the kopiagram 400 (i.e., D3S1358).
- Bars 404 each correspond to a stutter artifact of one of the "true” alleles.
- Bars 406 each correspond to a sequencing error of one of the "true” alleles.
- the eleventh bar in the chart displays a T to C substitution in the first nucleotide position and a T to G substitution in the fifth nucleotide position.
- bars 404-406 may each be considered represent a noise response. While the kopiagram 400 includes eighteen noise responses, other embodiments of the kopiagram may display more or less noise responses. In some illustrative embodiments, the number of noise responses included in the kopiagram may be configurable by a user.
- Each of the bars 402-406 of the kopiagram 400 has a height that is indicative of the abundance count (determined in block 110) for the unique text string that is represented by that bar 402-406.
- the y-axis of the kopiagram 400 includes indicia representing various abundance counts and may be used to quantify signal response.
- the x-axis of the kopiagram 400 includes a series of labels 408 (each label 408 being associated with one of the bars 402-406).
- the labels 408 each designate the unique nucleotide sequence represented by the unique text string that corresponds to one of the bars 402-406.
- the labels 408 include categorical designations using the International Society for Forensic Genetics (ISFG) convention for allele designations.
- the labels 408 further include a size-defined allele number (in parentheses).
- the bars 402-206 (and the associated labels 408) of the kopiagram 400 may be arranged in any desired order.
- the bars 402-406 are arranged in order of decreasing abundance count for the corresponding unique text strings/nucleotide sequences (from left to right).
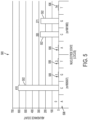
- FIG. 5 Another illustrative example of a kopiagram 500 is shown in FIG. 5 .
- the kopiagram 500 graphically represents the exemplary data contained in FIG. 3 .
- the kopiagram 500 is illustratively embodied as a bar graph that includes a plurality of bars 502, 506.
- Each of the bars 502, 506 corresponds to a unique text string (included in the text strings selected in block 106 as corresponding to either the rs1805007 locus or the rs1681982 locus).
- the bars 502, 506 correspond to the seven unique text strings (representing seven unique nucleotide sequences or states) that were determined to have non-zero abundance counts in block 110.
- Bars 502 correspond to the "true” alleles for the two target loci represented by the kopiagram 400, while bars 506 each correspond to a sequencing error of one of these "true” alleles.
- the kopiagram 500 has other similar features to the kopiagram 400 discussed above (e.g., the labels 508).
- the kopiagrams 600, 700 each include a plurality of bars 606, 706 (only a few of which are labeled in FIGS. 6-7 ) that represent the abundance counts of a full set of noise responses but do not include any graphical elements corresponding to "true" alleles or stutter artifacts.
- Each of the bars 606, 706 corresponds to a unique text string (included in the text strings selected in block 106 as corresponding to a particular target locus) that was identified as representing a noise response (in block 112).
- the kopiagrams 600, 700 as shown in FIGS.
- 6-7 may serve as a mechanism for visualizing the noise baseline.
- the noise responses are on the same "scale” as the signal (i.e., the "true” allele(s), which are also defined by unique nucleotide sequence).
- other current systems e.g., reference alignment-based systems
- for typing alleles do not have a natural noise measure at the allele level.
Landscapes
- Life Sciences & Earth Sciences (AREA)
- Physics & Mathematics (AREA)
- Engineering & Computer Science (AREA)
- Bioinformatics & Cheminformatics (AREA)
- Medical Informatics (AREA)
- Theoretical Computer Science (AREA)
- Health & Medical Sciences (AREA)
- Spectroscopy & Molecular Physics (AREA)
- Biophysics (AREA)
- Bioinformatics & Computational Biology (AREA)
- Biotechnology (AREA)
- Evolutionary Biology (AREA)
- General Health & Medical Sciences (AREA)
- Chemical & Material Sciences (AREA)
- Analytical Chemistry (AREA)
- Proteomics, Peptides & Aminoacids (AREA)
- Data Mining & Analysis (AREA)
- Measuring Or Testing Involving Enzymes Or Micro-Organisms (AREA)
Applications Claiming Priority (3)
| Application Number | Priority Date | Filing Date | Title |
|---|---|---|---|
| US14/489,198 US11475980B2 (en) | 2013-07-29 | 2014-09-17 | Methods of analyzing massively parallel sequencing data |
| PCT/US2015/048082 WO2016043974A1 (en) | 2014-09-17 | 2015-09-02 | Methods of analyzing massively parallel sequencing data |
| EP15764021.0A EP3195169B1 (de) | 2014-09-17 | 2015-09-02 | Verfahren zur analyse von massiv parallelen sequenzierungsdaten |
Related Parent Applications (1)
| Application Number | Title | Priority Date | Filing Date |
|---|---|---|---|
| EP15764021.0A Division EP3195169B1 (de) | 2014-09-17 | 2015-09-02 | Verfahren zur analyse von massiv parallelen sequenzierungsdaten |
Publications (2)
| Publication Number | Publication Date |
|---|---|
| EP4307307A2 true EP4307307A2 (de) | 2024-01-17 |
| EP4307307A3 EP4307307A3 (de) | 2024-03-27 |
Family
ID=55533686
Family Applications (2)
| Application Number | Title | Priority Date | Filing Date |
|---|---|---|---|
| EP23205000.5A Pending EP4307307A3 (de) | 2014-09-17 | 2015-09-02 | Verfahren zur analyse von massiv parallelen sequenzierungsdaten |
| EP15764021.0A Active EP3195169B1 (de) | 2014-09-17 | 2015-09-02 | Verfahren zur analyse von massiv parallelen sequenzierungsdaten |
Family Applications After (1)
| Application Number | Title | Priority Date | Filing Date |
|---|---|---|---|
| EP15764021.0A Active EP3195169B1 (de) | 2014-09-17 | 2015-09-02 | Verfahren zur analyse von massiv parallelen sequenzierungsdaten |
Country Status (4)
| Country | Link |
|---|---|
| EP (2) | EP4307307A3 (de) |
| CA (2) | CA2961563C (de) |
| MX (1) | MX2017003350A (de) |
| WO (1) | WO2016043974A1 (de) |
Families Citing this family (1)
| Publication number | Priority date | Publication date | Assignee | Title |
|---|---|---|---|---|
| CA3088012A1 (en) * | 2018-01-10 | 2019-07-18 | Memorial Sloan Kettering Cancer Center | Generating configurable text strings based on raw genomic data |
Family Cites Families (1)
| Publication number | Priority date | Publication date | Assignee | Title |
|---|---|---|---|---|
| US11475980B2 (en) * | 2013-07-29 | 2022-10-18 | Battelle Memorial Institute | Methods of analyzing massively parallel sequencing data |
-
2015
- 2015-09-02 EP EP23205000.5A patent/EP4307307A3/de active Pending
- 2015-09-02 MX MX2017003350A patent/MX2017003350A/es unknown
- 2015-09-02 WO PCT/US2015/048082 patent/WO2016043974A1/en not_active Ceased
- 2015-09-02 EP EP15764021.0A patent/EP3195169B1/de active Active
- 2015-09-02 CA CA2961563A patent/CA2961563C/en active Active
- 2015-09-02 CA CA3190180A patent/CA3190180C/en active Active
Also Published As
| Publication number | Publication date |
|---|---|
| CA2961563C (en) | 2023-04-04 |
| CA3190180C (en) | 2026-03-31 |
| CA2961563A1 (en) | 2016-03-24 |
| EP4307307A3 (de) | 2024-03-27 |
| MX2017003350A (es) | 2017-10-23 |
| CA3190180A1 (en) | 2016-03-24 |
| WO2016043974A1 (en) | 2016-03-24 |
| EP3195169B1 (de) | 2023-10-25 |
| EP3195169A1 (de) | 2017-07-26 |
Similar Documents
| Publication | Publication Date | Title |
|---|---|---|
| Middleton et al. | Saliva cell type DNA methylation reference panel for epidemiological studies in children | |
| US10347365B2 (en) | Systems and methods for visualizing a pattern in a dataset | |
| AU2025271524A1 (en) | Methods and processes for non-invasive assessment of genetic variations | |
| Greninger et al. | Metagenomics to assist in the diagnosis of bloodstream infection | |
| EP2926288B1 (de) | Präzise und schnelle abbildung von gezielten sequenzierungsablesungen | |
| CN110770840B (zh) | 用于对来自已知或未知基因型的多个贡献者的dna混合物分解和定量的方法和系统 | |
| AU2021269294A1 (en) | Validation methods and systems for sequence variant calls | |
| US11475980B2 (en) | Methods of analyzing massively parallel sequencing data | |
| US11655498B2 (en) | Systems and methods for genetic identification and analysis | |
| CN110168648A (zh) | 序列变异识别的验证方法和系统 | |
| EP3794145A1 (de) | Ableitung der auswahl in weissen blutzellen angepassten zellfreien dna-varianten und/oder in rna-varianten | |
| US20050149271A1 (en) | Methods and apparatus for complex gentics classification based on correspondence anlysis and linear/quadratic analysis | |
| Smart et al. | A novel phylogenetic approach for de novo discovery of putative nuclear mitochondrial (pNumt) haplotypes | |
| US12499972B2 (en) | Identifying false positive variants using a significance model | |
| Duffy et al. | Evidentiary evaluation of single cells renders highly informative forensic comparisons across multifarious admixtures | |
| CN112885407B (zh) | 一种基于二代测序的微单倍型检测分型系统和方法 | |
| US20160078169A1 (en) | Method of and apparatus for providing information on a genomic sequence based personal marker | |
| WO2007119779A1 (ja) | 個体識別方法および装置 | |
| CN119832980B (zh) | 基因变异检测方法、装置、电子设备及存储介质 | |
| EP3195169B1 (de) | Verfahren zur analyse von massiv parallelen sequenzierungsdaten | |
| US20260078439A1 (en) | Next-Generation Sequencing Pipeline for Detection of Ultrashort Single-Stranded Cell-Free DNA | |
| Bustos et al. | Impact of non-standardized reporting on reproducibility, usability, and integration in nasopharyngeal metagenomic research: A systematic review | |
| Nyström-Persson et al. | Precise and scalable metagenomic profiling with sample-tailored minimizer libraries | |
| US11468970B2 (en) | Allelotyping methods for massively parallel sequencing | |
| CN119580852B (zh) | 一种宏基因组数据集的生物地球化学元素循环分析方法及系统 |
Legal Events
| Date | Code | Title | Description |
|---|---|---|---|
| PUAI | Public reference made under article 153(3) epc to a published international application that has entered the european phase |
Free format text: ORIGINAL CODE: 0009012 |
|
| STAA | Information on the status of an ep patent application or granted ep patent |
Free format text: STATUS: THE APPLICATION HAS BEEN PUBLISHED |
|
| AC | Divisional application: reference to earlier application |
Ref document number: 3195169 Country of ref document: EP Kind code of ref document: P |
|
| AK | Designated contracting states |
Kind code of ref document: A2 Designated state(s): AL AT BE BG CH CY CZ DE DK EE ES FI FR GB GR HR HU IE IS IT LI LT LU LV MC MK MT NL NO PL PT RO RS SE SI SK SM TR |
|
| PUAL | Search report despatched |
Free format text: ORIGINAL CODE: 0009013 |
|
| AK | Designated contracting states |
Kind code of ref document: A3 Designated state(s): AL AT BE BG CH CY CZ DE DK EE ES FI FR GB GR HR HU IE IS IT LI LT LU LV MC MK MT NL NO PL PT RO RS SE SI SK SM TR |
|
| RIC1 | Information provided on ipc code assigned before grant |
Ipc: G16B 45/00 20190101ALI20240220BHEP Ipc: G16B 30/00 20190101AFI20240220BHEP |
|
| STAA | Information on the status of an ep patent application or granted ep patent |
Free format text: STATUS: REQUEST FOR EXAMINATION WAS MADE |
|
| 17P | Request for examination filed |
Effective date: 20240822 |
|
| RBV | Designated contracting states (corrected) |
Designated state(s): AL AT BE BG CH CY CZ DE DK EE ES FI FR GB GR HR HU IE IS IT LI LT LU LV MC MK MT NL NO PL PT RO RS SE SI SK SM TR |