EP4253954A1 - Method for assessing mitochondrial function in tissue or organ other than kidney in test subject - Google Patents
Method for assessing mitochondrial function in tissue or organ other than kidney in test subject Download PDFInfo
- Publication number
- EP4253954A1 EP4253954A1 EP21915120.6A EP21915120A EP4253954A1 EP 4253954 A1 EP4253954 A1 EP 4253954A1 EP 21915120 A EP21915120 A EP 21915120A EP 4253954 A1 EP4253954 A1 EP 4253954A1
- Authority
- EP
- European Patent Office
- Prior art keywords
- concentration
- cre
- blood
- bun
- kidney
- Prior art date
- Legal status (The legal status is an assumption and is not a legal conclusion. Google has not performed a legal analysis and makes no representation as to the accuracy of the status listed.)
- Pending
Links
- 238000012360 testing method Methods 0.000 title claims abstract description 52
- 210000000056 organ Anatomy 0.000 title claims abstract description 46
- 210000003734 kidney Anatomy 0.000 title claims abstract description 45
- 238000000034 method Methods 0.000 title claims abstract description 28
- 230000004898 mitochondrial function Effects 0.000 title claims abstract description 13
- DDRJAANPRJIHGJ-UHFFFAOYSA-N creatinine Chemical compound CN1CC(=O)NC1=N DDRJAANPRJIHGJ-UHFFFAOYSA-N 0.000 claims abstract description 252
- 229940109239 creatinine Drugs 0.000 claims abstract description 126
- 210000004369 blood Anatomy 0.000 claims abstract description 121
- 239000008280 blood Substances 0.000 claims abstract description 121
- PNNCWTXUWKENPE-UHFFFAOYSA-N [N].NC(N)=O Chemical compound [N].NC(N)=O PNNCWTXUWKENPE-UHFFFAOYSA-N 0.000 claims abstract description 26
- 230000002438 mitochondrial effect Effects 0.000 claims abstract description 24
- 210000001519 tissue Anatomy 0.000 claims description 41
- 210000004185 liver Anatomy 0.000 claims description 16
- 210000002216 heart Anatomy 0.000 claims description 13
- 210000004556 brain Anatomy 0.000 claims description 10
- 210000000496 pancreas Anatomy 0.000 claims description 10
- 238000013480 data collection Methods 0.000 claims description 7
- 210000003486 adipose tissue brown Anatomy 0.000 claims description 4
- 241000700159 Rattus Species 0.000 description 63
- NOESYZHRGYRDHS-UHFFFAOYSA-N insulin Chemical compound N1C(=O)C(NC(=O)C(CCC(N)=O)NC(=O)C(CCC(O)=O)NC(=O)C(C(C)C)NC(=O)C(NC(=O)CN)C(C)CC)CSSCC(C(NC(CO)C(=O)NC(CC(C)C)C(=O)NC(CC=2C=CC(O)=CC=2)C(=O)NC(CCC(N)=O)C(=O)NC(CC(C)C)C(=O)NC(CCC(O)=O)C(=O)NC(CC(N)=O)C(=O)NC(CC=2C=CC(O)=CC=2)C(=O)NC(CSSCC(NC(=O)C(C(C)C)NC(=O)C(CC(C)C)NC(=O)C(CC=2C=CC(O)=CC=2)NC(=O)C(CC(C)C)NC(=O)C(C)NC(=O)C(CCC(O)=O)NC(=O)C(C(C)C)NC(=O)C(CC(C)C)NC(=O)C(CC=2NC=NC=2)NC(=O)C(CO)NC(=O)CNC2=O)C(=O)NCC(=O)NC(CCC(O)=O)C(=O)NC(CCCNC(N)=N)C(=O)NCC(=O)NC(CC=3C=CC=CC=3)C(=O)NC(CC=3C=CC=CC=3)C(=O)NC(CC=3C=CC(O)=CC=3)C(=O)NC(C(C)O)C(=O)N3C(CCC3)C(=O)NC(CCCCN)C(=O)NC(C)C(O)=O)C(=O)NC(CC(N)=O)C(O)=O)=O)NC(=O)C(C(C)CC)NC(=O)C(CO)NC(=O)C(C(C)O)NC(=O)C1CSSCC2NC(=O)C(CC(C)C)NC(=O)C(NC(=O)C(CCC(N)=O)NC(=O)C(CC(N)=O)NC(=O)C(NC(=O)C(N)CC=1C=CC=CC=1)C(C)C)CC1=CN=CN1 NOESYZHRGYRDHS-UHFFFAOYSA-N 0.000 description 28
- HVYWMOMLDIMFJA-DPAQBDIFSA-N cholesterol Chemical compound C1C=C2C[C@@H](O)CC[C@]2(C)[C@@H]2[C@@H]1[C@@H]1CC[C@H]([C@H](C)CCCC(C)C)[C@@]1(C)CC2 HVYWMOMLDIMFJA-DPAQBDIFSA-N 0.000 description 26
- 238000013293 zucker diabetic fatty rat Methods 0.000 description 26
- 238000005259 measurement Methods 0.000 description 23
- 238000002600 positron emission tomography Methods 0.000 description 19
- 230000000694 effects Effects 0.000 description 18
- UFTFJSFQGQCHQW-UHFFFAOYSA-N triformin Chemical compound O=COCC(OC=O)COC=O UFTFJSFQGQCHQW-UHFFFAOYSA-N 0.000 description 16
- 102000004877 Insulin Human genes 0.000 description 14
- 108090001061 Insulin Proteins 0.000 description 14
- 229940125396 insulin Drugs 0.000 description 14
- WQZGKKKJIJFFOK-GASJEMHNSA-N Glucose Natural products OC[C@H]1OC(O)[C@H](O)[C@@H](O)[C@@H]1O WQZGKKKJIJFFOK-GASJEMHNSA-N 0.000 description 13
- 235000012000 cholesterol Nutrition 0.000 description 13
- 239000008103 glucose Substances 0.000 description 13
- 208000037265 diseases, disorders, signs and symptoms Diseases 0.000 description 10
- 230000003907 kidney function Effects 0.000 description 7
- 210000002700 urine Anatomy 0.000 description 7
- 108010088751 Albumins Proteins 0.000 description 6
- 102000009027 Albumins Human genes 0.000 description 6
- IJGRMHOSHXDMSA-UHFFFAOYSA-N Atomic nitrogen Chemical compound N#N IJGRMHOSHXDMSA-UHFFFAOYSA-N 0.000 description 6
- 239000000523 sample Substances 0.000 description 6
- 210000001593 brown adipocyte Anatomy 0.000 description 5
- 201000010099 disease Diseases 0.000 description 5
- 210000004027 cell Anatomy 0.000 description 4
- 208000035475 disorder Diseases 0.000 description 4
- XSQUKJJJFZCRTK-UHFFFAOYSA-N Urea Chemical compound NC(N)=O XSQUKJJJFZCRTK-UHFFFAOYSA-N 0.000 description 3
- 239000004202 carbamide Substances 0.000 description 3
- 210000003470 mitochondria Anatomy 0.000 description 3
- 229910052757 nitrogen Inorganic materials 0.000 description 3
- CZMRCDWAGMRECN-UHFFFAOYSA-N 2-{[3,4-dihydroxy-2,5-bis(hydroxymethyl)oxolan-2-yl]oxy}-6-(hydroxymethyl)oxane-3,4,5-triol Chemical compound OCC1OC(CO)(OC2OC(CO)C(O)C(O)C2O)C(O)C1O CZMRCDWAGMRECN-UHFFFAOYSA-N 0.000 description 2
- ZKHQWZAMYRWXGA-KQYNXXCUSA-J ATP(4-) Chemical compound C1=NC=2C(N)=NC=NC=2N1[C@@H]1O[C@H](COP([O-])(=O)OP([O-])(=O)OP([O-])([O-])=O)[C@@H](O)[C@H]1O ZKHQWZAMYRWXGA-KQYNXXCUSA-J 0.000 description 2
- ZKHQWZAMYRWXGA-UHFFFAOYSA-N Adenosine triphosphate Natural products C1=NC=2C(N)=NC=NC=2N1C1OC(COP(O)(=O)OP(O)(=O)OP(O)(O)=O)C(O)C1O ZKHQWZAMYRWXGA-UHFFFAOYSA-N 0.000 description 2
- 241000282412 Homo Species 0.000 description 2
- 241001465754 Metazoa Species 0.000 description 2
- 230000015572 biosynthetic process Effects 0.000 description 2
- 238000004364 calculation method Methods 0.000 description 2
- 238000007796 conventional method Methods 0.000 description 2
- 239000012467 final product Substances 0.000 description 2
- 238000010801 machine learning Methods 0.000 description 2
- 210000002966 serum Anatomy 0.000 description 2
- 238000003786 synthesis reaction Methods 0.000 description 2
- 210000003462 vein Anatomy 0.000 description 2
- 108050005273 Amino acid transporters Proteins 0.000 description 1
- 102000034263 Amino acid transporters Human genes 0.000 description 1
- 241000282693 Cercopithecidae Species 0.000 description 1
- PIWKPBJCKXDKJR-UHFFFAOYSA-N Isoflurane Chemical compound FC(F)OC(Cl)C(F)(F)F PIWKPBJCKXDKJR-UHFFFAOYSA-N 0.000 description 1
- 241000699670 Mus sp. Species 0.000 description 1
- 101000605024 Rattus norvegicus Large neutral amino acids transporter small subunit 1 Proteins 0.000 description 1
- 238000010521 absorption reaction Methods 0.000 description 1
- 230000001154 acute effect Effects 0.000 description 1
- 230000005540 biological transmission Effects 0.000 description 1
- 230000037396 body weight Effects 0.000 description 1
- 208000020832 chronic kidney disease Diseases 0.000 description 1
- 238000012937 correction Methods 0.000 description 1
- 238000010219 correlation analysis Methods 0.000 description 1
- 238000001514 detection method Methods 0.000 description 1
- 230000029087 digestion Effects 0.000 description 1
- 238000006911 enzymatic reaction Methods 0.000 description 1
- 235000013305 food Nutrition 0.000 description 1
- 210000000585 glomerular basement membrane Anatomy 0.000 description 1
- 229960002725 isoflurane Drugs 0.000 description 1
- 208000017169 kidney disease Diseases 0.000 description 1
- 150000002632 lipids Chemical class 0.000 description 1
- 238000004519 manufacturing process Methods 0.000 description 1
- 210000003205 muscle Anatomy 0.000 description 1
- 238000013059 nephrectomy Methods 0.000 description 1
- 201000008383 nephritis Diseases 0.000 description 1
- 230000007170 pathology Effects 0.000 description 1
- 238000004445 quantitative analysis Methods 0.000 description 1
- 238000012552 review Methods 0.000 description 1
- 229940043230 sarcosine Drugs 0.000 description 1
- 235000000346 sugar Nutrition 0.000 description 1
- 150000008163 sugars Chemical class 0.000 description 1
- 208000001072 type 2 diabetes mellitus Diseases 0.000 description 1
Images




Classifications
-
- G—PHYSICS
- G01—MEASURING; TESTING
- G01N—INVESTIGATING OR ANALYSING MATERIALS BY DETERMINING THEIR CHEMICAL OR PHYSICAL PROPERTIES
- G01N33/00—Investigating or analysing materials by specific methods not covered by groups G01N1/00 - G01N31/00
- G01N33/48—Biological material, e.g. blood, urine; Haemocytometers
- G01N33/50—Chemical analysis of biological material, e.g. blood, urine; Testing involving biospecific ligand binding methods; Immunological testing
- G01N33/70—Chemical analysis of biological material, e.g. blood, urine; Testing involving biospecific ligand binding methods; Immunological testing involving creatine or creatinine
-
- G—PHYSICS
- G01—MEASURING; TESTING
- G01N—INVESTIGATING OR ANALYSING MATERIALS BY DETERMINING THEIR CHEMICAL OR PHYSICAL PROPERTIES
- G01N33/00—Investigating or analysing materials by specific methods not covered by groups G01N1/00 - G01N31/00
- G01N33/48—Biological material, e.g. blood, urine; Haemocytometers
- G01N33/50—Chemical analysis of biological material, e.g. blood, urine; Testing involving biospecific ligand binding methods; Immunological testing
-
- G—PHYSICS
- G01—MEASURING; TESTING
- G01N—INVESTIGATING OR ANALYSING MATERIALS BY DETERMINING THEIR CHEMICAL OR PHYSICAL PROPERTIES
- G01N33/00—Investigating or analysing materials by specific methods not covered by groups G01N1/00 - G01N31/00
- G01N33/48—Biological material, e.g. blood, urine; Haemocytometers
- G01N33/50—Chemical analysis of biological material, e.g. blood, urine; Testing involving biospecific ligand binding methods; Immunological testing
- G01N33/62—Chemical analysis of biological material, e.g. blood, urine; Testing involving biospecific ligand binding methods; Immunological testing involving urea
-
- G—PHYSICS
- G01—MEASURING; TESTING
- G01N—INVESTIGATING OR ANALYSING MATERIALS BY DETERMINING THEIR CHEMICAL OR PHYSICAL PROPERTIES
- G01N2800/00—Detection or diagnosis of diseases
- G01N2800/70—Mechanisms involved in disease identification
- G01N2800/7057—(Intracellular) signaling and trafficking pathways
- G01N2800/7066—Metabolic pathways
- G01N2800/708—Nitrogen metabolism, e.g. urea cycle
Definitions
- the present invention relates to a method for assessing mitochondrial function in a tissue or organ other than the kidney in a test subject.
- the present invention also relates to a data collection method for estimating mitochondrial activity in a tissue or organ other than the kidney in a test subject.
- Mitochondria are present in almost all cells that make up living organisms, and are sometimes called “the power plants of cells.” Mitochondria play an important role in producing adenosine triphosphate (ATP), which is an essential energy source for cell activity, from sugars and lipids obtained from digestion of ingested food. For this reason, it is not hard to imagine that the state of health of a living body, which is an aggregate of cells, depends greatly on the active state of mitochondria.
- ATP adenosine triphosphate
- Positron emission tomography (PET) probes for assessing mitochondrial function are known (for example, Non Patent Literature 1).
- the PET probe for example, [ 18 F]BCPP-EF
- MC-I mitochondrial complex I
- PET measurement requires large-scale facilities and specialists in each field for the production of positron-emitting nuclides by a cyclotron, label synthesis of PET probes, collection of image data, quantitative analysis of images, and the like. For this reason, the method for assessing mitochondrial function by PET measurement is by no means highly versatile, and there is a demand for an assessment method that can be implemented more simply.
- an object of the present invention is to provide a method for assessing mitochondrial function more simply.
- the present inventors have found that the ratio (BLTN/CRE) calculated from the blood urea nitrogen (BUN) concentration and blood creatinine (CRE) concentration, which are used as indices for assessing kidney function, surprisingly shows a good correlation with mitochondrial activity in a tissue or organ other than the kidney.
- the present invention is based on this new finding.
- the present invention relates to a method for assessing the mitochondrial function in a tissue or organ other than the kidney in a test subject, including: a step of calculating a ratio (BUN/CRE) of blood urea nitrogen (BUN) concentration to blood creatinine (CRE) concentration in a test subject; and a step of estimating mitochondrial activity in a tissue or organ other than the kidney in the test subject using the calculated ratio (BUN/CRE).
- BUN/CRE blood urea nitrogen
- CRE blood creatinine
- the BUN/CRE value can more accurately assess kidney function than each of the conventionally used values of the blood urea nitrogen (BUN) concentration or blood creatinine (CRE) concentration (for example, Non Patent Literature 2 to 5).
- BUN blood urea nitrogen
- CRE blood creatinine
- the BUN/CRE value is not universally recognized as an assessment index of kidney function, while there is a significant negative correlation with the mitochondrial activity in a tissue or organ other than the kidney. Since the method according to the present invention uses the BUN/CRE value as an index, it is possible to assess the mitochondrial function in a tissue or organ other than the kidney.
- blood urea nitrogen (BUN) concentration and blood creatinine (CRE) concentration can be measured using blood collected from a test subject as a specimen, for example, using a generally used automated biochemical analyzer, and thus this method can be easily implemented.
- the present invention also relates to a data collection method for estimating mitochondrial activity in a tissue or organ other than the kidney in a test subject, including: a step of calculating a ratio (BUN/CRE) of blood urea nitrogen (BUN) concentration to blood creatinine (CRE) concentration in a test subject.
- BUN/CRE blood urea nitrogen
- the tissue or organ may be at least one selected from the group consisting of brain, brown adipose tissue, heart, pancreas, and liver.
- the method for assessing mitochondrial function more simply can be provided.
- a method for assessing mitochondrial function in a tissue or organ other than the kidney in a test subject includes: a step of calculating a ratio (BUN/CRE) of blood urea nitrogen (BUN) concentration to blood creatinine (CRE) concentration in a test subject (calculation step); and a step of estimating mitochondrial activity in a tissue or organ other than the kidney in the test subject using the calculated ratio (BUN/CRE) (estimation step).
- the assessment method according to the present embodiment may further include a step of measuring blood urea nitrogen (BUN) concentration using blood collected from a test subject as a specimen (BUN measurement step); and/or a step of measuring blood creatinine (CRE) concentration using blood collected from the test subject as a specimen (CRE measurement step).
- BUN measurement step a step of measuring blood urea nitrogen (BUN) concentration using blood collected from a test subject as a specimen
- CRE blood creatinine
- Blood urea nitrogen (BUN) concentration can be measured according to a conventional method. Specifically, for example, measurement can be performed by detecting nitrogen contained in urea using blood itself collected from a test subject, or serum or plasma separated from blood. Nitrogen contained in urea can be detected using, for example, a commercially available kit. Further, detection of nitrogen contained in urea may be performed using an automated biochemical analyzer or the like.
- Blood creatinine (CRE) concentration can be measured according to a conventional method. Specifically, for example, measurement can be performed by an enzymatic method (creatinase-sarcosine oxidase-peroxidase method) using blood itself collected from a test subject, or serum or plasma separated from blood. The blood creatinine concentration can be measured using, for example, a commercially available kit. In addition, blood creatinine concentration may be measured using an automated biochemical analyzer or the like.
- the ratio (BUN/CRE) of blood urea nitrogen (BUN) concentration to blood creatinine (CRE) concentration in the test subject is calculated.
- BUN/CRE can be calculated by dividing the blood urea nitrogen concentration (mg/dL) measured in the BUN measurement step by the blood creatinine concentration (mg/dL) measured in the CRE measurement step.
- the calculated ratio (BUN/CRE) is used to estimate mitochondrial activity in a tissue or organ other than the kidney in the test subject. Since the BUN/CRE value shows a negative correlation with mitochondrial activity in a tissue or organ other than the kidney, in the estimation step, using this correlation, the mitochondrial activity in each of tissues or organs (excluding the kidney) of the test subject can be estimated from the calculated ratio (BUN/CRE).
- Mitochondrial activity in each of tissues or organs (excluding the kidney) of a test subject can be estimated by, for example, deriving a relationship between BUN/CRE values and the mitochondrial activity value in each of tissues or organs (excluding the kidney) from a plurality of data pairs (BUN/CRE values and mitochondrial activity values in each of tissues or organs (excluding the kidney)) obtained in advance and using the derived relationship and the BUN/CRE values obtained for the test subject. More specifically, mitochondrial activity in each of tissues or organs (excluding the kidney) of the test subject can be estimated, for example, by calculating a correlation formula from a plurality of data pairs obtained in advance and introducing the BUN/CRE value measured in the test subject into the correlation formula. In addition, the correlation may be derived by machine learning using a huge amount of data.
- the estimated value of mitochondrial activity obtained in the estimation step can also be used to determine whether or not the test subject has a disorder or disease in a particular organ or tissue (excluding the kidney).
- the relationship between the BUN/CRE value and the mitochondrial activity value in the tissue or organ is derived from one or more data pairs obtained in advance from a healthy test subject and one or more data pairs obtained in advance from a test subject having a disorder or disease in a specific tissue or organ (excluding the kidney), and a threshold value that can distinguish between healthy test subjects and test subjects having disorders or diseases in the relevant tissue or organ is obtained in advance.
- the test subject has a disorder or disease in a specific tissue or organ (excluding the kidney).
- it may be determined whether or not a person has a disorder or a disease based on the result of machine learning from a huge amount of data.
- Test subjects may be, for example, humans, monkeys, mice, and rats, but are preferably humans.
- Tissue or organ, which are assessment targets are not particularly limited as long as they are tissues or organs other than the kidney. Specifically, examples thereof include brain, brown fat cell (brown adipose tissue), heart, pancreas, liver, and muscle.
- the tissue or organ, which are assessment targets may be, for example, at least one selected from the group consisting of brain, brown fat cell (brown adipose tissue), heart, pancreas, and liver.
- a data collection method is a method for collecting data for estimating mitochondrial activity in a tissue or organ other than the kidney in a test subject, at least including: a step of calculating a ratio (BUN/CRE) of blood urea nitrogen (BUN) concentration to blood creatinine (CRE) concentration in the test subject.
- BUN/CRE blood urea nitrogen
- CRE blood creatinine
- the data collection method may further include a step of measuring blood urea nitrogen (BUN) concentration using blood collected from a test subject as a specimen (BUN measurement step); and/or a step of measuring blood creatinine (CRE) concentration using blood collected from the test subject as a specimen (CRE measurement step).
- BUN measurement step a step of measuring blood urea nitrogen (BUN) concentration using blood collected from a test subject as a specimen
- CRE measurement step blood creatinine
- [ 18 F]BCPP-BF can be used to detect mitochondrial complex I (MC-I).
- [ 18 F]BCPP-BF accumulates specifically in MC-I, and the uptake which is proportional to the MC-I activity in the target tissue or organ is obtained, and thus [ 18 F]BCPP-BF uptake can be used as an index to assess MC-I activity in the target tissue or organ.
- D-[ 11 C]MT that recognizes the amino acid transporter (LAT-1) highly expressed in the pancreas of small animals was prepared.
- D-[ 11 C]MT was synthesized by the method described in Example 1 of WO2005/115971 .
- the final product obtained had a radiochemical purity of 100.0% and a specific radioactivity of 56.4 GBq/ ⁇ mol.
- ZDF rat Male Zucker Lepr fa /Lepr fa rats (hereinafter also referred to as "ZDF rat") that develop a pathology similar to adult human type II diabetes were purchased from Charles River Laboratories Japan, Inc., and PET measurement was performed at 5 weeks old, 8 weeks old, 16 weeks old, and 26 weeks old.
- control rats male Zucker Lepr fa /+ rats (hereinafter also referred to as “control rats”) were purchased from Charles River Laboratories Japan, Inc. and used.
- mice with 5/6 of kidney removed (excision treatment at 7 weeks of age, hereinafter also referred to as "5/6Nx rat") were purchased from Japan SLC Inc., and test subjected to PET measurement at 2 weeks and 14 weeks after the excision treatment.
- sham-operated rats without nephrectomy were used.
- GBM rat rats with nephritis administered glomerular basement membrane antibody (anti-GBM antibody) (administration treatment at 7 weeks of age, hereinafter also referred to as "GBM rat") were purchased from Japan SLC Inc., and test subjected to PET measurement at 2 weeks and 6 weeks after the administration treatment. As controls, sham-operated rats without administration of anti-GBM antibody were used.
- anti-GBM antibody glomerular basement membrane antibody
- Rats were anesthetized with isoflurane and fixed in the gantry of an animal PET camera (SHR-38000, manufactured by Hamamatsu Photonics K.K.). After performing a 15-minute transmission measurement for absorption correction, approximately 20 MBq/0.5 mL of D-[ 11 C]MT was administered to the rats via the tail vein, and a 60-minute emission measurement was performed. Subsequently, approximately 20 MBq/0.5 mL of [ 18 F]BCPP-BF was administered through the tail vein of the rat, and emissions were measured for 60 minutes.
- SHR-38000 manufactured by Hamamatsu Photonics K.K.
- a region of interest was set on the pancreas identified from the PET uptake images 40 to 60 minutes after administration of D-[ 11 C]MT, and the [ 18 F]BCPP-BF uptake in the region of interest was calculated. Then, the calculated uptake was normalized by the body weight of each individual and the amount of administered radioactivity, and was defined as the [ 18 F]BCPP-BF uptake in the pancreas (radioactivity uptake (SUV)).
- radioactivity uptake (SUV) radioactivity uptake
- BUN/CRE blood urea nitrogen concentration mg l dL / blood creatinine concentration mg / dL
- CCr urine creatinine concentration mg / dL ⁇ urine volume per hour dL / blood creatinine concentration mg / dL
- ACR urine albumin concentration mg / dL / urine creatinine concentration mg / dL
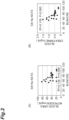
- FIGS. 1(A), 1(B), 1(C), and 1(D) are graphs plotting each biochemical index value ( FIG. 1(A) : blood urea nitrogen concentration, FIG. 1(B) : blood creatinine concentration, FIG. 1(C) : creatinine clearance rate (CCr), and FIG. 1(D) : albumin/creatinine ratio) with respect to a BUN/CRE value. Each plot corresponds to measured and calculated values for ZDF rats and control rats.
- FIGS. 2(A) and 2(B) are graphs plotting each biochemical index value ( FIG. 2(A) : blood urea nitrogen concentration and FIG. 2(B) : blood creatinine concentration) with respect to the BUN/CRE values. Each plot corresponds to measured and calculated values for 5/6Nx rats and control rats.
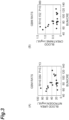
- FIGS. 3(A) and 3(B) are graphs plotting each biochemical index value ( FIG. 3(A) : blood urea nitrogen concentration and FIG. 3(B) : blood creatinine concentration) with respect to the BUN/CRE values. Each plot corresponds to measured and calculated values for GBM rats and control rats.
- FIGS. 4(A), 4(B), and 4(C) are graphs plotting [ 18 F]BCPP-BF uptakes (SUV) in the kidney with respect to the BUN/CRE values.
- Each plot of FIG. 4(A) corresponds to measured and calculated values for ZDF rats and control rats.
- Each plot of FIG. 4(B) corresponds to measured and calculated values for 5/6Nx rats and control rats.
- Each plot of FIG. 4(C) corresponds to measured and calculated values for GBM rats and control rats.
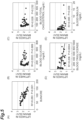
- FIGS. 5(A), 5(B), 5(C), 5(D), and 5(E) are graphs plotting [ 18 F]BCPP-BF uptakes (SUV) in the brain with respect to values ( FIG. 5(A) : BUN/CRE, FIG. 5(B) : blood glucose concentration, FIG. 5(C) : blood total cholesterol concentration, FIG. 5(D) : blood triglyceride concentration, and FIG. 5(E) : blood insulin concentration) of each biochemical index. Each plot corresponds to measured and calculated values for ZDF rats and control rats.
- MC-I activity in the brain of ZDF rats which was assessed by [ 18 F]BCPP-BF uptake (SUV), showed a significant negative correlation only with the BUN/CRE values ( FIG. 5(A) ) and the blood triglyceride concentration values ( FIG. 5(D) ).
- FIGS. 6(A), 6(B), 6(C), 6(D), and 6(E) are graphs plotting [ 18 F]BCPP-BF uptakes (SUV) in the brown fat cells (tissues) with respect to values ( FIG. 6(A) : BUN/CRE, FIG. 6(B) : blood glucose concentration, FIG. 6(C) : blood total cholesterol concentration, FIG. 6(D) : blood triglyceride concentration, and FIG. 6(E) : blood insulin concentration) of each biochemical index. Each plot corresponds to measured and calculated values for ZDF rats and control rats.
- MC-I activity in the brown fat cells (tissues) of ZDF rats which was assessed by [ 18 F]BCPP-BF uptake (SUV), showed a significant negative correlation only with the BUN/CRE values ( FIG. 6(A) ), the blood triglyceride concentration values ( FIG. 6(D) ), and the blood insulin concentration values ( FIG. 6(E) ).
- FIGS. 7(A), 7(B), 7(C), 7(D), and 7(E) are graphs plotting [ 18 F]BCPP-BF uptakes (SUV) in the heart with respect to values ( FIG. 7(A) : BUN/CRE, FIG. 7(B) : blood glucose concentration, FIG. 7(C) : blood total cholesterol concentration, FIG. 7(D) : blood triglyceride concentration, and FIG. 7(E) : blood insulin concentration) of each biochemical index. Each plot corresponds to measured and calculated values for ZDF rats and control rats.
- MC-I activity in the heart of ZDF rats which was assessed by [ 18 F]BCPP-BF uptake (SUV), showed a significant negative correlation only with the BUN/CRE values ( FIG. 7(A) ).
- FIGS. 8(A), 8(B), 8(C), 8(D), and 8(E) are graphs plotting [ 18 F]BCPP-BF uptakes (SUV) in the liver with respect to values ( FIG. 8(A) : BUN/CRE, FIG. 8(B) : blood glucose concentration, FIG. 8(C) : blood total cholesterol concentration, FIG. 8(D) : blood triglyceride concentration, and FIG. 8(E) : blood insulin concentration) of each biochemical index. Each plot corresponds to measured and calculated values for ZDF rats and control rats.
- MC-I activity in the liver of ZDF rats which was assessed by [ 18 F]BCPP-BF uptake (SUV), showed a significant negative correlation only with the BUN/CRE values ( FIG. 8(A) ).
- FIGS. 9(A), 9(B), 9(C), 9(D), and 9(E) are graphs plotting [ 18 F]BCPP-BF uptakes (SUV) in the liver with respect to values ( FIG. 9(A) : BUN/CRE, FIG. 9(B) : blood glucose concentration, FIG. 9(C) : blood total cholesterol concentration, FIG. 9(D) : blood triglyceride concentration, and FIG. 9(E) : blood insulin concentration) of each biochemical index. Each plot corresponds to measured and calculated values for ZDF rats and control rats.
- MC-I activity in the liver of ZDF rats which was assessed by [ 18 F]BCPP-BF uptake (SUV), showed a significant negative correlation only with the BUN/CRE values ( FIG. 9(A) ) and the blood triglyceride concentration values ( FIG. 9(D) ).
- FIGS. 10(A), 10(B), 10(C), 10(D), and 10(E) are graphs plotting [ 18 F]BCPP-BF uptakes (SUV) in the kidney with respect to values ( FIG. 10(A) : BUN/CRE, FIG. 10(B) : blood glucose concentration, FIG. 10(C) : blood total cholesterol concentration, FIG. 10(D) : blood triglyceride concentration, and FIG. 10(E) : blood insulin concentration) of each biochemical index. Each plot corresponds to measured and calculated values for ZDF rats and control rats.
- MC-I activity in the kidney of ZDF rats which was assessed by [ 18 F]BCPP-BF uptake (SUV), showed a significant negative correlation only with the BUN/CRE values ( FIG. 10(A) ).
- FIGS. 11(A), 11(B), and 11(C) are graphs plotting [ 18 F]BCPP-BF uptakes (SUV) in each organ ( FIG. 11(A) : heart, FIG. 11(B) : liver, and FIG. 11(C) : kidney) with respect to BUN/CRE values. Each plot corresponds to measured and calculated values for 5/6Nx rats and control rats.
- the BUN/CRE values showed a significant negative correlation with MC-I activity in the heart and the liver of 5/6Nx rats, which was assessed by [ 18 F]BCPP-BF uptake (SUV) ( FIGS. 11(A) and 11(B) ), and showed no significant correlation with MC-I activity in the kidney ( FIG. 11(C) ).
- FIGS. 12(A), 12(B), and 12(C) are graphs plotting [ 18 F]BCPP-BF uptakes (SUV) in each organ ( FIG. 12(A) : heart, FIG. 12(B) : liver, and FIG. 12(C) : kidney) with respect to BUN/CRE values. Each plot corresponds to measured and calculated values for GBM rats and control rats.
- the BUN/CRE values showed a significant negative correlation with MC-I activity in the heart and the liver of GBM rats, which was assessed by [ 18 F]BCPP-BF uptake (SUV), ( FIGS. 12(A) and 12(B) ), and showed no significant correlation with MC-I activity in the kidney ( FIG. 12(C) ).
- the BUN/CRE value was not universally recognized as an assessment index of kidney function.
- the BUN/CRE value showed a significant negative correlation with MC-I activity in a tissue or organ other than the kidney, which was assessed by [ 18 F]BCPP-BF uptake (SUV), and the BUN/CRE value can be used as an assessment index of mitochondrial function in each organ (tissue or organ other than the kidney).
Landscapes
- Life Sciences & Earth Sciences (AREA)
- Health & Medical Sciences (AREA)
- Engineering & Computer Science (AREA)
- Molecular Biology (AREA)
- Biomedical Technology (AREA)
- Chemical & Material Sciences (AREA)
- Hematology (AREA)
- Immunology (AREA)
- Urology & Nephrology (AREA)
- Cell Biology (AREA)
- Microbiology (AREA)
- Biotechnology (AREA)
- Food Science & Technology (AREA)
- Medicinal Chemistry (AREA)
- Physics & Mathematics (AREA)
- Analytical Chemistry (AREA)
- Biochemistry (AREA)
- General Health & Medical Sciences (AREA)
- General Physics & Mathematics (AREA)
- Pathology (AREA)
- Investigating Or Analysing Biological Materials (AREA)
Abstract
Description
- The present invention relates to a method for assessing mitochondrial function in a tissue or organ other than the kidney in a test subject. The present invention also relates to a data collection method for estimating mitochondrial activity in a tissue or organ other than the kidney in a test subject.
- Mitochondria are present in almost all cells that make up living organisms, and are sometimes called "the power plants of cells." Mitochondria play an important role in producing adenosine triphosphate (ATP), which is an essential energy source for cell activity, from sugars and lipids obtained from digestion of ingested food. For this reason, it is not hard to imagine that the state of health of a living body, which is an aggregate of cells, depends greatly on the active state of mitochondria.
- Positron emission tomography (PET) probes for assessing mitochondrial function are known (for example, Non Patent Literature 1).
-
- [Non Patent Literature 1] J. Nucl. Med., 2020, vol. 61, pp. 96-103
- [Non Patent Literature 2] Life Sciences, 2005, vol. 76, pp. 1825-1834
- [Non Patent Literature 3] Clin. Kidney J., 2012, vol. 5, pp. 187-191
- [Non Patent Literature 4] Intensive Care Med., 2019, vol. 45, pp. 1813-1815
- [Non Patent Literature 5] Nephrology Reviews, 2010, vol. 2, e11
- The PET probe (for example, [18F]BCPP-EF) disclosed in
Non Patent Literature 1 can specifically measure mitochondrial complex I (MC-I). By performing PET measurement using such a PET probe, noninvasive measurement becomes possible, and the burden on the test subject can be reduced. On the other hand, PET measurement requires large-scale facilities and specialists in each field for the production of positron-emitting nuclides by a cyclotron, label synthesis of PET probes, collection of image data, quantitative analysis of images, and the like. For this reason, the method for assessing mitochondrial function by PET measurement is by no means highly versatile, and there is a demand for an assessment method that can be implemented more simply. - Accordingly, an object of the present invention is to provide a method for assessing mitochondrial function more simply.
- The present inventors have found that the ratio (BLTN/CRE) calculated from the blood urea nitrogen (BUN) concentration and blood creatinine (CRE) concentration, which are used as indices for assessing kidney function, surprisingly shows a good correlation with mitochondrial activity in a tissue or organ other than the kidney. The present invention is based on this new finding.
- The present invention relates to a method for assessing the mitochondrial function in a tissue or organ other than the kidney in a test subject, including: a step of calculating a ratio (BUN/CRE) of blood urea nitrogen (BUN) concentration to blood creatinine (CRE) concentration in a test subject; and a step of estimating mitochondrial activity in a tissue or organ other than the kidney in the test subject using the calculated ratio (BUN/CRE).
- It has been proposed that the BUN/CRE value can more accurately assess kidney function than each of the conventionally used values of the blood urea nitrogen (BUN) concentration or blood creatinine (CRE) concentration (for example,
Non Patent Literature 2 to 5). However, as described in the examples below, the BUN/CRE value is not universally recognized as an assessment index of kidney function, while there is a significant negative correlation with the mitochondrial activity in a tissue or organ other than the kidney. Since the method according to the present invention uses the BUN/CRE value as an index, it is possible to assess the mitochondrial function in a tissue or organ other than the kidney. In addition, blood urea nitrogen (BUN) concentration and blood creatinine (CRE) concentration can be measured using blood collected from a test subject as a specimen, for example, using a generally used automated biochemical analyzer, and thus this method can be easily implemented. - The present invention also relates to a data collection method for estimating mitochondrial activity in a tissue or organ other than the kidney in a test subject, including: a step of calculating a ratio (BUN/CRE) of blood urea nitrogen (BUN) concentration to blood creatinine (CRE) concentration in a test subject.
- In the above method, the tissue or organ may be at least one selected from the group consisting of brain, brown adipose tissue, heart, pancreas, and liver.
- According to the present invention, the method for assessing mitochondrial function more simply can be provided.
-
-
FIGS. 1(A), 1(B), 1(C), and 1(D) are graphs plotting each biochemical index value (FIG. 1(A) : blood urea nitrogen concentration,FIG. 1(B) : blood creatinine concentration,FIG. 1(C) : creatinine clearance rate (CCr), andFIG. 1(D) : albumin/creatinine ratio) with respect to a BUN/CRE value. Each plot corresponds to measured and calculated values for ZDF rats and control rats. -
FIGS. 2(A) and 2(B) are graphs plotting each biochemical index value (FIG. 2(A) : blood urea nitrogen concentration andFIG. 2(B) : blood creatinine concentration) with respect to the BUN/CRE values. Each plot corresponds to measured and calculated values for 5/6Nx rats and control rats. -
FIGS. 3(A) and 3(B) are graphs plotting each biochemical index value (FIG. 3(A) : blood urea nitrogen concentration andFIG. 3(B) : blood creatinine concentration) with respect to the BUN/CRE values. Each plot corresponds to measured and calculated values for GBM rats and control rats. -
FIGS. 4(A), 4(B), and 4(C) are graphs plotting [18F]BCPP-BF uptakes (SUV) in the kidney with respect to the BUN/CRE values. Each plot ofFIG. 4(A) corresponds to measured and calculated values for ZDF rats and control rats. Each plot ofFIG. 4(B) corresponds to measured and calculated values for 5/6Nx rats and control rats. Each plot ofFIG. 4(C) corresponds to measured and calculated values for GBM rats and control rats. -
FIGS. 5(A), 5(B), 5(C), 5(D), and 5(E) are graphs plotting [18F]BCPP-BF uptakes (SUV) in the brain with respect to each biochemical index value (FIG. 5(A) : BUN/CRE,FIG. 5(B) : blood glucose concentration,FIG. 5(C) : blood total cholesterol concentration,FIG. 5(D) : blood triglyceride concentration, andFIG. 5(E) : blood insulin concentration). Each plot corresponds to measured and calculated values for ZDF rats and control rats. -
FIGS. 6(A), 6(B), 6(C), 6(D), and 6(E) are graphs plotting [18F]BCPP-BF uptakes (SUV) in the brown fat cells (tissues) with respect to each biochemical index value (FIG. 6(A) : BUN/CRE,FIG. 6(B) : blood glucose concentration,FIG. 6(C) : blood total cholesterol concentration,FIG. 6(D) : blood triglyceride concentration, andFIG. 6(E) : blood insulin concentration). Each plot corresponds to measured and calculated values for ZDF rats and control rats. -
FIGS. 7(A), 7(B), 7(C), 7(D), and 7(E) are graphs plotting [18F]BCPP-BF uptakes (SUV) in the heart with respect to each biochemical index value (FIG. 7(A) : BUN/CRE,FIG. 7(B) : blood glucose concentration,FIG. 7(C) : blood total cholesterol concentration,FIG. 7(D) : blood triglyceride concentration, andFIG. 7(E) : blood insulin concentration). Each plot corresponds to measured and calculated values for ZDF rats and control rats. -
FIGS. 8(A), 8(B), 8(C), 8(D), and 8(E) are graphs plotting [18F]BCPP-BF uptakes (SUV) in the liver with respect to each biochemical index value (FIG. 8(A) : BUN/CRE,FIG. 8(B) : blood glucose concentration,FIG. 8(C) : blood total cholesterol concentration,FIG. 8(D) : blood triglyceride concentration, andFIG. 8(E) : blood insulin concentration). Each plot corresponds to measured and calculated values for ZDF rats and control rats. -
FIGS. 9(A), 9(B), 9(C), 9(D), and 9(E) are graphs plotting [18F]BCPP-BF uptakes (SUV) in the liver with respect to each biochemical index value (FIG. 9(A) : BUN/CRE,FIG. 9(B) : blood glucose concentration,FIG. 9(C) : blood total cholesterol concentration,FIG. 9(D) : blood triglyceride concentration, andFIG. 9(E) : blood insulin concentration). Each plot corresponds to measured and calculated values for ZDF rats and control rats. -
FIGS. 10(A), 10(B), 10(C), 10(D), and 10(E) are graphs plotting [18F]BCPP-BF uptakes (SUV) in the kidney with respect to each biochemical index value (FIG. 10(A) : BUN/CRE,FIG. 10(B) : blood glucose concentration,FIG. 10(C) : blood total cholesterol concentration,FIG. 10(D) : blood triglyceride concentration, andFIG. 10(E) : blood insulin concentration). Each plot corresponds to measured and calculated values for ZDF rats and control rats. -
FIGS. 11(A), 11(B), and 11(C) are graphs plotting [18F]BCPP-BF uptakes (SUV) in each organ (FIG. 11(A) : heart,FIG. 11(B) : liver, andFIG. 11(C) : kidney) with respect to BUN/CRE values. Each plot corresponds to measured and calculated values for 5/6Nx rats and control rats. -
FIGS. 12(A), 12(B), and 12(C) are graphs plotting [18F]BCPP-BF uptakes (SUV) in each organ (FIG. 12(A) : heart,FIG. 12(B) : liver, andFIG. 12(C) : kidney) with respect to BUN/CRE values. Each plot corresponds to measured and calculated values for GBM rats and control rats. - Hereinafter, embodiments for carrying out the present invention will be described in detail. However, the present invention is not limited to the following embodiments.
- A method for assessing mitochondrial function in a tissue or organ other than the kidney in a test subject (hereinafter also simply referred to as "assessment method") according to the present embodiment, includes: a step of calculating a ratio (BUN/CRE) of blood urea nitrogen (BUN) concentration to blood creatinine (CRE) concentration in a test subject (calculation step); and a step of estimating mitochondrial activity in a tissue or organ other than the kidney in the test subject using the calculated ratio (BUN/CRE) (estimation step).
- The assessment method according to the present embodiment may further include a step of measuring blood urea nitrogen (BUN) concentration using blood collected from a test subject as a specimen (BUN measurement step); and/or a step of measuring blood creatinine (CRE) concentration using blood collected from the test subject as a specimen (CRE measurement step).
- Blood urea nitrogen (BUN) concentration can be measured according to a conventional method. Specifically, for example, measurement can be performed by detecting nitrogen contained in urea using blood itself collected from a test subject, or serum or plasma separated from blood. Nitrogen contained in urea can be detected using, for example, a commercially available kit. Further, detection of nitrogen contained in urea may be performed using an automated biochemical analyzer or the like.
- Blood creatinine (CRE) concentration can be measured according to a conventional method. Specifically, for example, measurement can be performed by an enzymatic method (creatinase-sarcosine oxidase-peroxidase method) using blood itself collected from a test subject, or serum or plasma separated from blood. The blood creatinine concentration can be measured using, for example, a commercially available kit. In addition, blood creatinine concentration may be measured using an automated biochemical analyzer or the like.
- In the calculation step, the ratio (BUN/CRE) of blood urea nitrogen (BUN) concentration to blood creatinine (CRE) concentration in the test subject is calculated. Specifically, for example, BUN/CRE can be calculated by dividing the blood urea nitrogen concentration (mg/dL) measured in the BUN measurement step by the blood creatinine concentration (mg/dL) measured in the CRE measurement step.
- In the estimation step, the calculated ratio (BUN/CRE) is used to estimate mitochondrial activity in a tissue or organ other than the kidney in the test subject. Since the BUN/CRE value shows a negative correlation with mitochondrial activity in a tissue or organ other than the kidney, in the estimation step, using this correlation, the mitochondrial activity in each of tissues or organs (excluding the kidney) of the test subject can be estimated from the calculated ratio (BUN/CRE).
- Mitochondrial activity in each of tissues or organs (excluding the kidney) of a test subject can be estimated by, for example, deriving a relationship between BUN/CRE values and the mitochondrial activity value in each of tissues or organs (excluding the kidney) from a plurality of data pairs (BUN/CRE values and mitochondrial activity values in each of tissues or organs (excluding the kidney)) obtained in advance and using the derived relationship and the BUN/CRE values obtained for the test subject. More specifically, mitochondrial activity in each of tissues or organs (excluding the kidney) of the test subject can be estimated, for example, by calculating a correlation formula from a plurality of data pairs obtained in advance and introducing the BUN/CRE value measured in the test subject into the correlation formula. In addition, the correlation may be derived by machine learning using a huge amount of data.
- The estimated value of mitochondrial activity obtained in the estimation step can also be used to determine whether or not the test subject has a disorder or disease in a particular organ or tissue (excluding the kidney). In this case, for example, the relationship between the BUN/CRE value and the mitochondrial activity value in the tissue or organ is derived from one or more data pairs obtained in advance from a healthy test subject and one or more data pairs obtained in advance from a test subject having a disorder or disease in a specific tissue or organ (excluding the kidney), and a threshold value that can distinguish between healthy test subjects and test subjects having disorders or diseases in the relevant tissue or organ is obtained in advance. Then, by comparing the estimated value of mitochondrial activity obtained in the estimation step with the threshold value, it is possible to determine whether or not the test subject has a disorder or disease in a specific tissue or organ (excluding the kidney). In addition, it may be determined whether or not a person has a disorder or a disease based on the result of machine learning from a huge amount of data.
- Test subjects may be, for example, humans, monkeys, mice, and rats, but are preferably humans.
- Tissue or organ, which are assessment targets, are not particularly limited as long as they are tissues or organs other than the kidney. Specifically, examples thereof include brain, brown fat cell (brown adipose tissue), heart, pancreas, liver, and muscle. The tissue or organ, which are assessment targets, may be, for example, at least one selected from the group consisting of brain, brown fat cell (brown adipose tissue), heart, pancreas, and liver.
- A data collection method according to the present embodiment is a method for collecting data for estimating mitochondrial activity in a tissue or organ other than the kidney in a test subject, at least including: a step of calculating a ratio (BUN/CRE) of blood urea nitrogen (BUN) concentration to blood creatinine (CRE) concentration in the test subject. As described above, the BUN/CRE value obtained by the data collection method according to the present embodiment can be used to estimate the mitochondrial activity in a tissue or organ other than the kidney in the test subject.
- The data collection method according to the present embodiment may further include a step of measuring blood urea nitrogen (BUN) concentration using blood collected from a test subject as a specimen (BUN measurement step); and/or a step of measuring blood creatinine (CRE) concentration using blood collected from the test subject as a specimen (CRE measurement step).
- The present invention will be described in more detail below based on examples. However, the present invention is not limited to these.
- [18F]BCPP-BF represented by the following formula was synthesized according to the method described in Non Patent Literature (J. Labeled Comp. Radiopharm., 2013, vol. 56, no. 11, pp. 553-561). The final product obtained had a radiochemical purity of 99.0% and a specific radioactivity of 73.4 GBq/µmol.

- It is known that [18F]BCPP-BF can be used to detect mitochondrial complex I (MC-I). [18F]BCPP-BF accumulates specifically in MC-I, and the uptake which is proportional to the MC-I activity in the target tissue or organ is obtained, and thus [18F]BCPP-BF uptake can be used as an index to assess MC-I activity in the target tissue or organ.
- In order to identify the location of the pancreas, a probe (D-[11C]MT) that recognizes the amino acid transporter (LAT-1) highly expressed in the pancreas of small animals was prepared. D-[11C]MT was synthesized by the method described in Example 1 of
WO2005/115971 . The final product obtained had a radiochemical purity of 100.0% and a specific radioactivity of 56.4 GBq/µmol. - Male Zucker Leprfa/Leprfa rats (hereinafter also referred to as "ZDF rat") that develop a pathology similar to adult human type II diabetes were purchased from Charles River Laboratories Japan, Inc., and PET measurement was performed at 5 weeks old, 8 weeks old, 16 weeks old, and 26 weeks old. As controls, male Zucker Leprfa/+ rats (hereinafter also referred to as "control rats") were purchased from Charles River Laboratories Japan, Inc. and used.
- As a chronic kidney disease model, rats with 5/6 of kidney removed (excision treatment at 7 weeks of age, hereinafter also referred to as "5/6Nx rat") were purchased from Japan SLC Inc., and test subjected to PET measurement at 2 weeks and 14 weeks after the excision treatment. As controls, sham-operated rats without nephrectomy were used.
- As an acute kidney disease model, rats with nephritis administered glomerular basement membrane antibody (anti-GBM antibody) (administration treatment at 7 weeks of age, hereinafter also referred to as "GBM rat") were purchased from Japan SLC Inc., and test subjected to PET measurement at 2 weeks and 6 weeks after the administration treatment. As controls, sham-operated rats without administration of anti-GBM antibody were used.
- Rats were anesthetized with isoflurane and fixed in the gantry of an animal PET camera (SHR-38000, manufactured by Hamamatsu Photonics K.K.). After performing a 15-minute transmission measurement for absorption correction, approximately 20 MBq/0.5 mL of D-[11C]MT was administered to the rats via the tail vein, and a 60-minute emission measurement was performed. Subsequently, approximately 20 MBq/0.5 mL of [18F]BCPP-BF was administered through the tail vein of the rat, and emissions were measured for 60 minutes.
- After the PET measurement was completed, a region of interest was set on the pancreas identified from the
PET uptake images 40 to 60 minutes after administration of D-[11C]MT, and the [18F]BCPP-BF uptake in the region of interest was calculated. Then, the calculated uptake was normalized by the body weight of each individual and the amount of administered radioactivity, and was defined as the [18F]BCPP-BF uptake in the pancreas (radioactivity uptake (SUV)). For tissue or organ other than the pancreas and the brain, a region of interest was set for each of tissues or organs identified in the PET uptake image of [18F]BCPP-BF, and the radioactivity uptake (SUV) was calculated in the same manner as for the pancreas. The radioactivity uptake (SUV) of the brain was calculated by removing the brain from the rat immediately after the PET measurement. - Blood was collected from the rat immediately after the PET measurement, and blood urea nitrogen concentration, blood creatinine concentration, blood glucose concentration, blood total cholesterol concentration, blood triglyceride concentration, and blood insulin concentration were measured using an automated biochemical analyzer (7180 manufactured by Hitachi High-Tech Corporation). Moreover, the BUN/CRE value was calculated by the following formula.

- The rat urine was collected immediately after the PET measurement, and the urine albumin concentration and urine creatinine concentration were measured using an automated biochemical analyzer (7180 manufactured by Hitachi High-Tech Corporation). In addition, the creatinine clearance rate (CCr) and the albumin/creatinine ratio (ACR) were calculated by the following formulas.


- The correlation between the radioactivity uptake (SUV) data obtained in Test Example 1 and the biochemical index data obtained in Test Example 2 was analyzed.
-
FIGS. 1(A), 1(B), 1(C), and 1(D) are graphs plotting each biochemical index value (FIG. 1(A) : blood urea nitrogen concentration,FIG. 1(B) : blood creatinine concentration,FIG. 1(C) : creatinine clearance rate (CCr), andFIG. 1(D) : albumin/creatinine ratio) with respect to a BUN/CRE value. Each plot corresponds to measured and calculated values for ZDF rats and control rats. -
FIGS. 2(A) and 2(B) are graphs plotting each biochemical index value (FIG. 2(A) : blood urea nitrogen concentration andFIG. 2(B) : blood creatinine concentration) with respect to the BUN/CRE values. Each plot corresponds to measured and calculated values for 5/6Nx rats and control rats. -
FIGS. 3(A) and 3(B) are graphs plotting each biochemical index value (FIG. 3(A) : blood urea nitrogen concentration andFIG. 3(B) : blood creatinine concentration) with respect to the BUN/CRE values. Each plot corresponds to measured and calculated values for GBM rats and control rats. - In ZDF rats, the values of blood urea nitrogen concentration and blood creatinine concentration and the BUN/CRE values showed significant positive and negative correlations, respectively (
FIGS. 1(A) and 1(B) ), but showed no correlation with the values of creatinine clearance rate and albumin/creatinine ratio, which directly reflect kidney function (FIGS. 1(C) and 1(D) ). In 5/6Nx rats, the values of blood urea nitrogen concentration and blood creatinine concentration and the BUN/CRE values showed no correlation (FIGS. 2(A) and 2(B) ). Similarly, in GBM rats, the values of blood urea nitrogen concentration and blood creatinine concentration and the BUN/CRE values showed no correlation (FIGS. 3(A) and 3(B) ). These results suggest that the BUN/CRE value is not universally used as an index of kidney function. -
FIGS. 4(A), 4(B), and 4(C) are graphs plotting [18F]BCPP-BF uptakes (SUV) in the kidney with respect to the BUN/CRE values. Each plot ofFIG. 4(A) corresponds to measured and calculated values for ZDF rats and control rats. Each plot ofFIG. 4(B) corresponds to measured and calculated values for 5/6Nx rats and control rats. Each plot ofFIG. 4(C) corresponds to measured and calculated values for GBM rats and control rats. - MC-I activity in the kidney, which was assessed by [18F]BCPP-BF uptake (SUV), showed a significant negative correlation with the BUN/CRE values in ZDF rats (
FIG. 4(A) ), but 5/6Nx and GBM rats showed no correlation (FIGS. 4(B) and 4(C) ). These results also suggest that the BUN/CRE value is not universally used as an index of kidney function. -
FIGS. 5(A), 5(B), 5(C), 5(D), and 5(E) are graphs plotting [18F]BCPP-BF uptakes (SUV) in the brain with respect to values (FIG. 5(A) : BUN/CRE,FIG. 5(B) : blood glucose concentration,FIG. 5(C) : blood total cholesterol concentration,FIG. 5(D) : blood triglyceride concentration, andFIG. 5(E) : blood insulin concentration) of each biochemical index. Each plot corresponds to measured and calculated values for ZDF rats and control rats. - MC-I activity in the brain of ZDF rats, which was assessed by [18F]BCPP-BF uptake (SUV), showed a significant negative correlation only with the BUN/CRE values (
FIG. 5(A) ) and the blood triglyceride concentration values (FIG. 5(D) ). -
FIGS. 6(A), 6(B), 6(C), 6(D), and 6(E) are graphs plotting [18F]BCPP-BF uptakes (SUV) in the brown fat cells (tissues) with respect to values (FIG. 6(A) : BUN/CRE,FIG. 6(B) : blood glucose concentration,FIG. 6(C) : blood total cholesterol concentration,FIG. 6(D) : blood triglyceride concentration, andFIG. 6(E) : blood insulin concentration) of each biochemical index. Each plot corresponds to measured and calculated values for ZDF rats and control rats. - MC-I activity in the brown fat cells (tissues) of ZDF rats, which was assessed by [18F]BCPP-BF uptake (SUV), showed a significant negative correlation only with the BUN/CRE values (
FIG. 6(A) ), the blood triglyceride concentration values (FIG. 6(D) ), and the blood insulin concentration values (FIG. 6(E) ). -
FIGS. 7(A), 7(B), 7(C), 7(D), and 7(E) are graphs plotting [18F]BCPP-BF uptakes (SUV) in the heart with respect to values (FIG. 7(A) : BUN/CRE,FIG. 7(B) : blood glucose concentration,FIG. 7(C) : blood total cholesterol concentration,FIG. 7(D) : blood triglyceride concentration, andFIG. 7(E) : blood insulin concentration) of each biochemical index. Each plot corresponds to measured and calculated values for ZDF rats and control rats. - MC-I activity in the heart of ZDF rats, which was assessed by [18F]BCPP-BF uptake (SUV), showed a significant negative correlation only with the BUN/CRE values (
FIG. 7(A) ). -
FIGS. 8(A), 8(B), 8(C), 8(D), and 8(E) are graphs plotting [18F]BCPP-BF uptakes (SUV) in the liver with respect to values (FIG. 8(A) : BUN/CRE,FIG. 8(B) : blood glucose concentration,FIG. 8(C) : blood total cholesterol concentration,FIG. 8(D) : blood triglyceride concentration, andFIG. 8(E) : blood insulin concentration) of each biochemical index. Each plot corresponds to measured and calculated values for ZDF rats and control rats. - MC-I activity in the liver of ZDF rats, which was assessed by [18F]BCPP-BF uptake (SUV), showed a significant negative correlation only with the BUN/CRE values (
FIG. 8(A) ). -
FIGS. 9(A), 9(B), 9(C), 9(D), and 9(E) are graphs plotting [18F]BCPP-BF uptakes (SUV) in the liver with respect to values (FIG. 9(A) : BUN/CRE,FIG. 9(B) : blood glucose concentration,FIG. 9(C) : blood total cholesterol concentration,FIG. 9(D) : blood triglyceride concentration, andFIG. 9(E) : blood insulin concentration) of each biochemical index. Each plot corresponds to measured and calculated values for ZDF rats and control rats. - MC-I activity in the liver of ZDF rats, which was assessed by [18F]BCPP-BF uptake (SUV), showed a significant negative correlation only with the BUN/CRE values (
FIG. 9(A) ) and the blood triglyceride concentration values (FIG. 9(D) ). -
FIGS. 10(A), 10(B), 10(C), 10(D), and 10(E) are graphs plotting [18F]BCPP-BF uptakes (SUV) in the kidney with respect to values (FIG. 10(A) : BUN/CRE,FIG. 10(B) : blood glucose concentration,FIG. 10(C) : blood total cholesterol concentration,FIG. 10(D) : blood triglyceride concentration, andFIG. 10(E) : blood insulin concentration) of each biochemical index. Each plot corresponds to measured and calculated values for ZDF rats and control rats. - MC-I activity in the kidney of ZDF rats, which was assessed by [18F]BCPP-BF uptake (SUV), showed a significant negative correlation only with the BUN/CRE values (
FIG. 10(A) ). -
FIGS. 11(A), 11(B), and 11(C) are graphs plotting [18F]BCPP-BF uptakes (SUV) in each organ (FIG. 11(A) : heart,FIG. 11(B) : liver, andFIG. 11(C) : kidney) with respect to BUN/CRE values. Each plot corresponds to measured and calculated values for 5/6Nx rats and control rats. - The BUN/CRE values showed a significant negative correlation with MC-I activity in the heart and the liver of 5/6Nx rats, which was assessed by [18F]BCPP-BF uptake (SUV) (
FIGS. 11(A) and 11(B) ), and showed no significant correlation with MC-I activity in the kidney (FIG. 11(C) ). -
FIGS. 12(A), 12(B), and 12(C) are graphs plotting [18F]BCPP-BF uptakes (SUV) in each organ (FIG. 12(A) : heart,FIG. 12(B) : liver, andFIG. 12(C) : kidney) with respect to BUN/CRE values. Each plot corresponds to measured and calculated values for GBM rats and control rats. - The BUN/CRE values showed a significant negative correlation with MC-I activity in the heart and the liver of GBM rats, which was assessed by [18F]BCPP-BF uptake (SUV), (
FIGS. 12(A) and 12(B) ), and showed no significant correlation with MC-I activity in the kidney (FIG. 12(C) ). - As shown in the test examples above, the BUN/CRE value was not universally recognized as an assessment index of kidney function. On the other hand, it was found that the BUN/CRE value showed a significant negative correlation with MC-I activity in a tissue or organ other than the kidney, which was assessed by [18F]BCPP-BF uptake (SUV), and the BUN/CRE value can be used as an assessment index of mitochondrial function in each organ (tissue or organ other than the kidney).
Claims (3)
- A method for assessing mitochondrial function in a tissue or organ other than the kidney in a test subject, comprising:a step of calculating a ratio (BLTN/CRE) of blood urea nitrogen (BUN) concentration to blood creatinine (CRE) concentration in a test subject; anda step of estimating mitochondrial activity in a tissue or organ other than the kidney in the test subject using the calculated ratio (BUN/CRE).
- A data collection method for estimating mitochondrial activity in a tissue or organ other than the kidney in a test subject, comprising:
a step of calculating a ratio (BLTN/CRE) of blood urea nitrogen (BUN) concentration to blood creatinine (CRE) concentration in a test subject. - The method according to claim 1 or 2, wherein the tissue or organ is at least one selected from the group consisting of brain, brown adipose tissue, heart, pancreas, and liver.
Applications Claiming Priority (2)
| Application Number | Priority Date | Filing Date | Title |
|---|---|---|---|
| JP2020219130A JP7601634B2 (en) | 2020-12-28 | 2020-12-28 | Methods for assessing mitochondrial function in non-renal organs and tissues of a subject |
| PCT/JP2021/046814 WO2022145260A1 (en) | 2020-12-28 | 2021-12-17 | Method for assessing mitochondrial function in tissue or organ other than kidney in test subject |
Publications (2)
| Publication Number | Publication Date |
|---|---|
| EP4253954A1 true EP4253954A1 (en) | 2023-10-04 |
| EP4253954A4 EP4253954A4 (en) | 2024-11-20 |
Family
ID=82259335
Family Applications (1)
| Application Number | Title | Priority Date | Filing Date |
|---|---|---|---|
| EP21915120.6A Pending EP4253954A4 (en) | 2020-12-28 | 2021-12-17 | METHOD FOR EVALUATING MITOCHONDRIAL FUNCTION IN A TISSUE OR ORGAN OTHER THAN THE KIDNEY IN A SUBJECT UNDER ANALYSIS |
Country Status (7)
| Country | Link |
|---|---|
| US (1) | US20240060996A1 (en) |
| EP (1) | EP4253954A4 (en) |
| JP (1) | JP7601634B2 (en) |
| KR (1) | KR20230125771A (en) |
| CN (1) | CN116670506A (en) |
| TW (1) | TW202242413A (en) |
| WO (1) | WO2022145260A1 (en) |
Families Citing this family (1)
| Publication number | Priority date | Publication date | Assignee | Title |
|---|---|---|---|---|
| WO2025187382A1 (en) * | 2024-03-06 | 2025-09-12 | 浜松ホトニクス株式会社 | Diagnostic agent for cardiac function |
Family Cites Families (7)
| Publication number | Priority date | Publication date | Assignee | Title |
|---|---|---|---|---|
| EP1749815B1 (en) | 2004-05-28 | 2017-06-21 | Hamamatsu Photonics K.K. | Radioactive tyrosine derivative, method for producing same, labeling agent for positron imaging and medical agent for assessing grade of malignancy of tumor respectively composed of radioactive tyrosine derivative, and method for detecting tumor |
| MX2008014110A (en) | 2006-05-02 | 2008-11-14 | Therakos Inc | Methods and reagents for detecting susceptibility to graft versus host disease or transplant related mortality. |
| WO2014030709A1 (en) | 2012-08-24 | 2014-02-27 | 浜松ホトニクス株式会社 | Compound suitable for detection of mitochondrial complex-1 |
| EP3184106A1 (en) | 2015-12-23 | 2017-06-28 | Sanofi-Aventis Deutschland GmbH | Growth differentiation factor 15 as biomarker for metformin |
| JP7005126B2 (en) | 2016-05-18 | 2022-02-04 | 浜松ホトニクス株式会社 | Diagnostic agent for liver and / or kidney function |
| US20200003762A1 (en) | 2018-06-29 | 2020-01-02 | Bioelectron Technology Corporation | Diagnostics Platform for Mitochondrial Dysfunctions/Diseases |
| CN111481510A (en) | 2020-05-26 | 2020-08-04 | 南开大学 | Nanoparticle for wrapping cell secretory component and preparation method and application thereof |
-
2020
- 2020-12-28 JP JP2020219130A patent/JP7601634B2/en active Active
-
2021
- 2021-12-17 WO PCT/JP2021/046814 patent/WO2022145260A1/en not_active Ceased
- 2021-12-17 EP EP21915120.6A patent/EP4253954A4/en active Pending
- 2021-12-17 US US18/269,641 patent/US20240060996A1/en active Pending
- 2021-12-17 CN CN202180078382.8A patent/CN116670506A/en active Pending
- 2021-12-17 KR KR1020237008887A patent/KR20230125771A/en active Pending
- 2021-12-27 TW TW110148942A patent/TW202242413A/en unknown
Also Published As
| Publication number | Publication date |
|---|---|
| WO2022145260A1 (en) | 2022-07-07 |
| JP2022104118A (en) | 2022-07-08 |
| EP4253954A4 (en) | 2024-11-20 |
| KR20230125771A (en) | 2023-08-29 |
| US20240060996A1 (en) | 2024-02-22 |
| JP7601634B2 (en) | 2024-12-17 |
| TW202242413A (en) | 2022-11-01 |
| CN116670506A (en) | 2023-08-29 |
Similar Documents
| Publication | Publication Date | Title |
|---|---|---|
| Schmidt et al. | Fluorine-18-fluorodeoxyglucose PET to determine regional cerebral glucose utilization: a re-examination | |
| US20220401591A1 (en) | System and method for quantitative mapping of mitochondrial complex 1 | |
| McKenna et al. | A century of exercise physiology: effects of muscle contraction and exercise on skeletal muscle Na+, K+-ATPase, Na+ and K+ ions, and on plasma K+ concentration—historical developments | |
| US20240060996A1 (en) | Method for assessing mitochondrial function in tissue or organ other than kidney in test subject | |
| Schnöckel et al. | Dynamic 18F-fluoride small animal PET to noninvasively assess renal function in rats | |
| US5628328A (en) | Method for measuring muscle mass | |
| Faucon et al. | Estimating extracellular fluid volume in healthy individuals: evaluation of existing formulae and development of a new equation | |
| Katayama et al. | Simplified procedure for the estimation of glomerular filtration rate following intravenous administration of iodixanol in cats | |
| de Jong et al. | Kinetic models for analysing myocardial [11C] palmitate data | |
| US20230256120A1 (en) | Diagnostic agent for pancreatic function | |
| RU2152168C1 (en) | Method for evaluating functional state of the spleen | |
| Calderwood et al. | Rapid method for measuring intracellular pH in vivo | |
| Kero et al. | Evaluation of Gd-DOTA as a marker for myocardial blood flow using 68Ga-DOTA and 15O-water PET | |
| Wang et al. | Visualization of copper metabolism by 64CuCl2-PET | |
| Wang et al. | Evaluation of N-(6-[18F] Fluoropyridin-3-yl) glycine PET renography to detect renal function progression in a rat model of diabetic nephropathy | |
| CN102706788A (en) | System for detecting breast cancer | |
| Traversa et al. | A'virtual'revolution: non‐invasive methods to probe skeletal muscle metabolism in Duchenne muscular dystrophy. | |
| Cihan et al. | Comparison of Glucose Levels in Blood Samples Taken from Coccygeal, Jugular and Mammary Vein of Cows in Lactation | |
| US20230364273A1 (en) | Agent for detecting interaction between tissues and organs | |
| Monoe et al. | Prognostic indicators estimated by 99mTc-GSA in acute liver damage | |
| Chantler et al. | Self-prepared heparinized syringes for measuring ionized magnesium in critical care patients. | |
| Erken et al. | Evaluation of Cardiac Repolarization and Serum Electrolytes in Pre-Dialytic Stages of Chronic Kidney Disease/Kronik Bobrek Hastaliginin Diyaliz Oncesi Evrelerinde Kalp Repolarizasyonu ve Serum Elektrolitlerinin Degerlendirilmesi. | |
| Luo et al. | MRI for assessing abdominal organs iron concentration: A comparative study between the relaxometry methods | |
| JPH08283179A (en) | Calibration curve for assaying clearance and clearance assay | |
| Junghans et al. | Measurement of plasma protein and whole body protein metabolism using [15N] glycine in a young adult man–a pilot study |
Legal Events
| Date | Code | Title | Description |
|---|---|---|---|
| STAA | Information on the status of an ep patent application or granted ep patent |
Free format text: STATUS: THE INTERNATIONAL PUBLICATION HAS BEEN MADE |
|
| PUAI | Public reference made under article 153(3) epc to a published international application that has entered the european phase |
Free format text: ORIGINAL CODE: 0009012 |
|
| STAA | Information on the status of an ep patent application or granted ep patent |
Free format text: STATUS: REQUEST FOR EXAMINATION WAS MADE |
|
| 17P | Request for examination filed |
Effective date: 20230630 |
|
| AK | Designated contracting states |
Kind code of ref document: A1 Designated state(s): AL AT BE BG CH CY CZ DE DK EE ES FI FR GB GR HR HU IE IS IT LI LT LU LV MC MK MT NL NO PL PT RO RS SE SI SK SM TR |
|
| DAV | Request for validation of the european patent (deleted) | ||
| DAX | Request for extension of the european patent (deleted) | ||
| A4 | Supplementary search report drawn up and despatched |
Effective date: 20241022 |
|
| RIC1 | Information provided on ipc code assigned before grant |
Ipc: G01N 33/70 20060101ALI20241016BHEP Ipc: G01N 33/62 20060101ALI20241016BHEP Ipc: G01N 33/50 20060101AFI20241016BHEP |