EP4233705A1 - Medical device and image generation method - Google Patents
Medical device and image generation method Download PDFInfo
- Publication number
- EP4233705A1 EP4233705A1 EP20959693.1A EP20959693A EP4233705A1 EP 4233705 A1 EP4233705 A1 EP 4233705A1 EP 20959693 A EP20959693 A EP 20959693A EP 4233705 A1 EP4233705 A1 EP 4233705A1
- Authority
- EP
- European Patent Office
- Prior art keywords
- image
- organ
- current
- electrocardiographic
- generation portion
- Prior art date
- Legal status (The legal status is an assumption and is not a legal conclusion. Google has not performed a legal analysis and makes no representation as to the accuracy of the status listed.)
- Withdrawn
Links
Images







Classifications
-
- A—HUMAN NECESSITIES
- A61—MEDICAL OR VETERINARY SCIENCE; HYGIENE
- A61B—DIAGNOSIS; SURGERY; IDENTIFICATION
- A61B5/00—Measuring for diagnostic purposes; Identification of persons
- A61B5/0033—Features or image-related aspects of imaging apparatus, e.g. for MRI, optical tomography or impedance tomography apparatus; Arrangements of imaging apparatus in a room
- A61B5/0035—Features or image-related aspects of imaging apparatus, e.g. for MRI, optical tomography or impedance tomography apparatus; Arrangements of imaging apparatus in a room adapted for acquisition of images from more than one imaging mode, e.g. combining MRI and optical tomography
-
- A—HUMAN NECESSITIES
- A61—MEDICAL OR VETERINARY SCIENCE; HYGIENE
- A61B—DIAGNOSIS; SURGERY; IDENTIFICATION
- A61B5/00—Measuring for diagnostic purposes; Identification of persons
- A61B5/0033—Features or image-related aspects of imaging apparatus, e.g. for MRI, optical tomography or impedance tomography apparatus; Arrangements of imaging apparatus in a room
- A61B5/004—Features or image-related aspects of imaging apparatus, e.g. for MRI, optical tomography or impedance tomography apparatus; Arrangements of imaging apparatus in a room adapted for image acquisition of a particular organ or body part
-
- A—HUMAN NECESSITIES
- A61—MEDICAL OR VETERINARY SCIENCE; HYGIENE
- A61B—DIAGNOSIS; SURGERY; IDENTIFICATION
- A61B5/00—Measuring for diagnostic purposes; Identification of persons
- A61B5/0033—Features or image-related aspects of imaging apparatus, e.g. for MRI, optical tomography or impedance tomography apparatus; Arrangements of imaging apparatus in a room
- A61B5/004—Features or image-related aspects of imaging apparatus, e.g. for MRI, optical tomography or impedance tomography apparatus; Arrangements of imaging apparatus in a room adapted for image acquisition of a particular organ or body part
- A61B5/0044—Features or image-related aspects of imaging apparatus, e.g. for MRI, optical tomography or impedance tomography apparatus; Arrangements of imaging apparatus in a room adapted for image acquisition of a particular organ or body part for the heart
-
- A—HUMAN NECESSITIES
- A61—MEDICAL OR VETERINARY SCIENCE; HYGIENE
- A61B—DIAGNOSIS; SURGERY; IDENTIFICATION
- A61B5/00—Measuring for diagnostic purposes; Identification of persons
- A61B5/05—Detecting, measuring or recording for diagnosis by means of electric currents or magnetic fields; Measuring using microwaves or radio waves
- A61B5/053—Measuring electrical impedance or conductance of a portion of the body
- A61B5/0536—Impedance imaging, e.g. by tomography
-
- A—HUMAN NECESSITIES
- A61—MEDICAL OR VETERINARY SCIENCE; HYGIENE
- A61B—DIAGNOSIS; SURGERY; IDENTIFICATION
- A61B5/00—Measuring for diagnostic purposes; Identification of persons
- A61B5/05—Detecting, measuring or recording for diagnosis by means of electric currents or magnetic fields; Measuring using microwaves or radio waves
- A61B5/055—Detecting, measuring or recording for diagnosis by means of electric currents or magnetic fields; Measuring using microwaves or radio waves involving electronic [EMR] or nuclear [NMR] magnetic resonance, e.g. magnetic resonance imaging
-
- A—HUMAN NECESSITIES
- A61—MEDICAL OR VETERINARY SCIENCE; HYGIENE
- A61B—DIAGNOSIS; SURGERY; IDENTIFICATION
- A61B5/00—Measuring for diagnostic purposes; Identification of persons
- A61B5/24—Detecting, measuring or recording bioelectric or biomagnetic signals of the body or parts thereof
- A61B5/242—Detecting biomagnetic fields, e.g. magnetic fields produced by bioelectric currents
-
- A—HUMAN NECESSITIES
- A61—MEDICAL OR VETERINARY SCIENCE; HYGIENE
- A61B—DIAGNOSIS; SURGERY; IDENTIFICATION
- A61B5/00—Measuring for diagnostic purposes; Identification of persons
- A61B5/24—Detecting, measuring or recording bioelectric or biomagnetic signals of the body or parts thereof
- A61B5/316—Modalities, i.e. specific diagnostic methods
- A61B5/318—Heart-related electrical modalities, e.g. electrocardiography [ECG]
- A61B5/367—Electrophysiological study [EPS], e.g. electrical activation mapping or electro-anatomical mapping
-
- A—HUMAN NECESSITIES
- A61—MEDICAL OR VETERINARY SCIENCE; HYGIENE
- A61B—DIAGNOSIS; SURGERY; IDENTIFICATION
- A61B5/00—Measuring for diagnostic purposes; Identification of persons
- A61B5/74—Details of notification to user or communication with user or patient; User input means
- A61B5/742—Details of notification to user or communication with user or patient; User input means using visual displays
- A61B5/7425—Displaying combinations of multiple images regardless of image source, e.g. displaying a reference anatomical image with a live image
-
- A—HUMAN NECESSITIES
- A61—MEDICAL OR VETERINARY SCIENCE; HYGIENE
- A61B—DIAGNOSIS; SURGERY; IDENTIFICATION
- A61B2562/00—Details of sensors; Constructional details of sensor housings or probes; Accessories for sensors
- A61B2562/02—Details of sensors specially adapted for in-vivo measurements
- A61B2562/0223—Magnetic field sensors
-
- A—HUMAN NECESSITIES
- A61—MEDICAL OR VETERINARY SCIENCE; HYGIENE
- A61B—DIAGNOSIS; SURGERY; IDENTIFICATION
- A61B2562/00—Details of sensors; Constructional details of sensor housings or probes; Accessories for sensors
- A61B2562/04—Arrangements of multiple sensors of the same type
- A61B2562/046—Arrangements of multiple sensors of the same type in a matrix array
-
- A—HUMAN NECESSITIES
- A61—MEDICAL OR VETERINARY SCIENCE; HYGIENE
- A61B—DIAGNOSIS; SURGERY; IDENTIFICATION
- A61B5/00—Measuring for diagnostic purposes; Identification of persons
- A61B5/74—Details of notification to user or communication with user or patient; User input means
- A61B5/742—Details of notification to user or communication with user or patient; User input means using visual displays
- A61B5/743—Displaying an image simultaneously with additional graphical information, e.g. symbols, charts, function plots
Definitions
- the disclosed embodiments relate to a medical apparatus, and an image generation method.
- Patent Literatures 1 and 2 disclose a technique in which a current vector flowing through a heart is estimated from results of heart measurements, and, in a heart model, the current vector is indicated by arrows and colors (color mapping display).
- the disclosed embodiments have been made to solve the above-described problems, and an object of the disclosed embodiments is to improve the technique of displaying a condition of an organ including a lesion.
- the medical apparatus generates a composite image in which the organ model image of the organ two-dimensionally or three-dimensionally expressed, and the electrocardiographic current image presenting the over-time change in the current flowing through each position of the organ are superposed.
- the surgeon can intuitively recognize the change in the current flowing through each position of the organ using the composite image.
- the electrocardiographic current image in the composite image the over-time change in the current flowing through each position of the organ is expressed by the change in the color attribute.
- the medical apparatus according to the disclosed embodiments has no concern that arrows indicating current vectors obstruct a surgeon's view and hinder the surgeon from checking a condition of an organ.
- a time required for detecting a lesion e.g. arrhythmia site
- efficiency and safety of a procedure can be improved.
- the medical apparatus may be configured such that the electrocardiographic current image generation portion expresses the change in the color attribute by changing any of hue, chroma, brightness, and a combination thereof.
- the electrocardiographic current image generation portion generates an electrocardiographic current image in which the change in the color attribute is expressed by changing any of hue, chroma, brightness, and a combination thereof.
- the medical apparatus may be configured such that the electrocardiographic current image generation portion generates the electrocardiographic current image in which at least one of hue, chroma, and brightness on a part corresponding to a part through which a relatively high current flows among the positions of the organ at a predetermined time is made higher than those of the other parts at the same time.
- the electrocardiographic current image generation portion generates an electrocardiographic current image in which at least one of hue, chroma, and brightness on a part corresponding to the part through which a relatively high current flows is made higher than the other parts.
- the medical apparatus may be configured such that, at a certain position of the organ, when a current value rises over time, the electrocardiographic current image generation portion generates the electrocardiographic current image with the color attribute changed in a first pattern, and when the current value drops over time, the electrocardiographic current image generation portion generates the electrocardiographic current image with the color attribute changed in a second pattern different from the first pattern.
- the electrocardiographic current image generation portion generates an electrocardiographic current image in which, when the current value rises over time at a certain position of the organ, the color attribute is changed in a first pattern, and when the current value drops over time, the color attribute is changed in a second pattern.
- the pattern of change in the color attribute allows the surgeon to intuitively recognize whether a current value at a certain position of the organ is rising or dropping.
- the medical apparatus may be configured such that the biomagnetic field information include information on a magnetic field intensity distribution of the biomagnetic field generated by the organ, the medical apparatus further includes a magnetic field intensity distribution image generation portion that generates, from the biomagnetic field information, a magnetic field intensity distribution image presenting an intensity of the biomagnetic field at each position of the organ, and the composite image generation portion generates a composite image in which the magnetic field intensity distribution image is further superposed on the organ model image and the electrocardiographic current image.
- the biomagnetic field information include information on a magnetic field intensity distribution of the biomagnetic field generated by the organ
- the medical apparatus further includes a magnetic field intensity distribution image generation portion that generates, from the biomagnetic field information, a magnetic field intensity distribution image presenting an intensity of the biomagnetic field at each position of the organ, and the composite image generation portion generates a composite image in which the magnetic field intensity distribution image is further superposed on the organ model image and the electrocardiographic current image.
- the composite image generation portion generates a composite image in which the magnetic field intensity distribution image is further superposed on the organ model image and the electrocardiographic current image.
- an image generation method includes: a step of acquiring image information including an MRI image or a CT image of an organ in a living body; a step of acquiring biomagnetic field information from a biomagnetic field generated by the organ; a step of generating, from the image information, an organ model image of the organ two-dimensionally or three-dimensionally expressed; a step of generating an electrocardiographic current image in which an over-time change in a current flowing through each position of the organ, acquired from the biomagnetic field information, is expressed by a change in a color attribute; and a step of generating a composite image in which the organ model image and the electrocardiographic current image are superposed.
- the disclosed embodiments can be achieved in various modes, and can be achieved in modes such as medical apparatuses (image generation apparatus) that generate images for display, image generation methods, medical systems including medical apparatuses, production methods of these apparatuses and systems, and computer programs that achieve functions of these apparatuses and systems.
- medical apparatuses image generation apparatus
- medical systems including medical apparatuses, production methods of these apparatuses and systems
- computer programs that achieve functions of these apparatuses and systems.
- Fig. 1 is an explanatory diagram illustrating a configuration of a medical apparatus 1.
- the medical apparatus 1 is used for treatment or diagnosis of a living body (herein, a human body) 90, and can generate and display an electrocardiographic current image in which an over-time change in a current flowing through each position of an organ of the human body 90 is expressed by a change in a color attribute.
- the medical apparatus 1 includes a magnetic sensor array 10, a CT device 40, a computer 50, a monitor 60, and an operating portion 70.
- the medical apparatus 1 used for treating arrhythmia will be explained in the following examples.
- the magnetic sensor array 10 is a device for detecting information on a biomagnetic field generated by the human body 90 to be treated or diagnosed (hereinafter also referred to as "biomagnetic field information").
- the biomagnetic field information include a biomagnetic field intensity and a biomagnetic field direction.
- a plurality of magnetic sensors 11 are arranged on the magnetic sensor array 10. The plurality of magnetic sensors 11 are longitudinally and laterally arranged side-by-side in a matrix.
- the magnetic sensors 11 are a device that detects biomagnetic field information, and examples thereof may include a GHz-Spin-Rotation Sensor (GSR) sensor, a magnetoresistive effect device (MR), a magnetic impedance device (MI), and a superconducting quantum interference device (SUQUID).
- GSR GHz-Spin-Rotation Sensor
- MR magnetoresistive effect device
- MI magnetic impedance device
- SQUID superconducting quantum interference device
- the magnetic sensor array 10 is located around a center of a bed 95 on which the human body 90 lies.
- the magnetic sensor array 10 may be configured to be attached to the human body 90 during treatment or diagnosis.
- the magnetic sensor array 10 may be configured to be attached to the human body 90 during treatment.
- the magnetic sensor array 10 may be configured to have a band shape to be wrapped around the human body 90 or may be configured to have a garment or cap shape.
- the magnetic sensors 11 may be arranged along the shape of the human body 90.
- the magnetic sensor array 10 may be composed of two or more plates which are three-dimensionally arranged on one or both of the front and back of the human body, and one or both of the sides of the human body.
- the CT device 40 includes, inside a gantry (mount), a tube bulb that emits X-rays and an arc-shaped detector that detects X-rays to generate a CT image presenting a shape of the heart 91 when the tube bulb rotates by 360° around the human body 90 lying on the bed 95, and output image information including the CT image to the computer 50.
- the medical apparatus 1 may include an MRI device instead of the CT device, as an apparatus that generates images presenting the shape of the organ inside the human body 90. That is, the medical apparatus 1 may acquire the image information including an MRI image instead of the image information including the CT image.
- the computer 50 controls the overall medical apparatus 1 and is electrically connected to each of the magnetic sensor array 10, the CT device 40, the monitor 60, and the operating portion 70.
- the computer 50 includes a central processing unit (CPU), a read-only memory (ROM), and a random access memory (RAM) not illustrated, where a computer program stored in the ROM is developed to the RAM, the computer program is executed by the CPU to execute functions of a main control portion 51 and a composite image generation portion 52.
- CPU central processing unit
- ROM read-only memory
- RAM random access memory
- the main control portion 51 transmits and receives information to/from the magnetic sensor array 10, the CT device 40, the monitor 60, and the operating portion 70 to control the entire medical apparatus 1.
- the main control portion 51 includes an image information acquisition portion 511 and a biomagnetic field information acquisition portion 512.
- the image information acquisition portion 511 acquires the information (hereinafter also referred to as "image information") including the CT image of the human body 90 through control of the CT device 40.
- the biomagnetic field information acquisition portion 512 acquires information on the biomagnetic field generated by the human body 90 (biomagnetic field information) through control of the magnetic sensor array 10. That is, the main control portion 51 functionally serves as a so-called console for the CT device 40 and the magnetic sensor array 10.
- the image information acquisition portion 511 and the biomagnetic field information acquisition portion 512 will be described below in detail.
- the composite image generation portion 52 generates an organ model image, an electrocardiographic current image, and a composite image with the combined these images, and displays the generated composite image on the monitor 60.
- the composite image generation portion 52 includes a model image generation portion 521, a magnetic field intensity distribution image generation portion 522, and an electrocardiographic current image generation portion 523. Each of these functional portions will be described below in detail.
- the monitor 60 is a display portion including a display screen 61 and is composed of a liquid crystal display and the like.
- the medical apparatus 1 may include a display portion other than the monitor 60.
- the medical apparatus 1 may include smart glasses including a display screen, or a projector that projects images.
- the operating portion 70 is composed of any means such as a keyboard, operation buttons, a touch panel, a foot switch, and a voice recognition device. The operating portion 70 is operated by the surgeon to switch contents displayed on the display screen 61.
- Fig. 2 is a functional block diagram illustrating the main control portion 51 and the composite image generation portion 52.
- Figs. 3A and 3B are explanatory diagrams illustrating a three-dimensional organ model OM and an organ model image SI.
- Fig. 3A illustrates an example of a three-dimensional organ model OM
- Fig. 3B illustrates an example of an organ model image SI.
- the image information acquisition portion 511 of the main control portion 51 the image information including the CT image is acquired from the CT device 40 through control of the CT device 40, and the image information are stored in a storage portion of the computer 50.
- the image information acquisition portion 511 cross-sections of the entire heart 91 are photographed at a time interval to acquire image information including cross-sections of the entire heart 91 at the time interval. Furthermore, in the image information acquisition portion 511, the image information may be directly acquired through control of the CT device 40, or otherwise the image information may be acquired from a storage medium storing the previously acquired image information.
- the model image generation portion 521 of the main control portion 51 generates the three-dimensional organ model OM illustrated in Fig. 3A from the image information acquired by the image information acquisition portion 511.
- Various existing techniques are applicable as the specific technique of generating the three-dimensional organ model OM from the image information including the CT image by the biomagnetic field information acquisition portion 512.
- the three-dimensional organ model OM is composed of stereoscopic image data presenting external and internal shapes of the heart 91.
- cross-sectional images (a plurality of successive CT images) of the entire heart 91 acquired by the image information acquisition portion 511 at a certain time are integrated to generate the three-dimensional organ model OM of the heart 91 at this time.
- the model image generation portion 521 the three-dimensional organ models OM of the heart 91 at different times are integrated to generate the dynamic three-dimensional organ model OM that changes over time.
- this dynamic three-dimensional organ model OM is captured on a virtual plane VP set at any position to generate an organ model image SI in which the heart 91 is three-dimensionally expressed.
- the position and direction of the virtual plane VP is set to any position and direction desired by the surgeon by operating the operating portion 70.
- an organ model image SI presenting the cross-section of the three-dimensional organ model OM is generated as illustrated in Fig. 3B .
- an organ model image SI presenting an appearance (outer surface) of the three-dimensional organ model OM viewed from the virtual plane VP is generated.
- the model image generation portion 521 may generate an organ model image SI in which the heart 91 is two-dimensionally expressed.
- the two-dimensional organ model image SI presents only a surface of a part intersecting with the virtual plane VP in the three-dimensional organ model OM.
- the three-dimensional organ model image SI presents not only the part intersecting with the virtual plane VP but also a part of the three-dimensional organ model OM in a depth direction viewed from the virtual plane VP.
- the dimension (2D/3D/both) of the image generated by the model image generation portion 521 can be arbitrarily set by the surgeon by operating the operating portion 70.
- the three-dimensional organ model OM includes information on a coordinate position of a part corresponding to a specific site of the heart 91.
- the "information on a coordinate position of a specific site of the heart 91" refer to e.g. information on a position of sinus node, a position of atrioventricular node, a direction of His bundle, a position of Purkinje's fiber, and the like.
- the information on the coordinate position of the specific site of the heart 91 can be acquired e.g. by fitting between a contour image displaying a general positional relationship of these specific sites (sinus node, atrioventricular node, His bundle, Purkinje's fiber, etc.) and the three-dimensional organ model OM generated by the model image generation portion 521.
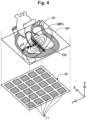
- Fig. 4 is a schematic diagram illustrating a method for acquiring biomagnetic field information using the magnetic sensor array 10.
- the biomagnetic field information acquisition portion 512 of the main control portion 51 Fig. 2
- the biomagnetic field information are acquired through control of the magnetic sensor array 10, and the biomagnetic field information are stored in the storage portion of the computer 50.
- the biomagnetic field information include an intensity and a direction of a biomagnetic field MFh generated by an organ inside the human body 90.
- electric signals CD are generated from a sinus node to contract atria and ventricles.
- the magnetic sensor array 10 detects an intensity and a direction of the biomagnetic field MFh, generated by the electric signals CD, and the biomagnetic field information acquisition portion 512 acquires the intensity and direction of the biomagnetic field MFh as biomagnetic field information.
- the intensity and direction of the biomagnetic field MFh in the biomagnetic field information are affected by the lesion.
- the intensity and direction of the biomagnetic field MFh of the organ with the lesion are different from those of a healthy organ without a lesion.
- the biomagnetic field information acquired by the biomagnetic field information acquisition portion 512 includes information on the lesion of the organ.
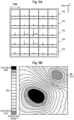
- Figs. 5A and 5B are schematic diagrams illustrating a method for generating a magnetic field intensity distribution image MI.
- Fig. 5A is a diagram illustrating an example of intensities (detection values Vd) of the biomagnetic field MFh, detected by the respective magnetic sensors 11 of the magnetic sensor array 10.
- Fig. 5B is a diagram illustrating an example of the magnetic field intensity distribution image MI.
- the magnetic sensors 11 are arranged in a matrix on a two-dimensional plane (XY plane). Thereby, the magnetic sensor array 10 can detect an intensity (detection value Vd) of the biomagnetic field MFh at each position on the two-dimensional plane as illustrated in Fig. 5A.
- each of the magnetic sensors 11 includes a plurality of (e.g.
- the magnetic sensor array 10 outputs, to the biomagnetic field information acquisition portion 512, these biomagnetic field information including these intensities of the biomagnetic field MFh, detected by the respective magnetic sensors 11.
- Fig. 6 is an explanatory diagram illustrating magnetic field intensity distribution images MI1 to MI3 on different virtual planes VP1 to VP3 of the heart 91.
- the magnetic field intensity distribution image generation portion 522 of the composite image generation portion 52 generates the magnetic field intensity distribution image MI illustrated in Fig. 5B from the biomagnetic field information acquired by the biomagnetic field information acquisition portion 512.
- Fig. 5B illustrates a magnetic field intensity distribution image MI in which the intensity of the biomagnetic field MFh at each position in the two-dimensional plane (XY plane) is expressed in a form of contour lines, as an example of the magnetic field intensity distribution image MI.
- the intensity of the biomagnetic field MFh may be expressed in a manner other than contours, such as color gradation.
- the magnetic field intensity distribution image generation portion 522 can generate the magnetic field intensity distribution image MI on the arbitrary virtual plane VP intersecting with the heart 91.
- Fig. 6 illustrates, as an example, magnetic field intensity distribution images MI1, MI2, and MI3 corresponding to three virtual planes VP1, VP2, and VP3 respectively at the time t1.
- Figs. 7A to 7C are schematic diagrams illustrating a method for generating a three-dimensional magnetic field intensity distribution model DM.
- Fig. 7A is a diagram illustrating an example of magnetic field intensity distribution images MI1 to MI5 acquired from five different virtual planes.
- Fig. 7B is a diagram illustrating an example of a three-dimensional magnetic field intensity distribution model DM acquired from the magnetic field intensity distribution images MI1 to MI5.
- Fig. 7C is a diagram illustrating an example of a dynamic three-dimensional magnetic field intensity distribution model DM that changes over time.
- the magnetic field intensity distribution images MI1 to MI5 generated as described above are integrated as illustrated in Fig. 7A to generate the three-dimensional magnetic field intensity distribution model DM at the time t1 as illustrated in Fig. 7B .
- the three-dimensional magnetic field intensity distribution models DM of the heart 91 at each of different times t1 to tn are integrated to generate a dynamic three-dimensional magnetic field intensity distribution model DM that changes over time, as illustrated in Fig. 7C .
- the magnetic field intensity distribution image generation portion 522 may generate a two-dimensional magnetic field intensity distribution image MI.
- the two-dimensional magnetic field intensity distribution image MI presents only the magnetic field intensity distribution of the part intersecting with the virtual plane VP in the three-dimensional magnetic field intensity distribution model DM.
- the three-dimensional magnetic field intensity distribution image MI presents a magnetic field intensity distribution of the entire three-dimensional magnetic field intensity distribution model DM viewed from the virtual plane VP or a part included in any spatial region in the three-dimensional magnetic field intensity distribution model DM. Therefore, the three-dimensional magnetic field intensity distribution image MI also presents a depth direction of the magnetic field intensity distribution.
- the dimension (2D/3D/both) of the image generated by the magnetic field intensity distribution image generation portion 522 can be arbitrarily set by the surgeon through the operation of the operating portion 70.
- the three-dimensional magnetic field intensity distribution model DM includes not only information on the direction and intensity of the biomagnetic field MFh but also information on a coordinate position of a portion corresponding to a specific site of the heart 91.
- the "information on a coordinate position of a specific site of the heart 91 " can be information on a position of sinus node, a position of atrioventricular node, a direction of His bundle, a position of Purkinje's fiber, and the like, similarly to the three-dimensional organ model OM.
- Information on a coordinate position of a specific site of the heart 91 can be specified e.g. from a change in the magnetic field generated by the electric signals CD.
- the sinus node is a part serving as an origin of the electric signals CD and the atrioventricular node is a part serving as a relay point of the electric signals CD, and therefore they can be identified from the generation position of the electric signals CD, the flow direction of the electric signals, and the like.
- Figs. 8A to 8C are schematic diagrams illustrating a method for acquiring an over-time change in a current EV flowing through the heart 91.
- Fig. 8A illustrates an example of electric signals CD that flow through the heart 91 at certain times t1 to t10 and a current EV (t1 to t10) at that time.
- Fig. 8B illustrates an example of electric signals CD that flow through the heart 91 at subsequent times t11 to t20 and a current EV (t11 to t20) at that time.
- Fig. 8C illustrates an example of electric signals CD that flow through heart 91 at further subsequent times t21 to t30 and a current EV (t21 to t30) at that time.
- the electrocardiographic current image generation portion 523 of the composite image generation portion 52 acquires, from the magnetic field intensity distribution image generation portion 522, a three-dimensional magnetic field intensity distribution model DM generated by the method illustrated in Figs. 7A to 7C (dynamic three-dimensional magnetic field intensity distribution model DM that changes over time).
- a local current is generated (electric signals CD are generated) from the sinus node SN to an atrioventricular node AN in association with an over-time motion (heartbeat) of the heart 91 as illustrated in the left diagram of Fig. 8A
- the current is transmitted (electric signals CD are generated) from the atrioventricular node AN to a His bundle HB as illustrated in the left diagram of Fig.
- the current is transmitted (electric signals CD are generated) to a Purkinje's fiber PF as illustrated in the left diagram of Fig. 8C .
- the three-dimensional magnetic field intensity distribution model DM is generated from information on the intensity and direction of the biomagnetic field MFh generated by the electric signals CD (biomagnetic field information).
- an over-time change EX(t1-t30) in the current EV flowing through each position of the heart 91 can be determined in accordance with a well-known physical law such as Maxwell's equation using the three-dimensional magnetic field intensity distribution model DM (dynamic three-dimensional magnetic field intensity distribution model DM that changes over time) (in the right diagrams of Figs. 8A to 8C ).
- a well-known physical law such as Maxwell's equation using the three-dimensional magnetic field intensity distribution model DM (dynamic three-dimensional magnetic field intensity distribution model DM that changes over time) (in the right diagrams of Figs. 8A to 8C ).
- the figures were explained at times t1 to t30 for convenience, but, hereinafter, will be explained at times t1 to tn (n is a natural number).
- the electrocardiographic current image generation portion 523 can acquire the over-time change EV(t1-tn) in the current EV flowing through each position of the heart 91 from the biomagnetic field information (indirectly via the three-dimensional magnetic field intensity distribution model DM).
- the electrocardiographic current image generation portion 523 may acquire the over-time change EV(t1-tn) in the current EV flowing through each position of the heart 91 by another method.
- the electrocardiographic current image generation portion 523 may acquire the over-time change EV(t1-tn) in the current EV flowing through each position of the heart 91 directly from a detected value of the magnetic sensor array 10.
- Fig. 9 is a schematic diagram illustrating a method for generating the electrocardiographic current image VI (t1 to tn).
- the electrocardiographic current image generation portion 523 generates an electrocardiographic current image VI (t1 to tn) in which the over-time change EV(t1-tn) in the current EV flowing through each position of the heart 91 is expressed by change in the color attribute.
- the electrocardiographic current image generation portion 523 acquires, from the model image generation portion 521, the three-dimensional organ model OM (stereoscopic image data presenting external and internal shapes of the heart 91) generated by the method in Figs. 3A and 3B .
- the three-dimensional organ model OM acquired by the electrocardiographic current image generation portion 523 means a dynamic three-dimensional organ model OM that changes over time, and is hereinafter also referred to as "three-dimensional organ model OM (t1 to tn)" for convenience.
- the three-dimensional organ model OM (t1 to tn) is divided into boxels BO representing predetermined unit volume elements. Then, in the electrocardiographic current image generation portion 523, the three-dimensional organ model OM (t1 to tn) is aligned with the over-time change EV(t1-tn) in the current EV flowing through each position of the heart 91, as determined by the method in Figs. 8A to 8C .
- the alignment can be achieved e.g. by matching the current EV (t21 to t30) flowing to the Purkinje's fiber PF illustrated in the left diagram of Fig.
- the electrocardiographic current image generation portion 523 generates an electrocardiographic current image VI (t1 to tn), in which, each boxel BO is configured such that the hue and chroma are set to arbitrary values, and the brightness is set to a value according to the over-time change EV(t1-tn) in the current EV flowing through the corresponding boxel BO.
- the electrocardiographic current image generation portion 523 generates an electrocardiographic current image VI (t1 to tn) in which a brightness of a boxel BO is increased in proportion to a value of a current EV flowing through the boxel BO.
- the electrocardiographic current image generation portion 523 can generate an electrocardiographic current image VI (t1 to tn) in which boxels BO with a relatively high brightness (i.e. parts with a relatively high brightness) seem to move over time accompanying the over-time change EV(t1-tn) in the current EV.
- the electrocardiographic current image generation portion 523 according to the first embodiment generates an electrocardiographic current image VI (t1 to tn) in which a brightness of a boxel BO corresponding to a part through which a relatively high current EV flows among the respective positions of the heart 91 at a predetermined time (e.g. time t10) is made higher than those of the other parts at the same time (e.g. time t10).
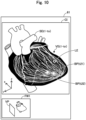
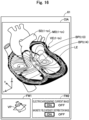
- Fig. 10 is a diagram illustrating an example of a composite image CI.
- the composite image generation portion 52 generates the composite image CI in which, on an organ model image SI (t1 to tn) generated by capturing a three-dimensional organ model OM (t1 to tn) on the virtual plane VP, an electrocardiographic current image VI (t1 to tn) on the same virtual plane VP is superposed.
- the generated composite image CI and a first window FW1 are displayed on a display screen 61 of the monitor 60.
- the first window FW1 displays an image presenting the heart 91 and an image presenting a positional relationship between the heart 91 and the virtual plane VP.
- the surgeon can change the position of the virtual plane VP in the composite image CI by operating the virtual plane VP displayed on the first window FW1 to change a positional relationship between the virtual plane VP and the image presenting the heart 91.
- the virtual plane VP does not intersect with the image presenting the heart 91 in the first window FW1.
- the organ model image SI (t1 to tn) presenting the appearance (outer surface) of the heart 91
- the electrocardiographic current image VI presenting the over-time change EV(t1-tn) in the current EV flowing through the same outer surface of the heart 91 are superposed.
- the electrocardiographic current image VI (t1 to tn) in the composite images CI is illustrated in white.
- a relatively bright part BP transitions over time according to the over-time change EV(t1-tn) in the current EV flowing through each position of the heart 91.
- a relatively bright part BP (t21) at a certain time t21 and a relatively bright part BP (t22) at the next time t22 are at different position.
- the brightness changes in a manner different from those of other normal sites (in the example illustrated in the figure, the brightness changes in a spiral shape).
- the surgeon can also intuitively recognize the location of the lesion LE with abnormal change in the current EV.
- the two-dimensional organ model OM can be processed in the same manner as explained in Figs. 8 to 10 after dividing the model OM into pixels presenting predetermined unit area elements, also in the two-dimensional processing using the two-dimensional organ model OM and the two-dimensional magnetic field intensity distribution model DM.
- Fig. 11 is a diagram illustrating another example of the composite image CI.
- the virtual plane VP intersects with the image presenting the heart 91 in the first window FW1.
- the organ model image SI (t1 to tn) presenting the cross-section of the heart 91 on the virtual plane VP
- the electrocardiographic current image VI (t1 to tn) presenting the over-time change EV(t1-tn) in the current EV flowing through the same cross-section of the heart 91 are superposed.
- the composite image CI of Fig. 11 similarly to Fig.
- a relatively bright part BP transitions over time according to the over-time change EV(t1-tn) in the current EV flowing through each position of the heart 91.
- a relatively bright part BP (t13) at a certain time t13 and a relatively bright part BP (t14) at the next time t14 are at different position.
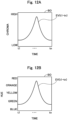
- Figs. 12A and 12B are diagrams illustrating another example of a change in a color attribute.
- Fig. 12A illustrates an example of changing a chroma
- Fig. 12B illustrates an example of changing a hue.
- each boxel BO may be configured such that the hue and brightness are set to arbitrary values, and the chroma is set to a value according to the over-time change EV(t1-tn) in the current EV flowing through the corresponding boxel BO. Also in such a way, the same effect as in the examples illustrated in Figs.
- each boxel BO may be configured such that the brightness and chroma are set to arbitrary values, and the hue is set to a red-green-blue (RGB) color value according to the over-time change EV(t1-tn) in the current EV flowing through the corresponding boxel BO. Also in such a way, the same effect as in the examples illustrated in Figs. 9 to 11 with the changed brightness can be obtained.
- RGB red-green-blue
- Fig. 9 illustrates an example of changing the brightness
- Fig. 12A illustrates an example of changing the chroma
- Fig. 12B illustrates an example of changing the hue.
- the electrocardiographic current image generation portion 523 may generate an electrocardiographic current image VI (t1 to tn) in which any of the hue, chroma, brightness, and a combination thereof is changed.
- Fig. 13 is a diagram illustrating another example of the change in the color attribute.
- Fig. 13 illustrates an example of changing a color attribute pattern.
- a certain boxel BO is configured such that the color attribute is changed in a first pattern while the current EV rises over time ( Fig. 13 : while the current EV rises from time t1 to a crowning point CP).
- the hue is changed from red to yellow within a range of warm colors and the brightness is increased as the current EV rises.
- the aforementioned boxel BO is configured such that the color attribute is changed in a second pattern different from the first pattern while the current EV drops over time ( Fig. 13 : from after the current EV reaches the crowning point CP to time tn).
- the color attribute is changed from yellow to blue within a range of cold colors and the brightness is decreased as the current EV drops.
- each boxel BO of the three-dimensional organ model OM (t1 to tn) is processed in the same manner as described above to generate the electrocardiographic current image VI (t1 to tn).
- the electrocardiographic current image generation portion 523 generates an electrocardiographic current image VI (t1 to tn) in which the color attribute is changed in the first pattern while the current value EV rises over time and changed in the second pattern while the current value EV drops over time at a certain position of the organ (a certain boxel BO of the heart 91).
- VI electrocardiographic current image
- the pattern of change in the color attribute allows the surgeon to intuitively recognize whether the current value EV at a certain position of an organ (a certain boxel BO of the heart 91) is rising or dropping.
- the medical apparatus 1 makes it possible to generate a composite image CI in which the organ model image SI (t1 to tn) three-dimensionally or two-dimensionally presenting the heart 91 (organ), and the electrocardiographic current image VI (t1 to tn) presenting the over-time change EV(t1-tn) in the current EV flowing through each position of the heart 91 are superposed.
- the surgeon can intuitively recognize the changes in the current EV flowing through each position of the heart 91 using the composite image CI.
- the medical apparatus In the electrocardiographic current image VI (t1 to tn) in the composite image CI, the over-time change EV(t1-tn) in the current EV flowing through each position of the heart 91 is expressed by the change in the color attribute.
- the medical apparatus according to the disclosed embodiments has no concern that arrows indicating current vectors obstruct a surgeon's view and hinder the surgeon from checking a condition of the heart 91.
- a time required for detecting a lesion e.g. arrhythmia site
- efficiency and safety of a procedure can be improved.
- the electrocardiographic current image generation portion 523 generates the electrocardiographic current image VI (t1 to tn) in which the change in the color attribute is expressed by changing any of hue, chroma, brightness, and a combination thereof. Thereby, the surgeon can more intuitively recognize the change in the current EV flowing through each position of the heart 91 (organ).
- the electrocardiographic current image generation portion 523 generates an electrocardiographic current image VI (t1 to tn) in which at least one of hue, chroma, and brightness on a part (boxel BO) corresponding to a part through which a relatively high current EV flows is made higher than those on the other parts (boxels BO).
- the surgeon can more intuitively recognize the change in the current EV flowing through each position of the heart 91.
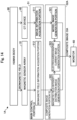
- Fig. 14 is a functional block diagram illustrating a main control portion 51 and a composite image generation portion 52A according to the second embodiment.
- a medical apparatus 1A according to the second embodiment includes the composite image generation portion 52A in place of the composite image generation portion 52 described in the first embodiment.
- the composite image generation portion 52A generates a composite image CIA in which, on the organ model image SI (t1 to tn) and the electrocardiographic current image VI (t1 to tn) described in the first embodiment, the magnetic field intensity distribution image MI (t1 to tn) on the same virtual plane VP is further superposed.
- the magnetic field intensity distribution image MI (t1 to tn) can be generated by capturing the three-dimensional magnetic field intensity distribution model DM generated by the method explained in Figs. 7A to 7C on the virtual plane VP.
- the generated composite image CIA, the first window FW1, and a second window FW2 are displayed on the display screen 61 of the monitor 60.
- Fig. 15 is a diagram illustrating an example of the composite image CIA according to the second embodiment.
- the first window FW1 is as described in the first embodiment.
- the second window FW2 displays an image indicating whether the electrocardiographic current image VI is displayed or not (ON/OFF), and whether the magnetic field intensity distribution image MI is displayed or not (ON/OFF).
- the surgeon can switch a type of an image superposed on the organ model image SI (t1 to tn) in the composite image CIA by selectively switching the ON/OFF displayed on the second window FW2.
- the display of the electrocardiographic current image VI is set to OFF (not displayed), and the display of the magnetic field intensity distribution image MI is set to ON (displayed).
- the upper part of the second window FW2 displays a composite image CIA in which the magnetic field intensity distribution image MI (t1 to tn) is superposed on the organ model image SI (t1 to tn).
- Fig. 16 is a diagram illustrating another example of the composite image CIA according to the second embodiment.
- the display of the electrocardiographic current image VI is set to ON (displayed)
- the display of the magnetic field intensity distribution image MI is set to ON (displayed).
- the upper part of the second window FW2 displays a composite image CIA in which both the electrocardiographic current image VI (t1 to tn) and the magnetic field intensity distribution image MI (t1 to tn) are superposed on the organ model image SI (t1 to tn).
- the medical apparatus 1A can be modified in various ways, and the composite image generation portion 52A may generate and display the composite image CIA including another image different from the organ model image SI (t1 to tn) and the electrocardiographic current image VI (t1 to tn).
- the magnetic field intensity distribution image MI (t1 to tn) was superposed on the composite image CIA, but other images may be superposed on the composite image CIA.
- various images can be adopted, such as an image presenting a position of a lesion, and an image presenting a position of a medical device (catheter, etc.) inserted into the heart 91.
- the second window FW2 for specifying a type of the image displayed as the composite image CIA may be further displayed in addition to the first window FW1 for specifying the virtual plane VP.
- Use of the second window FW2 can further improve usability of the medical apparatus 1A for the surgeon.
- this medical apparatus 1A according to the second embodiment can exhibit a similar effect to the first embodiment described above.
- the composite image generation portion 52A generates the composite image CIA in which the magnetic field intensity distribution image MI (t1 to tn) is further superposed on the organ model image SI (t1 to tn) and the electrocardiographic current image VI (t1 to tn).
- the surgeon can recognize the intensity of the biomagnetic field MFh at each position of the heart 91 (organ) from the magnetic field intensity distribution image MI (t1 to tn) in the composite image CIA, and efficiency and safety of the procedure can be further improved.
- a part of a configuration to be achieved by a hardware may be replaced with a software, or conversely, a part of a configuration to be achieved by a software may be replaced with a hardware.
- the disclosed embodiments are not limited to the embodiments described above and may be carried out in various aspects without departing from the spirit thereof, and for example, the following modifications are also possible.
- the configurations of the medical apparatuses 1 and 1A have been illustrated.
- the configuration of the medical apparatus 1 can be variously modified.
- the medical apparatus 1 in the medical apparatus 1, at least a part of the magnetic sensor array 10, the CT device 40, the computer 50, the display portion 60, and the operating portion 70 may be configured as an integrated device.
- the medical apparatus 1 may include other devices such as an MRI device, an electrocardiograph, an X-ray imaging device, and an ultrasonic probe.
- a current value determined by the electrocardiographic current image generation portion 523 may be e.g. confirmed, re-measured, or corrected by comparing an actual value measured by the electrocardiograph with the over-time change EV(t1-tn) in the current EV determined by the electrocardiographic current image generation portion 523.
- the over-time change EV(t1-tn) in the current EV flowing through each position of the heart 91 may be determined by the following method a1 or method a2 different from the aforementioned method.
- the position of the medical device (catheter, etc.) in the heart 91 can be identified e.g. as follows.
- the electrocardiographic current image generation portion 523 may determine the over-time change EV(t1-tn) using impedance data of a myocardium of the heart 91 together with Maxwell's equation.
- the image generated by the composite image generation portion 52 or 52A and displayed on the display screen 61 were described.
- the image displayed on the display screen 61 can be modified in various ways.
- at least one of the first window FW1 and the second window FW2 may be omitted.
- a third window may be displayed on the display screen 61 to allow selection of the method of changing the color attribute on the electrocardiographic current image VI (t1 to tn) (method explained in Fig. 9 , Figs. 12A and 12B , and Fig. 13 ).
- the display screen 61 may display various images such as an MRI image, an image presenting electrocardiographic measurement data, an image presenting pulse or the like, and an image for explaining a procedure.
- images such as an MRI image, an image presenting electrocardiographic measurement data, an image presenting pulse or the like, and an image for explaining a procedure.
- an image presenting a position of the medical device or a position of a lesion may be further superposed.
- an image presenting a specific site (sinus node, atrioventricular node, His bundle, Purkinje's fiber, etc.) of the heart 91 may be further superposed.
Landscapes
- Health & Medical Sciences (AREA)
- Life Sciences & Earth Sciences (AREA)
- Nuclear Medicine, Radiotherapy & Molecular Imaging (AREA)
- Physics & Mathematics (AREA)
- Medical Informatics (AREA)
- Animal Behavior & Ethology (AREA)
- Pathology (AREA)
- Engineering & Computer Science (AREA)
- Biomedical Technology (AREA)
- Heart & Thoracic Surgery (AREA)
- Veterinary Medicine (AREA)
- Molecular Biology (AREA)
- Surgery (AREA)
- Biophysics (AREA)
- General Health & Medical Sciences (AREA)
- Public Health (AREA)
- Radiology & Medical Imaging (AREA)
- Cardiology (AREA)
- Physiology (AREA)
- High Energy & Nuclear Physics (AREA)
- Measurement And Recording Of Electrical Phenomena And Electrical Characteristics Of The Living Body (AREA)
- Magnetic Resonance Imaging Apparatus (AREA)
- Apparatus For Radiation Diagnosis (AREA)
Abstract
Description
- The disclosed embodiments relate to a medical apparatus, and an image generation method.
- There are known techniques for visualizing a condition of an organ in a living body. For example,
Patent Literatures 1 and 2 disclose a technique in which a current vector flowing through a heart is estimated from results of heart measurements, and, in a heart model, the current vector is indicated by arrows and colors (color mapping display). -
- Patent Literature 1:
Japanese Patent No. 4597329 - Patent Literature 2:
Japanese Patent No. 4027867 - For example, for treatment of arrhythmia or the like, there is a demand to improve a technique of providing treatment while visually checking a condition of a heart including a lesion (arrhythmia site in a case of arrhythmia treatment). However, the techniques described in
Patent Literatures 1 and 2 had a concern that the arrows indicating the current vectors obstructed a surgeon's view and hindered the surgeon from checking the heart condition. As described above, even the above-described prior arts still had room for improvements in the technique of displaying a condition of a heart including a lesion. Such problems are not limited to the heart but are common to treatments or diagnoses of all organs through which a bioelectric current flows, such as brain and kidney. - The disclosed embodiments have been made to solve the above-described problems, and an object of the disclosed embodiments is to improve the technique of displaying a condition of an organ including a lesion.
- The disclosed embodiments have been made to solve at least some of the problems described above, and can be implemented as the following aspects.
- (1) According to an aspect of the disclosed embodiments, a medical apparatus is provided. The medical apparatus includes: an image information acquisition portion that acquires image information including a magnetic resonance imaging (MRI) image or a computerized tomography (CT) image of an organ in a living body; a biomagnetic field information acquisition portion that acquires biomagnetic field information from a biomagnetic field generated by the organ; a model image generation portion that generates, from the image information, an organ model image of the organ two-dimensionally or three-dimensionally expressed; an electrocardiographic current image generation portion that generates an electrocardiographic current image in which an over-time change in a current flowing through each position of the organ, acquired from the biomagnetic field information, is expressed by a change in a color attribute; and a composite image generation portion that generates a composite image in which the organ model image and the electrocardiographic current image are superposed.
- According to this configuration, the medical apparatus generates a composite image in which the organ model image of the organ two-dimensionally or three-dimensionally expressed, and the electrocardiographic current image presenting the over-time change in the current flowing through each position of the organ are superposed. Thereby, the surgeon can intuitively recognize the change in the current flowing through each position of the organ using the composite image. In the electrocardiographic current image in the composite image, the over-time change in the current flowing through each position of the organ is expressed by the change in the color attribute. Thus, compared to the conventional arrow indication for current vectors, the medical apparatus according to the disclosed embodiments has no concern that arrows indicating current vectors obstruct a surgeon's view and hinder the surgeon from checking a condition of an organ. As a result, a time required for detecting a lesion (e.g. arrhythmia site) can be shortened, and efficiency and safety of a procedure can be improved.
- (2) The medical apparatus according to the above aspect may be configured such that the electrocardiographic current image generation portion expresses the change in the color attribute by changing any of hue, chroma, brightness, and a combination thereof.
- According to this configuration, the electrocardiographic current image generation portion generates an electrocardiographic current image in which the change in the color attribute is expressed by changing any of hue, chroma, brightness, and a combination thereof. Thereby, the surgeon can more intuitively recognize the change in the current flowing through each position of the organ.
- (3) The medical apparatus according to the above aspects may be configured such that the electrocardiographic current image generation portion generates the electrocardiographic current image in which at least one of hue, chroma, and brightness on a part corresponding to a part through which a relatively high current flows among the positions of the organ at a predetermined time is made higher than those of the other parts at the same time.
- According to this configuration, the electrocardiographic current image generation portion generates an electrocardiographic current image in which at least one of hue, chroma, and brightness on a part corresponding to the part through which a relatively high current flows is made higher than the other parts. Thereby, the surgeon can more intuitively recognize the change in the current flowing through each position of the organ.
- (4) The medical apparatus according to the above aspects may be configured such that, at a certain position of the organ, when a current value rises over time, the electrocardiographic current image generation portion generates the electrocardiographic current image with the color attribute changed in a first pattern, and when the current value drops over time, the electrocardiographic current image generation portion generates the electrocardiographic current image with the color attribute changed in a second pattern different from the first pattern.
- According to this configuration, the electrocardiographic current image generation portion generates an electrocardiographic current image in which, when the current value rises over time at a certain position of the organ, the color attribute is changed in a first pattern, and when the current value drops over time, the color attribute is changed in a second pattern. Thereby, the pattern of change in the color attribute allows the surgeon to intuitively recognize whether a current value at a certain position of the organ is rising or dropping.
- (5) The medical apparatus according to the above aspects may be configured such that the biomagnetic field information include information on a magnetic field intensity distribution of the biomagnetic field generated by the organ, the medical apparatus further includes a magnetic field intensity distribution image generation portion that generates, from the biomagnetic field information, a magnetic field intensity distribution image presenting an intensity of the biomagnetic field at each position of the organ, and the composite image generation portion generates a composite image in which the magnetic field intensity distribution image is further superposed on the organ model image and the electrocardiographic current image.
- According to this configuration, the composite image generation portion generates a composite image in which the magnetic field intensity distribution image is further superposed on the organ model image and the electrocardiographic current image. Thereby, the surgeon can recognize the intensity of the biomagnetic field at each position of the organ from the magnetic field intensity distribution image in the composite image, and the efficiency and safety of the procedure can be further improved.
- (6) According to an aspect of the disclosed embodiments, an image generation method is provided. This image generation method includes: a step of acquiring image information including an MRI image or a CT image of an organ in a living body; a step of acquiring biomagnetic field information from a biomagnetic field generated by the organ; a step of generating, from the image information, an organ model image of the organ two-dimensionally or three-dimensionally expressed; a step of generating an electrocardiographic current image in which an over-time change in a current flowing through each position of the organ, acquired from the biomagnetic field information, is expressed by a change in a color attribute; and a step of generating a composite image in which the organ model image and the electrocardiographic current image are superposed.
- The disclosed embodiments can be achieved in various modes, and can be achieved in modes such as medical apparatuses (image generation apparatus) that generate images for display, image generation methods, medical systems including medical apparatuses, production methods of these apparatuses and systems, and computer programs that achieve functions of these apparatuses and systems.
-
-
Fig. 1 is an explanatory diagram illustrating a configuration of a medical apparatus. -
Fig. 2 is a functional block diagram illustrating a main control portion and a composite image generation portion. -
Figs. 3A and 3B are explanatory diagrams illustrating a three-dimensional organ model and an organ model image. -
Fig. 4 is a schematic diagram illustrating a method for acquiring biomagnetic field information using a magnetic sensor array. -
Figs. 5A and 5B are schematic diagrams illustrating a method for generating a magnetic field intensity distribution image. -
Fig. 6 is an explanatory diagram illustrating magnetic field intensity distribution images on a plurality of virtual planes of a heart. -
Figs. 7A to 7C are schematic diagrams illustrating a method for generating a three-dimensional magnetic field intensity distribution model. -
Figs. 8A to 8C are schematic diagrams illustrating a method for acquiring an over-time change in a current flowing through the heart. -
Fig. 9 is a schematic diagram illustrating a method for generating an electrocardiographic current image. -
Fig. 10 is a diagram illustrating an example of a composite image. -
Fig. 11 is a diagram illustrating another example of the composite image. -
Figs. 12A and 12B are diagrams illustrating another example of a change in a color attribute. -
Fig. 13 is a diagram illustrating another example of the change in the color attribute. -
Fig. 14 is a functional block diagram illustrating a main control portion and a composite image generation portion according to the second embodiment. -
Fig. 15 is a diagram illustrating an example of the composite image according to the second embodiment. -
Fig. 16 is a diagram illustrating another example of the composite image according to the second embodiment. -
Fig. 1 is an explanatory diagram illustrating a configuration of amedical apparatus 1. Themedical apparatus 1 is used for treatment or diagnosis of a living body (herein, a human body) 90, and can generate and display an electrocardiographic current image in which an over-time change in a current flowing through each position of an organ of thehuman body 90 is expressed by a change in a color attribute. Themedical apparatus 1 includes amagnetic sensor array 10, aCT device 40, acomputer 50, amonitor 60, and anoperating portion 70. Themedical apparatus 1 used for treating arrhythmia will be explained in the following examples. - The
magnetic sensor array 10 is a device for detecting information on a biomagnetic field generated by thehuman body 90 to be treated or diagnosed (hereinafter also referred to as "biomagnetic field information"). The biomagnetic field information include a biomagnetic field intensity and a biomagnetic field direction. A plurality ofmagnetic sensors 11 are arranged on themagnetic sensor array 10. The plurality ofmagnetic sensors 11 are longitudinally and laterally arranged side-by-side in a matrix. Themagnetic sensors 11 are a device that detects biomagnetic field information, and examples thereof may include a GHz-Spin-Rotation Sensor (GSR) sensor, a magnetoresistive effect device (MR), a magnetic impedance device (MI), and a superconducting quantum interference device (SUQUID). - The
magnetic sensor array 10 is located around a center of abed 95 on which thehuman body 90 lies. Themagnetic sensor array 10 may be configured to be attached to thehuman body 90 during treatment or diagnosis. Furthermore, themagnetic sensor array 10 may be configured to be attached to thehuman body 90 during treatment. For example, themagnetic sensor array 10 may be configured to have a band shape to be wrapped around thehuman body 90 or may be configured to have a garment or cap shape. In these cases, themagnetic sensors 11 may be arranged along the shape of thehuman body 90. Themagnetic sensor array 10 may be composed of two or more plates which are three-dimensionally arranged on one or both of the front and back of the human body, and one or both of the sides of the human body. An example of detecting cardiac magnetic field information (intensity, direction, etc. of a cardiac magnetic field) generated by aheart 91 as one of organs of thehuman body 90 using themagnetic sensor array 10 will be explained below. - The
CT device 40 includes, inside a gantry (mount), a tube bulb that emits X-rays and an arc-shaped detector that detects X-rays to generate a CT image presenting a shape of theheart 91 when the tube bulb rotates by 360° around thehuman body 90 lying on thebed 95, and output image information including the CT image to thecomputer 50. Themedical apparatus 1 may include an MRI device instead of the CT device, as an apparatus that generates images presenting the shape of the organ inside thehuman body 90. That is, themedical apparatus 1 may acquire the image information including an MRI image instead of the image information including the CT image. - The
computer 50 controls the overallmedical apparatus 1 and is electrically connected to each of themagnetic sensor array 10, theCT device 40, themonitor 60, and the operatingportion 70. Thecomputer 50 includes a central processing unit (CPU), a read-only memory (ROM), and a random access memory (RAM) not illustrated, where a computer program stored in the ROM is developed to the RAM, the computer program is executed by the CPU to execute functions of amain control portion 51 and a compositeimage generation portion 52. - The
main control portion 51 transmits and receives information to/from themagnetic sensor array 10, theCT device 40, themonitor 60, and the operatingportion 70 to control the entiremedical apparatus 1. Themain control portion 51 includes an imageinformation acquisition portion 511 and a biomagnetic fieldinformation acquisition portion 512. The imageinformation acquisition portion 511 acquires the information (hereinafter also referred to as "image information") including the CT image of thehuman body 90 through control of theCT device 40. The biomagnetic fieldinformation acquisition portion 512 acquires information on the biomagnetic field generated by the human body 90 (biomagnetic field information) through control of themagnetic sensor array 10. That is, themain control portion 51 functionally serves as a so-called console for theCT device 40 and themagnetic sensor array 10. The imageinformation acquisition portion 511 and the biomagnetic fieldinformation acquisition portion 512 will be described below in detail. - The composite
image generation portion 52 generates an organ model image, an electrocardiographic current image, and a composite image with the combined these images, and displays the generated composite image on themonitor 60. The compositeimage generation portion 52 includes a modelimage generation portion 521, a magnetic field intensity distributionimage generation portion 522, and an electrocardiographic currentimage generation portion 523. Each of these functional portions will be described below in detail. - The
monitor 60 is a display portion including adisplay screen 61 and is composed of a liquid crystal display and the like. Themedical apparatus 1 may include a display portion other than themonitor 60. For example, themedical apparatus 1 may include smart glasses including a display screen, or a projector that projects images. The operatingportion 70 is composed of any means such as a keyboard, operation buttons, a touch panel, a foot switch, and a voice recognition device. The operatingportion 70 is operated by the surgeon to switch contents displayed on thedisplay screen 61. -
Fig. 2 is a functional block diagram illustrating themain control portion 51 and the compositeimage generation portion 52.Figs. 3A and 3B are explanatory diagrams illustrating a three-dimensional organ model OM and an organ model image SI.Fig. 3A illustrates an example of a three-dimensional organ model OM, andFig. 3B illustrates an example of an organ model image SI. In the imageinformation acquisition portion 511 of themain control portion 51, the image information including the CT image is acquired from theCT device 40 through control of theCT device 40, and the image information are stored in a storage portion of thecomputer 50. Specifically, in the imageinformation acquisition portion 511, cross-sections of theentire heart 91 are photographed at a time interval to acquire image information including cross-sections of theentire heart 91 at the time interval. Furthermore, in the imageinformation acquisition portion 511, the image information may be directly acquired through control of theCT device 40, or otherwise the image information may be acquired from a storage medium storing the previously acquired image information. - The model
image generation portion 521 of themain control portion 51 generates the three-dimensional organ model OM illustrated inFig. 3A from the image information acquired by the imageinformation acquisition portion 511. Various existing techniques are applicable as the specific technique of generating the three-dimensional organ model OM from the image information including the CT image by the biomagnetic fieldinformation acquisition portion 512. In the example illustrated in the figure, the three-dimensional organ model OM is composed of stereoscopic image data presenting external and internal shapes of theheart 91. In the modelimage generation portion 521, cross-sectional images (a plurality of successive CT images) of theentire heart 91 acquired by the imageinformation acquisition portion 511 at a certain time are integrated to generate the three-dimensional organ model OM of theheart 91 at this time. Then, in the modelimage generation portion 521, the three-dimensional organ models OM of theheart 91 at different times are integrated to generate the dynamic three-dimensional organ model OM that changes over time. - In the model
image generation portion 521 of the compositeimage generation portion 52, this dynamic three-dimensional organ model OM is captured on a virtual plane VP set at any position to generate an organ model image SI in which theheart 91 is three-dimensionally expressed. The position and direction of the virtual plane VP is set to any position and direction desired by the surgeon by operating the operatingportion 70. For example, when the virtual plane VP intersects with the three-dimensional organ model OM, an organ model image SI presenting the cross-section of the three-dimensional organ model OM is generated as illustrated inFig. 3B . When the set virtual plane VP does not intersect with the three-dimensional organ model OM, an organ model image SI presenting an appearance (outer surface) of the three-dimensional organ model OM viewed from the virtual plane VP is generated. - The model
image generation portion 521 may generate an organ model image SI in which theheart 91 is two-dimensionally expressed. The two-dimensional organ model image SI presents only a surface of a part intersecting with the virtual plane VP in the three-dimensional organ model OM. The three-dimensional organ model image SI presents not only the part intersecting with the virtual plane VP but also a part of the three-dimensional organ model OM in a depth direction viewed from the virtual plane VP. The dimension (2D/3D/both) of the image generated by the modelimage generation portion 521 can be arbitrarily set by the surgeon by operating the operatingportion 70. - The three-dimensional organ model OM includes information on a coordinate position of a part corresponding to a specific site of the
heart 91. The "information on a coordinate position of a specific site of theheart 91" refer to e.g. information on a position of sinus node, a position of atrioventricular node, a direction of His bundle, a position of Purkinje's fiber, and the like. The information on the coordinate position of the specific site of theheart 91 can be acquired e.g. by fitting between a contour image displaying a general positional relationship of these specific sites (sinus node, atrioventricular node, His bundle, Purkinje's fiber, etc.) and the three-dimensional organ model OM generated by the modelimage generation portion 521. -
Fig. 4 is a schematic diagram illustrating a method for acquiring biomagnetic field information using themagnetic sensor array 10. In the biomagnetic fieldinformation acquisition portion 512 of the main control portion 51 (Fig. 2 ), the biomagnetic field information are acquired through control of themagnetic sensor array 10, and the biomagnetic field information are stored in the storage portion of thecomputer 50. As mentioned above, the biomagnetic field information include an intensity and a direction of a biomagnetic field MFh generated by an organ inside thehuman body 90. As illustrated inFig. 4 , in theheart 91, electric signals CD are generated from a sinus node to contract atria and ventricles. Themagnetic sensor array 10 detects an intensity and a direction of the biomagnetic field MFh, generated by the electric signals CD, and the biomagnetic fieldinformation acquisition portion 512 acquires the intensity and direction of the biomagnetic field MFh as biomagnetic field information. - If an organ has a lesion (e.g. arrhythmia of the heart 91), the intensity and direction of the biomagnetic field MFh in the biomagnetic field information are affected by the lesion. In other words, the intensity and direction of the biomagnetic field MFh of the organ with the lesion are different from those of a healthy organ without a lesion. This makes it possible to identify a position of a lesion in an organ from biomagnetic field information (by comparison with a biomagnetic field MFh of a healthy organ). Thus, it can be said that the biomagnetic field information acquired by the biomagnetic field
information acquisition portion 512 includes information on the lesion of the organ. -
Figs. 5A and 5B are schematic diagrams illustrating a method for generating a magnetic field intensity distribution image MI.Fig. 5A is a diagram illustrating an example of intensities (detection values Vd) of the biomagnetic field MFh, detected by the respectivemagnetic sensors 11 of themagnetic sensor array 10.Fig. 5B is a diagram illustrating an example of the magnetic field intensity distribution image MI. In themagnetic sensor array 10, themagnetic sensors 11 are arranged in a matrix on a two-dimensional plane (XY plane). Thereby, themagnetic sensor array 10 can detect an intensity (detection value Vd) of the biomagnetic field MFh at each position on the two-dimensional plane as illustrated inFig. 5A. Fig. 5A illustrates a time-series change in the intensity of the biomagnetic field MFh at each position on the two-dimensional plane (XY plane). From the temporal change in the intensity of the biomagnetic field MFh at each position on the two-dimensional plane, themagnetic sensor array 10 can detect the direction of the biomagnetic field MFh on the two-dimensional plane. Furthermore, themagnetic sensor 11 is configured to detect a change in the intensity of the biomagnetic field MFh in a normal direction (Z-direction) of the two-dimensional plane. Herein, each of themagnetic sensors 11 includes a plurality of (e.g. two) elements arranged in the normal direction of the two-dimensional plane so as to detect the intensity of the biomagnetic field MFh at a position relatively close to theheart 91 in the normal direction (Z-direction) and the intensity of the biomagnetic field MFh at a position relatively far from that position. This configuration makes it possible for themagnetic sensor array 10 to detect the intensity and direction of the biomagnetic field MFh on an arbitrary virtual plane VP (XY plane) intersecting with theheart 91. Themagnetic sensor array 10 outputs, to the biomagnetic fieldinformation acquisition portion 512, these biomagnetic field information including these intensities of the biomagnetic field MFh, detected by the respectivemagnetic sensors 11. -
Fig. 6 is an explanatory diagram illustrating magnetic field intensity distribution images MI1 to MI3 on different virtual planes VP1 to VP3 of theheart 91. The magnetic field intensity distributionimage generation portion 522 of the compositeimage generation portion 52 generates the magnetic field intensity distribution image MI illustrated inFig. 5B from the biomagnetic field information acquired by the biomagnetic fieldinformation acquisition portion 512.Fig. 5B illustrates a magnetic field intensity distribution image MI in which the intensity of the biomagnetic field MFh at each position in the two-dimensional plane (XY plane) is expressed in a form of contour lines, as an example of the magnetic field intensity distribution image MI. The intensity of the biomagnetic field MFh may be expressed in a manner other than contours, such as color gradation. From the biomagnetic field information at acertain time 11, the magnetic field intensity distributionimage generation portion 522 can generate the magnetic field intensity distribution image MI on the arbitrary virtual plane VP intersecting with theheart 91.Fig. 6 illustrates, as an example, magnetic field intensity distribution images MI1, MI2, and MI3 corresponding to three virtual planes VP1, VP2, and VP3 respectively at the time t1. -
Figs. 7A to 7C are schematic diagrams illustrating a method for generating a three-dimensional magnetic field intensity distribution model DM.Fig. 7A is a diagram illustrating an example of magnetic field intensity distribution images MI1 to MI5 acquired from five different virtual planes.Fig. 7B is a diagram illustrating an example of a three-dimensional magnetic field intensity distribution model DM acquired from the magnetic field intensity distribution images MI1 to MI5.Fig. 7C is a diagram illustrating an example of a dynamic three-dimensional magnetic field intensity distribution model DM that changes over time. Furthermore, in the magnetic field intensity distributionimage generation portion 522, the magnetic field intensity distribution images MI1 to MI5 generated as described above (a plurality of successive magnetic field intensity distribution images MI) at a certain time t1 are integrated as illustrated inFig. 7A to generate the three-dimensional magnetic field intensity distribution model DM at the time t1 as illustrated inFig. 7B . Subsequently, in the magnetic field intensity distributionimage generation portion 522, the three-dimensional magnetic field intensity distribution models DM of theheart 91 at each of different times t1 to tn (n is a natural number) are integrated to generate a dynamic three-dimensional magnetic field intensity distribution model DM that changes over time, as illustrated inFig. 7C . - The magnetic field intensity distribution
image generation portion 522 may generate a two-dimensional magnetic field intensity distribution image MI. The two-dimensional magnetic field intensity distribution image MI presents only the magnetic field intensity distribution of the part intersecting with the virtual plane VP in the three-dimensional magnetic field intensity distribution model DM. The three-dimensional magnetic field intensity distribution image MI presents a magnetic field intensity distribution of the entire three-dimensional magnetic field intensity distribution model DM viewed from the virtual plane VP or a part included in any spatial region in the three-dimensional magnetic field intensity distribution model DM. Therefore, the three-dimensional magnetic field intensity distribution image MI also presents a depth direction of the magnetic field intensity distribution. The dimension (2D/3D/both) of the image generated by the magnetic field intensity distributionimage generation portion 522 can be arbitrarily set by the surgeon through the operation of the operatingportion 70. - The three-dimensional magnetic field intensity distribution model DM includes not only information on the direction and intensity of the biomagnetic field MFh but also information on a coordinate position of a portion corresponding to a specific site of the
heart 91. The "information on a coordinate position of a specific site of theheart 91 " can be information on a position of sinus node, a position of atrioventricular node, a direction of His bundle, a position of Purkinje's fiber, and the like, similarly to the three-dimensional organ model OM. Information on a coordinate position of a specific site of theheart 91 can be specified e.g. from a change in the magnetic field generated by the electric signals CD. For example, the sinus node is a part serving as an origin of the electric signals CD and the atrioventricular node is a part serving as a relay point of the electric signals CD, and therefore they can be identified from the generation position of the electric signals CD, the flow direction of the electric signals, and the like. -
Figs. 8A to 8C are schematic diagrams illustrating a method for acquiring an over-time change in a current EV flowing through theheart 91.Fig. 8A illustrates an example of electric signals CD that flow through theheart 91 at certain times t1 to t10 and a current EV (t1 to t10) at that time.Fig. 8B illustrates an example of electric signals CD that flow through theheart 91 at subsequent times t11 to t20 and a current EV (t11 to t20) at that time.Fig. 8C illustrates an example of electric signals CD that flow throughheart 91 at further subsequent times t21 to t30 and a current EV (t21 to t30) at that time. - The electrocardiographic current
image generation portion 523 of the compositeimage generation portion 52 acquires, from the magnetic field intensity distributionimage generation portion 522, a three-dimensional magnetic field intensity distribution model DM generated by the method illustrated inFigs. 7A to 7C (dynamic three-dimensional magnetic field intensity distribution model DM that changes over time). In theheart 91, generally, a local current is generated (electric signals CD are generated) from the sinus node SN to an atrioventricular node AN in association with an over-time motion (heartbeat) of theheart 91 as illustrated in the left diagram ofFig. 8A , the current is transmitted (electric signals CD are generated) from the atrioventricular node AN to a His bundle HB as illustrated in the left diagram ofFig. 8B , and the current is transmitted (electric signals CD are generated) to a Purkinje's fiber PF as illustrated in the left diagram ofFig. 8C . As explained inFig. 4 , the three-dimensional magnetic field intensity distribution model DM is generated from information on the intensity and direction of the biomagnetic field MFh generated by the electric signals CD (biomagnetic field information). Thus, in the electrocardiographic currentimage generation portion 523, an over-time change in the electric signals CD at each position of theheart 91, i.e. an over-time change EX(t1-t30) in the current EV flowing through each position of theheart 91 can be determined in accordance with a well-known physical law such as Maxwell's equation using the three-dimensional magnetic field intensity distribution model DM (dynamic three-dimensional magnetic field intensity distribution model DM that changes over time) (in the right diagrams ofFigs. 8A to 8C ). InFigs. 8A to 8C , the figures were explained at times t1 to t30 for convenience, but, hereinafter, will be explained at times t1 to tn (n is a natural number). - As described above, the electrocardiographic current
image generation portion 523 can acquire the over-time change EV(t1-tn) in the current EV flowing through each position of theheart 91 from the biomagnetic field information (indirectly via the three-dimensional magnetic field intensity distribution model DM). The electrocardiographic currentimage generation portion 523 may acquire the over-time change EV(t1-tn) in the current EV flowing through each position of theheart 91 by another method. For example, the electrocardiographic currentimage generation portion 523 may acquire the over-time change EV(t1-tn) in the current EV flowing through each position of theheart 91 directly from a detected value of themagnetic sensor array 10. -
Fig. 9 is a schematic diagram illustrating a method for generating the electrocardiographic current image VI (t1 to tn). Subsequently, the electrocardiographic currentimage generation portion 523 generates an electrocardiographic current image VI (t1 to tn) in which the over-time change EV(t1-tn) in the current EV flowing through each position of theheart 91 is expressed by change in the color attribute. Specifically, the electrocardiographic currentimage generation portion 523 acquires, from the modelimage generation portion 521, the three-dimensional organ model OM (stereoscopic image data presenting external and internal shapes of the heart 91) generated by the method inFigs. 3A and 3B . Herein, the three-dimensional organ model OM acquired by the electrocardiographic currentimage generation portion 523 means a dynamic three-dimensional organ model OM that changes over time, and is hereinafter also referred to as "three-dimensional organ model OM (t1 to tn)" for convenience. - Subsequently, in the electrocardiographic current
image generation portion 523, the three-dimensional organ model OM (t1 to tn) is divided into boxels BO representing predetermined unit volume elements. Then, in the electrocardiographic currentimage generation portion 523, the three-dimensional organ model OM (t1 to tn) is aligned with the over-time change EV(t1-tn) in the current EV flowing through each position of theheart 91, as determined by the method inFigs. 8A to 8C . The alignment can be achieved e.g. by matching the current EV (t21 to t30) flowing to the Purkinje's fiber PF illustrated in the left diagram ofFig. 8C with the contour shape of the three-dimensional organ model OM (t1 to tn). This alignment allows the electrocardiographic currentimage generation portion 523 to acquire the over-time change EV(t1-tn) in the current EV flowing through each boxel BO, i.e. the over-time change EV(t1-tn) in the current EV flowing through each position of theheart 91. In the lower part ofFig. 9 , the over-time changes EV(t1-tn) in the currents EV each flowing through boxels BO11, BO13, BO15, or BO17 at different positions are illustrated. As indicated by the dashed lines in the lower part ofFig. 9 , the currents EV have different over-time changes EV(t1-tn) depending on the position of the boxel BO. - The electrocardiographic current
image generation portion 523 generates an electrocardiographic current image VI (t1 to tn), in which, each boxel BO is configured such that the hue and chroma are set to arbitrary values, and the brightness is set to a value according to the over-time change EV(t1-tn) in the current EV flowing through the corresponding boxel BO. In the example illustrated in the lower part ofFig. 9 , the electrocardiographic currentimage generation portion 523 generates an electrocardiographic current image VI (t1 to tn) in which a brightness of a boxel BO is increased in proportion to a value of a current EV flowing through the boxel BO. In this way, the electrocardiographic currentimage generation portion 523 can generate an electrocardiographic current image VI (t1 to tn) in which boxels BO with a relatively high brightness (i.e. parts with a relatively high brightness) seem to move over time accompanying the over-time change EV(t1-tn) in the current EV. In other words, the electrocardiographic currentimage generation portion 523 according to the first embodiment generates an electrocardiographic current image VI (t1 to tn) in which a brightness of a boxel BO corresponding to a part through which a relatively high current EV flows among the respective positions of theheart 91 at a predetermined time (e.g. time t10) is made higher than those of the other parts at the same time (e.g. time t10). -
Fig. 10 is a diagram illustrating an example of a composite image CI. The compositeimage generation portion 52 generates the composite image CI in which, on an organ model image SI (t1 to tn) generated by capturing a three-dimensional organ model OM (t1 to tn) on the virtual plane VP, an electrocardiographic current image VI (t1 to tn) on the same virtual plane VP is superposed. In the compositeimage generation portion 52, the generated composite image CI and a first window FW1 are displayed on adisplay screen 61 of themonitor 60. The first window FW1 displays an image presenting theheart 91 and an image presenting a positional relationship between theheart 91 and the virtual plane VP. The surgeon can change the position of the virtual plane VP in the composite image CI by operating the virtual plane VP displayed on the first window FW1 to change a positional relationship between the virtual plane VP and the image presenting theheart 91. In the example illustrated inFig. 10 , the virtual plane VP does not intersect with the image presenting theheart 91 in the first window FW1. For this reason, in the composite image CI, the organ model image SI (t1 to tn) presenting the appearance (outer surface) of theheart 91, and the electrocardiographic current image VI (t1 to tn) presenting the over-time change EV(t1-tn) in the current EV flowing through the same outer surface of theheart 91 are superposed. - In
Fig. 10 , the electrocardiographic current image VI (t1 to tn) in the composite images CI is illustrated in white. In this electrocardiographic current image VI (t1 to tn), a relatively bright part BP transitions over time according to the over-time change EV(t1-tn) in the current EV flowing through each position of theheart 91. For example, a relatively bright part BP (t21) at a certain time t21 and a relatively bright part BP (t22) at the next time t22 are at different position. By referring such a composite image CI, the surgeon can intuitively recognize the over-time change EV(t1-tn) in the current EV flowing through each position of theheart 91. At a site LE with an abnormal change in the current EV in the heart 91 (e.g. arrhythmia site in the heart 91), the brightness changes in a manner different from those of other normal sites (in the example illustrated in the figure, the brightness changes in a spiral shape). Thereby, the surgeon can also intuitively recognize the location of the lesion LE with abnormal change in the current EV. - In the electrocardiographic current
image generation portion 523 and the compositeimage generation portion 52, the two-dimensional organ model OM can be processed in the same manner as explained inFigs. 8 to 10 after dividing the model OM into pixels presenting predetermined unit area elements, also in the two-dimensional processing using the two-dimensional organ model OM and the two-dimensional magnetic field intensity distribution model DM. -
Fig. 11 is a diagram illustrating another example of the composite image CI. In the example illustrated inFig. 11 , the virtual plane VP intersects with the image presenting theheart 91 in the first window FW1. For this reason, in the composite image CI, the organ model image SI (t1 to tn) presenting the cross-section of theheart 91 on the virtual plane VP, and the electrocardiographic current image VI (t1 to tn) presenting the over-time change EV(t1-tn) in the current EV flowing through the same cross-section of theheart 91 are superposed. Also in the composite image CI ofFig. 11 , similarly toFig. 10 , in the electrocardiographic current image VI (t1 to tn), a relatively bright part BP transitions over time according to the over-time change EV(t1-tn) in the current EV flowing through each position of theheart 91. For example, a relatively bright part BP (t13) at a certain time t13 and a relatively bright part BP (t14) at the next time t14 are at different position. -
Figs. 12A and 12B are diagrams illustrating another example of a change in a color attribute.Fig. 12A illustrates an example of changing a chroma, andFig. 12B illustrates an example of changing a hue. As illustrated inFig. 12A , when the electrocardiographic currentimage generation portion 523 generates the electrocardiographic current image VI (t1 to tn), each boxel BO may be configured such that the hue and brightness are set to arbitrary values, and the chroma is set to a value according to the over-time change EV(t1-tn) in the current EV flowing through the corresponding boxel BO. Also in such a way, the same effect as in the examples illustrated inFigs. 9 to 11 with the changed brightness can be obtained. As illustrated inFig. 12B , when the electrocardiographic currentimage generation portion 523 generates the electrocardiographic current image VI (t1 to tn), each boxel BO may be configured such that the brightness and chroma are set to arbitrary values, and the hue is set to a red-green-blue (RGB) color value according to the over-time change EV(t1-tn) in the current EV flowing through the corresponding boxel BO. Also in such a way, the same effect as in the examples illustrated inFigs. 9 to 11 with the changed brightness can be obtained. -
Fig. 9 illustrates an example of changing the brightness,Fig. 12A illustrates an example of changing the chroma, andFig. 12B illustrates an example of changing the hue. However, the electrocardiographic currentimage generation portion 523 may generate an electrocardiographic current image VI (t1 to tn) in which any of the hue, chroma, brightness, and a combination thereof is changed. -
Fig. 13 is a diagram illustrating another example of the change in the color attribute.Fig. 13 illustrates an example of changing a color attribute pattern. As illustrated inFig. 13 , when the electrocardiographic currentimage generation portion 523 generates the electrocardiographic current image VI (t1 to tn), a certain boxel BO is configured such that the color attribute is changed in a first pattern while the current EV rises over time (Fig. 13 : while the current EV rises from time t1 to a crowning point CP). In the example illustrated inFig. 13 , in the first pattern, the hue is changed from red to yellow within a range of warm colors and the brightness is increased as the current EV rises. When the electrocardiographic currentimage generation portion 523 generates the electrocardiographic current image VI (t1 to tn), the aforementioned boxel BO is configured such that the color attribute is changed in a second pattern different from the first pattern while the current EV drops over time (Fig. 13 : from after the current EV reaches the crowning point CP to time tn). In the example illustrated inFig. 13 , in the second pattern, the color attribute is changed from yellow to blue within a range of cold colors and the brightness is decreased as the current EV drops. In the electrocardiographic currentimage generation portion 523, each boxel BO of the three-dimensional organ model OM (t1 to tn) is processed in the same manner as described above to generate the electrocardiographic current image VI (t1 to tn). - According to the example illustrated in
Fig. 13 , the electrocardiographic currentimage generation portion 523 generates an electrocardiographic current image VI (t1 to tn) in which the color attribute is changed in the first pattern while the current value EV rises over time and changed in the second pattern while the current value EV drops over time at a certain position of the organ (a certain boxel BO of the heart 91). Thereby, the pattern of change in the color attribute allows the surgeon to intuitively recognize whether the current value EV at a certain position of an organ (a certain boxel BO of the heart 91) is rising or dropping. - As described above, the
medical apparatus 1 according to the first embodiment makes it possible to generate a composite image CI in which the organ model image SI (t1 to tn) three-dimensionally or two-dimensionally presenting the heart 91 (organ), and the electrocardiographic current image VI (t1 to tn) presenting the over-time change EV(t1-tn) in the current EV flowing through each position of theheart 91 are superposed. Thereby, the surgeon can intuitively recognize the changes in the current EV flowing through each position of theheart 91 using the composite image CI. In the electrocardiographic current image VI (t1 to tn) in the composite image CI, the over-time change EV(t1-tn) in the current EV flowing through each position of theheart 91 is expressed by the change in the color attribute. Thus, compared to the conventional arrow indication for current vectors, the medical apparatus according to the disclosed embodiments has no concern that arrows indicating current vectors obstruct a surgeon's view and hinder the surgeon from checking a condition of theheart 91. As a result, a time required for detecting a lesion (e.g. arrhythmia site) can be shortened, and efficiency and safety of a procedure can be improved. - In the
medical apparatus 1 according to the first embodiment, the electrocardiographic currentimage generation portion 523 generates the electrocardiographic current image VI (t1 to tn) in which the change in the color attribute is expressed by changing any of hue, chroma, brightness, and a combination thereof. Thereby, the surgeon can more intuitively recognize the change in the current EV flowing through each position of the heart 91 (organ). The electrocardiographic currentimage generation portion 523 generates an electrocardiographic current image VI (t1 to tn) in which at least one of hue, chroma, and brightness on a part (boxel BO) corresponding to a part through which a relatively high current EV flows is made higher than those on the other parts (boxels BO). Thereby, the surgeon can more intuitively recognize the change in the current EV flowing through each position of theheart 91. -
Fig. 14 is a functional block diagram illustrating amain control portion 51 and a compositeimage generation portion 52A according to the second embodiment. Amedical apparatus 1A according to the second embodiment includes the compositeimage generation portion 52A in place of the compositeimage generation portion 52 described in the first embodiment. The compositeimage generation portion 52A generates a composite image CIA in which, on the organ model image SI (t1 to tn) and the electrocardiographic current image VI (t1 to tn) described in the first embodiment, the magnetic field intensity distribution image MI (t1 to tn) on the same virtual plane VP is further superposed. The magnetic field intensity distribution image MI (t1 to tn) can be generated by capturing the three-dimensional magnetic field intensity distribution model DM generated by the method explained inFigs. 7A to 7C on the virtual plane VP. In the compositeimage generation portion 52A, the generated composite image CIA, the first window FW1, and a second window FW2 are displayed on thedisplay screen 61 of themonitor 60. -
Fig. 15 is a diagram illustrating an example of the composite image CIA according to the second embodiment. The first window FW1 is as described in the first embodiment. The second window FW2 displays an image indicating whether the electrocardiographic current image VI is displayed or not (ON/OFF), and whether the magnetic field intensity distribution image MI is displayed or not (ON/OFF). The surgeon can switch a type of an image superposed on the organ model image SI (t1 to tn) in the composite image CIA by selectively switching the ON/OFF displayed on the second window FW2. In the example illustrated inFig. 15 , on the second window FW2, the display of the electrocardiographic current image VI is set to OFF (not displayed), and the display of the magnetic field intensity distribution image MI is set to ON (displayed). Thus, the upper part of the second window FW2 displays a composite image CIA in which the magnetic field intensity distribution image MI (t1 to tn) is superposed on the organ model image SI (t1 to tn). -
Fig. 16 is a diagram illustrating another example of the composite image CIA according to the second embodiment. In the example illustrated inFig. 16 , on the second window FW2, the display of the electrocardiographic current image VI is set to ON (displayed), and the display of the magnetic field intensity distribution image MI is set to ON (displayed). Thus, the upper part of the second window FW2 displays a composite image CIA in which both the electrocardiographic current image VI (t1 to tn) and the magnetic field intensity distribution image MI (t1 to tn) are superposed on the organ model image SI (t1 to tn). - As described above, the
medical apparatus 1A can be modified in various ways, and the compositeimage generation portion 52A may generate and display the composite image CIA including another image different from the organ model image SI (t1 to tn) and the electrocardiographic current image VI (t1 to tn). In the aforementioned examples, although the magnetic field intensity distribution image MI (t1 to tn) was superposed on the composite image CIA, but other images may be superposed on the composite image CIA. As the other images, various images can be adopted, such as an image presenting a position of a lesion, and an image presenting a position of a medical device (catheter, etc.) inserted into theheart 91. In the compositeimage generation portion 52A, the second window FW2 for specifying a type of the image displayed as the composite image CIA may be further displayed in addition to the first window FW1 for specifying the virtual plane VP. Use of the second window FW2 can further improve usability of themedical apparatus 1A for the surgeon. - Also this
medical apparatus 1A according to the second embodiment can exhibit a similar effect to the first embodiment described above. In themedical apparatus 1A according to the second embodiment, the compositeimage generation portion 52A generates the composite image CIA in which the magnetic field intensity distribution image MI (t1 to tn) is further superposed on the organ model image SI (t1 to tn) and the electrocardiographic current image VI (t1 to tn). Thereby, the surgeon can recognize the intensity of the biomagnetic field MFh at each position of the heart 91 (organ) from the magnetic field intensity distribution image MI (t1 to tn) in the composite image CIA, and efficiency and safety of the procedure can be further improved. - In the embodiments described above, a part of a configuration to be achieved by a hardware may be replaced with a software, or conversely, a part of a configuration to be achieved by a software may be replaced with a hardware. Furthermore, the disclosed embodiments are not limited to the embodiments described above and may be carried out in various aspects without departing from the spirit thereof, and for example, the following modifications are also possible.
- In the first and second embodiments, the configurations of the
medical apparatuses medical apparatus 1 can be variously modified. For example, in themedical apparatus 1, at least a part of themagnetic sensor array 10, theCT device 40, thecomputer 50, thedisplay portion 60, and the operatingportion 70 may be configured as an integrated device. For example, themedical apparatus 1 may include other devices such as an MRI device, an electrocardiograph, an X-ray imaging device, and an ultrasonic probe. When themedical apparatus 1 includes an electrocardiograph, in themedical apparatus 1, a current value determined by the electrocardiographic currentimage generation portion 523 may be e.g. confirmed, re-measured, or corrected by comparing an actual value measured by the electrocardiograph with the over-time change EV(t1-tn) in the current EV determined by the electrocardiographic currentimage generation portion 523. - For example, in the electrocardiographic current
image generation portion 523, the over-time change EV(t1-tn) in the current EV flowing through each position of theheart 91 may be determined by the following method a1 or method a2 different from the aforementioned method. In the methods a1 and a2, the position of the medical device (catheter, etc.) in theheart 91 can be identified e.g. as follows. - A magnetic field generation portion composed of an electromagnet is installed in the medical device. The
main control portion 51 of themedical apparatus 1 acquires second magnetic field information output from themagnetic sensor array 10 while the magnetic field generation portion (electromagnet) is energized. The second magnetic field information are magnetic field information with a combination of a biomagnetic field MFh and a device magnetic field generated by the magnetic field generation portion of the medical device (hereinafter also referred to as "biomagnetic/device magnetic mixed field"). The second magnetic field information include position information on the medical device. Thereby, themain control portion 51 can identify a position of the magnetic field generation portion of the medical device by comparing the biomagnetic field information described in the first embodiment with the second magnetic field information. - A magnetic field generation portion composed of a permanent magnet is installed in the medical device. The
main control portion 51 of themedical apparatus 1 can identify a position of the magnetic field generation portion of the medical device from an X-ray image acquired by an X-ray imaging device. This is because, when the magnetic field generation portion (magnetic force source) installed in the medical device is composed of a permanent magnet, a magnetic force intensity measurement value does not change by factors (mainly, time) other than a relative distance between the magnetic field generation portion on the X-ray image and themagnetic sensor array 10, and therefore the magnetic field generation portion can be identified as a magnetic force source that moves in conjunction with the operation of the medical device (i.e. movement of the medical device) rather than the heartbeat of theheart 91. - (a1) An electrode may be installed in the medical device to determine the over-time change EV(t1-tn) in the current EV flowing through each position of the
heart 91 by a potential measurement using a medical device inserted into the inside of theheart 91. In this case, the potential change is measured at a specific point inside theheart 91 for an arbitrary time T, and then the measurement point is moved to acquire required data of the over-time change in the potential in the heart region. The time T can be set to a value corresponding to a previously acquired heartbeat cycle of theheart 91, and is preferably m times (m is a natural number) the heartbeat cycle of theheart 91. In the electrocardiographic currentimage generation portion 523, the potential change thus acquired is replaced by the over-time change EV(t1-tn) in the current EV. In principle, only unit conversions can be used for the replacement. In the electrocardiographic currentimage generation portion 523, signal correction such as noise reduction may be carried out along with the replacement. If the medical device to be inserted into theheart 91 is a catheter having a basket structure, the potential and the current can be replaced by each other while carrying out the measurement in real time. - (a2) A magnetic sensor may be installed in the medical device to determine the over-time change EV(t1-tn) in the current EV flowing through each position of the
heart 91 by a magnetism measurement using the medical device inserted into the inside theheart 91. In this case, the change in the magnetism is measured at a specific point inside theheart 91 for an arbitrary time T, and then the measurement point is moved to acquire required data of the over-time change in the magnetism in the heart region. Explanation of the time T is the same as in the method a1. In the electrocardiographic currentimage generation portion 523, the change in the magnetism thus acquired is converted into the over-time change EV(t1-tn) in the current EV in accordance with a well-known physical law such as Maxwell's equation. If the medical device to be inserted into theheart 91 is a catheter having a basket structure, the magnetism and the current can be converted into each other while carrying out the measurement in real time. - As is well known, the over-time changes in the magnetism, potential, and current correlate with each other. Consequently, in the method described in the first embodiment and in methods a1 and a2 above, the electrocardiographic current
image generation portion 523 may determine the over-time change EV(t1-tn) using impedance data of a myocardium of theheart 91 together with Maxwell's equation. - In the first and second embodiments above, examples of the image generated by the composite
image generation portion display screen 61 were described. However, the image displayed on thedisplay screen 61 can be modified in various ways. For example, at least one of the first window FW1 and the second window FW2 may be omitted. For example, a third window may be displayed on thedisplay screen 61 to allow selection of the method of changing the color attribute on the electrocardiographic current image VI (t1 to tn) (method explained inFig. 9 ,Figs. 12A and 12B , andFig. 13 ). For example, thedisplay screen 61 may display various images such as an MRI image, an image presenting electrocardiographic measurement data, an image presenting pulse or the like, and an image for explaining a procedure. For example, on the composite image CI, an image presenting a position of the medical device or a position of a lesion may be further superposed. For example, on the composite image CI, an image presenting a specific site (sinus node, atrioventricular node, His bundle, Purkinje's fiber, etc.) of theheart 91 may be further superposed. - Each of the configurations of the
medical apparatus Modifications 1 and 2 described above may be appropriately combined. For example, in the configuration described in the second embodiment, a variation of the change in the color attribute in the electrocardiographic current image VI (t1 to tn) explained inFig. 9 ,Figs. 12A and 12B , andFig. 13 may be adopted. - The present aspect has been described above based on the embodiments and the modifications; however, the embodiments according to the above aspects are provided to facilitate understanding of the present aspect and not to limit the aspect. The present aspect may be modified and improved without departing from the spirit thereof and the scope of claims, and the present aspect includes equivalents thereof. Furthermore, the technical features may be omitted as appropriate unless they are described as essential in this description.
-
- 1, 1A
- Medical apparatus
- 10
- Magnetic sensor array
- 11
- Magnetic sensor
- 40
- CT device
- 50
- Computer
- 51
- Main control portion
- 52, 52A
- Composite image generation portion
- 60
- Monitor
- 61
- Display screen
- 70
- Operating portion
- 90
- Human body
- 91
- Heart
- 95
- Bed
- 511
- Image information acquisition portion
- 512
- Biomagnetic field information acquisition portion
- 521
- Model image generation portion
- 522
- Magnetic field intensity distribution image generation portion
- 523
- Electrocardiographic current image generation portion
- VP
- Virtual plane
- OM
- Three-dimensional organ model
- DM
- Three-dimensional magnetic field intensity distribution model
- SI
- Organ model image
- VI
- Electrocardiographic current image
- MI
- Magnetic field intensity distribution image
- CI, CIA
- Composite image
- FW1
- First window
- FW2
- Second window
- HB
- His bundle
- LE
- Lesion
- PF
- Purkinje's fiber
- SN
- Sinus node
Claims (6)
- The medical apparatus comprising:an image information acquisition portion that acquires image information comprising a magnetic resonance imaging (MRI) image or a computerized tomography (CT) image of an organ in a living body;a biomagnetic field information acquisition portion that acquires biomagnetic field information from a biomagnetic field generated by the organ;a model image generation portion that generates, from the image information, an organ model image of the organ two-dimensionally or three-dimensionally expressed;an electrocardiographic current image generation portion that generates an electrocardiographic current image in which an over-time change in a current flowing through each position of the organ, acquired from the biomagnetic field information, is expressed by a change in a color attribute; anda composite image generation portion that generates a composite image in which the organ model image and the electrocardiographic current image are superposed.
- The medical apparatus according to claim 1, wherein
the electrocardiographic current image generation portion expresses the change in the color attribute by changing any of hue, chroma, brightness, and a combination thereof. - The medical apparatus according to claim 2, wherein
the electrocardiographic current image generation portion generates the electrocardiographic current image in which at least one of hue, chroma, and brightness on a part corresponding to a part through which a relatively high current flows among the positions of the organ at a predetermined time is made higher than those of the other parts at the same time. - The medical apparatus according to any one of claims 1 to 3, whereinat a certain position of the organ,when a current value rises over time, the electrocardiographic current image generation portion generates the electrocardiographic current image with the color attribute changed in a first pattern, andwhen the current value drops over time, the electrocardiographic current image generation portion generates the electrocardiographic current image with the color attribute changed in a second pattern different from the first pattern.
- The medical apparatus according to any one of claims 1 to 4, whereinthe biomagnetic field information includes information on a magnetic field intensity distribution of the biomagnetic field generated by the organ,the medical apparatus further comprises a magnetic field intensity distribution image generation portion that generates, from the biomagnetic field information, a magnetic field intensity distribution image presenting an intensity of the biomagnetic field at each position of the organ, andthe composite image generation portion generates a composite image in which the magnetic field intensity distribution image is further superposed on the organ model image and the electrocardiographic current image.
- An image generation method comprising:a step of acquiring image information comprising an MRI image or a CT image of an organ in a living body;a step of acquiring biomagnetic field information from a biomagnetic field generated by the organ;a step of generating, from the image information, an organ model image of the organ two-dimensionally or three-dimensionally expressed;a step of generating an electrocardiographic current image in which an over-time change in a current flowing through each position of the organ, acquired from the biomagnetic field information, is expressed by a change in a color attribute; anda step of generating a composite image in which the organ model image and the electrocardiographic current image are superposed.
Applications Claiming Priority (1)
| Application Number | Priority Date | Filing Date | Title |
|---|---|---|---|
| PCT/JP2020/040073 WO2022091175A1 (en) | 2020-10-26 | 2020-10-26 | Medical device and image generation method |
Publications (2)
| Publication Number | Publication Date |
|---|---|
| EP4233705A1 true EP4233705A1 (en) | 2023-08-30 |
| EP4233705A4 EP4233705A4 (en) | 2024-07-24 |
Family
ID=81383733
Family Applications (1)
| Application Number | Title | Priority Date | Filing Date |
|---|---|---|---|
| EP20959693.1A Withdrawn EP4233705A4 (en) | 2020-10-26 | 2020-10-26 | MEDICAL DEVICE AND IMAGING METHOD |
Country Status (5)
| Country | Link |
|---|---|
| US (1) | US12564345B2 (en) |
| EP (1) | EP4233705A4 (en) |
| JP (1) | JP7772711B2 (en) |
| CN (1) | CN116348041A (en) |
| WO (1) | WO2022091175A1 (en) |
Family Cites Families (12)
| Publication number | Priority date | Publication date | Assignee | Title |
|---|---|---|---|---|
| EP0470270A1 (en) * | 1990-07-30 | 1992-02-12 | Siemens Aktiengesellschaft | Process for selection, presentation and graphic conversion of spacially definable biomagnetic or bioelectric signals onto a graphic display screen |
| US6301496B1 (en) | 1998-07-24 | 2001-10-09 | Biosense, Inc. | Vector mapping of three-dimensionally reconstructed intrabody organs and method of display |
| US6226542B1 (en) | 1998-07-24 | 2001-05-01 | Biosense, Inc. | Three-dimensional reconstruction of intrabody organs |
| JP3454235B2 (en) * | 1999-10-06 | 2003-10-06 | 株式会社日立製作所 | Biomagnetic field measurement device |
| JP3712349B2 (en) * | 2000-07-18 | 2005-11-02 | 独立行政法人科学技術振興機構 | Surviving myocardial diagnostic apparatus and operating method thereof |
| JP4027867B2 (en) | 2003-09-10 | 2007-12-26 | 株式会社日立ハイテクノロジーズ | Biomagnetic field measurement device |
| EP1872721A4 (en) | 2005-04-07 | 2010-04-28 | Nemoto Kyorindo Co Ltd | IMAGE DISPLAY DEVICE |
| US9204927B2 (en) * | 2009-05-13 | 2015-12-08 | St. Jude Medical, Atrial Fibrillation Division, Inc. | System and method for presenting information representative of lesion formation in tissue during an ablation procedure |
| CN103239253B (en) * | 2012-02-14 | 2015-07-15 | 株式会社东芝 | Medical image diagnostic apparatus |
| CN104739411B (en) * | 2015-04-01 | 2017-04-05 | 南京医科大学 | A kind of use Magnetic Sensor carries out the method for detecting positioning to magnetic target |
| US9433363B1 (en) * | 2015-06-18 | 2016-09-06 | Genetesis Llc | Method and system for high throughput evaluation of functional cardiac electrophysiology |
| WO2021181648A1 (en) * | 2020-03-13 | 2021-09-16 | 朝日インテック株式会社 | Medical device and image generation method |
-
2020
- 2020-10-26 CN CN202080106531.2A patent/CN116348041A/en not_active Withdrawn
- 2020-10-26 EP EP20959693.1A patent/EP4233705A4/en not_active Withdrawn
- 2020-10-26 WO PCT/JP2020/040073 patent/WO2022091175A1/en not_active Ceased
- 2020-10-26 JP JP2022558608A patent/JP7772711B2/en active Active
-
2023
- 2023-04-20 US US18/136,889 patent/US12564345B2/en active Active
Also Published As
| Publication number | Publication date |
|---|---|
| EP4233705A4 (en) | 2024-07-24 |
| CN116348041A (en) | 2023-06-27 |
| JPWO2022091175A1 (en) | 2022-05-05 |
| JP7772711B2 (en) | 2025-11-18 |
| US12564345B2 (en) | 2026-03-03 |
| WO2022091175A1 (en) | 2022-05-05 |
| US20230255535A1 (en) | 2023-08-17 |
Similar Documents
| Publication | Publication Date | Title |
|---|---|---|
| US12586191B2 (en) | Image processing apparatus, medical image diagnostic apparatus, and blood pressure monitor | |
| CN109199598A (en) | System and method for glassy state view in real-time three-dimensional (3D) cardiac imaging | |
| JP7032111B2 (en) | Medical image processing equipment, X-ray CT equipment and medical image processing program | |
| CN102283650B (en) | Medical image diagnosis apparatus and image information processing apparatus | |
| US11903745B2 (en) | Image processing apparatus | |
| US8036734B2 (en) | Method for determining cardiac impulse conduction and associated medical device | |
| US7363070B2 (en) | Biomagnetic measurement apparatus | |
| JP2010119831A (en) | Image display apparatus, image display method, and magnetic resonance imaging apparatus | |
| US20130261445A1 (en) | Representation of blood vessels and tissue in the heart | |
| KR102449871B1 (en) | Apparatus for processing medical image and method for processing medical image thereof | |
| JP3712349B2 (en) | Surviving myocardial diagnostic apparatus and operating method thereof | |
| Yang et al. | Multiview sequential learning and dilated residual learning for a fully automatic delineation of the left atrium and pulmonary veins from late gadolinium-enhanced cardiac MRI images | |
| CN102223843B (en) | Visualization of coronary artery tree | |
| US20230005215A1 (en) | Medical apparatus and image generation method | |
| US12239476B2 (en) | Biometric information display apparatus, method, and program | |
| US12564345B2 (en) | Medical apparatus, and image generation method for visualizing temporal trends of biomagnetic data on an organ model | |
| JP2021083479A (en) | Biological information display device, biological information display method, and display program | |
| JP2013144068A (en) | Treatment support apparatus and control program | |
| JP3712350B2 (en) | Cardiac magnetic field diagnostic apparatus for ventricular delayed potential and method for operating the same | |
| JP6181381B2 (en) | Image analysis apparatus and magnetic resonance imaging apparatus | |
| EP3614913B1 (en) | Connectivity analysis for arrhythmia drivers | |
| JP2007014483A (en) | Medical diagnostic apparatus and diagnostic support apparatus | |
| Suever | MRI Methods for Predicting Response to Cardiac Resynchronization Therapy |
Legal Events
| Date | Code | Title | Description |
|---|---|---|---|
| STAA | Information on the status of an ep patent application or granted ep patent |
Free format text: STATUS: THE INTERNATIONAL PUBLICATION HAS BEEN MADE |
|
| PUAI | Public reference made under article 153(3) epc to a published international application that has entered the european phase |
Free format text: ORIGINAL CODE: 0009012 |
|
| STAA | Information on the status of an ep patent application or granted ep patent |
Free format text: STATUS: REQUEST FOR EXAMINATION WAS MADE |
|
| 17P | Request for examination filed |
Effective date: 20230417 |
|
| AK | Designated contracting states |
Kind code of ref document: A1 Designated state(s): AL AT BE BG CH CY CZ DE DK EE ES FI FR GB GR HR HU IE IS IT LI LT LU LV MC MK MT NL NO PL PT RO RS SE SI SK SM TR |
|
| DAV | Request for validation of the european patent (deleted) | ||
| DAX | Request for extension of the european patent (deleted) | ||
| A4 | Supplementary search report drawn up and despatched |
Effective date: 20240626 |
|
| RIC1 | Information provided on ipc code assigned before grant |
Ipc: A61B 5/367 20210101ALI20240620BHEP Ipc: A61B 5/242 20210101ALI20240620BHEP Ipc: A61B 5/0536 20210101ALI20240620BHEP Ipc: A61B 5/00 20060101ALI20240620BHEP Ipc: A61B 5/05 20210101AFI20240620BHEP |
|
| STAA | Information on the status of an ep patent application or granted ep patent |
Free format text: STATUS: THE APPLICATION HAS BEEN WITHDRAWN |
|
| 18W | Application withdrawn |
Effective date: 20240828 |