EP4231108B1 - Verfahren und system zur ursachenerkennung von fehlern in der fertigungs- und verfahrensindustrie - Google Patents
Verfahren und system zur ursachenerkennung von fehlern in der fertigungs- und verfahrensindustrie Download PDFInfo
- Publication number
- EP4231108B1 EP4231108B1 EP22186877.1A EP22186877A EP4231108B1 EP 4231108 B1 EP4231108 B1 EP 4231108B1 EP 22186877 A EP22186877 A EP 22186877A EP 4231108 B1 EP4231108 B1 EP 4231108B1
- Authority
- EP
- European Patent Office
- Prior art keywords
- fault
- causal
- technique
- variables
- root cause
- Prior art date
- Legal status (The legal status is an assumption and is not a legal conclusion. Google has not performed a legal analysis and makes no representation as to the accuracy of the status listed.)
- Active
Links
Images


Classifications
-
- G—PHYSICS
- G05—CONTROLLING; REGULATING
- G05B—CONTROL OR REGULATING SYSTEMS IN GENERAL; FUNCTIONAL ELEMENTS OF SUCH SYSTEMS; MONITORING OR TESTING ARRANGEMENTS FOR SUCH SYSTEMS OR ELEMENTS
- G05B23/00—Testing or monitoring of control systems or parts thereof
- G05B23/02—Electric testing or monitoring
- G05B23/0205—Electric testing or monitoring by means of a monitoring system capable of detecting and responding to faults
- G05B23/0259—Electric testing or monitoring by means of a monitoring system capable of detecting and responding to faults characterized by the response to fault detection
- G05B23/0275—Fault isolation and identification, e.g. classify fault; estimate cause or root of failure
-
- G—PHYSICS
- G06—COMPUTING OR CALCULATING; COUNTING
- G06F—ELECTRIC DIGITAL DATA PROCESSING
- G06F11/00—Error detection; Error correction; Monitoring
- G06F11/07—Responding to the occurrence of a fault, e.g. fault tolerance
- G06F11/0703—Error or fault processing not based on redundancy, i.e. by taking additional measures to deal with the error or fault not making use of redundancy in operation, in hardware, or in data representation
- G06F11/079—Root cause analysis, i.e. error or fault diagnosis
-
- G—PHYSICS
- G05—CONTROLLING; REGULATING
- G05B—CONTROL OR REGULATING SYSTEMS IN GENERAL; FUNCTIONAL ELEMENTS OF SUCH SYSTEMS; MONITORING OR TESTING ARRANGEMENTS FOR SUCH SYSTEMS OR ELEMENTS
- G05B23/00—Testing or monitoring of control systems or parts thereof
- G05B23/02—Electric testing or monitoring
- G05B23/0205—Electric testing or monitoring by means of a monitoring system capable of detecting and responding to faults
- G05B23/0218—Electric testing or monitoring by means of a monitoring system capable of detecting and responding to faults characterised by the fault detection method dealing with either existing or incipient faults
- G05B23/0224—Process history based detection method, e.g. whereby history implies the availability of large amounts of data
- G05B23/024—Quantitative history assessment, e.g. mathematical relationships between available data; Functions therefor; Principal component analysis [PCA]; Partial least square [PLS]; Statistical classifiers, e.g. Bayesian networks, linear regression or correlation analysis; Neural networks
-
- G—PHYSICS
- G06—COMPUTING OR CALCULATING; COUNTING
- G06F—ELECTRIC DIGITAL DATA PROCESSING
- G06F11/00—Error detection; Error correction; Monitoring
- G06F11/07—Responding to the occurrence of a fault, e.g. fault tolerance
- G06F11/0703—Error or fault processing not based on redundancy, i.e. by taking additional measures to deal with the error or fault not making use of redundancy in operation, in hardware, or in data representation
- G06F11/0706—Error or fault processing not based on redundancy, i.e. by taking additional measures to deal with the error or fault not making use of redundancy in operation, in hardware, or in data representation the processing taking place on a specific hardware platform or in a specific software environment
- G06F11/0736—Error or fault processing not based on redundancy, i.e. by taking additional measures to deal with the error or fault not making use of redundancy in operation, in hardware, or in data representation the processing taking place on a specific hardware platform or in a specific software environment in functional embedded systems, i.e. in a data processing system designed as a combination of hardware and software dedicated to performing a certain function
Definitions
- the disclosure herein generally relates to analysis of faults in manufacturing and process industries, and, more particularly, a method and a system for root cause identification of faults in manufacturing and process industries.
- Root cause identification (RCI) of faults enables operators and plant engineers to pinpoint the source(s)/causes of the fault and take appropriate corrective actions to prevent catastrophic failure.
- RCI in industrial systems is challenging in manufacturing and process industries due to complex behavior of the processes, interactions among sensors, corrective actions of control systems and wide variability in fault behavior. Further, due to the complex interdependent multivariate data, it is challenging to manually identify the intricate causal structures to detect the root cause of faults.
- the existing state-of-the-art techniques for automatic root cause identification include knowledge-based techniques and data-driven techniques.
- Knowledge-based techniques require a prior knowledge of faults/failures along with exhaustive details on the relationships between faults and observations (symptoms) while the data-driven methods rely entirely on historical and current operating data.
- the existing techniques have significant dependency on manual inputs and subject matter knowledge/experts.
- D1 ( WO2018009643A1 ) teaches about computer-based methods and systems to perform root cause analysis with the construction of a probabilistic graph model (PGM) that explains the, e.g., negative, event dynamics of a processing plant, demonstrates precursor profiles for real-time monitoring, and provides probabilistic prediction of plant event occurrence based on real-time data.
- D2 ( WO2021059291A1 ) relates to regime shift identification (RSI), root cause analysis of the identified regime shift and a recommendation unit to rectify the identified regime shift.
- RSI regime shift identification
- Embodiments of the present disclosure present technological improvements as solutions to one or more of the above-mentioned technical problems recognized by the inventors in conventional systems.
- a method according to the invention is set out in claim 1 while a corresponding apparatus and a computer program product are set out in claims 3 and 4, respectively; the dependent claims define further advantageous embodiments.
- FIG. 1 through FIG.5 where similar reference characters denote corresponding features consistently throughout the figures, there are shown preferred embodiments and these embodiments are described in the context of the following exemplary system and/or method.
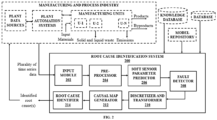
- FIG. 1 is a block diagram of a system 100 for root cause identification of fault in manufacturing and process industries in accordance with some embodiments of the present disclosure.
- the system 100 includes a processor(s) 104, communication interface device(s), alternatively referred as input/output (I/O) interface(s) 106, and one or more data storage devices or a memory 102 operatively coupled to the processor(s) 104.
- the system 100 with one or more hardware processors is configured to execute functions of one or more functional blocks of the system 100.
- the processor(s) 104 can be one or more hardware processors 104.
- the one or more hardware processors 104 can be implemented as one or more microprocessors, microcomputers, microcontrollers, digital signal processors, central processing units, state machines, logic circuitries, and/or any devices that manipulate signals based on operational instructions.
- the one or more hardware processors 104 is configured to fetch and execute computer-readable instructions stored in the memory 102.
- the system 100 can be implemented in a variety of computing systems including laptop computers, notebooks, hand-held devices such as mobile phones, workstations, mainframe computers, servers, a network cloud and the like.
- the memory 102 may include any computer-readable medium known in the art including, for example, volatile memory, such as static random-access memory (SRAM) and dynamic random-access memory (DRAM), and/or non-volatile memory, such as read only memory (ROM), erasable programmable ROM, flash memories, hard disks, optical disks, and magnetic tapes.
- volatile memory such as static random-access memory (SRAM) and dynamic random-access memory (DRAM)
- DRAM dynamic random-access memory
- non-volatile memory such as read only memory (ROM), erasable programmable ROM, flash memories, hard disks, optical disks, and magnetic tapes.
- the memory 102 may include a database 108 configured to include information regarding data associated with manufacturing and process industries.
- the memory 102 may comprise information pertaining to input(s)/output(s) of each step performed by the processor(s) 104 of the system 100 and methods of the present disclosure.
- the database 108 may be external (not shown) to the system 100 and coupled to the system via the I/O interface 106.
- the system 100 supports various connectivity options such as BLUETOOTH ® , USB, ZigBee and other cellular services.
- the network environment enables connection of various components of the system 100 using any communication link including Internet, WAN, MAN, and so on.
- the system 100 is implemented to operate as a stand-alone device.
- the system 100 may be implemented to work as a loosely coupled device to a smart computing environment. The components and functionalities of the system 100 are described further in detail.
- the system 200 is a root cause identification (RCI) system that is connected to a manufacturing and process industry.
- the manufacturing and process industry includes one or more-unit operations or the entire plant from iron & steel, power generation, oil & gas upstream, crude oil refineries, pharmaceuticals, cement, pulp & paper, consumer packaged goods, semiconductor manufacturing, polymer and fine chemical industries.
- the manufacturing and process industry comprises at least one industrial plant data source, plant automation system or distributed control system (DCS), a server, a plurality of manufacturing units that have inputs in the form of one or more raw materials and outputs in the form of products, byproducts, solid-liquid wastes and gaseous emissions.
- the manufacturing and process industry also includes several databases/repositories. It should be appreciated that the model repository the knowledge database and the plurality of databases could be the part of the data repository.
- the multivariate time series data from all the plant data sources and automation systems is brought to the RCI System via a Server.
- the root cause identification (RCI) system 200 comprises an input module 202 configured for receiving a plurality of time series data from a plurality of sources.
- the system 200 further comprises a pre-processor 204 configured for pre-processing the plurality of time-series data using a set of plurality of pre-processing techniques to obtain a plurality of pre-processed data.
- the system 200 further comprises a soft sensor parameter predictor 206 configured for predicting a plurality of soft sensed parameters using the plurality of pre-processed data.
- the system 200 further comprises a fault detector 208 configured for detecting at a fault, a plurality of fault variables indicative of the fault and a fault contribution score from the plurality of pre-processed data and the plurality of soft sensed parameters using a fault detection-localization technique.
- the system 200 further comprises a discretizer and transformer 210 configured for discretizing and transforming the plurality of fault variables to obtain a plurality of discretized-transformed fault variables.
- the system 200 further comprises a causal map generator 212 configured for generating a causal map of the plurality of discretized-transformed fault variables using a dynamic causal network generation technique.
- the system 200 further comprises a root cause identifier 214 configured for identifying atleast one root cause for the fault based on a Fault Traversal and Root Cause Identification (FTRCI) technique.
- FTRCI Fault Traversal and Root Cause Identification
- FIG. 3A and FIG. 3B with reference to FIG. 1 , is an exemplary flow diagram illustrating a method 300 for root cause identification of faults in manufacturing and process industries using the system 100 of FIG. 1 according to an embodiment of the present invention.
- a plurality of time series data is received from a plurality of sources via the input module 202.
- the plurality of time series data comprises a plurality of real-time data and a plurality of non-real-time data.
- the plurality of sources associated with the manufacturing and process industries is associated with manufacturing and process industries that includes iron & steel, power generation, oil & gas, crude oil refineries, pharmaceuticals, cement, pulp & paper, consumer packaged goods, semiconductor manufacturing, polymer and fine chemicals.
- the manufacturing and process industries comprises of several database including sensor database, a laboratory database, an environment database and a maintenance database.
- the plurality of time series data is pre-processed in the pre-processor 204 to obtain a plurality of pre-processed data.
- the plurality of time series data is pre-processed using a set of plurality of pre-processing techniques.
- the plurality of pre-processing techniques comprises several techniques for:
- the pre-processing techniques include techniques such as extreme value capping known in the art for identification and removal of spurious values and redundant data.
- the pre-processing techniques for imputation of missing values and unification of sampling frequency include a Simple Moving Average, Exponential Weighted Moving Average, Last Value Carried Forward, ARIMA, Linear Interpolation and Multiple Imputation by Chained Equations (MICE).
- the pre-processing techniques also include known techniques for the synchronization of data and combining data from plurality of data sources.
- the pre-processing techniques are not limited to the techniques shared above but include any technique that can be used to meet the objective of (a) identification and removal of spurious values, (b) imputation of missing values and unification of sampling frequency and (c) synchronization of data and combining data from plurality of data sources.
- the pre-processing techniques are performed on both the real-time data and non-real-time data.
- the pre-processing techniques involve removal of redundant data, identification and removal of spurious values, unification of sampling frequency, imputation of missing data, synchronization of data by incorporating appropriate lags, and combining data from plurality of data sources.
- the technique for imputation includes simple moving average, exponential moving average, interpolation etc.
- the pre-processing techniques are not limited to the techniques shared above but includes any technique that can be used to meet the objective of (a) identification and removal of spurious values, (b) imputation of missing values and uniform sampling and (c) synchronization of data and combining data from plurality of data sources.
- a plurality of soft sensed parameters is predicted using the plurality of pre-processed data in the soft sensor parameter predictor 206.
- the plurality of soft sensed parameters is predicted based a soft sensed parameters prediction technique.
- the soft sensor parameters prediction technique comprises one of a physics-based models, a physics-based formulae and expressions and a data-driven models.
- Soft sensor prediction models for each plant are built using physics-based models such as heat and mass balance, population balance, force balance, etc., and machine learning, deep learning or statistical techniques such as response surface methodology (RSM) and stored in the soft sensor database. For each plant, the corresponding soft sensor prediction models are activated from soft-sensor database and soft-sensor parameters are predicted.
- the soft sensors are used to estimate a plurality of soft sensed parameters, as the direct use of physical sensors may not be possible in some particular applications or environments due to constraints such as access requirements, extreme operating conditions, disturbances in environment or limitations of the sensors. Examples of soft sensors include temperature in the firing zone of a furnace, concentration of product or byproducts inside a reactor, etc.
- a fault, a plurality of fault variables indicative of the fault and a fault contribution score for each of the fault variables from the plurality of fault variables is detected in the fault detector 208.
- the fault, the plurality of fault variables indicative of the fault and the fault contribution score is detected from the plurality of pre-processed data and the plurality of soft sensed parameters using a fault detection-localization technique.
- PCA principal component analysis
- CDC Complete Decomposition Contribution
- the PCA model first standardizes each sample of X by calculating the covariance matrix ( ⁇ ) of X as follows: cov x ⁇ X T . X n ⁇ 1
- T 2 values for all the data samples are calculated and samples with T 2 values exceeding the threshold of T 2 are detected as faulty samples.
- T 2 statistic follows the Chi 2 distribution.
- TH1 threshold of the T 2 statistic
- the value of Chi 2 corresponding to 95% significance is obtained from the distribution.
- Faulty_samples X i for which T i 2 ⁇ TH 1 , where i is the reference index for the data samples.
- CDC Complete Decomposition Contributions
- CDC determines the fault contribution score, wherein the fault contribution score is a contribution of each variable to the overall T 2 statistic, due its variance and covariance.
- CDC Contributions for each variable for all the detected faulty samples is calculated. For every data sample, individual contributions of all variables to T2 are calculated and variables for which the contribution exceeds the predefined threshold (TH2), i.e. (CDCs ⁇ TH2). Then, variables contributing to more than 5% of faulty data samples are selected as the faulty variables responsible for the fault.
- TH2 predefined threshold
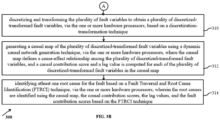
- the plurality of fault variables is discretized and transformed to obtain a plurality of discretized-transformed fault variables in the discretizer and transformer 210.
- the plurality of discretized-transformed fault variables is discretized and transformed based on a discretization-transformation technique.
- the discretization technique comprises of one of a equal width discretization, an equal frequency discretization, a k-means discretization, a maximum entropy discretization and a bayesian blocks discretization for time-series data.
- the transformation techniques comprise one of a windowing, an introduction of lags and a normalization.
- Discretization transforms continuous data into categorical data by dividing into finite set of intervals and assigns the specific value within each interval.
- windowing so as to use the temporal dependency of time-series data, input data is divided into a plurality of segments along the temporal dimension each having a fixed window length. The appropriate process and residence time lags are incorporated into one or more variables.
- a causal map of the plurality of discretized-transformed fault variables is generated using a dynamic causal network generation technique in the causal map generator 212.
- the causal map defines a cause-effect relationship among the plurality of discretized-transformed fault variables, and a causal contribution score and a lag value is computed for each of the plurality of discretized-transformed fault variables in the causal map.
- the dynamic causal map generation technique comprises one of a multivariate time delayed transfer entropy (MTDTE), a dynamic bayesian network, a bivariate time delayed transfer entropy, estimators and a granger causality.
- MTDTE multivariate time delayed transfer entropy
- dynamic bayesian network a dynamic bayesian network
- bivariate time delayed transfer entropy estimators and a granger causality.
- the estimators associated with these techniques comprises of a maximum likelihood estimator, a Bayesian estimator, a Gaussian estimator, a Kraskov estimator, a max-min hill climbing (MMHC) estimator, a max-min parent and children (MMPC) estimator and a structure estimator.
- MMHC max-min hill climbing
- MMPC max-min parent and children
- x i and y i represent the value of variables X and Y at time i.
- x i k xi , xi ⁇ 1,.., xi - k + 1]
- y i l yi , yi ⁇ 1 , ... , yi ⁇ l + 1 .
- Transfer entropy TE(X, Y) is given by the difference between the information entropy of x i+1 when both x i k and y i l are known and that when only x i k is known. It is to measure the decrease of x's future uncertainty under the condition that y is known. According to Eq. 6, if x and y are independent, then p(x,y) is equal to 0 and hence, transfer entropy TE(X,Y) will also be zero. If there is a strong correlation between x and y, then TE(X,Y) will be a large non-zero number. It is possible to measure causal relationships due to asymmetric form transfer entropy.
- TE X Y ⁇ x i + t , x i k ⁇ y i l p x i + t x i k , y i l log p x i + t x i k , y i l p x i + t x i k
- Eq.8 represents the multivariate time delayed transfer entropy (MTDTE).
- the probability density function (PDF) is estimated by a kernel estimator as shown in Eq. 9, which is nonparametric method to fit any shape of distribution.
- PDF probability density function
- n the number of samples
- c (4/3) 1/5 ⁇ 1.06 according to "normal reference rule-of-thumb" approach (Li et al, 2007).
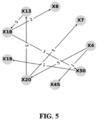
- a causal structure/map is a directed graph that represents cause-effect relations among the variables.
- Each node in the causal map is a variable while the edge between any two nodes represents the causal relationship and its direction between the two variables.
- MTDTE quantifies the information transfer or strength of causality along the edges.
- Fault Traversal and Root Cause Identification (FTRCI) algorithm is utilized for automatic identification of fault traversal paths and root cause variables (RCVs) in industrial processes including nonlinear processes without explicit specification of fault types.
- ⁇ argmax ⁇ ⁇ N ⁇ ⁇
- a plurality of leaf nodes is identified in the causal map for the detected fault.
- the leaf node is a node without any outgoing edges. However, in case of absence of leaf nodes in the causal map, then each non-root node will be considered as leaf node.
- the root node is a node without any incoming edges.
- a fault traversal pathway is obtained.
- the fault traversal pathway is obtained from each leaf node by iteratively selecting a next parent node from the causal map till one of:
- fault traversal pathway is obtained from each leaf node by iteratively selecting a next parent node from the causal map.
- the node ⁇ i (excluding the first node) in the pathway is inferred from the parent nodes of ⁇ i- 1 , thus traversing the reversed edge in the causal map.
- Parent node with highest transfer entropy is selected and added in the fault traversal path (Eq. 13).
- ⁇ i argmax ⁇ ⁇ Pr ⁇ i ⁇ 1 ⁇ ⁇
- a root cause is identified for each leaf node in the causal map.
- Each root cause and fault traversal pathway identified for all the leaf nodes are displayed to the user on the I/O interface(s) 106.
- the embodiments of present disclosure herein provide a solution to address a problem of for root cause identification of faults in manufacturing and process industries.
- RCI root cause identification
- the disclosure is a method and a system for root cause identification of faults based on causal maps.
- the root cause of fault is identified in several steps including: generation of casual maps using inputs received from a manufacturing and process industry and root cause identification from the causal maps based on a Fault Traversal and Root Cause Identification (FTRCI) technique.
- the FTRCI identifies root cause from the causal map by identifying a fault traversal pathway from leaf nodes in the causal map, wherein the fault traversal pathway is identified for even cyclic nodes.
- the device may also include means which could be e.g., hardware means like e.g., an application-specific integrated circuit (ASIC), a field-programmable gate array (FPGA), or a combination of hardware and software means, e.g., an ASIC and an FPGA, or at least one microprocessor and at least one memory with software processing components located therein.
- the means can include both hardware means and software means.
- the method embodiments described herein could be implemented in hardware and software.
- the device may also include software means. Alternatively, the embodiments may be implemented on different hardware devices, e.g., using a plurality of CPUs.
- the embodiments herein can comprise hardware and software elements.
- the embodiments that are implemented in software include but are not limited to, firmware, resident software, microcode, etc.
- the functions performed by various components described herein may be implemented in other components or combinations of other components.
- a computer-usable or computer readable medium can be any apparatus that can comprise, store, communicate, propagate, or transport the program for use by or in connection with the instruction execution system, apparatus, or device.
- a computer-readable storage medium refers to any type of physical memory on which information or data readable by a processor may be stored.
- a computer-readable storage medium may store instructions for execution by one or more processors, including instructions for causing the processor(s) to perform steps or stages consistent with the embodiments described herein.
- the term "computer-readable medium” should be understood to include tangible items and exclude carrier waves and transient signals, i.e., be non-transitory. Examples include random access memory (RAM), read-only memory (ROM), volatile memory, nonvolatile memory, hard drives, CD ROMs, DVDs, flash drives, disks, and any other known physical storage media.
Landscapes
- Engineering & Computer Science (AREA)
- Physics & Mathematics (AREA)
- Theoretical Computer Science (AREA)
- General Physics & Mathematics (AREA)
- Quality & Reliability (AREA)
- General Engineering & Computer Science (AREA)
- Automation & Control Theory (AREA)
- Health & Medical Sciences (AREA)
- Biomedical Technology (AREA)
- Mathematical Physics (AREA)
- Evolutionary Computation (AREA)
- Artificial Intelligence (AREA)
- Testing And Monitoring For Control Systems (AREA)
Claims (5)
- Prozessorimplementiertes Verfahren (300) zur Ursachenerkennung von Fehlern in der Fertigungs- und Prozessindustrie, umfassend:Empfangen einer Mehrzahl von Zeitreihendaten von einer Mehrzahl von Quellen über einen oder mehrere Hardwareprozessoren, wobei die Mehrzahl von Zeitreihendaten eine Mehrzahl von Echtzeitdaten und eine Mehrzahl von Nicht-Echtzeitdaten (302) umfasst; gekennzeichnet durchVorverarbeiten der Mehrzahl von Zeitreihendaten, um eine Mehrzahl von vorverarbeiteten Daten über den einen oder die mehreren Hardwareprozessoren zu erhalten, wobei die Mehrzahl von Zeitreihendaten unter Verwendung einer oder mehrerer aus einem Satz von einer Mehrzahl von Vorverarbeitungstechniken (304) vorverarbeitet wird, wobei der Satz von einer Mehrzahl von Vorverarbeitungstechniken eine Extremwertbegrenzung, einen einfachen gleitenden Mittelwert, einen exponentiellen gewichteten gleitenden Mittelwert, einen letzten vorwärtsgeführten Wert, lineare Interpolation und mehrfache Imputation durch verkettete Gleichungen, MICE, umfasst;Vorhersagen einer Mehrzahl von weichen erfassten Parametern unter Verwendung der Mehrzahl von vorverarbeiteten Daten über den einen oder die mehreren Hardwareprozessoren, wobei die Mehrzahl von weichen erfassten Parametern basierend auf einer Vorhersagetechnik für weiche erfasste Parameter (306) vorhergesagt wird, wobei die Mehrzahl von weichen erfassten Parametern Parameter sind, die unter Verwendung von weichen Sensoren vorhergesagt werden, und wobei die Vorhersagetechnik für weiche erfasste Parameter unter Verwendung eines physikbasierten Modells aufgebaut wird, das Wärme- und Massenbilanz, Populationsbilanz und Kraftbilanz und maschinelles Lernen, tiefes Lernen oder statistische Techniken einschließlich Reaktionsoberflächenmethodologie, RSM, umfasst;Erfassen einer Mehrzahl von Fehlervariablen, die den Fehler angeben, und einer Fehlerbeitragsbewertung für jede der Mehrzahl von Fehlervariablen an einem Fehler über den einen oder die mehreren Hardwareprozessoren aus der Mehrzahl von vorverarbeiteten Daten und der Mehrzahl von weichen erfassten Parametern unter Verwendung einer Fehlererfassungs-Lokalisierungstechnik (308), wobei die Fehlerbeitragsbewertung ein Beitrag jeder der Mehrzahl von Fehlervariablen zur Gesamtstatistik aufgrund von Varianz und Kovarianz ist und wobei die Fehlererfassungs-Lokalisierungstechnik eine von einer statistischen und maschinellen Lerntechnik umfasst, die eine Hauptkomponentenanalyse, PCA, eine Mahalanobis-Distanz, einen lokalen Ausreißerfaktor, einen Isolationswald, eine elliptische Hüllkurve, eine Einklassen-Unterstützungsvektormaschine, K-nächste Nachbarn und eine Deep-Learning-Technik umfasst, die ein mehrschichtiges Perzeptron, einen Autoencoder, AEs, einschließlich eines Long-Short-Term-Memory-Autoencoders, LSTM-AE, Zellen, einen dichten Autoencoder, Dense-AE, und einen Faltungsneuralennetzwerk-Autoencoder, CNN-AE, umfasst;Diskretisieren der Mehrzahl von Fehlervariablen, um eine Mehrzahl von diskretisiert transformierten Fehlervariablen zu erhalten, über den einen oder die mehreren Hardwareprozessoren basierend auf einer Diskretisierungs-Transformationstechnik (310), wobei die Diskretisierung kontinuierliche Daten in kategoriale Daten durch Unterteilen in einen endlichen Satz von Intervallen transformiert und einen spezifischen Wert innerhalb jedes des endlichen Satzes von Intervallen zuweist und wobei die Diskretisierungs-Transformationstechnik eine von einer Diskretisierung gleicher Breite, einer Diskretisierung gleicher Frequenz, einer Diskretisierung maximaler Entropie und einer Bayesschen Blockdiskretisierung für Zeitreihendaten umfasst;Erzeugen einer kausalen Karte der Mehrzahl von diskretisiert transformierten Fehlervariablen unter Verwendung einer dynamischen kausalen Netzwerkerzeugungstechnik über den einen oder die mehreren Hardwareprozessoren, wobei die kausale Karte eine Ursache-Wirkungs-Beziehung unter der Mehrzahl von diskretisiert transformierten Fehlervariablen darstellt und eine kausale Beitragsbewertung und ein Verzögerungswert für jede der Mehrzahl von diskretisiert transformierten Fehlervariablen in der kausalen Karte (312) berechnet wird, wobei jeder Knoten in der kausalen Karte eine Variable ist, während eine Kante zwischen zwei Knoten eine kausale Beziehung und Richtung zwischen zwei Variablen darstellt, wobei der Verzögerungswert eine Zeitverzögerung zwischen variablen Interaktionen ist, wobei die kausale Beitragsbewertung eine Transferentropie ist, die einen Informationstransfer oder eine Stärke der Kausalität entlang Kanten in der kausalen Karte quantifiziert, und wobei die dynamischen kausalen Kartenerzeugungstechniken eine von einer multivariaten zeitverzögerten Transferentropie, MTDTE, einer dynamischen bayesschen Netzwerktechnik, einer bivariaten zeitverzögerten Transferentropietechnik und einer Granger-Kausalitätstechnik umfassen; und
Identifizieren mindestens einer Grundursache für den Fehler basierend auf einer Fehlertraversierungs- und Grundursachenidentifikations-, FTRCI, Technik über den einen oder die mehreren Hardwareprozessoren, wobei die Grundursachen unter Verwendung der kausalen Karte, der kausalen Beitragsbewertungen, der Verzögerungswerte und der Fehlerbeitragsbewertungen basierend auf der FTRCI-Technik (314) identifiziert werden, wobei die FTRCI-Technik zur Identifizierung mindestens einer Grundursache (400) für den Fehler Folgendes umfasst: Identifizieren einer Mehrzahl von Blattknoten in der kausalen Karte für den erkannten Fehler, wobei der Blattknoten ein Knoten ohne irgendwelche abgehenden Kanten (402) ist; Erhalten eines Fehlertraversierungspfads (404) von jedem Blattknoten durch iteratives Auswählen eines nächsten Elternknoten aus der kausalen Karte bis zu einem von: (a) Erreichen eines Wurzelknotens oder (b) Erkennen einer kausalen Schleife, wobei der Wurzelknoten ein Knoten ohne irgendwelche eingehenden Kanten ist und die kausale Schleife erkannt wird, wenn ein nächster Elternknoten bereits in dem Fehlertraversierungspfad vorhanden ist; und Identifizieren einer Grundursachenvariablen in dem Fehlertraversierungspfad (406), wobei die Grundursachenvariable die Grundursache angibt, wobei die Identifizierung der Grundursachenvariablen Folgendes umfasst: (a) für den Fehlertraversierungspfad, der beim Erreichen eines Wurzelknotens erhalten wird: der Wurzelknoten wird als die Grundursachenvariable identifiziert, oder (b) für den Fehlertraversierungspfad, der beim Erkennen einer kausalen Schleife erhalten wird: die Grundursachenvariable wird basierend auf dem Verzögerungswert der Mehrzahl von diskretisiert transformierten Fehlervariablen in der kausalen Schleife der kausalen Karte identifiziert. - Prozessorimplementiertes Verfahren nach Anspruch 1, wobei die Mehrzahl von Quellen, die der Fertigungs- und Prozessindustrie zugeordnet sind, eine Sensordatenbank, eine Labordatenbank, eine Umgebungsdatenbank und eine Wartungsdatenbank umfasst.
- System (100), umfassend:einen Speicher (102), der Anweisungen speichert;eine oder mehrere Kommunikationsschnittstellen (106); undeinen oder mehrere Hardwareprozessoren (104), die über die eine oder die mehreren Kommunikationsschnittstellen (106) mit dem Speicher (102) gekoppelt sind, wobei der eine oder die mehreren Hardwareprozessoren (104) durch die Anweisungen konfiguriert sind zum:Empfangen einer Mehrzahl von Zeitreihendaten von einer Mehrzahl von Quellen über einen oder mehrere Hardwareprozessoren, wobei die Mehrzahl von Zeitreihendaten eine Mehrzahl von Echtzeitdaten und eine Mehrzahl von Nicht-Echtzeitdaten umfasst; gekennzeichnet durchVorverarbeiten der Mehrzahl von Zeitreihendaten, um eine Mehrzahl von vorverarbeiteten Daten über den einen oder die mehreren Hardwareprozessoren zu erhalten, wobei die Mehrzahl von Zeitreihendaten unter Verwendung einer oder mehrerer aus einem Satz von einer Mehrzahl von Vorverarbeitungstechniken vorverarbeitet wird, wobei der Satz von einer Mehrzahl von Vorverarbeitungstechniken eine Extremwertbegrenzung, einen einfachen gleitenden Mittelwert, einen exponentiellen gewichteten gleitenden Mittelwert, einen letzten vorwärtsgeführten Wert, lineare Interpolation und mehrfache Imputation durch verkettete Gleichungen, MICE, umfasst;Vorhersagen einer Mehrzahl von weichen erfassten Parametern unter Verwendung der Mehrzahl von vorverarbeiteten Daten über den einen oder die mehreren Hardwareprozessoren, wobei die Mehrzahl von weichen erfassten Parametern basierend auf einer Vorhersagetechnik für weiche erfasste Parameter vorhergesagt wird, wobei die Mehrzahl von weichen erfassten Parametern Parameter sind, die unter Verwendung von weichen Sensoren vorhergesagt werden, und wobei die Vorhersagetechnik für weiche erfasste Parameter unter Verwendung eines physikbasierten Modells aufgebaut wird, das Wärme- und Massenbilanz, Populationsbilanz und Kraftbilanz und maschinelles Lernen, tiefes Lernen oder statistische Techniken einschließlich Reaktionsoberflächenmethodologie, RSM, umfasst;Detektieren eines Fehlers, einer Mehrzahl von Fehlervariablen, die den Fehler angeben, und einer Fehlerbeitragsbewertung für jede der Mehrzahl von Fehlervariablen über den einen oder die mehreren Hardwareprozessoren aus der Mehrzahl von vorverarbeiteten Daten und der Mehrzahl von weichen erfassten Parametern unter Verwendung einer Fehlerdetektions-Lokalisierungstechnik, wobei die Fehlerbeitragsbewertung ein Beitrag jeder der Mehrzahl von Fehlervariablen zu Gesamtstatistik aufgrund von Varianz und Kovarianz ist und wobei die Fehlerdetektions-Lokalisierungstechnik eine von einer statistischen und maschinellen Lerntechnik umfasst, die eine Hauptkomponentenanalyse, PCA, eine Mahalanobis-Distanz, einen lokalen Ausreißerfaktor, einen Isolationswald, eine elliptische Hüllkurve, eine Einklassen-Unterstützungsvektormaschine, K-nächste Nachbarn und eine tiefe Lerntechnik umfasst, die ein mehrschichtiges Perzeptron, einen Autoencoder, AEs, einschließlich eines Long-Short-Term-Memory-Autoencoders, LSTM-AE, Zellen, einen dichten Autoencoder, Dense-AE, und einen Convolutions-Neural-Network-Autoencoder, CNN-AE, umfasst;Diskretisieren der Mehrzahl von Fehlervariablen, um eine Mehrzahl von diskretisiert transformierten Fehlervariablen zu erhalten, über den einen oder die mehreren Hardwareprozessoren basierend auf einer Diskretisierungs-Transformationstechnik, wobei die Diskretisierung kontinuierliche Daten in kategoriale Daten durch Unterteilen in einen endlichen Satz von Intervallen transformiert und einen spezifischen Wert innerhalb jedes des endlichen Satzes von Intervallen zuweist und wobei die Diskretisierungs-Transformationstechnik eine von einer Diskretisierung gleicher Breite, einer Diskretisierung gleicher Frequenz, einer Diskretisierung maximaler Entropie und einer Bayesschen Blockdiskretisierung für Zeitreihendaten umfasst;Erzeugen einer kausalen Karte der Mehrzahl von diskretisiert transformierten Fehlervariablen unter Verwendung einer dynamischen kausalen Netzwerkerzeugungstechnik über den einen oder die mehreren Hardwareprozessoren, wobei die kausale Karte eine Ursache-Wirkungs-Beziehung unter der Mehrzahl von diskretisiert transformierten Fehlervariablen darstellt und eine kausale Beitragsbewertung und ein Verzögerungswert für jede der Mehrzahl von diskretisiert transformierten Fehlervariablen in der kausalen Karte berechnet werden, wobei jeder Knoten in der kausalen Karte eine Variable ist, während eine Kante zwischen zwei Knoten kausale Beziehung und Richtung zwischen zwei Variablen darstellt, wobei der Verzögerungswert eine Zeitverzögerung zwischen variablen Interaktionen ist, wobei die kausale Beitragsbewertung eine Transferentropie ist, die Informationstransfer oder Stärke der Kausalität entlang Kanten in der kausalen Karte quantifiziert und wobei die dynamischen kausalen Kartenerzeugungstechniken eine von einer multivariaten zeitverzögerten Transferentropie, MTDTE, einer dynamischen bayesschen Netzwerktechnik, einer bivariaten zeitverzögerten Transferentropietechnik und einer Granger-Kausalitätstechnik umfassen; undIdentifizieren mindestens einer Ursache für den Fehler basierend auf einer Fehlertraversierungs- und Ursachenerkennungs-, FTRCI, Technik über den einen oder die mehreren Hardwareprozessoren, wobei die Ursachen unter Verwendung der kausalen Karte, der kausalen Beitragsbewertungen, der Verzögerungswerte und der Fehlerbeitragsbewertungen basierend auf der FTRCI-Technik identifiziert werden, wobei die FTRCI-Technik zur Identifizierung mindestens einer Ursache (400) für den Fehler umfasst:Identifizieren einer Mehrzahl von Blattknoten in der kausalen Karte für den erkannten Fehler, wobei der Blattknoten ein Knoten ohne abgehende Kanten (402) ist;Erhalten eines Fehlertraversierungspfads (404) von jedem Blattknoten durch iteratives Auswählen eines nächsten Elternknotens aus der kausalen Karte bis zu einem von:(a) Erreichen eines Wurzelknotens oder(b) Erkennen einer kausalen Schleife, wobei der Wurzelknoten ein Knoten ohne eingehende Kanten ist und die kausale Schleife erkannt wird, wenn ein nächster Elternknoten bereits in dem Fehlertraversierungspfad vorhanden ist; undIdentifizieren einer Ursachenvariablen in dem Fehlertraversierungspfad (406), wobei die Ursachenvariable die Ursache angibt, wobei die Identifizierung der Ursachenvariablen umfasst:(a) für den Fehlertraversierungspfad, der beim Erreichen eines Wurzelknotens erhalten wird: der Wurzelknoten wird als die Ursachenvariable identifiziert, oder(b) für den Fehlertraversierungspfad, der beim Erkennen einer kausalen Schleife erhalten wird: die Ursachenvariable wird basierend auf dem Verzögerungswert der Mehrzahl von diskretisiert transformierten Fehlervariablen in der kausalen Schleife der kausalen Karte identifiziert.
- Computerprogrammprodukt, umfassend ein nichtflüchtiges computerlesbares Medium mit einem darin verkörperten computerlesbaren Programm, wobei das computerlesbare Programm, wenn es auf einer Rechenvorrichtung ausgeführt wird, die Rechenvorrichtung veranlasst zum:Empfangen einer Mehrzahl von Zeitreihendaten von einer Mehrzahl von Quellen über einen oder mehrere Hardwareprozessoren, wobei die Mehrzahl von Zeitreihendaten eine Mehrzahl von Echtzeitdaten und eine Mehrzahl von Nicht-Echtzeitdaten umfasst; gekennzeichnet durchVorverarbeiten der Mehrzahl von Zeitreihendaten, um eine Mehrzahl von vorverarbeiteten Daten über den einen oder die mehreren Hardwareprozessoren zu erhalten, wobei die Mehrzahl von Zeitreihendaten unter Verwendung einer oder mehrerer aus einem Satz von einer Mehrzahl von Vorverarbeitungstechniken vorverarbeitet wird, wobei der Satz von einer Mehrzahl von Vorverarbeitungstechniken eine Extremwertbegrenzung, einen einfachen gleitenden Mittelwert, einen exponentiellen gewichteten gleitenden Mittelwert, einen letzten vorwärtsgeführten Wert, lineare Interpolation und mehrfache Imputation durch verkettete Gleichungen, MICE, umfasst;Vorhersagen einer Mehrzahl von weichen erfassten Parametern unter Verwendung der Mehrzahl von vorverarbeiteten Daten über den einen oder die mehreren Hardwareprozessoren, wobei die Mehrzahl von weichen erfassten Parametern basierend auf einer Vorhersagetechnik für weiche erfasste Parameter vorhergesagt wird, wobei die Mehrzahl von weichen erfassten Parametern Parameter sind, die unter Verwendung von weichen Sensoren vorhergesagt werden, und wobei die Vorhersagetechnik für weiche erfasste Parameter unter Verwendung eines physikbasierten Modells aufgebaut wird, das Wärme- und Massenbilanz, Populationsbilanz und Kraftbilanz und maschinelles Lernen, tiefes Lernen oder statistische Techniken einschließlich Reaktionsoberflächenmethodologie, RSM, umfasst;Erfassen einer Mehrzahl von Fehlervariablen, die den Fehler angeben, und einer Fehlerbeitragsbewertung für jede der Mehrzahl von Fehlervariablen an einem Fehler über den einen oder die mehreren Hardwareprozessoren aus der Mehrzahl von vorverarbeiteten Daten und der Mehrzahl von weichen erfassten Parametern unter Verwendung einer Fehlererfassungs-Lokalisierungstechnik, wobei die Fehlerbeitragsbewertung ein Beitrag jeder der Mehrzahl von Fehlervariablen zur Gesamtstatistik aufgrund von Varianz und Kovarianz ist und wobei die Fehlererfassungs-Lokalisierungstechnik eine von einer statistischen und maschinellen Lerntechnik umfasst, die eine Hauptkomponentenanalyse, PCA, eine Mahalanobis-Distanz, einen lokalen Ausreißerfaktor, einen Isolationswald, eine elliptische Hüllkurve, eine Einklassen-Unterstützungsvektormaschine, K-nächste Nachbarn und eine tiefe Lerntechnik umfasst, die ein mehrschichtiges Perzeptron, einen Autoencoder, AEs, einschließlich eines Long-Short-Term-Memory-Autoencoders, LSTM-AE, Zellen, einen dichten Autoencoder, Dense-AE, und einen Convolutions-Neural-Network-Autoencoder, CNN-AE, umfasst;Diskretisieren der Mehrzahl von Fehlervariablen, um eine Mehrzahl von diskretisiert transformierten Fehlervariablen zu erhalten, über den einen oder die mehreren Hardwareprozessoren basierend auf einer Diskretisierungs-Transformationstechnik, wobei die Diskretisierung kontinuierliche Daten in kategoriale Daten durch Unterteilen in einen endlichen Satz von Intervallen transformiert und einen spezifischen Wert innerhalb jedes des endlichen Satzes von Intervallen zuweist und wobei die Diskretisierungs-Transformationstechnik eine von einer Diskretisierung gleicher Breite, einer Diskretisierung gleicher Frequenz, einer Diskretisierung maximaler Entropie und einer Bayesschen Blockdiskretisierung für Zeitreihendaten umfasst;Erzeugen einer kausalen Karte der Mehrzahl von diskretisiert transformierten Fehlervariablen unter Verwendung einer dynamischen kausalen Netzwerkerzeugungstechnik über den einen oder die mehreren Hardwareprozessoren, wobei die kausale Karte eine Ursache-Wirkungs-Beziehung unter der Mehrzahl von diskretisiert transformierten Fehlervariablen darstellt und eine kausale Beitragsbewertung und ein Verzögerungswert für jede der Mehrzahl von diskretisiert transformierten Fehlervariablen in der kausalen Karte berechnet werden, wobei jeder Knoten in der kausalen Karte eine Variable ist, während eine Kante zwischen zwei Knoten eine kausale Beziehung und Richtung zwischen zwei Variablen darstellt, wobei der Verzögerungswert eine Zeitverzögerung zwischen variablen Interaktionen ist, wobei die kausale Beitragsbewertung eine Transferentropie ist, die einen Informationstransfer oder eine Stärke der Kausalität entlang Kanten in der kausalen Karte quantifiziert, und wobei die dynamischen kausalen Kartenerzeugungstechniken eine von einer multivariaten zeitverzögerten Transferentropie, MTDTE, einer dynamischen bayesschen Netzwerktechnik, einer bivariaten zeitverzögerten Transferentropietechnik und einer Granger-Kausalitätstechnik umfassen; undIdentifizieren mindestens einer Ursache für den Fehler basierend auf einer Fehlertraversierungs- und Ursachenerkennungs-, FTRCI, Technik über den einen oder die mehreren Hardwareprozessoren, wobei die Ursachen unter Verwendung der kausalen Karte, der kausalen Beitragsbewertungen, der Verzögerungswerte und der Fehlerbeitragsbewertungen basierend auf der FTRCI-Technik identifiziert werden, wobei die FTRCI-Technik zur Identifizierung mindestens einer Ursache (400) für den Fehler umfasst:Identifizieren einer Mehrzahl von Blattknoten in der kausalen Karte für den erkannten Fehler, wobei der Blattknoten ein Knoten ohne abgehende Kanten (402) ist;Erhalten eines Fehlertraversierungspfads (404) von jedem Blattknoten durch iteratives Auswählen eines nächsten Elternknotens aus der kausalen Karte bis zu einem von:(a) Erreichen eines Wurzelknotens oder(b) Erkennen einer kausalen Schleife, wobei der Wurzelknoten ein Knoten ohne eingehende Kanten ist und die kausale Schleife erkannt wird, wenn ein nächster Elternknoten bereits in dem Fehlertraversierungspfad vorhanden ist; undIdentifizieren einer Ursachenvariablen in dem Fehlertraversierungspfad (406), wobei die Ursachenvariable die Ursache angibt, wobei die Identifizierung der Ursachenvariablen umfasst:(a) für den Fehlertraversierungspfad, der beim Erreichen eines Wurzelknotens erhalten wird: der Wurzelknoten wird als die Ursachenvariable identifiziert, oder(b) für den Fehlertraversierungspfad, der beim Erkennen einer kausalen Schleife erhalten wird: die Ursachenvariable wird basierend auf dem Verzögerungswert der Mehrzahl von diskretisiert transformierten Fehlervariablen in der kausalen Schleife der kausalen Karte identifiziert.
- Prozessorimplementiertes Verfahren nach Anspruch 1, wobeidie Fehlerbeitragsbewertung als eine Summierung des Beitrags jeder der Mehrzahl von Fehlervariablen unter Verwendung einer Gleichung berechnet wird:
 wobei Xi ein Eingangsvektor ist, I eine Identitätsmatrix ist, Pc eine Anzahl von Hauptkomponenten ist und ∑ eine Kovarianzmatrix ist und T2 die Fehlerbeitragsbewertung ist.
Applications Claiming Priority (1)
| Application Number | Priority Date | Filing Date | Title |
|---|---|---|---|
| IN202221008695 | 2022-02-18 |
Publications (3)
| Publication Number | Publication Date |
|---|---|
| EP4231108A1 EP4231108A1 (de) | 2023-08-23 |
| EP4231108C0 EP4231108C0 (de) | 2025-04-16 |
| EP4231108B1 true EP4231108B1 (de) | 2025-04-16 |
Family
ID=82742614
Family Applications (1)
| Application Number | Title | Priority Date | Filing Date |
|---|---|---|---|
| EP22186877.1A Active EP4231108B1 (de) | 2022-02-18 | 2022-07-26 | Verfahren und system zur ursachenerkennung von fehlern in der fertigungs- und verfahrensindustrie |
Country Status (2)
| Country | Link |
|---|---|
| US (1) | US12026047B2 (de) |
| EP (1) | EP4231108B1 (de) |
Families Citing this family (6)
| Publication number | Priority date | Publication date | Assignee | Title |
|---|---|---|---|---|
| CN114820225B (zh) * | 2022-06-28 | 2022-09-13 | 成都秦川物联网科技股份有限公司 | 基于关键词识别和处理制造问题的工业物联网及控制方法 |
| KR20240083695A (ko) * | 2022-12-05 | 2024-06-12 | 세메스 주식회사 | 심층 학습 기반 분석 시스템 및 그의 동작 방법 |
| CN117056819A (zh) * | 2023-08-31 | 2023-11-14 | 国网湖南省电力有限公司 | 多融合智慧电站故障溯源方法、系统、设备及介质 |
| CN117574244B (zh) * | 2024-01-15 | 2024-04-02 | 成都秦川物联网科技股份有限公司 | 基于物联网的超声波水表故障预测方法、装置及设备 |
| CN120046084B (zh) * | 2025-04-24 | 2025-08-22 | 深圳市川世达科技有限公司 | 一种半导体检测设备的智能标定方法及系统 |
| CN120315292B (zh) * | 2025-06-16 | 2025-09-19 | 诺文科风机(北京)有限公司 | 深井多级智能通风控制方法及系统 |
Family Cites Families (10)
| Publication number | Priority date | Publication date | Assignee | Title |
|---|---|---|---|---|
| CN116300561A (zh) * | 2015-12-08 | 2023-06-23 | 赛特玛逊有限公司 | 用于监测制造的系统,计算机可读存储介质和方法 |
| US20190318288A1 (en) * | 2016-07-07 | 2019-10-17 | Aspen Technology, Inc. | Computer Systems And Methods For Performing Root Cause Analysis And Building A Predictive Model For Rare Event Occurrences In Plant-Wide Operations |
| US10496468B2 (en) * | 2018-01-21 | 2019-12-03 | EMC IP Holding Company LLC | Root cause analysis for protection storage devices using causal graphs |
| CN109359662B (zh) | 2018-08-20 | 2021-08-31 | 浙江大学 | 面向百万千瓦超超临界机组的非平稳分析与因果诊断方法 |
| US11354184B2 (en) * | 2019-06-21 | 2022-06-07 | Palo Alto Research Center Incorporated | Method and system for performing automated root cause analysis of anomaly events in high-dimensional sensor data |
| EP4034952A4 (de) * | 2019-09-27 | 2023-10-25 | Tata Consultancy Services Limited | Verfahren und system zur erkennung und analyse von regimeänderungen |
| US11314577B2 (en) * | 2020-08-03 | 2022-04-26 | Palo Alto Research Center Incorporated | System and method for constructing fault-augmented system model for root cause analysis of faults in manufacturing systems |
| JP7603807B2 (ja) * | 2020-10-30 | 2024-12-20 | ヒタチ ヴァンタラ エルエルシー | ラベルなしセンサデータを用いた産業システム内の稀な障害の自動化されたリアルタイムの検出、予測、及び予防に関する、方法または非一時的コンピュータ可読媒体 |
| CN113110402B (zh) | 2021-05-24 | 2022-04-01 | 浙江大学 | 知识与数据驱动的大规模工业系统分布式状态监测方法 |
| CN113656906B (zh) | 2021-07-29 | 2023-10-03 | 浙江大学 | 一种面向燃气轮机的非平稳多变量因果关系分析方法 |
-
2022
- 2022-07-26 EP EP22186877.1A patent/EP4231108B1/de active Active
- 2022-07-28 US US17/815,605 patent/US12026047B2/en active Active
Also Published As
| Publication number | Publication date |
|---|---|
| US20230267028A1 (en) | 2023-08-24 |
| EP4231108C0 (de) | 2025-04-16 |
| US12026047B2 (en) | 2024-07-02 |
| EP4231108A1 (de) | 2023-08-23 |
Similar Documents
| Publication | Publication Date | Title |
|---|---|---|
| EP4231108B1 (de) | Verfahren und system zur ursachenerkennung von fehlern in der fertigungs- und verfahrensindustrie | |
| US10600005B2 (en) | System for automatic, simultaneous feature selection and hyperparameter tuning for a machine learning model | |
| EP4310618B1 (de) | Verfahren und system zur identifizierung von kausaler inferenz und grundursachen in industriellen prozessen | |
| Verron et al. | Fault detection and identification with a new feature selection based on mutual information | |
| US10013303B2 (en) | Detecting anomalies in an internet of things network | |
| Zhang et al. | Sliding window-based fault detection from high-dimensional data streams | |
| US20200285997A1 (en) | Near real-time detection and classification of machine anomalies using machine learning and artificial intelligence | |
| US20210334656A1 (en) | Computer-implemented method, computer program product and system for anomaly detection and/or predictive maintenance | |
| US12181866B2 (en) | Systems and methods for predicting manufacturing process risks | |
| Wang et al. | Process fault detection using time‐explicit Kiviat diagrams | |
| Amin et al. | Dynamic process safety assessment using adaptive Bayesian network with loss function | |
| US12430401B2 (en) | System for automatic error estimate correction for a machine learning model | |
| JP2025529889A (ja) | 時系列データに基づくアセット階層における機械学習モデルドリフトのリアルタイム検出、予測及び修復 | |
| Li et al. | Comparison of deep learning models for predictive maintenance in industrial manufacturing systems using sensor data | |
| Birihanu et al. | Explainable correlation-based anomaly detection for Industrial Control Systems | |
| Heyden et al. | Adaptive Bernstein change detector for high-dimensional data streams | |
| Lee et al. | Discovery of fault-introducing tool groups with a numerical association rule mining method in a printed circuit board production line | |
| Wang et al. | A robustness evaluation of concept drift detectors against unreliable data streams | |
| Yu | Hard disk drive failure prediction challenges in machine learning for multi-variate time series | |
| Esmaeeli et al. | Monitoring two-stage processes with a profile at the second stage | |
| US11754985B2 (en) | Information processing apparatus, information processing method and computer program product | |
| Benhamza et al. | Hybrid analytic method for missing data imputation in medical big data | |
| Daoudi et al. | Predictive maintenance system for screw compressors using machine learning: a comparative study | |
| Peruzzo et al. | Pattern-based feature extraction for fault detection in quality relevant process control | |
| Wang et al. | BOSTON‐PUPA: A Bayesian Online Spatio‐Temporal Outbreak Detection Framework With Prior Updating and p‐Value Adaptation |
Legal Events
| Date | Code | Title | Description |
|---|---|---|---|
| PUAI | Public reference made under article 153(3) epc to a published international application that has entered the european phase |
Free format text: ORIGINAL CODE: 0009012 |
|
| STAA | Information on the status of an ep patent application or granted ep patent |
Free format text: STATUS: THE APPLICATION HAS BEEN PUBLISHED |
|
| AK | Designated contracting states |
Kind code of ref document: A1 Designated state(s): AL AT BE BG CH CY CZ DE DK EE ES FI FR GB GR HR HU IE IS IT LI LT LU LV MC MK MT NL NO PL PT RO RS SE SI SK SM TR |
|
| STAA | Information on the status of an ep patent application or granted ep patent |
Free format text: STATUS: REQUEST FOR EXAMINATION WAS MADE |
|
| 17P | Request for examination filed |
Effective date: 20231024 |
|
| RBV | Designated contracting states (corrected) |
Designated state(s): AL AT BE BG CH CY CZ DE DK EE ES FI FR GB GR HR HU IE IS IT LI LT LU LV MC MK MT NL NO PL PT RO RS SE SI SK SM TR |
|
| GRAP | Despatch of communication of intention to grant a patent |
Free format text: ORIGINAL CODE: EPIDOSNIGR1 |
|
| STAA | Information on the status of an ep patent application or granted ep patent |
Free format text: STATUS: GRANT OF PATENT IS INTENDED |
|
| INTG | Intention to grant announced |
Effective date: 20241217 |
|
| GRAS | Grant fee paid |
Free format text: ORIGINAL CODE: EPIDOSNIGR3 |
|
| GRAA | (expected) grant |
Free format text: ORIGINAL CODE: 0009210 |
|
| STAA | Information on the status of an ep patent application or granted ep patent |
Free format text: STATUS: THE PATENT HAS BEEN GRANTED |
|
| AK | Designated contracting states |
Kind code of ref document: B1 Designated state(s): AL AT BE BG CH CY CZ DE DK EE ES FI FR GB GR HR HU IE IS IT LI LT LU LV MC MK MT NL NO PL PT RO RS SE SI SK SM TR |
|
| REG | Reference to a national code |
Ref country code: GB Ref legal event code: FG4D |
|
| REG | Reference to a national code |
Ref country code: CH Ref legal event code: EP |
|
| REG | Reference to a national code |
Ref country code: IE Ref legal event code: FG4D |
|
| U01 | Request for unitary effect filed |
Effective date: 20250416 |
|
| U07 | Unitary effect registered |
Designated state(s): AT BE BG DE DK EE FI FR IT LT LU LV MT NL PT RO SE SI Effective date: 20250424 |
|
| U20 | Renewal fee for the european patent with unitary effect paid |
Year of fee payment: 4 Effective date: 20250725 |
|
| PG25 | Lapsed in a contracting state [announced via postgrant information from national office to epo] |
Ref country code: ES Free format text: LAPSE BECAUSE OF FAILURE TO SUBMIT A TRANSLATION OF THE DESCRIPTION OR TO PAY THE FEE WITHIN THE PRESCRIBED TIME-LIMIT Effective date: 20250416 |
|
| PG25 | Lapsed in a contracting state [announced via postgrant information from national office to epo] |
Ref country code: NO Free format text: LAPSE BECAUSE OF FAILURE TO SUBMIT A TRANSLATION OF THE DESCRIPTION OR TO PAY THE FEE WITHIN THE PRESCRIBED TIME-LIMIT Effective date: 20250716 Ref country code: GR Free format text: LAPSE BECAUSE OF FAILURE TO SUBMIT A TRANSLATION OF THE DESCRIPTION OR TO PAY THE FEE WITHIN THE PRESCRIBED TIME-LIMIT Effective date: 20250717 |
|
| PG25 | Lapsed in a contracting state [announced via postgrant information from national office to epo] |
Ref country code: PL Free format text: LAPSE BECAUSE OF FAILURE TO SUBMIT A TRANSLATION OF THE DESCRIPTION OR TO PAY THE FEE WITHIN THE PRESCRIBED TIME-LIMIT Effective date: 20250416 |
|
| PG25 | Lapsed in a contracting state [announced via postgrant information from national office to epo] |
Ref country code: HR Free format text: LAPSE BECAUSE OF FAILURE TO SUBMIT A TRANSLATION OF THE DESCRIPTION OR TO PAY THE FEE WITHIN THE PRESCRIBED TIME-LIMIT Effective date: 20250416 |
|
| PGFP | Annual fee paid to national office [announced via postgrant information from national office to epo] |
Ref country code: CH Payment date: 20250801 Year of fee payment: 4 |
|
| PG25 | Lapsed in a contracting state [announced via postgrant information from national office to epo] |
Ref country code: RS Free format text: LAPSE BECAUSE OF FAILURE TO SUBMIT A TRANSLATION OF THE DESCRIPTION OR TO PAY THE FEE WITHIN THE PRESCRIBED TIME-LIMIT Effective date: 20250716 |
|
| PG25 | Lapsed in a contracting state [announced via postgrant information from national office to epo] |
Ref country code: IS Free format text: LAPSE BECAUSE OF FAILURE TO SUBMIT A TRANSLATION OF THE DESCRIPTION OR TO PAY THE FEE WITHIN THE PRESCRIBED TIME-LIMIT Effective date: 20250816 |