EP4227751A1 - Monitoring apparatus - Google Patents
Monitoring apparatus Download PDFInfo
- Publication number
- EP4227751A1 EP4227751A1 EP23153588.1A EP23153588A EP4227751A1 EP 4227751 A1 EP4227751 A1 EP 4227751A1 EP 23153588 A EP23153588 A EP 23153588A EP 4227751 A1 EP4227751 A1 EP 4227751A1
- Authority
- EP
- European Patent Office
- Prior art keywords
- motor
- monitoring apparatus
- calculator
- trigger
- frequency
- Prior art date
- Legal status (The legal status is an assumption and is not a legal conclusion. Google has not performed a legal analysis and makes no representation as to the accuracy of the status listed.)
- Withdrawn
Links
Images












Classifications
-
- G—PHYSICS
- G05—CONTROLLING; REGULATING
- G05B—CONTROL OR REGULATING SYSTEMS IN GENERAL; FUNCTIONAL ELEMENTS OF SUCH SYSTEMS; MONITORING OR TESTING ARRANGEMENTS FOR SUCH SYSTEMS OR ELEMENTS
- G05B23/00—Testing or monitoring of control systems or parts thereof
- G05B23/02—Electric testing or monitoring
- G05B23/0205—Electric testing or monitoring by means of a monitoring system capable of detecting and responding to faults
- G05B23/0208—Electric testing or monitoring by means of a monitoring system capable of detecting and responding to faults characterized by the configuration of the monitoring system
- G05B23/021—Electric testing or monitoring by means of a monitoring system capable of detecting and responding to faults characterized by the configuration of the monitoring system adopting a different treatment of each operating region or a different mode of the monitored system, e.g. transient modes; different operating configurations of monitored system
-
- G—PHYSICS
- G01—MEASURING; TESTING
- G01R—MEASURING ELECTRIC VARIABLES; MEASURING MAGNETIC VARIABLES
- G01R31/00—Arrangements for testing electric properties; Arrangements for locating electric faults; Arrangements for electrical testing characterised by what is being tested not provided for elsewhere
- G01R31/34—Testing dynamo-electric machines
- G01R31/343—Testing dynamo-electric machines in operation
-
- G—PHYSICS
- G01—MEASURING; TESTING
- G01D—MEASURING NOT SPECIALLY ADAPTED FOR A SPECIFIC VARIABLE; ARRANGEMENTS FOR MEASURING TWO OR MORE VARIABLES NOT COVERED IN A SINGLE OTHER SUBCLASS; TARIFF METERING APPARATUS; MEASURING OR TESTING NOT OTHERWISE PROVIDED FOR
- G01D21/00—Measuring or testing not otherwise provided for
- G01D21/02—Measuring two or more variables by means not covered by a single other subclass
-
- G—PHYSICS
- G06—COMPUTING OR CALCULATING; COUNTING
- G06F—ELECTRIC DIGITAL DATA PROCESSING
- G06F17/00—Digital computing or data processing equipment or methods, specially adapted for specific functions
- G06F17/10—Complex mathematical operations
-
- G—PHYSICS
- G05—CONTROLLING; REGULATING
- G05B—CONTROL OR REGULATING SYSTEMS IN GENERAL; FUNCTIONAL ELEMENTS OF SUCH SYSTEMS; MONITORING OR TESTING ARRANGEMENTS FOR SUCH SYSTEMS OR ELEMENTS
- G05B19/00—Program-control systems
- G05B19/02—Program-control systems electric
- G05B19/04—Program control other than numerical control, i.e. in sequence controllers or logic controllers
- G05B19/05—Programmable logic controllers, e.g. simulating logic interconnections of signals according to ladder diagrams or function charts
- G05B19/058—Safety, monitoring
Definitions
- the present invention relates to a monitoring apparatus.
- a trigger to start measuring the state of the servomotor is to be set in a specific operation mode of the servomotor.
- an external trigger to start measuring the state of the servomotor may be input into a servo driver in the specific mode.
- the servo driver is to have an input terminal for an external trigger and also to modify a program for, for example, a PLC that starts processing in response to the external trigger. This places a large barrier to implementing the structure using an external trigger.
- This issue is not limited to a servomotor, and can also occur in monitoring, for example, an electric motor including a servomotor and an induction motor, various devices associated with an electric motor, and devices used in work such as farming.
- the monitoring apparatus may also have the features described below.
- the calculator excludes a combination with at least one of the two or more types of parameters being less than or equal to a threshold indicating the monitoring target device being stopped to generate the histogram.
- the monitoring apparatus with these features can reduce the likelihood that the measurer starts measurement when the monitoring target device is stopped.
- the servo driver 2 receives a command signal from the PLC 1.
- the servo driver 2 also receives a feedback signal from the motor 3.
- the servo driver 2 includes a servo system for feedback control using, for example, a position controller, a speed controller, and a current controller.
- the servo driver 2 performs servo control over the motor 3 to drive the motor 3 using signals from these controllers.
- the communicator 312 is an interface for communicating with the servo driver 2.
- the communicator 312 in the present embodiment transmits a feedback signal to the servo driver 2 through the encoder cable 41.
- the communicator 312 transmits a feedback signal and a detection signal using serial communication. This reduces the number of signal lines included in the cable.
- a known communication standard such as Recommended Standard (RS) 232 (RS-232C), RS-422, or RS-485 may be used for serial communication through the encoder cable 41.
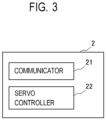
- FIG. 3 is a schematic functional block diagram of the servo driver 2.
- the servo driver 2 can be a computer including, for example, an arithmetic unit and a storage device.
- the functional units shown in FIG. 3 are implemented by the servo driver 2 executing, for example, predetermined programs.
- the servo driver 2 includes a communicator 21 and a servo controller 22.
- the servo driver 2 may include other functional unis.
- FIG. 7 is a schematic functional block diagram of the monitoring apparatus 9.
- the monitoring apparatus 9 can be a computer including, for example, an arithmetic unit and a storage device.
- the functional units shown in FIG. 7 are implemented by the monitoring apparatus 9 executing, for example, predetermined programs.
- the monitoring apparatus 9 includes a calculator 91, a setting unit 92, a measurer 93, a notifier 94, and a storage 95.
- the monitoring apparatus 9 may include other functional units.
- the calculator 91 is a functional unit for calculating the current amplitude and the frequency of a driving current supplied to the motor 3.
- the frequency can be calculated from, for example, a current waveform.
- the calculator 91 may, for example, detect a zero crossing point of the current waveform and calculate the frequency based on the time taken to the next zero crossing point.
- the current amplitude and the frequency calculated by the calculator 91 are used to set, for example, a trigger to cause the measurer 93 to start measurement.
- the current amplitude of a driving current is a parameter associated with the torque of the motor 3.
- the frequency of a driving current is a parameter associated with the rotational speed of the motor 3.
- FIG. 10 is a schematic diagram describing the current amplitude and the frequency calculated by the calculator 91.
- the vertical axis indicates current amplitude
- the horizontal axis indicates frequency.
- pairs of current amplitude and frequency are plotted on the graph.
- the current amplitude and the frequency in each pair are the values calculated at the same time.
- the pairs of current amplitude and frequency are plotted in a space defined by one axis indicating the current amplitude and the other axis indicating the frequency to facilitate understanding of types of pairs that occur frequently.
- the calculator 91 calculates the occurrence of a pair of current amplitude and frequency calculated at the same time.
- the calculator 91 calculates the current amplitude and the frequency of a driving current for a predetermined learning period.
- the calculator 91 calculates the current amplitude and the frequency of a driving current for each operation mode of the motor 3 switched by the servo driver 2.
- FIG. 11 is a graph showing example time-series data about the current amplitude calculated by the calculator 91.
- the vertical axis indicates current amplitude (A), and the horizontal axis indicates time (second).
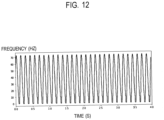
- FIG. 12 is a graph showing example time-series data about the frequency calculated by the calculator 91.
- the vertical axis indicates frequency (Hz), and the horizontal axis indicates time (second).
- the occurrence of the pairs of current amplitude and frequency is stored into the storage 95 as the histogram 241 to reduce the storage capacity for storing the occurrence of the pairs of current amplitude and frequency to a size obtained by multiplying the number of predetermined intervals for the current amplitude by the number of predetermined intervals for the frequency.
- Each of the current amplitude and the frequency is an example of a parameter associated with the operating state of the monitoring target device.
- a pair of current amplitude and frequency is an example of a combination of two or more types of parameters.
- the setting unit 92 sets a trigger to cause the measurer 93 to start measurement.
- the setting unit 92 may set, for example, an area satisfying a predetermined trigger setting condition as a trigger in the histogram 241.
- the trigger setting condition includes, for example, an area including a current amplitude and a frequency with the occurrence being 5% or greater of all the data in the histogram 241.
- An area R1 in FIG. 13 is an example area that satisfies such a trigger setting condition in the histogram 241. This trigger setting condition allows the trigger to be set as the operating state of the motor 3 that occurs most frequently.
- the area R1 in FIG. 13 is an example of a trigger range. For example, in response to the current amplitude and the frequency calculated by the calculator 91 falling within the trigger range, the measurer 93 (described later) starts measurement. More specifically, the trigger range is used to determine whether the measurer 93 can start measurement.
- the storage 95 is, for example, an EEPROM.
- the storage 95 stores the trigger set by the setting unit 92 and the threshold used by the notifier 94.
- the storage 95 may also store a measurement time to be taken by the measurer 93 to perform measurement.
- the monitoring apparatus 9 is an example of a monitoring apparatus.
- FIG. 15 is a flowchart of an example process for setting ranges of current amplitude and frequency performed by the setting unit 92.
- the example process for setting the ranges of current amplitude and frequency performed by the setting unit 92 will now be described with reference to FIG. 15 .
- step T3 the servo controller 22 in the servo driver 2 switches the operation mode of the motor 3.
- the servo controller 22 may change the operation mode to the operation B to drive the motor 3.
- step T5 the processing advances to step T5.
- the processing returns to step T2.
- step T11 the calculator 91 calculates the current amplitude and the frequency of a driving current supplied to the motor 3.
- the processing advances to step T13.
- the processing returns to step T11.
- step T15 the notifier 94 provides a notification indicating that an abnormality occurs in the motor 3.
- step T14a when the harmonic content measured in step T13 exceeds the threshold stored in the storage 95 (Yes in step T14a), the processing advances to step T15.
- step T16 When the harmonic content measured in step T13 is less than or equal to the threshold stored in the storage 95 (No in step T14a), the processing advances to step T16.
- an area is set as a trigger based on the current amplitude and the frequency of a driving current supplied to the motor 3 calculated in advance.
- the current amplitude of the driving current is associated with the torque of the motor 3.
- the frequency of the driving current is associated with the rotational speed of the motor 3.
- the trigger is set based on such current amplitude and frequency.
- the trigger can be set based on the current amplitude and the frequency associated with the operating state of the motor 3, without an externally input trigger to start measurement for abnormality detection.
- the motor 3 can be detected as being in an intended operation mode when the current amplitude and the frequency calculated by the calculator 91 fall within the area set as the trigger.
- the measurement to detect an abnormality in the motor 3 can be performed by measuring the harmonic content of the motor 3 indicating the state of the motor 3 in the intended operation mode.
- the setting unit 92 can also display the histogram 241 on, for example, the display for the user to select an area to be set as the trigger. This allows an area intended by the user to be set as the trigger in the present embodiment.
- the calculator 91 can exclude a pair of calculated current amplitude and frequency with at least one of the current amplitude or the frequency being less than or equal to a predetermined value indicating the motor 3 being stopped to generate the histogram 241.
- the histogram 241 is generated in this manner, thus reducing the likelihood that the measurer 93 performs measurement when the motor 3 is stopped.
- the calculator 91 may generate, instead of the histogram 241, a three-dimensional histogram including three orthogonal axes indicating the current amplitude, frequency, or rate of change of frequency.
- FIG. 18 is a schematic diagram showing an area set as a trigger on the three-dimensional histogram in the first modification. An area can also be set as the trigger based on a three-dimensional histogram including three parameters as in the first modification.
- an area with the rate of change of frequency close to 0 is to be selected as the trigger.
- the rate of change of frequency close to 0 may include, for example, the rate of change of frequency within a predetermined range from 0 to a value indicating no change in the rotational speed of the motor 3.
- the area with the rate of change of frequency close to 0 being selected as the trigger in the three-dimensional histogram allows the state in which the motor 3 operates steadily (operates at a substantially constant speed) to be a condition for the trigger.
- the current amplitude, frequency, and rate of change of frequency are used to set the trigger to start measurement to detect an abnormality in the motor 3.
- the parameters used as the trigger to start measurement are not limited to these, and various other parameters indicating the operating state of the motor 3 can be used as the trigger to start measurement.
- the monitoring apparatus 9 may not only detect an abnormality in the motor 3, but also measure parameters indicating various states of the motor 3.
- the temperature of the motor 3 and the rate of change of the temperature of the motor 3 are used to set the trigger to start measurement of a parameter indicating the state of the motor 3.
- FIG. 19 is a schematic diagram of a servo system 100a according to the second modification.
- the servo system 100a further includes a temperature sensor 6 for measuring the temperature of the motor 3, and also includes a monitoring apparatus 9a instead of the monitoring apparatus 9.
- the monitoring apparatus 9a is connected to the temperature sensor 6 and obtains the temperature of the motor 3 measured by the temperature sensor 6.
- the temperature is an example of a physical quantity indicating loss in the motor 3.
- the monitoring apparatus 9a monitors the temperature and the rate of change of the temperature of the motor 3 that is controlled by servo control and driven by the servo driver 2 and starts measuring the parameter indicating the state of the motor 3 in an intended operating state.
- FIG. 20 is a schematic functional block diagram of the monitoring apparatus 9a according to the second modification.
- the monitoring apparatus 9a includes a calculator 91a, the setting unit 92, a measurer 93a, a notifier 94a, and the storage 95.
- the calculator 91a is a functional unit for obtaining the temperature of the motor 3 and also calculating the rate of change of the temperature of the motor 3.
- the calculator 91a stores the temperature of the motor 3 obtained from the temperature sensor 6 into the storage 95.
- the calculator 91a calculates the rate of change of the temperature of the motor 3 from the rate of change of the temperature stored in the storage 95 with respect to time.
- the calculator 91a also calculates the occurrence of each pair of the temperature of the motor 3 and the rate of change of the temperature of the motor 3 in the same manner as the calculator 91.
- the calculator 91a then generates, in the same manner as the calculator 91, a two-dimensional histogram indicating the occurrence of each pair of the temperature of the motor 3 and the rate of change of the temperature of the motor 3 and stores the generated histogram into the storage 95.
- the temperature of the motor 3 and the rate of change of the temperature of the motor 3 are each an example of the parameter.
- a pair of the temperature of the motor 3 and the rate of change of the temperature of the motor 3 is an example of a combination of two or more types of parameters.
- the measurer 93a starts measuring the parameter indicating the state of the motor 3.
- the parameter indicating the state of the motor 3 measured by the measurer 93a include the speed, the acceleration, and the torque of the motor 3.
- step T13a the measurer 93a measures the parameter indicating the state of the motor 3.
- step T15a the notifier 94a provides a notification of the state of the motor 3 measured in step T13a.
- step T16a the measurer 93a determines whether the measurement time of the parameter indicating the state of the motor 3 has reached a measurement time stored in the storage 95.
- the processing returns to step T11a.
- the processing returns to step T13a.
- the parameter indicating the state of the motor 3 starts being measured in an intended operating state of the motor 3.
- the temperature of the motor 3 and the rate of change of the temperature of the motor 3 are each used as the parameter indicating the operating state of the motor 3 in the second modification, the parameter indicating the operating state of the motor 3 is not limited to these.
- the parameter indicating the operating state of the motor 3 include the temperature difference between the temperature of the motor 3 and the temperature in a room in which the motor 3 is installed, the acceleration of the motor 3, and the speed of the motor 3.
Landscapes
- Physics & Mathematics (AREA)
- General Physics & Mathematics (AREA)
- Engineering & Computer Science (AREA)
- Mathematical Physics (AREA)
- Theoretical Computer Science (AREA)
- Data Mining & Analysis (AREA)
- Computational Mathematics (AREA)
- Mathematical Optimization (AREA)
- Mathematical Analysis (AREA)
- Pure & Applied Mathematics (AREA)
- Databases & Information Systems (AREA)
- Software Systems (AREA)
- General Engineering & Computer Science (AREA)
- Algebra (AREA)
- Automation & Control Theory (AREA)
- Control Of Electric Motors In General (AREA)
- Testing And Monitoring For Control Systems (AREA)
Abstract
Description
- The present invention relates to a monitoring apparatus.
- In a servo system, a servo driver typically performs servo control over a servomotor in response to commands from a controller such as a programmable logic controller (PLC). Techniques have been developed for detecting an abnormality in such a servomotor (refer to, for example,
Patent Literatures 1 and 2). -
- Patent Literature 1:
Japanese Unexamined Patent Application Publication No. 2019-204155 - Patent Literature 2:
Japanese Unexamined Patent Application Publication No. 2020-035187 - Under servo control, a servomotor switches its rotation direction, rotational speed, and torque (a combination of the rotation direction, rotational speed, and torque may be hereafter referred to as an operation mode). Although the state of the servomotor is to be measured in an intended operating state, a state parameter (e.g., a current value) indicating the operating state of the servomotor may have a larger change resulting from the operation mode being switched than a change resulting from a change in the operating state. As a trigger to start measuring the state of the servomotor, a change in the state parameter resulting from a change in the operating state of the servomotor may be less noticeable than a change in the state parameter resulting from the operation mode being switched. This may disable the measurement from being started with the servomotor in the intended operating state.
- To reduce the likelihood of lower detection accuracy resulting from the operation mode being switched, a trigger to start measuring the state of the servomotor is to be set in a specific operation mode of the servomotor. Thus, for example, an external trigger to start measuring the state of the servomotor may be input into a servo driver in the specific mode. To implement this structure, the servo driver is to have an input terminal for an external trigger and also to modify a program for, for example, a PLC that starts processing in response to the external trigger. This places a large barrier to implementing the structure using an external trigger. This issue is not limited to a servomotor, and can also occur in monitoring, for example, an electric motor including a servomotor and an induction motor, various devices associated with an electric motor, and devices used in work such as farming.
- A technique according to an aspect of the disclosure is directed to a monitoring apparatus for an electric motor that can start measuring a parameter indicating the state of the electric motor as a monitoring target device in an intended operating state without relying on an external trigger.
- A technique according to an aspect of the disclosure may be a monitoring apparatus described below. The monitoring apparatus includes a storage that stores a trigger range usable to determine whether measurement of a parameter indicating a state of a monitoring target device is to be started, a calculator that calculates a parameter associated with an operating state of the monitoring target device, and a measurer that starts measuring the parameter indicating the state of the monitoring target device in response to the parameter calculated by the calculator falling within the trigger range.
- In response to the parameter associated with the operating state of the monitoring target device falling within the trigger range, the measurer starts measurement. This allows the measurer to start measurement in an intended operating state of the monitoring target device. More specifically, the monitoring apparatus can start measuring the parameter indicating the state of the monitoring target device in the intended operating state without relying on an external trigger.
- For the monitoring target device including an electric motor, the parameter may be at least one selected from the group consisting of a temperature of the electric motor, a rate of change of the temperature of the electric motor, a temperature difference between the temperature of the electric motor and a temperature in a room in which the electric motor is installed, an acceleration of the electric motor, and a speed of the electric motor. The physical quantities listed in the group are each an example of the parameter associated with the operating state of the electric motor. For example, the temperature of the electric motor is a physical quantity associated with loss in the electric motor.
- The monitoring apparatus may also have the features described below. The calculator calculates two or more types of parameters associated with the operating state of the monitoring target device, generates a histogram indicating an occurrence of a combination of the two or more types of parameters calculated at the same time, and stores the generated histogram into the storage. The monitoring apparatus further includes a setting unit that sets the trigger range based on the histogram. The monitoring apparatus with these features can reduce the storage capacity of the storage for storing two or more types of parameters.
- The monitoring apparatus may also have the features described below. The setting unit outputs the histogram to a display and sets a selected range in the output histogram as the trigger range. The monitoring apparatus with these features can set the range intended by the user of the monitoring target device as the trigger range.
- The monitoring apparatus may also have the features described below. The calculator excludes a combination with at least one of the two or more types of parameters being less than or equal to a threshold indicating the monitoring target device being stopped to generate the histogram. The monitoring apparatus with these features can reduce the likelihood that the measurer starts measurement when the monitoring target device is stopped.
- The monitoring apparatus may also have the features described below. The monitoring target device includes an electric motor. The calculator further calculates a rate of change of a frequency of alternating current to drive the electric motor. The setting unit sets, in the histogram, an area with the rate of change within a predetermined range indicating the electric motor operating steadily as the trigger range. The monitoring apparatus with these features can more accurately measure the parameter indicating the state of the electric motor to be measured in a steady operating state.
- The monitoring apparatus may also have the features described below. The monitoring apparatus further includes a notifier that provides a notification of the parameter indicating the state of the monitoring target device measured by the measurer. The monitoring apparatus with these features can provide a notification of the state of the monitoring target device in an intended operating state.
- The technique according to the aspects of the disclosure can start measuring the parameter indicating the state of the monitoring target device in an intended operating state without relying on an external trigger.
-
-
FIG. 1 is a schematic diagram of a servo system according to an embodiment. -
FIG. 2 is a schematic block diagram of a motor. -
FIG. 3 is a schematic functional block diagram of a servo driver. -
FIG. 4 is a schematic diagram describing the value of a current supplied to the motor. -
FIG. 5 is a schematic diagram describing a harmonic content measured by a monitoring apparatus in a normal operation of the motor. -
FIG. 6 is a schematic diagram describing a harmonic content measured by the monitoring apparatus when the motor has an abnormality. -
FIG. 7 is a schematic functional block diagram of the monitoring apparatus. -
FIG. 8 is a schematic diagram describing a current amplitude calculated by a calculator. -
FIG. 9 is a schematic diagram describing a frequency calculated by the calculator. -
FIG. 10 is a schematic diagram describing the current amplitude and the frequency calculated by the calculator. -
FIG. 11 is a graph showing example time-series data about a current amplitude calculated by the calculator. -
FIG. 12 is a graph showing example time-series data about a frequency calculated by the calculator. -
FIG. 13 is a diagram showing an example histogram generated by the calculator. -
FIG. 14 is a schematic diagram showing an area set as a trigger on the histogram. -
FIG. 15 is a flowchart of an example process for setting ranges of current amplitude and frequency performed by a setting unit. -
FIG. 16 is a flowchart of an example process for detecting an abnormality in the motor performed by the monitoring apparatus. -
FIG. 17 is a flowchart of another example process for detecting an abnormality in the motor performed by the monitoring apparatus. -
FIG. 18 is a schematic diagram showing an area set as the trigger on a three-dimensional histogram in a first modification. -
FIG. 19 is a schematic diagram of a servo system according to a second modification. -
FIG. 20 is a schematic functional block diagram of a monitoring apparatus according to the second modification. -
FIG. 21 is a flowchart of an example process for setting ranges of temperature and the rate of change of the temperature performed by the setting unit in the second modification. -
FIG. 22 is a flowchart of an example process for measuring a parameter indicating the state of the motor performed by the monitoring apparatus according to the second modification. -
FIG. 23 is a flowchart of another example process for measuring the parameter indicating the state of the motor performed by the monitoring apparatus according to the second modification. - One or more embodiments of the present invention will now be described in detail with reference to the drawings. The same reference numerals denote the same or corresponding components in the drawings, and such components will not be described repeatedly. An industrial system is used as an example of a servo system according to one or more embodiments of the present disclosure. However, the servo system according to one or more embodiments of the present disclosure may be used as any other system.
-
FIG. 1 is a schematic diagram of aservo system 100 according to an embodiment. Theservo system 100 includes a programmable logic controller (PLC) 1, aservo driver 2, and amonitoring apparatus 9. Theservo driver 2 is installed to drive and control aservomotor 3. Theservomotor 3 includes anoutput shaft 32 connected to ascrew shaft 52 with acoupling 51. Aprecision stage 53 is located on thescrew shaft 52. Theprecision stage 53 is moved on thescrew shaft 52 as the servomotor (hereafter, a motor) 3 is driven. - Stoppers (not shown) are located at both ends of the drivable range of the
precision stage 53 along thescrew shaft 52. Themotor 3 has its torque controlled to minimize the impact caused by theprecision stage 53 coming in contact with the stoppers. Theprecision stage 53 receives aworkpiece 8. As describe above, theservo system 100 shown inFIG. 1 includes one drive shaft drivable by themotor 3. Theservo system 100 may include two or more drive shafts. - The
PLC 1 outputs a command signal to theservo driver 2. ThePLC 1 performs a process in accordance with a predetermined program and functions as, for example, a monitoring apparatus for theservo driver 2. - The
servo driver 2 receives a command signal from thePLC 1. Theservo driver 2 also receives a feedback signal from themotor 3. Theservo driver 2 includes a servo system for feedback control using, for example, a position controller, a speed controller, and a current controller. Theservo driver 2 performs servo control over themotor 3 to drive themotor 3 using signals from these controllers. - The
motor 3 includes amotor body 30 and anencoder 31. Themotor 3 is, for example, an alternating current (AC) servomotor. Themotor 3 receives a driving current from theservo driver 2 through apower line 40. Theencoder 31 detects a displacement of theoutput shaft 32 in themotor body 30. Examples of the displacement of theoutput shaft 32 detected by theencoder 31 include the rotation direction, the rotation amount, and the rotational speed of theoutput shaft 32. Theencoder 31 outputs a feedback signal indicating the detected displacement to theservo driver 2 through anencoder cable 41. Themonitoring apparatus 9 for monitoring themotor 3 is connected to thepower line 40. The driving current is an example of alternating current. - The functional components of the
encoder 31 will now be described.FIG. 2 is a schematic block diagram of themotor 3. Theencoder 31 in themotor 3 includes asignal generator 311, acommunicator 312, and astorage 313. - The
signal generator 311 detects a motion of themotor body 30 of themotor 3 driven by theservo driver 2 and generates a feedback signal indicating the detected motion. The feedback signal is output to thecommunicator 312. The feedback signal includes, for example, information about the rotational position (angle) of the rotation shaft of themotor body 30, information about the rotational speed of the rotation shaft, and information about the rotation direction of the rotation shaft. The structure of thesignal generator 311 may be, for example, the structure of a known incremental or absolute encoder. - The
communicator 312 is an interface for communicating with theservo driver 2. Thecommunicator 312 in the present embodiment transmits a feedback signal to theservo driver 2 through theencoder cable 41. In the present embodiment, thecommunicator 312 transmits a feedback signal and a detection signal using serial communication. This reduces the number of signal lines included in the cable. A known communication standard such as Recommended Standard (RS) 232 (RS-232C), RS-422, or RS-485 may be used for serial communication through theencoder cable 41. - The
storage 313 stores data about servo control over themotor 3. Thestorage 313 is, for example, an electrically erasable programmable read-only memory (EEPROM). Themotor 3 is an example of a monitoring target device. - The
servo driver 2 performs servo control over themotor 3 to drive themotor 3.FIG. 3 is a schematic functional block diagram of theservo driver 2. Theservo driver 2 can be a computer including, for example, an arithmetic unit and a storage device. The functional units shown inFIG. 3 are implemented by theservo driver 2 executing, for example, predetermined programs. Theservo driver 2 includes acommunicator 21 and aservo controller 22. Theservo driver 2 may include other functional unis. - The
communicator 21 is a functional unit for performing communication with an external device through acommunication cable 11. For example, thecommunicator 21 functions as an interface for communication with thePLC 1. Thecommunicator 21 also functions as an interface for communication with theencoder 31 through theencoder cable 41. - The
servo controller 22 is a functional unit for servo control over themotor 3 based on a command from thePLC 1, more specifically, for feedback control using, for example, the position controller, the speed controller, and the current controller. Control parameters such as speed gain are set as appropriate for the position controller, the speed controller, and the current controller to perform appropriate servo control over themotor 3 as a control target. Theservo controller 22 switches the operation mode of themotor 3 as appropriate for, for example, theworkpiece 8 placed on theprecision stage 53. - The
monitoring apparatus 9 monitors themotor 3 under servo control driven by theservo driver 2 and detects any abnormality in themotor 3. The parameter used for such abnormality detection may be a harmonic content, an average value, or an effective value of a current supplied to themotor 3. In the present embodiment, themonitoring apparatus 9 uses the harmonic content of a current supplied to themotor 3 to detect an abnormality in themotor 3. -
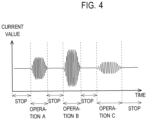
FIG. 4 is a schematic diagram describing the value of a current supplied to themotor 3. In the example ofFIG. 4 , the operational mode is switched to an operation A, an operation B, an operation C, or stop under servo control performed by theservo driver 2. As shown inFIG. 4 , the value of the current supplied to themotor 3 largely changes each time the operation mode is switched. In this example, theworkpiece 8 is placed on theprecision stage 53 during the operation B and transported as themotor 3 is driven. A user of theservo system 100 intends to detect an abnormality in themotor 3 while theworkpiece 8 is being transported. -
FIG. 5 is a schematic diagram describing a harmonic content measured by themonitoring apparatus 9 in a normal operation of themotor 3.FIG. 6 is a schematic diagram describing a harmonic content measured by themonitoring apparatus 9 when themotor 3 has an abnormality. In the example ofFIG. 6 , the abnormality occurs in themotor 3 during the operation B.FIG. 6 also shows an example threshold set to detect an abnormality in themotor 3 during the operation B. In this example, the threshold is set less than the harmonic content during the operation A. - In
FIG. 6 , the harmonic content during the operation B is greater than the threshold due to the abnormality. However, in the example ofFIG. 6 , the difference between the harmonic content during the operation A and the harmonic content during the operation B is larger than the change in the harmonic content resulting from the abnormality during the operation B. - In this case, abnormality detection performed using the single threshold set as shown in
FIG. 6 can detect an abnormality occurring during the operation B, but can also erroneously detect an abnormality during the operation A when no such abnormality is in the operation. To reduce the likelihood of such erroneous detection, themonitoring apparatus 9 according to the present embodiment has the structure described below. -
FIG. 7 is a schematic functional block diagram of themonitoring apparatus 9. Themonitoring apparatus 9 can be a computer including, for example, an arithmetic unit and a storage device. The functional units shown inFIG. 7 are implemented by themonitoring apparatus 9 executing, for example, predetermined programs. Themonitoring apparatus 9 includes acalculator 91, asetting unit 92, ameasurer 93, anotifier 94, and astorage 95. Themonitoring apparatus 9 may include other functional units. - The
calculator 91 is a functional unit for calculating the current amplitude and the frequency of a driving current supplied to themotor 3. The frequency can be calculated from, for example, a current waveform. Thecalculator 91 may, for example, detect a zero crossing point of the current waveform and calculate the frequency based on the time taken to the next zero crossing point. The current amplitude and the frequency calculated by thecalculator 91 are used to set, for example, a trigger to cause themeasurer 93 to start measurement. The current amplitude of a driving current is a parameter associated with the torque of themotor 3. The frequency of a driving current is a parameter associated with the rotational speed of themotor 3. - The
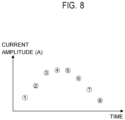
calculator 91 also calculates the occurrence of the current amplitude and the frequency of a driving current supplied to themotor 3 calculated at the same time.FIGs. 8 to 10 are schematic diagrams describing calculation of the occurrence of pairs of current amplitude and frequency performed by thecalculator 91.FIG. 8 is a schematic diagram describing the current amplitude calculated by thecalculator 91. InFIG. 8 , the vertical axis indicates current amplitude, and the horizontal axis indicates time.FIG. 9 is a schematic diagram describing the frequency calculated by thecalculator 91. InFIG. 9 , the vertical axis indicates frequency, and the horizontal axis indicates time. InFIGs. 8 and9 , the current amplitude and the frequency calculated at the same time are associated with each other with the same circled number. For example, the current amplitude indicated by the circled 3 inFIG. 8 and the frequency indicated by the circled 3 inFIG. 9 are the values calculated at the same time. -
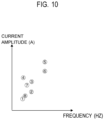
FIG. 10 is a schematic diagram describing the current amplitude and the frequency calculated by thecalculator 91. InFIG. 10 , the vertical axis indicates current amplitude, and the horizontal axis indicates frequency. InFIG. 10 , pairs of current amplitude and frequency are plotted on the graph. The current amplitude and the frequency in each pair are the values calculated at the same time. The pairs of current amplitude and frequency are plotted in a space defined by one axis indicating the current amplitude and the other axis indicating the frequency to facilitate understanding of types of pairs that occur frequently. - In the example described below based on the above, the
calculator 91 calculates the occurrence of a pair of current amplitude and frequency calculated at the same time. Thecalculator 91 calculates the current amplitude and the frequency of a driving current for a predetermined learning period. Thecalculator 91 calculates the current amplitude and the frequency of a driving current for each operation mode of themotor 3 switched by theservo driver 2. -
FIG. 11 is a graph showing example time-series data about the current amplitude calculated by thecalculator 91. InFIG. 11 , the vertical axis indicates current amplitude (A), and the horizontal axis indicates time (second).FIG. 12 is a graph showing example time-series data about the frequency calculated by thecalculator 91. InFIG. 12 , the vertical axis indicates frequency (Hz), and the horizontal axis indicates time (second). - The
calculator 91 calculates the occurrence of each pair of current amplitude and frequency calculated at the same time based on time-series data about the calculated current amplitude and time-series data about the calculated frequency. Thecalculator 91 may store the occurrence of each of all pairs of the calculated current amplitude and frequency into thestorage 95. When the occurrence of each of all pairs of the calculated current amplitude and frequency are to be stored into thestorage 95, a larger amount of data is stored into thestorage 95. Thestorage 95 is thus to have a large storage capacity or to transfer the data to a host device. To reduce the amount of data stored into thestorage 95, thecalculator 91 generates a two-dimensional histogram indicating the occurrence of the pairs described above based on the collected data. -
FIG. 13 is a diagram showing anexample histogram 241 generated by thecalculator 91. InFIG. 13 , the vertical axis indicates frequency, and the horizontal axis indicates current amplitude. In thehistogram 241, multiple areas are defined by dividing the current amplitude and the frequency at predetermined intervals. Each of the defined areas includes pairs of current amplitude and frequency. Color shading in each defined area indicates the occurrence of the pairs of current amplitude and frequency associated with the area. A darker color indicates a higher occurrence. The occurrence of the pairs of current amplitude and frequency is stored into thestorage 95 as thehistogram 241 to reduce the storage capacity for storing the occurrence of the pairs of current amplitude and frequency to a size obtained by multiplying the number of predetermined intervals for the current amplitude by the number of predetermined intervals for the frequency. Each of the current amplitude and the frequency is an example of a parameter associated with the operating state of the monitoring target device. A pair of current amplitude and frequency is an example of a combination of two or more types of parameters. - The
calculator 91 may exclude, from thehistogram 241, a pair of calculated current amplitude and frequency with at least one of the current amplitude or the frequency being less than or equal to a predetermined value indicating themotor 3 being stopped. More specifically, thecalculator 91 may exclude a pair of calculated current amplitude and frequency with at least one of at least one of the current amplitude or the frequency being less than or equal to the predetermined value indicating themotor 3 being stopped to generate thehistogram 241. - The setting
unit 92 sets a trigger to cause themeasurer 93 to start measurement. The settingunit 92 may set, for example, an area satisfying a predetermined trigger setting condition as a trigger in thehistogram 241. The trigger setting condition includes, for example, an area including a current amplitude and a frequency with the occurrence being 5% or greater of all the data in thehistogram 241. An area R1 inFIG. 13 is an example area that satisfies such a trigger setting condition in thehistogram 241. This trigger setting condition allows the trigger to be set as the operating state of themotor 3 that occurs most frequently. The area R1 inFIG. 13 is an example of a trigger range. For example, in response to the current amplitude and the frequency calculated by thecalculator 91 falling within the trigger range, the measurer 93 (described later) starts measurement. More specifically, the trigger range is used to determine whether themeasurer 93 can start measurement. - The trigger setting condition may include, for example, an area including the highest frequency of the areas with the occurrence greater than or equal to a predetermined value in the
histogram 241. In the example ofFIG. 13 , the area R1 inFIG. 13 is also an example area that satisfies such a trigger setting condition. This trigger setting condition allows the trigger to be set as the occurrence being high and the rotation frequency of themotor 3 being high. - The trigger setting condition may also include, in the
histogram 241, an area including the largest current amplitude of the areas with the occurrence greater than or equal to the predetermined value. An area R2 inFIG. 13 is an example area that satisfies such a trigger setting condition in thehistogram 241. This trigger setting condition allows the trigger to be set as the occurrence being high and the torque of themotor 3 being high. - The setting
unit 92 may display thehistogram 241 on, for example, a display for the user to select an area to be set as the trigger. The frequency and the current amplitude can change in accordance with the operation mode of themotor 3. To detect an abnormality in themotor 3 during, for example, the operation B (refer toFIG. 4 ), the area corresponding to the operation B may be selected on thehistogram 241. - The setting
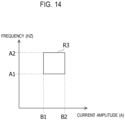
unit 92 then stores the set trigger into thestorage 95.FIG. 14 is a schematic diagram showing an area set as the trigger on thehistogram 241. InFIG. 14 , the vertical axis indicates frequency, and the horizontal axis indicates current amplitude.FIG. 14 shows an area R3 set as the trigger. The area R3 is a rectangle with the frequency ranging from A1 to A2 inclusive and the current amplitude ranging from B1 to B2 inclusive. With the area R3 set as the trigger, the measurer 93 (described later) starts measurement when the frequency calculated by thecalculator 91 is higher than or equal to the frequency A1 and lower than or equal to the frequency A2, and the current amplitude calculated by thecalculator 91 is higher than or equal to the frequency B1 and lower than or equal to the frequency B2. - The
measurer 93 performs measurement to detect an abnormality in themotor 3 when the current amplitude and the frequency calculated by thecalculator 91 fall within the area set as the trigger by the settingunit 92. Themeasurer 93 measures, for example, the harmonic content in the waveform of the current supplied to themotor 3. Themeasurer 93 performs, for example, a fast Fourier transform (FFT) on the waveform of the current supplied to themotor 3 to obtain its fundamental and n-th harmonic (n is an integer greater than or equal to 2). Themeasurer 93 then calculates the percentage of the second or higher harmonic to the fundamental to measure the harmonic content. The harmonic content is an example of a parameter indicating the state of the monitoring target device. - When the harmonic content measured by the
measurer 93 exceeds the threshold stored in thestorage 95, thenotifier 94 provides a notification of an abnormality. The notification of the abnormality may be provided by, for example, outputting an alarm sound, outputting a warning message to the display, or sending an email. - The
storage 95 is, for example, an EEPROM. Thestorage 95 stores the trigger set by the settingunit 92 and the threshold used by thenotifier 94. Thestorage 95 may also store a measurement time to be taken by themeasurer 93 to perform measurement. Themonitoring apparatus 9 is an example of a monitoring apparatus. -
FIG. 15 is a flowchart of an example process for setting ranges of current amplitude and frequency performed by the settingunit 92. The example process for setting the ranges of current amplitude and frequency performed by the settingunit 92 will now be described with reference toFIG. 15 . - In step T1, the
PLC 1, theservo driver 2, and themotor 3 are connected to form theservo system 100. Theservo controller 22 in theservo driver 2 starts driving themotor 3 in a predetermined operation mode (e.g., the operation A inFIG. 4 ) in response to a command signal from thePLC 1. - In step T2, the
calculator 91 in themonitoring apparatus 9 calculates the current amplitude and the frequency of a driving current supplied to themotor 3. Thecalculator 91 continuously calculates the current amplitude and the frequency of the driving current supplied to themotor 3 for a predetermined period. Thecalculator 91 also calculates the occurrence of each pair of current amplitude and frequency calculated at the same time. - In step T3, the
servo controller 22 in theservo driver 2 switches the operation mode of themotor 3. When themotor 3 is being driven in, for example, the operation A, theservo controller 22 may change the operation mode to the operation B to drive themotor 3. When the current amplitude and the frequency of the driving current supplied to themotor 3 are recorded for all the operation modes of the motor 3 (Yes in step T4), the processing advances to step T5. When the current amplitude and the frequency of the driving current supplied to themotor 3 are yet to be recorded for all the operation modes of the motor 3 (No in step T4), the processing returns to step T2. - In step T5, the setting
unit 92 in themonitoring apparatus 9 sets a trigger. The settingunit 92 may calculate ahistogram 241 based on the current amplitude and the frequency calculated by thecalculator 91 in step T2 and set, in thehistogram 241, an area that satisfies a predetermined trigger setting condition as the trigger. The settingunit 92 may display thehistogram 241 on, for example, the display for the user to select an area to be set as the trigger. -
FIG. 16 is a flowchart of an example process for detecting an abnormality in themotor 3 performed by themonitoring apparatus 9. In the example described below with reference toFIG. 16 , the measurement is continuously performed by themeasurer 93 when the current amplitude and the frequency calculated by thecalculator 91 remain within the area set as the trigger. An example process for detecting an abnormality in themotor 3 performed by themonitoring apparatus 9 will now be described with reference toFIG. 16 . - In step T11, the
calculator 91 calculates the current amplitude and the frequency of a driving current supplied to themotor 3. When the calculated current amplitude and frequency fall within, for example, the area set as the trigger in step T5 inFIG. 15 (Yes in step T12), the processing advances to step T13. When the calculated current amplitude and frequency are outside, for example, the area set as the trigger in step T5 inFIG. 15 (No in step T12), the processing returns to step T11. - In step T13, the
measurer 93 measures a harmonic content in the waveform of the current supplied to themotor 3. When the measured harmonic content exceeds a threshold stored in the storage 95 (Yes in step T14), the processing advances to step T15. When the measured harmonic content is less than or equal to the threshold stored in the storage 95 (No in step T14), the processing returns to step T11. - In step T15, the
notifier 94 provides a notification indicating that an abnormality occurs in themotor 3. -
FIG. 17 is a flowchart of another example process for detecting an abnormality in themotor 3 performed by themonitoring apparatus 9.FIG. 17 shows the process for the measurement continuously performed by themeasurer 93 for a predetermined period. The other example process for detecting an abnormality in themotor 3 performed by themonitoring apparatus 9 will now be described with reference toFIG. 17 . The same reference numerals denote the same processes as inFIG. 16 , and such processes will not be described. - In step T14a, when the harmonic content measured in step T13 exceeds the threshold stored in the storage 95 (Yes in step T14a), the processing advances to step T15. When the harmonic content measured in step T13 is less than or equal to the threshold stored in the storage 95 (No in step T14a), the processing advances to step T16.
- In step T16, the
measurer 93 determines whether the measurement time of the harmonic content has reached a measurement time stored in thestorage 95. When the measurement time has elapsed (Yes in step T16), the processing returns to step T11. When the measurement time of the harmonic content has not elapsed (No in step T16), the processing returns to step T13. - In the present embodiment, an area is set as a trigger based on the current amplitude and the frequency of a driving current supplied to the
motor 3 calculated in advance. The current amplitude of the driving current is associated with the torque of themotor 3. The frequency of the driving current is associated with the rotational speed of themotor 3. In the present embodiment, the trigger is set based on such current amplitude and frequency. Thus, the trigger can be set based on the current amplitude and the frequency associated with the operating state of themotor 3, without an externally input trigger to start measurement for abnormality detection. In the present embodiment, themotor 3 can be detected as being in an intended operation mode when the current amplitude and the frequency calculated by thecalculator 91 fall within the area set as the trigger. In the present embodiment, the measurement to detect an abnormality in themotor 3 can be performed by measuring the harmonic content of themotor 3 indicating the state of themotor 3 in the intended operation mode. - In the present embodiment, the frequency and the current amplitude calculated by the
calculator 91 are stored into thestorage 95 as thehistogram 241. This can reduce the storage capacity of thestorage 95 for storing the frequency and the current amplitude in the present embodiment. - In the present embodiment, the setting
unit 92 can also display thehistogram 241 on, for example, the display for the user to select an area to be set as the trigger. This allows an area intended by the user to be set as the trigger in the present embodiment. - In the present embodiment, the
calculator 91 can exclude a pair of calculated current amplitude and frequency with at least one of the current amplitude or the frequency being less than or equal to a predetermined value indicating themotor 3 being stopped to generate thehistogram 241. In the present embodiment, thehistogram 241 is generated in this manner, thus reducing the likelihood that themeasurer 93 performs measurement when themotor 3 is stopped. - In the embodiment described above, the trigger to cause the
measurer 93 to start measurement is set based on the pairs of current amplitude and frequency. In a first modification, the trigger to cause themeasurer 93 to start measurement is set based on the rate of change of frequency in addition to the current amplitude and frequency. - In the first modification, the
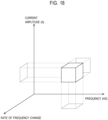
calculator 91 may generate, instead of thehistogram 241, a three-dimensional histogram including three orthogonal axes indicating the current amplitude, frequency, or rate of change of frequency.FIG. 18 is a schematic diagram showing an area set as a trigger on the three-dimensional histogram in the first modification. An area can also be set as the trigger based on a three-dimensional histogram including three parameters as in the first modification. - When the rate of change of frequency is included as a parameter for setting the trigger, an area with the rate of change of frequency close to 0 is to be selected as the trigger. The rate of change of frequency close to 0 may include, for example, the rate of change of frequency within a predetermined range from 0 to a value indicating no change in the rotational speed of the
motor 3. The area with the rate of change of frequency close to 0 being selected as the trigger in the three-dimensional histogram allows the state in which themotor 3 operates steadily (operates at a substantially constant speed) to be a condition for the trigger. - The measurer 93 starts measurement based on the trigger set in this manner, thus allowing more accurate measurement of a parameter to be measured with the
motor 3 operating steadily. Examples of the parameter to be measured with themotor 3 operating steadily include the harmonic content calculated by the FFT. More specifically, the harmonic content can be more accurately measured by setting the state in which themotor 3 operates steadily as the trigger. - In the embodiment and the first modification described above, the current amplitude, frequency, and rate of change of frequency are used to set the trigger to start measurement to detect an abnormality in the
motor 3. However, the parameters used as the trigger to start measurement are not limited to these, and various other parameters indicating the operating state of themotor 3 can be used as the trigger to start measurement. Themonitoring apparatus 9 may not only detect an abnormality in themotor 3, but also measure parameters indicating various states of themotor 3. In a second modification, the temperature of themotor 3 and the rate of change of the temperature of themotor 3 are used to set the trigger to start measurement of a parameter indicating the state of themotor 3. -
FIG. 19 is a schematic diagram of aservo system 100a according to the second modification. Theservo system 100a further includes atemperature sensor 6 for measuring the temperature of themotor 3, and also includes amonitoring apparatus 9a instead of themonitoring apparatus 9. Themonitoring apparatus 9a is connected to thetemperature sensor 6 and obtains the temperature of themotor 3 measured by thetemperature sensor 6. The temperature is an example of a physical quantity indicating loss in themotor 3. Themonitoring apparatus 9a monitors the temperature and the rate of change of the temperature of themotor 3 that is controlled by servo control and driven by theservo driver 2 and starts measuring the parameter indicating the state of themotor 3 in an intended operating state. -
FIG. 20 is a schematic functional block diagram of themonitoring apparatus 9a according to the second modification. Themonitoring apparatus 9a includes acalculator 91a, the settingunit 92, ameasurer 93a, anotifier 94a, and thestorage 95. - The
calculator 91a is a functional unit for obtaining the temperature of themotor 3 and also calculating the rate of change of the temperature of themotor 3. Thecalculator 91a stores the temperature of themotor 3 obtained from thetemperature sensor 6 into thestorage 95. Thecalculator 91a calculates the rate of change of the temperature of themotor 3 from the rate of change of the temperature stored in thestorage 95 with respect to time. Thecalculator 91a also calculates the occurrence of each pair of the temperature of themotor 3 and the rate of change of the temperature of themotor 3 in the same manner as thecalculator 91. Thecalculator 91a then generates, in the same manner as thecalculator 91, a two-dimensional histogram indicating the occurrence of each pair of the temperature of themotor 3 and the rate of change of the temperature of themotor 3 and stores the generated histogram into thestorage 95. The temperature of themotor 3 and the rate of change of the temperature of themotor 3 are each an example of the parameter. A pair of the temperature of themotor 3 and the rate of change of the temperature of themotor 3 is an example of a combination of two or more types of parameters. - When the temperature of the
motor 3 obtained by thecalculator 91a and the rate of change of the temperature of themotor 3 calculated by thecalculator 91a fall within an area set as the trigger by the settingunit 92, themeasurer 93a starts measuring the parameter indicating the state of themotor 3. Examples of the parameter indicating the state of themotor 3 measured by themeasurer 93a include the speed, the acceleration, and the torque of themotor 3. - The
notifier 94a provides a notification of the state of themotor 3 measured by themeasurer 93a. The notification may be provided by, for example, outputting a voice, outputting a message to the display, or sending an email. Thenotifier 94a may generate a graph showing the temperature of themotor 3 and the rate of change of the temperature of themotor 3 measured by themeasurer 93a and display the generated graph on the display. -
FIG. 21 is a flowchart of an example process for setting the ranges of the temperature and the rate of change of the temperature performed by the settingunit 92 in the second modification. The example process for setting the ranges of the temperature and the rate of change of the temperature performed by the settingunit 92 in the second modification will now be described with reference toFIG. 21 . The same reference numerals denote the same processes as inFIG. 15 , and such processes will not be described. - In step T2a, the
calculator 91a in themonitoring apparatus 9a obtains the temperature of themotor 3 from thetemperature sensor 6. Thecalculator 91a also calculates the rate of change of the temperature based on the temperature obtained from thetemperature sensor 6. Thecalculator 91a continuously calculates the temperature and the rate of change of the temperature of themotor 3 for a predetermined period. Thecalculator 91a also calculates the occurrence of each pair of the temperature and the rate of change of the temperature calculated at the same time. -
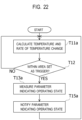
FIG. 22 is a flowchart of an example process for measuring a parameter indicating the state of themotor 3 performed by themonitoring apparatus 9a according to the second modification. In the example described below with reference toFIG. 22 , the measurement is continuously performed by themeasurer 93a when the temperature and the rate of change of the temperature calculated by thecalculator 91a remain within the area set as the trigger. The example process for measuring the parameter indicating the state of themotor 3 performed by themonitoring apparatus 9a will now be described with reference toFIG. 22 . The same reference numerals denote the same processes as inFIG. 16 , and such processes will not be described. - In step T11a, the
calculator 91 calculates the temperature and the rate of change of the temperature of themotor 3. When the calculated temperature and the calculated rate of change of the temperature fall within, for example, the area set as the trigger in step T5 inFIG. 21 (Yes in step T12), the processing advances to step T13a. When the calculated temperature and the calculated rate of change of the temperature are outside, for example, the area set as the trigger in step T5 inFIG. 21 (No in step T12), the processing returns to step T11a. - In step T13a, the
measurer 93a measures the parameter indicating the state of themotor 3. In step T15a, thenotifier 94a provides a notification of the state of themotor 3 measured in step T13a. -
FIG. 23 is a flowchart of another example process for measuring the parameter indicating the state of themotor 3 performed by themonitoring apparatus 9a according to the second modification.FIG. 23 shows the process for the measurement continuously performed by themeasurer 93a for a predetermined period. The other example process for measuring the parameter indicating the state of themotor 3 performed by themonitoring apparatus 9a will now be described with reference toFIG. 23 . The same reference numerals denote the same processes as inFIG. 22 , and such processes will not be described. - In step T16a, the
measurer 93a determines whether the measurement time of the parameter indicating the state of themotor 3 has reached a measurement time stored in thestorage 95. When the measurement time has elapsed (Yes in step T16a), the processing returns to step T11a. When the measurement time has not elapsed (No in step T16a), the processing returns to step T13a. - In the second modification, the parameter indicating the state of the
motor 3 starts being measured in an intended operating state of themotor 3. Although the temperature of themotor 3 and the rate of change of the temperature of themotor 3 are each used as the parameter indicating the operating state of themotor 3 in the second modification, the parameter indicating the operating state of themotor 3 is not limited to these. Examples of the parameter indicating the operating state of themotor 3 include the temperature difference between the temperature of themotor 3 and the temperature in a room in which themotor 3 is installed, the acceleration of themotor 3, and the speed of themotor 3. - In the second modification, the
notifier 94a can provide a notification of the state of themotor 3 in an intended operating state. In the second modification, themonitoring apparatus 9a can present the state of themotor 3 in the intended operating state to be easily understood visually by, for example, displaying the state of themotor 3 measured by themeasurer 93a in a graph on the display. - The trigger to cause the
measurer 93a to start measurement is set based on both the temperature and the rate of change of the temperature of themotor 3 in the second modification. The trigger to cause themeasurer 93a to start measurement may be set based on at least one of the temperature or the rate of change of the temperature of themotor 3. - Although the
motor 3 is a servomotor in the above embodiment, themotor 3 is not limited to a servomotor. Themotor 3 may be, for example, an induction motor. Themotor 3 is not limited to an AC electric motor, and may be a direct current (DC) electric motor. Although themonitoring apparatus 9 monitors themotor 3 in the embodiment, themonitoring apparatus 9 may monitor a device other than themotor 3. Examples of the device monitored by themonitoring apparatus 9 include a pump for pumping a fluid, a boiler for producing water vapor and hot water, an air conditioner, a humidifier, and a greenhouse heater and a carbon dioxide generator used in farming. - Although the trigger to cause the
measurer 93 to start measurement is set based on both the current amplitude and the frequency of a driving current supplied to themotor 3 in the above embodiment, the trigger to cause themeasurer 93 to start measurement may be set based on at least one of the current amplitude or the frequency of the driving current. - Although the
monitoring apparatus 9 is separate from theservo driver 2 in the above embodiment, themonitoring apparatus 9 may be incorporated in theservo driver 2. - The embodiment and the modifications described above may each be combined together.
- A monitoring apparatus (9), comprising:
- a storage (95) configured to store a trigger range usable to determine whether measurement of a parameter indicating a state of a monitoring target device (3) is to be started;
- a calculator (91, 91a) configured to calculate a parameter associated with an operating state of the monitoring target device (3); and
- a measurer (93, 93a) configured to start measuring the parameter indicating the state of the monitoring target device (3) in response to the parameter calculated by the calculator (91, 91a) falling within the trigger range.
-
- 1
- programmable logic controller (PLC)
- 2
- servo driver
- 3
- motor
- 6
- temperature sensor
- 8
- workpiece
- 9
- monitoring apparatus
- 9a
- monitoring apparatus
- 21
- communicator
- 22
- servo controller
- 91
- calculator
- 91a
- calculator
- 92
- setting unit
- 93
- measurer
- 93a
- measurer
- 94
- notifier
- 94a
- notifier
- 95
- storage
- 30
- motor body
- 31
- encoder
- 241
- histogram
- 311
- signal generator
- 312
- communicator
- 313
- storage
- 32
- output shaft
- 41
- encoder cable
- 51
- coupling
- 52
- screw shaft
- 53
- precision stage
- 100
- servo system
- 100a
- servo system
Claims (7)
- A monitoring apparatus (9; 9a), comprising:a storage (95) configured to store a trigger range usable to determine whether measurement of a parameter indicating a state of a monitoring target device (3) is to be started;a calculator (91; 91a) configured to calculate a parameter associated with an operating state of the monitoring target device (3); anda measurer (93; 93a) configured to start measuring the parameter indicating the state of the monitoring target device (3) in response to the parameter calculated by the calculator (91; 91a) falling within the trigger range.
- The monitoring apparatus (9; 9a) according to claim 1, whereinthe calculator (91; 91a) calculates two or more types of parameters associated with the operating state of the monitoring target device (3), generates a histogram (241) indicating an occurrence of a combination of the two or more types of parameters calculated at the same time, and stores the generated histogram (241) into the storage (95), andthe monitoring apparatus (9; 9a) further comprises a setting unit (92) configured to set the trigger range based on the histogram (241).
- The monitoring apparatus (9; 9a) according to claim 2, wherein
the setting unit (92) outputs the histogram (241) to a display and sets a selected range in the output histogram (241) as the trigger range. - The monitoring apparatus (9; 9a) according to claim 2 or claim 3, wherein
the calculator (91; 91a) excludes a combination with at least one of the two or more types of parameters being less than or equal to a threshold indicating the monitoring target device (3) being stopped to generate the histogram (241). - The monitoring apparatus (9; 9a) according to any one of claims 2 to 4, whereinthe monitoring target device (3) includes an electric motor (3),the calculator (91; 91a) further calculates a rate of change of a frequency of alternating current to drive the electric motor (3), andthe setting unit (92) sets, in the histogram (241), an area with the rate of change within a predetermined range indicating the electric motor (3) operating steadily as the trigger range.
- The monitoring apparatus (9; 9a) according to any one of claims 1 to 5, whereinthe monitoring target device (3) includes an electric motor (3), andthe parameter associated with the operating state is at least one selected from the group consisting of a temperature of the electric motor (3), a rate of change of the temperature of the electric motor (3), a temperature difference between the temperature of the electric motor (3) and a temperature in a room in which the electric motor (3) is installed, an acceleration of the electric motor (3), and a speed of the electric motor (3).
- The monitoring apparatus (9; 9a) according to any one of claims 1 to 6, further comprising:
a notifier (94; 94a) configured to provide a notification of the parameter indicating the state of the monitoring target device (3) measured by the measurer (93; 93a).
Applications Claiming Priority (1)
| Application Number | Priority Date | Filing Date | Title |
|---|---|---|---|
| JP2022020841A JP2023117991A (en) | 2022-02-14 | 2022-02-14 | monitoring device |
Publications (1)
| Publication Number | Publication Date |
|---|---|
| EP4227751A1 true EP4227751A1 (en) | 2023-08-16 |
Family
ID=85132910
Family Applications (1)
| Application Number | Title | Priority Date | Filing Date |
|---|---|---|---|
| EP23153588.1A Withdrawn EP4227751A1 (en) | 2022-02-14 | 2023-01-27 | Monitoring apparatus |
Country Status (3)
| Country | Link |
|---|---|
| EP (1) | EP4227751A1 (en) |
| JP (1) | JP2023117991A (en) |
| CN (1) | CN116593884A (en) |
Families Citing this family (1)
| Publication number | Priority date | Publication date | Assignee | Title |
|---|---|---|---|---|
| JP2024179340A (en) * | 2023-06-14 | 2024-12-26 | 株式会社日立産機システム | Data measurement system and data measurement method |
Citations (4)
| Publication number | Priority date | Publication date | Assignee | Title |
|---|---|---|---|---|
| US20120271506A1 (en) * | 2009-11-06 | 2012-10-25 | Honda Motor Co., Ltd. | Trouble diagnosis device |
| US20180276842A1 (en) * | 2017-03-27 | 2018-09-27 | Blackberry Limited | System and method for image based confirmation |
| JP2019204155A (en) | 2018-05-21 | 2019-11-28 | ファナック株式会社 | Abnormality detector |
| JP2020035187A (en) | 2018-08-30 | 2020-03-05 | 株式会社日立製作所 | Diagnostic device and diagnostic method |
Family Cites Families (8)
| Publication number | Priority date | Publication date | Assignee | Title |
|---|---|---|---|---|
| FR2999326B1 (en) * | 2012-12-12 | 2017-01-27 | Electricite De France | SYSTEM AND METHOD FOR MONITORING AT LEAST ONE ELECTRICAL DEVICE |
| JP6767166B2 (en) * | 2016-05-25 | 2020-10-14 | アズビル株式会社 | Monitoring equipment, monitoring methods, and programs |
| JP6848845B2 (en) * | 2017-12-15 | 2021-03-24 | オムロン株式会社 | Servo motor load condition diagnostic device and load status diagnostic method |
| CN108375732A (en) * | 2018-03-01 | 2018-08-07 | 北京迪利科技有限公司 | Motor monitoring and pre-alarming method and system |
| JP6996524B2 (en) * | 2019-03-13 | 2022-01-17 | オムロン株式会社 | Motor status determination device, motor status determination method, and program |
| JP7194099B2 (en) * | 2019-12-19 | 2022-12-21 | 株式会社日立産機システム | motor control system |
| JP7246344B2 (en) * | 2020-06-16 | 2023-03-27 | 株式会社日立産機システム | motor controller |
| CN213067714U (en) * | 2020-09-25 | 2021-04-27 | 中国石油化工股份有限公司 | An online state monitoring system for electromechanical equipment |
-
2022
- 2022-02-14 JP JP2022020841A patent/JP2023117991A/en active Pending
-
2023
- 2023-01-27 EP EP23153588.1A patent/EP4227751A1/en not_active Withdrawn
- 2023-01-29 CN CN202310079887.7A patent/CN116593884A/en active Pending
Patent Citations (4)
| Publication number | Priority date | Publication date | Assignee | Title |
|---|---|---|---|---|
| US20120271506A1 (en) * | 2009-11-06 | 2012-10-25 | Honda Motor Co., Ltd. | Trouble diagnosis device |
| US20180276842A1 (en) * | 2017-03-27 | 2018-09-27 | Blackberry Limited | System and method for image based confirmation |
| JP2019204155A (en) | 2018-05-21 | 2019-11-28 | ファナック株式会社 | Abnormality detector |
| JP2020035187A (en) | 2018-08-30 | 2020-03-05 | 株式会社日立製作所 | Diagnostic device and diagnostic method |
Also Published As
| Publication number | Publication date |
|---|---|
| CN116593884A (en) | 2023-08-15 |
| JP2023117991A (en) | 2023-08-24 |
Similar Documents
| Publication | Publication Date | Title |
|---|---|---|
| JP5991042B2 (en) | Anomaly monitoring system and anomaly monitoring method | |
| JP5009791B2 (en) | Intelligent drive | |
| JP6867358B2 (en) | State judgment device and state judgment method | |
| KR102841817B1 (en) | Information processing device and information processing method | |
| CN209297151U (en) | Abnormal Factor Determining Device | |
| US12103169B2 (en) | Abnormality diagnosis device and abnormality diagnosis method | |
| JP7275008B2 (en) | Diagnostic device, motor drive device and diagnostic method | |
| US10486279B2 (en) | Abnormality determination device and abnormality determining method | |
| JP2020064481A (en) | Monitoring system and monitoring method | |
| CN111290335A (en) | Processing time monitoring device | |
| EP4227751A1 (en) | Monitoring apparatus | |
| US11992953B2 (en) | Abnormality determination device and abnormality determination method | |
| CN112783089A (en) | Diagnostic device | |
| US8393264B2 (en) | Press machine | |
| JP7011106B1 (en) | Status determination device and status determination method | |
| JP7786238B2 (en) | AC motor monitoring device | |
| CN114377874B (en) | Flow monitoring method and device for spraying equipment and readable storage medium | |
| US10317895B2 (en) | Method and system for condition monitoring | |
| CN106774235A (en) | The abnormality diagnostic device and method of a kind of simulation input channel | |
| WO2020050236A1 (en) | Information processing device and information processing method | |
| JP7783297B2 (en) | Abnormality diagnosis device, abnormality diagnosis system, and storage medium | |
| EP4597038A1 (en) | Anomaly diagnosis device and anomaly diagnosis method | |
| CN116896294A (en) | An electric servo system and control method based on wire drawing equipment for metal products | |
| JP2022138348A (en) | Servo driver and servo system | |
| JP2021057064A (en) | State determination apparatus and state determination method |
Legal Events
| Date | Code | Title | Description |
|---|---|---|---|
| PUAI | Public reference made under article 153(3) epc to a published international application that has entered the european phase |
Free format text: ORIGINAL CODE: 0009012 |
|
| STAA | Information on the status of an ep patent application or granted ep patent |
Free format text: STATUS: REQUEST FOR EXAMINATION WAS MADE |
|
| 17P | Request for examination filed |
Effective date: 20230127 |
|
| AK | Designated contracting states |
Kind code of ref document: A1 Designated state(s): AL AT BE BG CH CY CZ DE DK EE ES FI FR GB GR HR HU IE IS IT LI LT LU LV MC ME MK MT NL NO PL PT RO RS SE SI SK SM TR |
|
| RBV | Designated contracting states (corrected) |
Designated state(s): AL AT BE BG CH CY CZ DE DK EE ES FI FR GB GR HR HU IE IS IT LI LT LU LV MC ME MK MT NL NO PL PT RO RS SE SI SK SM TR |
|
| STAA | Information on the status of an ep patent application or granted ep patent |
Free format text: STATUS: EXAMINATION IS IN PROGRESS |
|
| 17Q | First examination report despatched |
Effective date: 20240708 |
|
| GRAP | Despatch of communication of intention to grant a patent |
Free format text: ORIGINAL CODE: EPIDOSNIGR1 |
|
| STAA | Information on the status of an ep patent application or granted ep patent |
Free format text: STATUS: GRANT OF PATENT IS INTENDED |
|
| INTG | Intention to grant announced |
Effective date: 20250414 |
|
| STAA | Information on the status of an ep patent application or granted ep patent |
Free format text: STATUS: THE APPLICATION IS DEEMED TO BE WITHDRAWN |
|
| 18D | Application deemed to be withdrawn |
Effective date: 20250815 |