EP4224160A1 - State diagnosis method, state diagnosis device, and program - Google Patents
State diagnosis method, state diagnosis device, and program Download PDFInfo
- Publication number
- EP4224160A1 EP4224160A1 EP21875464.6A EP21875464A EP4224160A1 EP 4224160 A1 EP4224160 A1 EP 4224160A1 EP 21875464 A EP21875464 A EP 21875464A EP 4224160 A1 EP4224160 A1 EP 4224160A1
- Authority
- EP
- European Patent Office
- Prior art keywords
- lubricant
- dielectric constant
- relative dielectric
- grease
- condition
- Prior art date
- Legal status (The legal status is an assumption and is not a legal conclusion. Google has not performed a legal analysis and makes no representation as to the accuracy of the status listed.)
- Pending
Links
Images







Classifications
-
- G—PHYSICS
- G01—MEASURING; TESTING
- G01N—INVESTIGATING OR ANALYSING MATERIALS BY DETERMINING THEIR CHEMICAL OR PHYSICAL PROPERTIES
- G01N27/00—Investigating or analysing materials by the use of electric, electrochemical, or magnetic means
- G01N27/02—Investigating or analysing materials by the use of electric, electrochemical, or magnetic means by investigating impedance
-
- G—PHYSICS
- G01—MEASURING; TESTING
- G01N—INVESTIGATING OR ANALYSING MATERIALS BY DETERMINING THEIR CHEMICAL OR PHYSICAL PROPERTIES
- G01N27/00—Investigating or analysing materials by the use of electric, electrochemical, or magnetic means
- G01N27/02—Investigating or analysing materials by the use of electric, electrochemical, or magnetic means by investigating impedance
- G01N27/22—Investigating or analysing materials by the use of electric, electrochemical, or magnetic means by investigating impedance by investigating capacitance
- G01N27/221—Investigating or analysing materials by the use of electric, electrochemical, or magnetic means by investigating impedance by investigating capacitance by investigating the dielectric properties
-
- G—PHYSICS
- G01—MEASURING; TESTING
- G01N—INVESTIGATING OR ANALYSING MATERIALS BY DETERMINING THEIR CHEMICAL OR PHYSICAL PROPERTIES
- G01N27/00—Investigating or analysing materials by the use of electric, electrochemical, or magnetic means
- G01N27/02—Investigating or analysing materials by the use of electric, electrochemical, or magnetic means by investigating impedance
- G01N27/026—Dielectric impedance spectroscopy
-
- G—PHYSICS
- G01—MEASURING; TESTING
- G01N—INVESTIGATING OR ANALYSING MATERIALS BY DETERMINING THEIR CHEMICAL OR PHYSICAL PROPERTIES
- G01N27/00—Investigating or analysing materials by the use of electric, electrochemical, or magnetic means
- G01N27/02—Investigating or analysing materials by the use of electric, electrochemical, or magnetic means by investigating impedance
- G01N27/22—Investigating or analysing materials by the use of electric, electrochemical, or magnetic means by investigating impedance by investigating capacitance
- G01N27/228—Circuits therefor
-
- G—PHYSICS
- G01—MEASURING; TESTING
- G01N—INVESTIGATING OR ANALYSING MATERIALS BY DETERMINING THEIR CHEMICAL OR PHYSICAL PROPERTIES
- G01N33/00—Investigating or analysing materials by specific methods not covered by groups G01N1/00 - G01N31/00
- G01N33/26—Oils; Viscous liquids; Paints; Inks
- G01N33/28—Oils, i.e. hydrocarbon liquids
- G01N33/2888—Lubricating oil characteristics, e.g. deterioration
-
- G—PHYSICS
- G01—MEASURING; TESTING
- G01N—INVESTIGATING OR ANALYSING MATERIALS BY DETERMINING THEIR CHEMICAL OR PHYSICAL PROPERTIES
- G01N33/00—Investigating or analysing materials by specific methods not covered by groups G01N1/00 - G01N31/00
- G01N33/26—Oils; Viscous liquids; Paints; Inks
- G01N33/28—Oils, i.e. hydrocarbon liquids
- G01N33/30—Oils, i.e. hydrocarbon liquids for lubricating properties
Definitions
- the present invention relates to a condition diagnosis method, a condition diagnosis device, and a program.
- Impedance analysis can be used to make it possible to derive the electrical properties of the material.
- Patent Literature 1 discloses a method of using blood as a target to be analyzed and measuring the dielectric constant of the blood while changing the frequency to measure damage to blood cells.
- Patent Literature 2 discloses a method of evaluating changes in the composition of an extraction solvent based on frequency characteristics of relative dielectric constant and relative dielectric loss factor.
- Materials used in actual devices include, for example, lubricants. Understanding the condition of the lubricant is extremely useful in preventing damage or the like to devices that use the lubricant. On the other hand, it is difficult to observe the target such as a lubricant by taking the target out of the device in a non-destructive manner.
- an object of the present invention is to provide a method for easily diagnosing the condition of a lubricant without destroying the target to be diagnosed.
- a condition diagnosis method including: a measurement step of measuring relative dielectric constant of a lubricant by applying a voltage to the lubricant while changing a frequency from an AC power source; a derivation step of deriving parameters indicating electrical properties of the lubricant by applying the relative dielectric constant measured in the measurement step to a theoretical formula; and a diagnosis step of diagnosing a condition of the lubricant using the parameters.
- a condition diagnosis device including: a measurement unit for measuring relative dielectric constant of a lubricant by applying a voltage to the lubricant while changing a frequency from an AC power source; a derivation unit for deriving parameters indicating electrical properties of the lubricant by applying the relative dielectric constant measured in the measurement unit to a theoretical formula; and a diagnosis unit for diagnosing a condition of the lubricant using the parameters.
- a lubricant used for lubricating components will be described as an example of a target to be diagnosed.
- the lubricant used here is grease having a characteristic of causing dielectric relaxation. More specifically, lithium 12-hydroxystearate grease and the like can be targeted.
- Grease generally is composed of a base oil, a thickener, and additives. Although the details will be described later, the values of the parameters indicating the electrical properties will fluctuate depending on the configuration or condition of the grease.
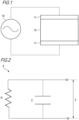
- Fig. 1 is a conceptual diagram showing the configuration of a lubricant (here, grease) and an AC power source when evaluating (measuring) the electrical properties of the lubricant according to the present embodiment. Electric power is supplied from an AC power source 10 to grease 12 filled between electrodes 11.
- the distance between the electrodes 11 here may be configured on the order of mm, for example.
- Fig. 2 is a diagram showing an electrically equivalent electric circuit around the grease 12 shown in Fig. 1 .
- An electric circuit E has a configuration in which a capacitor C composed of the grease 12 and a resistance R caused by peripheral elements are connected in parallel.
- the impedance of the electric circuit E is indicated by Z.
- Fig. 3 is a schematic configuration diagram showing an example of the overall configuration of a system to which the condition diagnosis method according to the present embodiment can be applied.
- Fig. 3 shows a condition diagnosis device 30 using the condition diagnosis method according to the present embodiment, a measurement device 31, and material inclusions 32 including the grease 12 which is a target to be diagnosed. Note that the configuration shown in Fig. 1 is an example, and a different configuration may be used depending on the target to be diagnosed and the like.
- the measurement device 31 includes the AC power source 10 shown in Fig. 1 , and applies power to the grease 12 contained in the material inclusions 32 during diagnosis.
- the condition diagnosis device 30 instructs the measurement device 31 to use the AC voltage V of the angular frequency ⁇ of the AC power source 10 as the input value of the power to be applied to the grease 12, and acquires the impedance
- the condition diagnosis device 30 may be realized by, for example, an information processing device including a control device, a storage device, and an output device (not shown).
- the control device may be composed of a central processing unit (CPU), a micro processing unit (MPU), a digital single processor (DSP), a dedicated circuit, or the like.
- the storage device is composed of volatile and non-volatile storage media such as a hard disk drive (HDD), a read only memory (ROM), and a random access memory (RAM), and it is possible to input and output various information to and from the storage device according to the instruction from the control device.
- the output device is composed of a speaker, a light, a display device such as a liquid crystal display, or the like, and notifies the operator according to the instruction from the control device.
- the output method by the output device is not particularly limited.
- the output device may be a network interface having a communication function, and may perform an output operation by transmitting data to an external device (not shown) via a network (not shown).
- condition diagnosis device 30 and the measurement device 31 are not particularly limited.
- the condition diagnosis device 30 and the measurement device 31 may be connected by wire or wirelessly.
- the condition diagnosis device 30 and the measurement device 31 may be integrated.
- the user may be in charge of data input/output between the condition diagnosis device 30 and the measurement device 31.
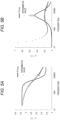
- Figs. 4A and 4B are diagrams for explaining the tendency of changes in relative dielectric constant and relative dielectric loss factor according to changes in frequency.
- the lithium 12-hydroxystearate grease will be described as an example of the grease 12.
- the dielectric relaxation phenomenon is confirmed by sweeping the frequency and measuring the relative dielectric constant ⁇ r ' and the relative dielectric loss factor ⁇ r " of the grease 12.
- Fig. 4A shows experimental values obtained from the grease 12. As shown in Fig. 4A , the relative dielectric constant ⁇ r ' tends to decrease (monotonically decrease) as the frequency increases.
- Fig. 4B shows experimental values obtained from the grease 12. As shown in Fig. 4B , the relative dielectric loss factor ⁇ r " once decreases as the frequency increases, then tends to increase and then decrease again.
- the following seven parameters are to be derived as parameters indicating the electrical properties of the grease 12.
- the electrical properties of the grease 12 based on the dielectric relaxation phenomenon have a tendency to change as shown in Figs. 4A and 4B .
- various parameters are derived by fitting to various theoretical formulas. Three theoretical formulas will be described here as examples, but the present invention is not limited to these. For example, other theoretical formulas may be used as long as each of the above seven parameters can be derived more accurately. Unless otherwise specified, when the same symbols are shown for the symbols used in each theoretical formula, this means that the symbols are indicating the same thing.
- Figs. 5A and 5B compare the curve obtained by fitting to the Debye type theoretical formula and the values obtained by experiment.
- the experimental values in Figs. 5A and 5B are the same as those in Figs. 4A and 4B , respectively.
- the relaxation times ⁇ (peak positions) match.
- non-matching results are shown for other parameters.
- Figs. 6A and 6B compare the curve obtained by fitting to the Cole-Cole type theoretical formula and the values obtained by experiment.
- the experimental values in Figs. 6A and 6B are the same as those in Figs. 4A and 4B , respectively.
- the theoretical formula can express the tendency of the experimental values by fitting.
- the relaxation times ⁇ (peak position) match, but as indicated by the dashed line, the result of non-matching between the theoretical and experimental values in the tendency of relative dielectric loss factor in the low frequency range is shown.
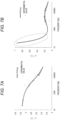
- Figs. 7A and 7B compare the curve obtained by fitting to the Cole-Cole improved type theoretical formula and the values obtained by experiment.
- the experimental values in Figs. 7A and 7B are the same as those in Figs. 4A and 4B , respectively.
- the theoretical formula can express the tendency of the experimental values by fitting, similar to the Cole-Cole type.
- the theoretical values can express the tendency of the experimental values by fitting.
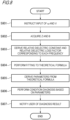
- Fig. 8 is a flowchart of condition diagnosis processing according to the present embodiment. This processing is executed by the condition diagnosis device 30.
- the control device (not shown) included in the condition diagnosis device 30 may be realized by reading a program from a storage device (not shown) for realizing the processing according to the present embodiment and executing the program.
- condition diagnosis device 30 controls the measurement device 31 to apply power of the AC voltage V with the angular frequency ⁇ to the grease 12 using the AC power source 10 included in the measurement device 31. As a result, the AC voltage V having the angular frequency ⁇ is applied to the grease 12.
- the condition diagnosis device 30 acquires the impedance
- the condition diagnosis device 30 derives the relative dielectric constant and the relative dielectric loss factor corresponding to each frequency based on the information on the impedance
- a known method may be used for the derivation method here.
- the relative dielectric constant and the relative dielectric loss factor are derived by the measurement device 31, and the relative dielectric constant and the relative dielectric loss factor may be output to the condition diagnosis device 30 as the measurement results together with the impedance
- condition diagnosis device 30 fits the obtained measurement result to the above-described theoretical formula.
- condition diagnosis device 30 performs fitting to the Cole-Cole improved type theoretical formulas shown in Formulas (9) to (11).
- condition diagnosis device 30 derives various parameters from the result of fitting in S804. Note that it is not necessary to derive all of the seven parameters described above at the same time, and for example, only necessary parameters may be derived according to the item which is a target to be diagnosed. The necessary parameters here may be set in any manner by the user who makes the diagnosis. In addition, an example of the relationship between each parameter and diagnostic items will be described later.
- the condition diagnosis device 30 diagnoses the condition of the grease 12 based on each of the parameters derived in S805.
- a threshold value may be set for each parameter, and normality or abnormality may be diagnosed by comparison with the threshold value.
- a plurality of threshold values may be set according to the degree of urgency of the abnormality, and the degree of urgency may be diagnosed by comparing with these threshold values.
- the condition diagnosis device 30 notifies the user of the diagnosis result obtained in S806.
- the notification method here is not particularly limited, for example, the parameters or items determined to be abnormal may be displayed on the screen or notified by voice. Then, this processing flow ends.
- Figs. 9A, 9B and 10 the relationship between the amount of thickener in the grease 12 and the parameters will be described.
- an example of grease with the following composition is shown.
- the amount of the three thickeners (proportion [%] in grease) is shown as an example.
- the horizontal axis indicates the frequency [Hz]
- the vertical axis indicates the relative dielectric constant ⁇ r '.
- the relative dielectric constant tends to decrease (monotonically decrease) as the frequency increases regardless of the amount of thickener. This tendency is similar to that described with reference to Fig. 4A .
- the relative dielectric constant ⁇ r0 at the low-frequency limit differs depending on the amount of thickener.
- the degree of change in relative dielectric constant with change in frequency differs depending on the amount of thickener.
- the fluctuation in the amount of thickener has little effect on the relative dielectric constant.
- the dielectric constant (the relative dielectric constant ⁇ r0 at the low-frequency limit) increases according to the amount of thickener.
- the dielectric constant (the relative dielectric constant ⁇ r ⁇ at the high-frequency limit) fluctuates little depending on the amount of the thickener. For this reason, a difference occurs in the relative dielectric constant ⁇ r0 at the low-frequency limit according to changes in amount of thickener, as shown in Fig. 9A .
- Fig. 9B the horizontal axis indicates the frequency [Hz], and the vertical axis indicates the relative dielectric loss factor ⁇ r ". As shown in Fig. 9B , the relative dielectric loss factor ⁇ r " once decreases as the frequency increases, then tends to increase and then decrease again. This tendency is similar to that described with reference to Fig. 4B .
- Fig. 10 summarizes the parameters derived from the values shown in Fig. 9 .
- various parameters fluctuate as the amount of the thickener fluctuates.
- the change in the amount of thickener can be specified by referring to the parameters (in particular, the relative dielectric constant ⁇ r0 at the low-frequency limit) derived in the present embodiment.
- Fig. 11 is a diagram for explaining the relationship between the type of base oil, the amount of thickener, and the relaxation strength.
- the horizontal axis indicates the amount of thickener (proportion in grease) [%]
- the vertical axis indicates the relaxation strength ( ⁇ r0 - ⁇ r ⁇ ).
- two types of mineral oil-based, ester-based, and ester/PAO-based base oils are shown as examples.
- the relaxation strength increases as the amount of thickener increases. Therefore, regardless of the type of base oil, the amount of thickener can be specified by referring to the relaxation strength.
- Fig. 12 is a diagram for explaining the fiber state of thickener contained in the grease 12.
- a grease containing a thickener of which the fiber structure was destroyed was produced by subjecting the grease 12 to roll processing under the following conditions.
- Fig. 12A shows an example of the condition before roll processing, in which the fiber structure is maintained.
- Fig. 12B shows an example of the condition after roll processing, in which the fiber structure is destroyed.
- the unit of scale is ⁇ m.
- the fiber state here is an example, and is not limited to this.
- the horizontal axis indicates the frequency [Hz]
- the vertical axis indicates the relative dielectric constant ⁇ r '.
- the relative dielectric constant tends to decrease (monotonically decrease) as the frequency increases regardless of the fiber state of the thickener. This tendency is similar to that described with reference to Fig.
- the relative dielectric constant ⁇ r0 at the low-frequency limit differs depending on the fiber state of thickener. Furthermore, the degree of change in relative dielectric constant with change in frequency differs depending on the fiber state of thickener. On the other hand, in the high frequency range, the fluctuation in the amount of thickener has little effect on the relative dielectric constant.
- the horizontal axis indicates the frequency [Hz]
- the vertical axis indicates the relative dielectric loss factor ⁇ r ".
- the relative dielectric loss factor increases once as the frequency increases, and then tends to decrease. This tendency is similar to that described with reference to Fig. 4B .
- the difference due to the fiber state of thickener is small, but there is a difference in the peak and distribution of the relative dielectric loss factor and the position of the peak (relaxation time ⁇ ).
- the constant ⁇ which represents the distribution of relaxation time, tends to decrease when the fiber structure is destroyed.
- Fig. 14 summarizes the parameters derived from the values shown in Figs. 13A and 13B .
- various parameters fluctuate as the fiber state of the thickener fluctuates.
- the parameters derived in the present embodiment especially the relaxation time and the constant indicating the distribution of the relaxation time
- Figs. 15A to 17B the relationship between deterioration (oxidative deterioration) of the grease 12 and the parameters will be described.
- Figs. 15A to 16B are diagrams for explaining the relationship between the frequency and the deterioration (oxidative deterioration, that is, increase in oxygen consumption) degree of the base oil that forms the grease 12.
- Fig. 15A the horizontal axis indicates the frequency [Hz], and the vertical axis indicates the relative dielectric constant ⁇ r '. As shown in Fig. 15A , the relative dielectric constant is almost constant regardless of the changes in frequency. In addition, the relative dielectric constant increases as the oxygen consumption increases.
- the horizontal axis indicates the oxygen consumption [%]
- the vertical axis indicates the average dielectric constant ⁇ r ' - .
- the average dielectric constant increases as the oxygen consumption increases.
- the average dielectric constant increases as the polarity of the molecules in the base oil increases.
- the base oil is conventionally non-polar (for example, in a new condition), but becomes more polar due to oxidative deterioration. Therefore, the average dielectric constant increases due to oxidative deterioration of the base oil.
- the horizontal axis indicates the frequency [Hz]
- the vertical axis indicates the relative dielectric loss factor ⁇ r ".
- the relative dielectric loss factor in the low frequency range increases as the oxygen consumption increases.
- the horizontal axis indicates the oxygen consumption [%]
- the vertical axis indicates the DC conductivity ⁇ 0 .
- the DC conductivity increases as the oxygen consumption increases.
- the deterioration degree of the base oil can be specified by referring to changes in various parameters (in particular, the average dielectric constant and the DC conductivity) derived in the present embodiment.
- Figs. 17A and 17B are diagrams for explaining the relationship between the frequency and the relative dielectric constant and relative dielectric loss factor due to deterioration of grease. Shown here are the results of comparison between new grease and grease deteriorated by an oxidation stability tester.
- the horizontal axis indicates the frequency [Hz]
- the vertical axis indicates the relative dielectric constant ⁇ r '.
- Both new grease and deteriorated grease tend to decrease in relative dielectric constant as the frequency increases. This tendency is similar to that described with reference to Fig. 4A .
- the average dielectric constants the deteriorated grease had a higher value.
- the average dielectric constant of new grease was 3.6
- the average dielectric constant of deteriorated grease was 3.8.
- the horizontal axis indicates the frequency [Hz]
- the vertical axis indicates the relative dielectric loss factor.
- the DC conductivity of the new grease was 1.4
- the DC conductivity of the deteriorated grease was 42.
- the deterioration degree of the grease 12 can be specified by referring to changes in various parameters (in particular, the average dielectric constant and the DC conductivity) derived in the present embodiment.
- Figs. 18A to 19 the relationship between the water content in the grease 12 and the parameters will be described.
- Figs. 18A and 18B is a diagram for explaining the relationship between the water content in the grease 12 and the relative dielectric constant ⁇ r ' and the relative dielectric loss factor ⁇ r ".
- the voltage is 1.0 V
- the frequency is in the range of 30 Hz to 1 MHz.
- the horizontal axis indicates the logarithm of the frequency [Hz]
- the vertical axis indicates the relative dielectric constant ⁇ r '.
- the relative dielectric constant ⁇ r ' tends to show a substantially constant value depending on the water content regardless of the changes in frequency.
- the relative dielectric constant ⁇ r ' tends to show a higher value as the water content in the grease 12 increases.
- the horizontal axis indicates the logarithm of the frequency [Hz]
- the vertical axis indicates the relative dielectric loss factor ⁇ r ".
- Fig. 19 is a diagram for explaining the relationship between the water content in the grease 12 and the average dielectric constant ⁇ r ' - .
- the horizontal axis indicates the water content [% wt] in the grease 12
- the vertical axis indicates the average dielectric constant ⁇ r ' - .
- the grease 12 is completely mixed with water.
- the average dielectric constant ⁇ r ' - tends to increase (monotonically increase) as the water content increases.
- Fig. 20 is a diagram for explaining the relationship between the iron powder amount in the grease 12 and the relative dielectric loss factor ⁇ r ". Due to the presence of iron powder in the grease 12, the DC conductivity ⁇ 0 extremely increases. While the change in DC conductivity due to other factors is on a scale of approximately 10 to 100 times, the increase in DC conductivity due to the contamination (increase) of iron powder shows a change of 10 6 or more. Here, detection is performed focusing on the change.
- the voltage is 1.0 V
- the frequency is in the range of 30 Hz to 1 MHz.
- the horizontal axis indicates the logarithm of the frequency [Hz], and the vertical axis indicates the relative dielectric loss factor ⁇ r ".
- the iron powder amount contained in the grease 12 is 0%, 10%, 15%, and 20%.
- the DC conductivity ⁇ 0 is 2.0 ⁇ 10 -10 S, 5.4 ⁇ 10 -3 S, 1.9 ⁇ 10 -2 S, and 2.0 ⁇ 10S.
- the value of the DC conductivity ⁇ 0 is extremely different depending on the iron powder amount in the grease 12. Therefore, by evaluating the value of the DC conductivity ⁇ 0 , it is possible to measure the iron powder amount in the grease 12, that is, the contamination of iron powder.
- parameters related to dielectric relaxation are derived as electrical properties for specifying the condition of a lubricant (grease in the present example).
- Each parameter can be used when specifying the condition of the lubricant as follows.
- Relative dielectric constant ( ⁇ r0 ) at low-frequency limit amount of thickener
- each parameter and the condition of the lubricant is an example, and is not limited to the above.
- one condition item may be diagnosed from a plurality of parameters, or a plurality of condition items may be diagnosed from one parameter. Further, the condition may be diagnosed after specifying the correlation between the parameters and the condition according to the composition that forms the lubricant.
- the present embodiment it is possible to specify the parameters indicating the electrical properties of the lubricant without destroying the target to be diagnosed. Then, it is possible to easily diagnose the condition of the lubricant based on the parameters indicating the electrical properties.
- a program or application for realizing the functions of one or more embodiments described above is supplied to a system or device using a network or a storage medium, and can be realized by processing executed as one or more processors in the computer of the system or device reads the program.
- circuit that realizes one or more functions may realize an application specific integrated circuit (ASIC) or a field programmable gate array (FPGA).
- ASIC application specific integrated circuit
- FPGA field programmable gate array
- the present invention is not limited to the above-described embodiments, it is also possible for those skilled in the art to combine each configuration of the embodiments with each other, modify and apply based on the description of the specification and well-known technology, and the combinations, modifications, and applications are within the scope for which protection is sought.
Landscapes
- Chemical & Material Sciences (AREA)
- Health & Medical Sciences (AREA)
- Life Sciences & Earth Sciences (AREA)
- Physics & Mathematics (AREA)
- Immunology (AREA)
- Analytical Chemistry (AREA)
- Biochemistry (AREA)
- General Health & Medical Sciences (AREA)
- General Physics & Mathematics (AREA)
- Chemical Kinetics & Catalysis (AREA)
- Pathology (AREA)
- Electrochemistry (AREA)
- Engineering & Computer Science (AREA)
- General Chemical & Material Sciences (AREA)
- Oil, Petroleum & Natural Gas (AREA)
- Food Science & Technology (AREA)
- Medicinal Chemistry (AREA)
- Spectroscopy & Molecular Physics (AREA)
- Investigating Or Analyzing Materials By The Use Of Electric Means (AREA)
- Lubricants (AREA)
- Testing Of Devices, Machine Parts, Or Other Structures Thereof (AREA)
- Testing Relating To Insulation (AREA)
Abstract
Description
- The present invention relates to a condition diagnosis method, a condition diagnosis device, and a program.
- Conventionally, when diagnosing the condition of materials, methods such as physical property analysis (for example, apparent viscosity), chemical component analysis (for example, deterioration degree), and structural analysis using a microscope are used. Such methods generally require complicated operations. Moreover, it is difficult to perform the above-described methods non-destructively on the target, and in many cases, the target to be diagnosed is discarded.
- On the other hand, there is a method of performing impedance analysis using an AC power source. Impedance analysis can be used to make it possible to derive the electrical properties of the material.
- For example,
Patent Literature 1 discloses a method of using blood as a target to be analyzed and measuring the dielectric constant of the blood while changing the frequency to measure damage to blood cells. Further,Patent Literature 2 discloses a method of evaluating changes in the composition of an extraction solvent based on frequency characteristics of relative dielectric constant and relative dielectric loss factor. -
- Patent Literature 1:
JP-A-2008-215901 - Patent Literature 2:
JP-A-H7-239316 - Materials used in actual devices include, for example, lubricants. Understanding the condition of the lubricant is extremely useful in preventing damage or the like to devices that use the lubricant. On the other hand, it is difficult to observe the target such as a lubricant by taking the target out of the device in a non-destructive manner.
- In view of the above problems, an object of the present invention is to provide a method for easily diagnosing the condition of a lubricant without destroying the target to be diagnosed.
- In order to solve the above problems, the present invention has the following configuration. In other words, there is provided a condition diagnosis method including: a measurement step of measuring relative dielectric constant of a lubricant by applying a voltage to the lubricant while changing a frequency from an AC power source; a derivation step of deriving parameters indicating electrical properties of the lubricant by applying the relative dielectric constant measured in the measurement step to a theoretical formula; and a diagnosis step of diagnosing a condition of the lubricant using the parameters.
- Moreover, another aspect of the present invention has the following structure. In other words, there is provided a condition diagnosis device including: a measurement unit for measuring relative dielectric constant of a lubricant by applying a voltage to the lubricant while changing a frequency from an AC power source; a derivation unit for deriving parameters indicating electrical properties of the lubricant by applying the relative dielectric constant measured in the measurement unit to a theoretical formula; and a diagnosis unit for diagnosing a condition of the lubricant using the parameters.
- Moreover, another aspect of the present invention has the following structure. In other words, there is provided a program for causing a computer to execute a measurement step of measuring relative dielectric constant of a lubricant by applying a voltage to the lubricant while changing a frequency from an AC power source, a derivation step of deriving parameters indicating electrical properties of the lubricant by applying the relative dielectric constant measured in the measurement step to a theoretical formula, and a diagnosis step of diagnosing a condition of the lubricant using the parameters.
- According to the present invention, it is possible to easily diagnose the condition of a lubricant without destroying the target to be diagnosed.
-
-
Fig. 1 is a conceptual diagram showing a configuration of a lubricant which is a target to be diagnosed and an AC power source according to the present invention. -
Fig. 2 is a diagram for explaining an equivalent circuit composed of a lubricant which is a target to be diagnosed and an AC power source according to the present invention. -
Fig. 3 is a schematic configuration diagram showing an example of a device configuration according to the present invention. -
Figs. 4A and 4B are diagrams for explaining a relationship between frequency, and relative dielectric constant and relative dielectric loss factor. -
Figs. 5A and 5B are diagrams for explaining derivation of parameters by fitting to a theoretical formula (Debye type). -
Figs. 6A and 6B are diagrams for explaining derivation of parameters by fitting to a theoretical formula (Cole-Cole type). -
Figs. 7A and 7B are diagrams for explaining derivation of parameters by fitting to a theoretical formula (Cole-Cole improved type). -
Fig. 8 is a flowchart of condition diagnosis processing according to one embodiment of the present invention. -
Figs. 9A and 9B are diagrams for explaining a relationship between a condition of the lubricant and parameters. -
Fig. 10 is a diagram for explaining a relationship between a condition of the lubricant and parameters. -
Fig. 11 is a diagram for explaining a relationship between a thickener and relaxation strength. -
Figs. 12A and 12B are diagrams for explaining a roll state of the thickener. -
Figs. 13A and 13B are diagrams for explaining a relationship between frequency and parameters according to a fiber state of thickener. -
Fig. 14 is a diagram for explaining a relationship between frequency and parameters according to a fiber state of thickener. -
Figs. 15A and 15B are diagrams for explaining a relationship between deterioration of base oil and relative dielectric constant. -
Figs. 16A and 16B are diagrams for explaining a relationship between deterioration of base oil and relative dielectric loss factor. -
Figs. 17A and 17B are diagrams for explaining a relationship between deterioration of grease and parameters. -
Figs. 18A and 18B are diagrams for explaining a relationship between a water content in grease and parameters. -
Fig. 19 is a diagram for explaining a relationship between a water content in grease and average dielectric constant. -
Fig. 20 is a diagram for explaining a relationship between an iron powder amount in grease and relative dielectric loss factor. - Hereinafter, embodiments of the present invention will be described below with reference to the drawings. In addition, the embodiment described below is one embodiment for describing the present invention, and is not intended to be construed as limiting the present invention. Not all configurations are essential configurations for solving the problems of the present invention. Moreover, in each drawing, the same component is indicated by the same reference number to indicate the correspondence relationship.
- In the present embodiment, a lubricant used for lubricating components will be described as an example of a target to be diagnosed. The lubricant used here is grease having a characteristic of causing dielectric relaxation. More specifically, lithium 12-hydroxystearate grease and the like can be targeted. Grease generally is composed of a base oil, a thickener, and additives. Although the details will be described later, the values of the parameters indicating the electrical properties will fluctuate depending on the configuration or condition of the grease.
- In the present embodiment, assuming that the grease is in a bulk state, parameters indicating electrical properties corresponding to the internal condition are derived, and the condition of the grease is diagnosed using the parameters.
Fig. 1 is a conceptual diagram showing the configuration of a lubricant (here, grease) and an AC power source when evaluating (measuring) the electrical properties of the lubricant according to the present embodiment. Electric power is supplied from anAC power source 10 to grease 12 filled betweenelectrodes 11. In addition, the distance between theelectrodes 11 here may be configured on the order of mm, for example. -
Fig. 2 is a diagram showing an electrically equivalent electric circuit around thegrease 12 shown inFig. 1 . An electric circuit E has a configuration in which a capacitor C composed of thegrease 12 and a resistance R caused by peripheral elements are connected in parallel. In addition, the impedance of the electric circuit E is indicated by Z. Here, the AC voltage V applied to the electric circuit E, the current I flowing through the electric circuit E, and the complex impedance Z of the entire electric circuit E are expressed by the following Equations (1) to (3).


- j: Imaginary number
- ω: Angular frequency of voltage
- t: Time
- θ: Phase angle (phase shift between voltage and current)
-
Fig. 3 is a schematic configuration diagram showing an example of the overall configuration of a system to which the condition diagnosis method according to the present embodiment can be applied.Fig. 3 shows acondition diagnosis device 30 using the condition diagnosis method according to the present embodiment, ameasurement device 31, andmaterial inclusions 32 including thegrease 12 which is a target to be diagnosed. Note that the configuration shown inFig. 1 is an example, and a different configuration may be used depending on the target to be diagnosed and the like. - The
measurement device 31 includes theAC power source 10 shown inFig. 1 , and applies power to thegrease 12 contained in thematerial inclusions 32 during diagnosis. - The
condition diagnosis device 30 instructs themeasurement device 31 to use the AC voltage V of the angular frequency ω of theAC power source 10 as the input value of the power to be applied to thegrease 12, and acquires the impedance |Z| (|Z| indicates the absolute value of Z) of thegrease 12 and the phase angle θ from themeasurement device 31 as corresponding outputs (measurement values). Then, thecondition diagnosis device 30 uses these values to derive parameters indicating the electrical properties of thegrease 12, and then performs diagnosis. Details of parameter types and derivation methods will be described later. - The
condition diagnosis device 30 may be realized by, for example, an information processing device including a control device, a storage device, and an output device (not shown). The control device may be composed of a central processing unit (CPU), a micro processing unit (MPU), a digital single processor (DSP), a dedicated circuit, or the like. The storage device is composed of volatile and non-volatile storage media such as a hard disk drive (HDD), a read only memory (ROM), and a random access memory (RAM), and it is possible to input and output various information to and from the storage device according to the instruction from the control device. The output device is composed of a speaker, a light, a display device such as a liquid crystal display, or the like, and notifies the operator according to the instruction from the control device. The output method by the output device is not particularly limited. In addition, the output device may be a network interface having a communication function, and may perform an output operation by transmitting data to an external device (not shown) via a network (not shown). - Further, the forms of the
condition diagnosis device 30 and themeasurement device 31 are not particularly limited. For example, thecondition diagnosis device 30 and themeasurement device 31 may be connected by wire or wirelessly. Alternatively, thecondition diagnosis device 30 and themeasurement device 31 may be integrated. Alternatively, the user may be in charge of data input/output between thecondition diagnosis device 30 and themeasurement device 31. -
Figs. 4A and 4B are diagrams for explaining the tendency of changes in relative dielectric constant and relative dielectric loss factor according to changes in frequency. Here, as described above, the lithium 12-hydroxystearate grease will be described as an example of thegrease 12. Using the configuration shown inFig. 3 , the dielectric relaxation phenomenon is confirmed by sweeping the frequency and measuring the relative dielectric constant εr' and the relative dielectric loss factor εr" of thegrease 12. - In
Fig. 4A , the horizontal axis indicates the frequency [Hz], and the vertical axis indicates the relative dielectric constant εr'.Fig. 4A shows experimental values obtained from thegrease 12. As shown inFig. 4A , the relative dielectric constant εr' tends to decrease (monotonically decrease) as the frequency increases. - In
Fig. 4B , the horizontal axis indicates the frequency [Hz], and the vertical axis indicates the relative dielectric loss factor εr".Fig. 4B shows experimental values obtained from thegrease 12. As shown inFig. 4B , the relative dielectric loss factor εr" once decreases as the frequency increases, then tends to increase and then decrease again. - In the present embodiment, the following seven parameters are to be derived as parameters indicating the electrical properties of the
grease 12. - εr0: Relative dielectric constant at low-frequency limit
- εr∞: Relative dielectric constant at high-frequency limit
- εr0 - εr∞: Relaxation strength
- εr'-: Average dielectric constant
- τ: Relaxation time [s]
- β: Constant indicating distribution of relaxation time
- σ0: DC conductivity [S/m]
- Although the details will be described later, the above parameters change depending on the internal condition of the
grease 12. Therefore, by deriving the parameters, it is possible to use the parameters for diagnosing the internal condition of the grease. - The electrical properties of the
grease 12 based on the dielectric relaxation phenomenon have a tendency to change as shown inFigs. 4A and 4B . In order to specify this change tendency, various parameters are derived by fitting to various theoretical formulas. Three theoretical formulas will be described here as examples, but the present invention is not limited to these. For example, other theoretical formulas may be used as long as each of the above seven parameters can be derived more accurately. Unless otherwise specified, when the same symbols are shown for the symbols used in each theoretical formula, this means that the symbols are indicating the same thing. - The fitting to the Debye type theoretical formula will be described. The Debye type theoretical formula is shown below.
[Math 1]
[Math 2]
ω: Angular frequency of voltage -
Figs. 5A and 5B compare the curve obtained by fitting to the Debye type theoretical formula and the values obtained by experiment. The experimental values inFigs. 5A and 5B are the same as those inFigs. 4A and 4B , respectively. As shown inFig. 5B , the relaxation times τ (peak positions) match. On the other hand, non-matching results are shown for other parameters. - The fitting to the Cole-Cole type theoretical formula will be described. The Cole-Cole type theoretical formula is shown below.
[Math 3]
[Math 4]
[Math 5]
- π: Circumference ratio
- f: Frequency
- In: Logarithmic function
-
Figs. 6A and 6B compare the curve obtained by fitting to the Cole-Cole type theoretical formula and the values obtained by experiment. The experimental values inFigs. 6A and 6B are the same as those inFigs. 4A and 4B , respectively. As shown inFig. 6A , with respect to the relative dielectric constant, the theoretical formula can express the tendency of the experimental values by fitting. On the other hand, referring toFig. 6B , the relaxation times τ (peak position) match, but as indicated by the dashed line, the result of non-matching between the theoretical and experimental values in the tendency of relative dielectric loss factor in the low frequency range is shown. - The fitting to the Cole-Cole improved type theoretical formula based on the Cole-Cole type will be described. The Cole-Cole improved type theoretical formula is shown below. Note that Formulas (9) and (11) are the same as Formulas (6) and (8) shown in the Cole-Cole type.
[Math 6]
[Math 7]
ε0: Dielectric constant of vacuum
[Math 8]
-
Figs. 7A and 7B compare the curve obtained by fitting to the Cole-Cole improved type theoretical formula and the values obtained by experiment. The experimental values inFigs. 7A and 7B are the same as those inFigs. 4A and 4B , respectively. As shown inFig. 7A , with respect to the relative dielectric constant, the theoretical formula can express the tendency of the experimental values by fitting, similar to the Cole-Cole type. Further, referring toFig. 7B , in addition to the relaxation time τ (peak position), with respect to the tendency of the relative dielectric loss factor in the low frequency range, the theoretical values can express the tendency of the experimental values by fitting. - By performing fitting to the above theoretical formula, as the parameters of the electrical properties of the
grease 12, it is possible to derive the relative dielectric constant at the low-frequency limit and high-frequency limit, the relaxation strength, the average dielectric constant, the relaxation time, the distribution of relaxation time, and the DC conductivity. -
Fig. 8 is a flowchart of condition diagnosis processing according to the present embodiment. This processing is executed by thecondition diagnosis device 30. For example, the control device (not shown) included in thecondition diagnosis device 30 may be realized by reading a program from a storage device (not shown) for realizing the processing according to the present embodiment and executing the program. - In S801, the
condition diagnosis device 30 controls themeasurement device 31 to apply power of the AC voltage V with the angular frequency ω to thegrease 12 using theAC power source 10 included in themeasurement device 31. As a result, the AC voltage V having the angular frequency ω is applied to thegrease 12. - In S802, the
condition diagnosis device 30 acquires the impedance |Z| and the phase angle θ from themeasurement device 31 as an output for the input instructed in S801. That is, themeasurement device 31 outputs the impedance |Z| and the phase angle θ to thecondition diagnosis device 30 as the measurement results of thegrease 12 with respect to the input AC voltage V with the angular frequency ω. - In S803, the
condition diagnosis device 30 derives the relative dielectric constant and the relative dielectric loss factor corresponding to each frequency based on the information on the impedance |Z| and the phase angle θ obtained in S802, and the information of the AC voltage V with the angular frequency ω instructed in S801. A known method may be used for the derivation method here. Further, the relative dielectric constant and the relative dielectric loss factor are derived by themeasurement device 31, and the relative dielectric constant and the relative dielectric loss factor may be output to thecondition diagnosis device 30 as the measurement results together with the impedance |Z| and the phase angle θ. - In S804, the
condition diagnosis device 30 fits the obtained measurement result to the above-described theoretical formula. For example, thecondition diagnosis device 30 performs fitting to the Cole-Cole improved type theoretical formulas shown in Formulas (9) to (11). - In S805, the
condition diagnosis device 30 derives various parameters from the result of fitting in S804. Note that it is not necessary to derive all of the seven parameters described above at the same time, and for example, only necessary parameters may be derived according to the item which is a target to be diagnosed. The necessary parameters here may be set in any manner by the user who makes the diagnosis. In addition, an example of the relationship between each parameter and diagnostic items will be described later. - In S806, the
condition diagnosis device 30 diagnoses the condition of thegrease 12 based on each of the parameters derived in S805. Although the content of diagnosis here is not particularly limited, for example, a threshold value may be set for each parameter, and normality or abnormality may be diagnosed by comparison with the threshold value. Alternatively, a plurality of threshold values may be set according to the degree of urgency of the abnormality, and the degree of urgency may be diagnosed by comparing with these threshold values. - In S807, the
condition diagnosis device 30 notifies the user of the diagnosis result obtained in S806. Although the notification method here is not particularly limited, for example, the parameters or items determined to be abnormal may be displayed on the screen or notified by voice. Then, this processing flow ends. - The relationship between the various parameters derived by the above-described method and the condition of the lubricant (the
grease 12 in this case) will be described below. - In
Figs. 9A, 9B and10 , the relationship between the amount of thickener in thegrease 12 and the parameters will be described. Here, an example of grease with the following composition is shown. In addition, the amount of the three thickeners (proportion [%] in grease) is shown as an example. - Base oil: ester + mineral oil
- Thickener: 12OH (lithium 12-hydroxystearate grease: 12-OHStLi) (short fiber)
- Amount of thickener: 3%, 7.5%, 15%
- In
Fig. 9A , the horizontal axis indicates the frequency [Hz], and the vertical axis indicates the relative dielectric constant εr'. As shown inFig. 9A , the relative dielectric constant tends to decrease (monotonically decrease) as the frequency increases regardless of the amount of thickener. This tendency is similar to that described with reference toFig. 4A . On the other hand, the relative dielectric constant εr0 at the low-frequency limit differs depending on the amount of thickener. Furthermore, the degree of change in relative dielectric constant with change in frequency differs depending on the amount of thickener. On the other hand, in the high frequency range, the fluctuation in the amount of thickener has little effect on the relative dielectric constant. - Since the
grease 12 contains the thickener, an electric field opposite to the external electric field applied to thegrease 12 is generated in the low frequency region. As a result, in the low frequency region, the dielectric constant (the relative dielectric constant εr0 at the low-frequency limit) increases according to the amount of thickener. On the other hand, in the high frequency region, an electric field opposite to the external electric field applied to thegrease 12 is not generated. Therefore, in the high frequency region, the dielectric constant (the relative dielectric constant εr∞ at the high-frequency limit) fluctuates little depending on the amount of the thickener. For this reason, a difference occurs in the relative dielectric constant εr0 at the low-frequency limit according to changes in amount of thickener, as shown inFig. 9A . - In
Fig. 9B , the horizontal axis indicates the frequency [Hz], and the vertical axis indicates the relative dielectric loss factor εr". As shown inFig. 9B , the relative dielectric loss factor εr" once decreases as the frequency increases, then tends to increase and then decrease again. This tendency is similar to that described with reference toFig. 4B . -
Fig. 10 summarizes the parameters derived from the values shown inFig. 9 . As shown inFig. 10 , it can be seen that various parameters fluctuate as the amount of the thickener fluctuates. In other words, it can be understood that there is a correlation between the amount of thickener and the parameters indicating the electrical properties. Therefore, the change in the amount of thickener can be specified by referring to the parameters (in particular, the relative dielectric constant εr0 at the low-frequency limit) derived in the present embodiment. -
Fig. 11 is a diagram for explaining the relationship between the type of base oil, the amount of thickener, and the relaxation strength. InFig. 11 , the horizontal axis indicates the amount of thickener (proportion in grease) [%], and the vertical axis indicates the relaxation strength (εr0 - εr∞). In addition, two types of mineral oil-based, ester-based, and ester/PAO-based base oils are shown as examples. As indicated by the straight line inFig. 11 , regardless of the type of base oil, the relaxation strength increases as the amount of thickener increases. Therefore, regardless of the type of base oil, the amount of thickener can be specified by referring to the relaxation strength. - In
Figs. 12A to 14 , the relationship between the fiber state of thickener in thegrease 12 and the parameters will be described. -
Fig. 12 is a diagram for explaining the fiber state of thickener contained in thegrease 12. Here, a grease containing a thickener of which the fiber structure was destroyed was produced by subjecting thegrease 12 to roll processing under the following conditions. - Base oil: Mineral oil
- Thickener: 12-OHStLi
- Roll pressure: 1 [MPa]
- Number of rolls: 5 times
-
Fig. 12A shows an example of the condition before roll processing, in which the fiber structure is maintained.Fig. 12B shows an example of the condition after roll processing, in which the fiber structure is destroyed. InFigs. 12A and 12B , the unit of scale is µm. In addition, the fiber state here is an example, and is not limited to this. - In
Fig. 13A , the horizontal axis indicates the frequency [Hz], and the vertical axis indicates the relative dielectric constant εr'. As shown inFig. 13A , the relative dielectric constant tends to decrease (monotonically decrease) as the frequency increases regardless of the fiber state of the thickener. This tendency is similar to that described with reference to Fig. - 4A. On the other hand, the relative dielectric constant εr0 at the low-frequency limit differs depending on the fiber state of thickener. Furthermore, the degree of change in relative dielectric constant with change in frequency differs depending on the fiber state of thickener. On the other hand, in the high frequency range, the fluctuation in the amount of thickener has little effect on the relative dielectric constant.
- In
Fig. 13B , the horizontal axis indicates the frequency [Hz], and the vertical axis indicates the relative dielectric loss factor εr". As shown inFig. 13B , the relative dielectric loss factor increases once as the frequency increases, and then tends to decrease. This tendency is similar to that described with reference toFig. 4B . In the low frequency region, the difference due to the fiber state of thickener is small, but there is a difference in the peak and distribution of the relative dielectric loss factor and the position of the peak (relaxation time τ). For example, the constant β, which represents the distribution of relaxation time, tends to decrease when the fiber structure is destroyed. -
Fig. 14 summarizes the parameters derived from the values shown inFigs. 13A and 13B . As shown inFig. 14 , it can be seen that various parameters fluctuate as the fiber state of the thickener fluctuates. In other words, it can be understood that there is a correlation between the fiber state of thickener and the parameters indicating the electrical properties. Therefore, by referring to the parameters derived in the present embodiment (especially the relaxation time and the constant indicating the distribution of the relaxation time), it is possible to specify the change in the fiber state of thickener. - In
Figs. 15A to 17B , the relationship between deterioration (oxidative deterioration) of thegrease 12 and the parameters will be described.Figs. 15A to 16B are diagrams for explaining the relationship between the frequency and the deterioration (oxidative deterioration, that is, increase in oxygen consumption) degree of the base oil that forms thegrease 12. - In
Fig. 15A , the horizontal axis indicates the frequency [Hz], and the vertical axis indicates the relative dielectric constant εr'. As shown inFig. 15A , the relative dielectric constant is almost constant regardless of the changes in frequency. In addition, the relative dielectric constant increases as the oxygen consumption increases. - In
Fig. 15B , the horizontal axis indicates the oxygen consumption [%], and the vertical axis indicates the average dielectric constant εr'-. As shown inFig. 15B , the average dielectric constant increases as the oxygen consumption increases. - The average dielectric constant increases as the polarity of the molecules in the base oil increases. The base oil is conventionally non-polar (for example, in a new condition), but becomes more polar due to oxidative deterioration. Therefore, the average dielectric constant increases due to oxidative deterioration of the base oil.
- In
Fig. 16A , the horizontal axis indicates the frequency [Hz], and the vertical axis indicates the relative dielectric loss factor εr". As shown inFig. 16A , the relative dielectric loss factor in the low frequency range increases as the oxygen consumption increases. - In
Fig. 16B , the horizontal axis indicates the oxygen consumption [%], and the vertical axis indicates the DC conductivity σ0. As shown inFig. 16B , the DC conductivity increases as the oxygen consumption increases. - From the above, it can be understood that there is a correlation between the deteriorated condition of the base oil that forms the
grease 12 and the parameters indicating the electrical properties. Therefore, the deterioration degree of the base oil can be specified by referring to changes in various parameters (in particular, the average dielectric constant and the DC conductivity) derived in the present embodiment. -
Figs. 17A and 17B are diagrams for explaining the relationship between the frequency and the relative dielectric constant and relative dielectric loss factor due to deterioration of grease. Shown here are the results of comparison between new grease and grease deteriorated by an oxidation stability tester. InFig. 17A , the horizontal axis indicates the frequency [Hz], and the vertical axis indicates the relative dielectric constant εr'. Both new grease and deteriorated grease tend to decrease in relative dielectric constant as the frequency increases. This tendency is similar to that described with reference toFig. 4A . On the other hand, when comparing the average dielectric constants, the deteriorated grease had a higher value. Here, the average dielectric constant of new grease was 3.6, and the average dielectric constant of deteriorated grease was 3.8. - In
Fig. 17B , the horizontal axis indicates the frequency [Hz], and the vertical axis indicates the relative dielectric loss factor. In this case, when the DC conductivity σ0 was compared, the deteriorated grease had a higher value. Here, the DC conductivity of the new grease was 1.4, and the DC conductivity of the deteriorated grease was 42. - From the above, it can be understood that there is a correlation between the deteriorated condition of the
grease 12 and the parameters indicating the electrical properties. Therefore, the deterioration degree of thegrease 12 can be specified by referring to changes in various parameters (in particular, the average dielectric constant and the DC conductivity) derived in the present embodiment. - In
Figs. 18A to 19 , the relationship between the water content in thegrease 12 and the parameters will be described.Figs. 18A and 18B is a diagram for explaining the relationship between the water content in thegrease 12 and the relative dielectric constant εr' and the relative dielectric loss factor εr". Here, an example in which the measurement is performed while thegrease 12 contains 0 to 10% moisture, the voltage is 1.0 V, and the frequency is in the range of 30 Hz to 1 MHz will be described. - In
Fig. 18A , the horizontal axis indicates the logarithm of the frequency [Hz], and the vertical axis indicates the relative dielectric constant εr'. As shown inFig. 18A , the relative dielectric constant εr' tends to show a substantially constant value depending on the water content regardless of the changes in frequency. In addition, the relative dielectric constant εr' tends to show a higher value as the water content in thegrease 12 increases. - In
Fig. 18B , the horizontal axis indicates the logarithm of the frequency [Hz], and the vertical axis indicates the relative dielectric loss factor εr". As shown inFig. 18B , even when the water content in thegrease 12 increases, there is no significant difference in the change tendency of the relative dielectric loss factor. In other words, regardless of the water content, the change tendency of the relative dielectric loss factor εr" when the frequency fluctuates is almost the same. -
Fig. 19 is a diagram for explaining the relationship between the water content in thegrease 12 and the average dielectric constant εr'-. InFig. 19 , the horizontal axis indicates the water content [% wt] in thegrease 12, and the vertical axis indicates the average dielectric constant εr'-. Here, thegrease 12 is completely mixed with water. As shown inFig. 19 , the average dielectric constant εr'- tends to increase (monotonically increase) as the water content increases. - In view of the above, it can be understood that there is a correlation between the water content in the
grease 12 and the parameters indicating electrical properties, specifically the correlation between the relative dielectric constant εr' and the average dielectric constant εr'-. Therefore, by paying attention to these parameters, it is possible to specify the contamination of thegrease 12 with moisture. The deterioration of thegrease 12 has been described with reference toFigs. 15A to 17B , but the change tendency of the parameters at this time (for example, the average dielectric constant εr'- ofFig. 15B and the DC conductivity σ0 ofFig. 16B ) and the change tendency of the parameters shown inFigs. 18A and 18B or19 are different. Therefore, by capturing the difference in these changes, it is possible to separately detect the deterioration of the grease and the contamination of the grease with water. - In
Fig. 20 , the relationship between the iron powder amount in thegrease 12 and the parameters will be described.Fig. 20 is a diagram for explaining the relationship between the iron powder amount in thegrease 12 and the relative dielectric loss factor εr". Due to the presence of iron powder in thegrease 12, the DC conductivity σ0 extremely increases. While the change in DC conductivity due to other factors is on a scale of approximately 10 to 100 times, the increase in DC conductivity due to the contamination (increase) of iron powder shows a change of 106 or more. Here, detection is performed focusing on the change. Here, an example in which the measurement is performed while thegrease 12 contains 0 to 20% moisture, the voltage is 1.0 V, and the frequency is in the range of 30 Hz to 1 MHz will be described. - In
Fig. 20 , the horizontal axis indicates the logarithm of the frequency [Hz], and the vertical axis indicates the relative dielectric loss factor εr". Here, four examples are shown in which the iron powder amount contained in the grease 12 (weight ratio to the grease) is 0%, 10%, 15%, and 20%. When the iron powder amount is 0%, 10%, 15%, and 20%, the DC conductivity σ0 is 2.0 × 10⁻¹⁰S, 5.4 × 10⁻³S, 1.9 × 10⁻²S, and 2.0 × 10S. In other words, the value of the DC conductivity σ0 is extremely different depending on the iron powder amount in thegrease 12. Therefore, by evaluating the value of the DC conductivity σ0, it is possible to measure the iron powder amount in thegrease 12, that is, the contamination of iron powder. - In the present embodiment, parameters related to dielectric relaxation are derived as electrical properties for specifying the condition of a lubricant (grease in the present example). Each parameter can be used when specifying the condition of the lubricant as follows.
- Relative dielectric constant (εr0) at low-frequency limit: amount of thickener
- Relative dielectric constant (εr∞) at high-frequency limit: type of base oil
- Relaxation strength (εr0 - εr∞): amount of thickener
- Average dielectric constant (εr'-): deterioration degree of base oil, water content in grease
- Relaxation time (τ): fiber state of thickener, deterioration degree of grease
- Constant (β) that indicates distribution of relaxation time: fiber state of thickener, deterioration degree of grease
- DC conductivity (σ0): amount of thickener, deterioration degree of base oil, deterioration degree of grease, amount of additives, iron powder amount in grease
- Note that the correlation between each parameter and the condition of the lubricant is an example, and is not limited to the above. For example, one condition item may be diagnosed from a plurality of parameters, or a plurality of condition items may be diagnosed from one parameter. Further, the condition may be diagnosed after specifying the correlation between the parameters and the condition according to the composition that forms the lubricant.
- As described above, according to the present embodiment, it is possible to specify the parameters indicating the electrical properties of the lubricant without destroying the target to be diagnosed. Then, it is possible to easily diagnose the condition of the lubricant based on the parameters indicating the electrical properties.
- In addition, in the present invention, a program or application for realizing the functions of one or more embodiments described above is supplied to a system or device using a network or a storage medium, and can be realized by processing executed as one or more processors in the computer of the system or device reads the program.
- Further, the circuit that realizes one or more functions may realize an application specific integrated circuit (ASIC) or a field programmable gate array (FPGA).
- As described above, the present invention is not limited to the above-described embodiments, it is also possible for those skilled in the art to combine each configuration of the embodiments with each other, modify and apply based on the description of the specification and well-known technology, and the combinations, modifications, and applications are within the scope for which protection is sought.
- As described above, this specification discloses the following matters.
- (1) A condition diagnosis method including: a measurement step of measuring relative dielectric constant of a lubricant by applying a voltage to the lubricant while changing a frequency from an AC power source; a derivation step of deriving parameters indicating electrical properties of the lubricant by applying the relative dielectric constant measured in the measurement step to a theoretical formula; and a diagnosis step of diagnosing a condition of the lubricant using the parameters.
According to this configuration, it is possible to easily diagnose the condition of a lubricant without destroying the target to be diagnosed. - (2) The condition diagnosis method according to (1), in which the parameters include at least one of relative dielectric constant at low-frequency limit, relative dielectric constant at high-frequency limit, relaxation strength, average dielectric constant, relaxation time, distribution of relaxation time, and DC conductivity.
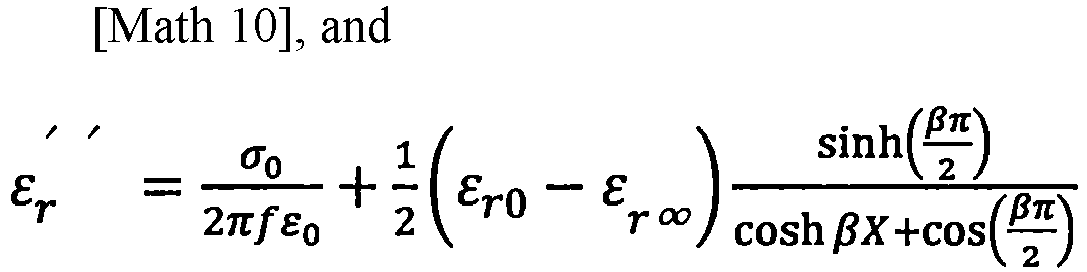
According to this configuration, it is possible to derive a plurality of parameters for diagnosing the condition of the lubricant. - (3) The condition diagnosis method according to (1) or (2), in which the theoretical formulas are expressed by


According to this configuration, it is possible to derive the theoretical values of the relative dielectric constant and the relative dielectric loss factor with higher accuracy. - (4) The condition diagnosis method according to any one of (1) to (3), in which the lubricant is in a bulk state.
According to this configuration, it is possible to diagnose the condition of the lubricant in the bulk state. - (5) The condition diagnosis method according to any one of (1) to (4), in which the lubricant is lubricating oil.
According to this configuration, it is possible to treat lubricating oil as a target to be diagnosed. - (6) The condition diagnosis method according to any one of (1) to (4), in which the lubricant is grease.
According to this configuration, grease can be treated as a target to be diagnosed. - (7) The condition diagnosis method according to (6), in which, in the diagnosis step, at least one of an amount of thickener, a fiber state of thickener, a deterioration degree of grease, a water content in grease, and an iron powder amount in grease is diagnosed as a condition of the grease.
According to this configuration, it is possible to diagnose a plurality of conditions of grease. - (8) A condition diagnosis device including: a measurement unit for measuring relative dielectric constant of a lubricant by applying a voltage to the lubricant while changing a frequency from an AC power source; a derivation unit for deriving parameters indicating electrical properties of the lubricant by applying the relative dielectric constant measured in the measurement unit to a theoretical formula; and a diagnosis unit for diagnosing a condition of the lubricant using the parameters.
According to this configuration, it is possible to easily diagnose the condition of a lubricant without destroying the target to be diagnosed. - (9) A program for causing a computer to execute a measurement step of measuring relative dielectric constant of a lubricant by applying a voltage to the lubricant while changing a frequency from an AC power source, a derivation step of deriving parameters indicating electrical properties of the lubricant by applying the relative dielectric constant measured in the measurement step to a theoretical formula, and a diagnosis step of diagnosing a condition of the lubricant using the parameters.
- According to this configuration, it is possible to easily diagnose the condition of a lubricant without destroying the target to be diagnosed.
- Although various embodiments have been described above with reference to the drawings, it is needless to say that the present invention is not limited to such examples. In a case of those skilled in the art, it is apparent that various modification examples or correction examples can be assumed within the scope described in the claims, and it is understood that the modification examples or correction examples belong to the technical scope of the present invention. Moreover, each component in the above embodiments may be combined in any manner without departing from the gist of the invention.
- This application is based on a Japanese patent application filed on
September 29, 2020 (Japanese patent application 2020-163961 August 25, 2021 (Japanese patent application 2021-137562 -
- 10
- AC power source
- 11
- Electrode
- 12
- Grease
- 30
- Condition diagnosis device
- 31
- Measurement device
- 32
- Material inclusion
Claims (9)
- A condition diagnosis method comprising:a measurement step of measuring relative dielectric constant of a lubricant by applying a voltage to the lubricant while changing a frequency from an AC power source;a derivation step of deriving parameters indicating electrical properties of the lubricant by applying the relative dielectric constant measured in the measurement step to a theoretical formula; anda diagnosis step of diagnosing a condition of the lubricant using the parameters.
- The condition diagnosis method according to claim 1, wherein
the parameters include at least one of relative dielectric constant at low-frequency limit, relative dielectric constant at high-frequency limit, relaxation strength, average dielectric constant, relaxation time, distribution of relaxation time, and DC conductivity. - The condition diagnosis method according to claim 1 or 2, wherein
the theoretical formulas are expressed by:


- The condition diagnosis method according to any one of claims 1 to 3, wherein
the lubricant is in a bulk state. - The condition diagnosis method according to any one of claims 1 to 4, wherein
the lubricant is lubricating oil. - The condition diagnosis method according to any one of claims 1 to 4, wherein
the lubricant is grease. - The condition diagnosis method according to claim 6, wherein
in the diagnosis step, at least one of an amount of thickener, a fiber state of thickener, a deterioration degree of grease, a water content in grease, and an iron powder amount in grease is diagnosed as a condition of the grease. - A condition diagnosis device comprising:a measurement unit for measuring relative dielectric constant of a lubricant by applying a voltage to the lubricant while changing a frequency from an AC power source;a derivation unit for deriving parameters indicating electrical properties of the lubricant by applying the relative dielectric constant measured by the measurement unit to a theoretical formula; anda diagnosis unit for diagnosing a condition of the lubricant using the parameters.
- A program for causing a computer to execute:a measurement step of measuring relative dielectric constant of a lubricant by applying a voltage to the lubricant while changing a frequency from an AC power source;a derivation step of deriving parameters indicating electrical properties of the lubricant by applying the relative dielectric constant measured in the measurement step to a theoretical formula; anda diagnosis step of diagnosing a condition of the lubricant using the parameters.
Applications Claiming Priority (3)
| Application Number | Priority Date | Filing Date | Title |
|---|---|---|---|
| JP2020163961 | 2020-09-29 | ||
| JP2021137562 | 2021-08-25 | ||
| PCT/JP2021/035203 WO2022071162A1 (en) | 2020-09-29 | 2021-09-24 | State diagnosis method, state diagnosis device, and program |
Publications (2)
| Publication Number | Publication Date |
|---|---|
| EP4224160A1 true EP4224160A1 (en) | 2023-08-09 |
| EP4224160A4 EP4224160A4 (en) | 2024-04-03 |
Family
ID=80951621
Family Applications (1)
| Application Number | Title | Priority Date | Filing Date |
|---|---|---|---|
| EP21875464.6A Pending EP4224160A4 (en) | 2020-09-29 | 2021-09-24 | CONDITION DIAGNOSIS METHOD, CONDITION DIAGNOSIS DEVICE AND PROGRAM |
Country Status (8)
| Country | Link |
|---|---|
| US (1) | US20230384252A1 (en) |
| EP (1) | EP4224160A4 (en) |
| JP (2) | JP7136378B1 (en) |
| KR (1) | KR102933378B1 (en) |
| CN (1) | CN116710764B (en) |
| BR (1) | BR112023005658A2 (en) |
| TW (1) | TWI887493B (en) |
| WO (1) | WO2022071162A1 (en) |
Families Citing this family (2)
| Publication number | Priority date | Publication date | Assignee | Title |
|---|---|---|---|---|
| JP7136378B1 (en) * | 2020-09-29 | 2022-09-13 | 日本精工株式会社 | Condition Diagnosis Method, Condition Diagnosis Device, and Program |
| KR20250102040A (en) | 2022-11-10 | 2025-07-04 | 가부시키가이샤 도우사 고가쿠 겐큐쇼 | Physiologically active peptide derivatives, pharmaceutical compositions, nasal and nasal preparations and use of physiologically active peptide derivatives for the treatment of eye diseases |
Family Cites Families (21)
| Publication number | Priority date | Publication date | Assignee | Title |
|---|---|---|---|---|
| JPS5885314A (en) * | 1981-11-17 | 1983-05-21 | Nissan Motor Co Ltd | Deterioration detector of engine oil |
| JPH07239316A (en) | 1994-02-28 | 1995-09-12 | Toshiba Corp | Extraction solvent composition measuring apparatus and method |
| JP2000338101A (en) * | 1999-05-28 | 2000-12-08 | Ngk Spark Plug Co Ltd | Oil deterioration detection method and oil deterioration detection device |
| KR100601494B1 (en) | 2000-11-23 | 2006-07-14 | 에스케이 주식회사 | Method and system for measuring salinity of oil using dielectric sensor |
| EP1439386A4 (en) | 2001-09-28 | 2005-01-19 | Ngk Spark Plug Co | Oil deterioration sensor |
| JP2007192769A (en) * | 2006-01-23 | 2007-08-02 | Ntn Corp | Lubricant deterioration detector, and bearing with detector |
| KR100776641B1 (en) * | 2006-06-27 | 2007-11-15 | 한국원자력연구원 | Degradation Evaluation Method of Polymeric Material Using Dielectric Relaxation Characteristics |
| JP4935425B2 (en) | 2007-03-01 | 2012-05-23 | ソニー株式会社 | Method for qualitative and / or quantitative analysis of blood cells and method for detecting blood deterioration |
| JP2008274987A (en) * | 2007-04-25 | 2008-11-13 | Nsk Ltd | Rolling device and inverter control drive motor |
| JP5055035B2 (en) * | 2007-06-19 | 2012-10-24 | 三菱重工業株式会社 | Oil deterioration detection device |
| JP4929204B2 (en) * | 2008-02-22 | 2012-05-09 | 三菱重工業株式会社 | Oil property management method and apparatus |
| JP2011080814A (en) * | 2009-10-06 | 2011-04-21 | Mitsubishi Heavy Ind Ltd | Device and method for detecting deterioration of lubricant for machine tool |
| KR101730679B1 (en) * | 2009-11-25 | 2017-04-26 | 이데미쓰 고산 가부시키가이샤 | Measurement method of degradation/alteration degree of lubricant oil and measurement device thereof |
| WO2011065339A1 (en) * | 2009-11-25 | 2011-06-03 | 出光興産株式会社 | Measuring method for degree of degradation of lubricating oil, and measuring device therefor, as well as lubricating oil monitoring system in machine and device |
| DE102010048950A1 (en) * | 2010-10-19 | 2012-04-19 | Airbus Operations Gmbh | Diagnostic system and diagnostic procedure, housing component of a lubricant reservoir |
| WO2014094813A1 (en) * | 2012-12-17 | 2014-06-26 | Aktiebolaget Skf | Matrix sensor for lubricating grease condition monitoring |
| WO2016185524A1 (en) | 2015-05-15 | 2016-11-24 | 株式会社アタゴ | Oil degradation meter and method for evaluating oil degradation |
| JP6782098B2 (en) * | 2016-05-27 | 2020-11-11 | Kyb株式会社 | Fluid identification device |
| JP7236308B2 (en) | 2019-03-29 | 2023-03-09 | 株式会社アドヴィックス | vehicle controller |
| JP7608850B2 (en) | 2020-03-05 | 2025-01-07 | 日本電気株式会社 | Electronic device, insole-type electronic device and monitoring system |
| JP7136378B1 (en) * | 2020-09-29 | 2022-09-13 | 日本精工株式会社 | Condition Diagnosis Method, Condition Diagnosis Device, and Program |
-
2021
- 2021-09-24 JP JP2022502568A patent/JP7136378B1/en active Active
- 2021-09-24 BR BR112023005658A patent/BR112023005658A2/en unknown
- 2021-09-24 EP EP21875464.6A patent/EP4224160A4/en active Pending
- 2021-09-24 CN CN202180080135.1A patent/CN116710764B/en active Active
- 2021-09-24 US US18/246,914 patent/US20230384252A1/en active Pending
- 2021-09-24 KR KR1020237014341A patent/KR102933378B1/en active Active
- 2021-09-24 WO PCT/JP2021/035203 patent/WO2022071162A1/en not_active Ceased
- 2021-09-29 TW TW110136278A patent/TWI887493B/en active
-
2022
- 2022-08-26 JP JP2022135043A patent/JP2022180381A/en active Pending
Also Published As
| Publication number | Publication date |
|---|---|
| JP7136378B1 (en) | 2022-09-13 |
| JPWO2022071162A1 (en) | 2022-04-07 |
| TW202223379A (en) | 2022-06-16 |
| TWI887493B (en) | 2025-06-21 |
| JP2022180381A (en) | 2022-12-06 |
| WO2022071162A1 (en) | 2022-04-07 |
| US20230384252A1 (en) | 2023-11-30 |
| CN116710764B (en) | 2026-01-16 |
| BR112023005658A2 (en) | 2023-04-25 |
| KR20230078747A (en) | 2023-06-02 |
| KR102933378B1 (en) | 2026-03-03 |
| EP4224160A4 (en) | 2024-04-03 |
| CN116710764A (en) | 2023-09-05 |
Similar Documents
| Publication | Publication Date | Title |
|---|---|---|
| Helal et al. | Simultaneous rheoelectric measurements of strongly conductive complex fluids | |
| US8854058B2 (en) | Measurement method of degradation/alteration degree of lubricant oil and measurement device thereof | |
| Nörtemann et al. | Dielectric properties of aqueous NaCl solutions at microwave frequencies | |
| US20230384252A1 (en) | State diagnosis method, state diagnosis device, and program | |
| US5518590A (en) | Electrochemical sensors for motor oils and other lubricants | |
| RU2682324C2 (en) | Haemolysis detection method and system | |
| Harvey et al. | Effect of oil quality on electrostatic charge generation and transport | |
| Trojánek et al. | Open circuit potential transients associated with single emulsion droplet collisions at an interface between two immiscible electrolyte solutions | |
| Preziosi et al. | Monitoring emulsion microstructure by using organic electrochemical transistors | |
| Li et al. | New method for acquisition of impedance spectra from charge/discharge curves of lithium-ion batteries | |
| Chen et al. | Influence of wax precipitation on the impedance spectroscopy of waxy oils | |
| Less et al. | An electrorheological study on the behavior of water‐in‐crude oil emulsions under influence of a DC electric field and different flow conditions | |
| Bosworth et al. | Pulsed amperometric detection of furan compounds in transformer oil | |
| Tamus et al. | Investigation of temperature dependence of dielectric processes in thermally aged PVC insulation | |
| Li et al. | Adequacy of dual-variable Weibull failure distribution for oil-impregnated paper under pulsating DC voltage | |
| Tamburic et al. | Rheological and texture analysis methods for quantifying yield value and level of thixotropy | |
| Preziosi et al. | Real-time monitoring of self-assembling worm-like micelle formation by organic transistors | |
| Heizmann et al. | A novel diagnostic method for buried polymer-insulated medium voltage cables | |
| Singh et al. | Investigation and comparison of insulating oil properties using various analytical methods | |
| Romero et al. | Diagnostic of water trees using DC and AC voltages | |
| Li et al. | Effect of Strain Rate in the Quasi-Static Regime on the Strength of Electrorheological Fluids | |
| Liu et al. | Modified furfural-DP equation with different oil-paper-pressboard mass ratios under oil replacement condition | |
| Ab Ghani et al. | CONDUCTIVITY MEASURMENTS OF TRANSFORMER INSULATING OIL CONTAINING WATER AND SOLID PARTICLES | |
| EP4560160A1 (en) | Water intrusion detection method, water intrusion detection device, and program for device using lubricant | |
| Singh et al. | Condition monitoring of transformer insulating liquid through service-induced ageing and insulating properties |
Legal Events
| Date | Code | Title | Description |
|---|---|---|---|
| STAA | Information on the status of an ep patent application or granted ep patent |
Free format text: STATUS: THE INTERNATIONAL PUBLICATION HAS BEEN MADE |
|
| PUAI | Public reference made under article 153(3) epc to a published international application that has entered the european phase |
Free format text: ORIGINAL CODE: 0009012 |
|
| STAA | Information on the status of an ep patent application or granted ep patent |
Free format text: STATUS: REQUEST FOR EXAMINATION WAS MADE |
|
| 17P | Request for examination filed |
Effective date: 20230327 |
|
| AK | Designated contracting states |
Kind code of ref document: A1 Designated state(s): AL AT BE BG CH CY CZ DE DK EE ES FI FR GB GR HR HU IE IS IT LI LT LU LV MC MK MT NL NO PL PT RO RS SE SI SK SM TR |
|
| DAV | Request for validation of the european patent (deleted) | ||
| DAX | Request for extension of the european patent (deleted) | ||
| REG | Reference to a national code |
Ref country code: DE Ref legal event code: R079 Free format text: PREVIOUS MAIN CLASS: G01N0033300000 Ipc: G01N0033280000 |
|
| A4 | Supplementary search report drawn up and despatched |
Effective date: 20240305 |
|
| RIC1 | Information provided on ipc code assigned before grant |
Ipc: G01N 27/02 20060101ALI20240228BHEP Ipc: G01N 33/28 20060101AFI20240228BHEP |
|
| STAA | Information on the status of an ep patent application or granted ep patent |
Free format text: STATUS: EXAMINATION IS IN PROGRESS |
|
| 17Q | First examination report despatched |
Effective date: 20251205 |