EP4194663A2 - Surveillance using particulate tracers - Google Patents
Surveillance using particulate tracers Download PDFInfo
- Publication number
- EP4194663A2 EP4194663A2 EP22212927.2A EP22212927A EP4194663A2 EP 4194663 A2 EP4194663 A2 EP 4194663A2 EP 22212927 A EP22212927 A EP 22212927A EP 4194663 A2 EP4194663 A2 EP 4194663A2
- Authority
- EP
- European Patent Office
- Prior art keywords
- tracer
- stage
- wellbore
- unique
- particulate
- Prior art date
- Legal status (The legal status is an assumption and is not a legal conclusion. Google has not performed a legal analysis and makes no representation as to the accuracy of the status listed.)
- Granted
Links
Images


Classifications
-
- E—FIXED CONSTRUCTIONS
- E21—EARTH OR ROCK DRILLING; MINING
- E21B—EARTH OR ROCK DRILLING; OBTAINING OIL, GAS, WATER, SOLUBLE OR MELTABLE MATERIALS OR A SLURRY OF MINERALS FROM WELLS
- E21B47/00—Survey of boreholes or wells
- E21B47/10—Locating fluid leaks, intrusions or movements
- E21B47/11—Locating fluid leaks, intrusions or movements using tracers; using radioactivity
-
- E—FIXED CONSTRUCTIONS
- E21—EARTH OR ROCK DRILLING; MINING
- E21B—EARTH OR ROCK DRILLING; OBTAINING OIL, GAS, WATER, SOLUBLE OR MELTABLE MATERIALS OR A SLURRY OF MINERALS FROM WELLS
- E21B43/00—Methods or apparatus for obtaining oil, gas, water, soluble or meltable materials or a slurry of minerals from wells
- E21B43/25—Methods for stimulating production
- E21B43/26—Methods for stimulating production by forming crevices or fractures
- E21B43/267—Methods for stimulating production by forming crevices or fractures reinforcing fractures by propping
-
- G—PHYSICS
- G01—MEASURING; TESTING
- G01N—INVESTIGATING OR ANALYSING MATERIALS BY DETERMINING THEIR CHEMICAL OR PHYSICAL PROPERTIES
- G01N33/00—Investigating or analysing materials by specific methods not covered by groups G01N1/00 - G01N31/00
- G01N33/24—Earth materials
- G01N33/241—Earth materials for hydrocarbon content
-
- G—PHYSICS
- G01—MEASURING; TESTING
- G01N—INVESTIGATING OR ANALYSING MATERIALS BY DETERMINING THEIR CHEMICAL OR PHYSICAL PROPERTIES
- G01N33/00—Investigating or analysing materials by specific methods not covered by groups G01N1/00 - G01N31/00
- G01N33/26—Oils; Viscous liquids; Paints; Inks
- G01N33/28—Oils, i.e. hydrocarbon liquids
- G01N33/2823—Raw oil, drilling fluid or polyphasic mixtures
Definitions
- the disclosed embodiments relate generally to techniques for surveillance using particulate tracers.
- Tracers are used in the hydrocarbon industry to track flow patterns and rates of the particular fluid to which it is introduced. Tracers are also used to study properties of the subterranean formation in which the fluid resides. Tracers commonly are chemical compounds that have negligible effects on the fluid. In operation, tracers are injected into the subterranean formation, and thereafter produced and sampled to measure for tracer concentration. There exists a need for surveillance using particulate tracers.
- a method of determining a flow profile for a wellbore using unique particulate tracers comprises obtaining produced fluid samples comprising unique particulate tracers from a wellbore drilled into a subterranean formation, wherein at least one unique particulate tracer is pumped throughout each stage, each stage group, or any combination thereof during a hydraulic fracturing operation performed in the subterranean formation, and wherein each unique particulate tracer corresponds to an oil phase, a water phase, or a gas phase, and wherein the produced fluid samples comprise at least a portion of the unique particulate tracers that were pumped throughout the stages, the stage groups, or any combination thereof.
- the method further comprises determining a flow profile for the wellbore for each phase using the produced fluid samples comprising the unique particulate tracers by: a) obtaining a tracer concentration history for each unique particulate tracer; b) obtaining a production history for the wellbore; c) determining a mean residence time for each unique particulate tracer using the corresponding tracer concentration history; d) determining a contact volume proxy for each unique particulate tracer using the production history and the corresponding tracer concentration history; and e) determining the flow profile for the wellbore for each phase indicative of flow contribution of each stage, each stage group, or any combination thereof by using the corresponding mean residence times and the corresponding contact volume proxies.
- a method of determining a flow profile for a wellbore using unique particulate tracers the method being implemented in a computer system that includes a physical computer processor and non-transitory storage medium.
- the method comprises: a) obtaining, from a non-transitory storage medium, a tracer concentration history for each unique particulate tracer in produced fluid samples from a wellbore drilled into a subterranean formation, wherein at least one unique particulate tracer is pumped throughout each stage, each stage group, or any combination thereof during a hydraulic fracturing operation performed in the subterranean formation, and wherein each unique particulate tracer corresponds to an oil phase, a water phase, or a gas phase, and wherein the produced fluid samples comprise at least a portion of the unique particulate tracers that were pumped throughout the stages, the stage groups, or any combination thereof.
- the method further comprises b) obtaining, from the non-transitory storage medium, a production history for the wellbore; c) determining, with a physical computer processor, a mean residence time for each unique particulate tracer using the corresponding tracer concentration history; d) determining, with the physical computer processor, a contact volume proxy for each unique particulate tracer using the production history and the corresponding tracer concentration history; and e) determining, with the physical computer processor, a flow profile for the wellbore for each phase indicative of flow contribution of each stage, each stage group, or any combination thereof by using the corresponding mean residence times and the corresponding contact volume proxies.
- a method of determining a flow profile for a wellbore using unique particulate tracers comprises obtaining produced fluid samples comprising unique particulate tracers from a wellbore drilled into a subterranean formation, wherein at least one unique particulate tracer is pumped throughout each stage, each stage group, or any combination thereof during a hydraulic fracturing operation performed in the subterranean formation, and wherein each unique particulate tracer corresponds to an oil phase, a water phase, or a gas phase, and wherein the produced fluid samples comprise at least a portion of the unique particulate tracers that were pumped throughout the stages, the stage groups, or any combination thereof.
- the method further comprises determining a flow profile for the wellbore for each phase using the produced fluid samples comprising the unique particulate tracers by: a) obtaining a tracer concentration history for each unique particulate tracer; b) optionally obtaining a production history for the wellbore; c) determining a decline rate for each unique particulate tracer using the corresponding tracer concentration history; d) determining a normalization factor for each unique particulate tracer using the corresponding tracer concentration history and optionally the production history; e) determining a normalized decline rate for each unique particulate tracer using the corresponding decline rate and the corresponding normalization factor; and f) determining a flow profile for the wellbore for each phase indicative of flow contribution of each stage, each stage group, or any combination thereof by using the corresponding normalized decline rates.
- a method of determining a flow profile for a wellbore using unique particulate tracers the method being implemented in a computer system that includes a physical computer processor and non-transitory storage medium.
- the method comprises a) obtaining, from the non-transitory storage medium, a tracer concentration history for each unique particulate tracer in produced fluid samples from a wellbore drilled into a subterranean formation, wherein at least one unique particulate tracer is pumped throughout each stage, each stage group, or any combination thereof during a hydraulic fracturing operation performed in the subterranean formation, and wherein each unique particulate tracer corresponds to an oil phase, a water phase, or a gas phase, and wherein the produced fluid samples comprise at least a portion of the unique particulate tracers that were pumped throughout the stages, the stage groups, or any combination thereof.
- the method further comprises b) optionally obtaining, from the non-transitory storage medium, a production history for the wellbore; c) determining, with the physical computer processor, a decline rate for each unique particulate tracer using the corresponding tracer concentration history; d) determining, with the physical computer processor, a normalization factor for each unique particulate tracer using the corresponding tracer concentration history and optionally the production history; e) determining, with the physical computer processor, a normalized decline rate for each unique particulate tracer using the corresponding decline rate and the corresponding normalization factor; and f) determining, with the physical computer processor, a flow profile for the wellbore for each phase indicative of flow contribution of each stage, each stage group, or any combination thereof by using the corresponding normalized decline rates.
- PARTICULATE TRACERS The term "particulate tracers" is utilized herein to refer to solid particles with chemical tracers bound to them.
- the particulate tracers may be practically any particulate tracers known in the art, such as particulate tracers for hydrocarbons (e.g., oil), particulate tracers for water, particulate tracers for gas, or any combination thereof.
- types of particulate tracers that are introduced into the subterranean formation may include, but are not limited to, fluorinated benzoic acids (FBAs), fluorescein dyes, FBA/fluorescein synthesis, fluorescing nanocrystals, radioactive tracers, fluorescing nanoparticles, magnetic nanoparticle tracers, etc.
- FBAs fluorinated benzoic acids
- fluorescein dyes fluorescein dyes
- FBA/fluorescein synthesis fluorescing nanocrystals
- radioactive tracers fluorescing nanoparticles
- magnetic nanoparticle tracers etc.
- Particulate tracers may differ in density, for example, from specific gravity of 0.90 to 2.75 (e.g., 0.96 to 2.65 in one embodiment, 0.96 to 1.5 in a second embodiment, etc.). The density may affect rheology and flow.
- the average size of particulate tracer particles may be 40 mesh to 100 mesh.
- Particulate tracers generally release at the same rate independent of the flowrate.
- the particulate tracers may be substantially the same size as proppant particles, and as such, the particulate tracers may be pumped with proppant particles and stay with the proppant particles (sometimes simply referred to as "proppant").
- proppant sometimes simply referred to as "proppant”
- unique particulate tracer is utilized herein to distinguish between different particulate tracers.
- a unique particulate tracer includes at least one solid particle comprising tracer material.
- first, second, each, etc. may be utilized herein (e.g., first unique oil particulate tracer, second unique oil particulate tracer, each unique oil particulate tracer, etc.).
- a specific particulate tracer such as a first unique oil particulate tracer, may be pumped into a single stage or a stage group that comprises at least two stages due to a shortage of different particulate tracers, costs, logistics, or other reasons.
- stages may also include a “stage group” herein unless stated otherwise.
- a unique oil particulate tracer may be pumped throughout each stage and/or stage group if there is an interest in oil.
- a unique water particulate tracer may be pumped throughout each stage and/or stage group if there is an interest in water.
- a unique gas particulate tracer may be pumped throughout each stage and/or stage group if there is an interest in gas.
- FIGS. 1D-1 , 1D-2 , 1D-3 , 1E-1 , 1E-2 , and 1E-3 illustrate different pumping options in which unique particulate tracers are pumped throughout stages and/or stage groups.
- the unique particulate tracers may react and diffuse into flowing fluid and the fluid may be produced from a wellbore as produced fluid.
- unique oil particulate tracers may react and diffuse into the fluid in response to contact with oil in the fluid.
- unique water particulate tracers may react and diffuse into the fluid in response to contact with water in the fluid.
- unique gas particulate tracers may react and diffuse into the fluid in response to contact with gas in the fluid.
- different particulate tracers may react and diffuse into the fluid in response to contact with the corresponding item in the fluid.
- a unique oil particulate tracer may diffuse into the fluid in response to contact with oil in the fluid and a unique gas particulate tracer may diffuse into the fluid in response to contact with gas in the fluid.
- the produced fluid may be sampled to analyze the unique particulate tracers in the samples.
- Each unique particulate tracer pumped into a stage and/or stage group may depend on the desired information that is sought about that stage and/or stage group as discussed further hereinbelow.
- the embodiments described herein place particulate tracers in at least two stages, including a first stage and a second stage, during a hydraulic fracturing operation in the subsurface formation.
- the particulate tracers are pumped only in a fraction of each stage and/or each stage group such that a substantial portion of the unique particulate tracers are placed in a near wellbore region of the subsurface formation proximate to the wellbore.
- the embodiments provided herein improve upon existing approaches to placing unique particulate tracers in a subterranean formation.
- Example embodiments of placing unique particular tracers in a subsurface formation having a wellbore therewithin will be described more fully hereinafter with reference to the accompanying drawings. Placing unique particular tracers in a subterranean formation having a wellbore therewithin may, however, be embodied in many different forms and should not be construed as limited to the example embodiments set forth herein. Rather, these embodiments and examples are provided so that this disclosure will be thorough and complete, and will fully convey the scope of placing unique particular tracers in a subterranean formation having a wellbore therewithin to those of ordinary skill in the art. Like, but not necessarily the same, elements (also sometimes called components) in the various figures are denoted by like reference numerals for consistency.
- FIGS. 1A through 1C show a field system 199, including details thereof, with which example embodiments can be used.
- FIG. 1A shows a schematic diagram of a land-based field system 199 in which a wellbore 120 has been drilled in a subterranean formation 110.
- FIG. 1B shows a detail of a substantially horizontal section 103 of the wellbore 120 of FIG. 1A.
- FIG. 1C shows a detail of an induced fracture 101 of FIG. 1B .
- the field system 199 in this example includes a wellbore 120 disposed in a subterranean formation 110 using field equipment 109 (e.g., a derrick, a tool pusher, a clamp, a tong, drill pipe, casing pipe, a drill bit, a wireline tool, a fluid pumping system) located above a surface 108 and within the wellbore 120.
- field equipment 109 e.g., a derrick, a tool pusher, a clamp, a tong, drill pipe, casing pipe, a drill bit, a wireline tool, a fluid pumping system
- subterranean resources e.g., hydrocarbon such as natural gas, oil
- the surface 108 can be ground level for an onshore application and the sea floor/lakebed for an offshore application.
- at least some of the field equipment can be located on a platform that sits above the water level.
- the point where the wellbore 120 begins at the surface 108 can be called the wellhead.
- the multiple wellbores 120 can be drilled at the same pad or at different pads.
- other operations such as fracturing operations, can be performed.
- the fractures 101 are shown to be located in the horizontal section 103 of the wellbore 120 in FIG. 1B .
- the fractures 101 can additionally or alternatively be located in other sections (e.g., a substantially vertical section, a transition area between a vertical section and a horizontal section) of the wellbore 120.
- Example embodiments can be used along any portion of the wellbore 120 where fractures 101 are located.
- the subterranean formation 110 can include one or more of a number of formation types, including but not limited to shale, limestone, sandstone, clay, sand, and salt.
- a subterranean formation 110 can include one or more reservoirs in which one or more resources (e.g., oil, natural gas, water, steam) can be located.
- resources e.g., oil, natural gas, water, steam
- One or more of a number of field operations e.g., fracturing, coring, tripping, drilling, setting casing, extracting downhole resources
- fracturing, coring, tripping, drilling, setting casing, extracting downhole resources can be performed to reach an objective of a user with respect to the subterranean formation 110.
- the wellbore 120 can have one or more of a number of segments or hole sections, where each segment or hole section can have one or more of a number of dimensions. Examples of such dimensions can include, but are not limited to, a size (e.g., diameter) of the wellbore 120, a curvature of the wellbore 120, a total vertical depth of the wellbore 120, a measured depth of the wellbore 120, and a horizontal displacement of the wellbore 120. There can be multiple overlapping casing strings of various sizes (e.g., length, outer diameter) contained within and between these segments or hole sections to ensure the integrity of the wellbore construction. In this case, one or more of the segments of the subterranean wellbore 120 is the substantially horizontal section 103. As stated above, in additional or alternative cases, one or more of the segments of the subterranean wellbore 120 is a substantially vertical section.
- each end of a casing pipe has mating threads (a type of coupling feature) disposed thereon, allowing a casing pipe to be directly or indirectly mechanically coupled to another casing pipe in an end-to-end configuration.
- the casing pipes of the casing string 125 can be indirectly mechanically coupled to each other using a coupling device, such as a coupling sleeve.
- Each casing pipe of the casing string 125 can have a length and a width (e.g., outer diameter).
- the length of a casing pipe can vary. For example, a common length of a casing pipe is approximately 40 feet. The length of a casing pipe can be longer (e.g., 60 feet) or shorter (e.g., 10 feet) than 40 feet.
- the width of a casing pipe can also vary and can depend on the cross-sectional shape of the casing pipe. For example, when the shape of the casing pipe is cylindrical, the width can refer to an outer diameter, an inner diameter, or some other form of measurement of the casing pipe. Examples of a width in terms of an outer diameter can include, but are not limited to, 4-1/2 inches, 7 inches, 7-5/8 inches, 8-5/8 inches, 10-3/4 inches, 13-3/8 inches, and 14 inches.
- the size (e.g., width, length) of the casing string 125 can be based on the information (e.g., diameter of the borehole drilled) gathered using field equipment with respect to the subterranean wellbore 120.
- the walls of the casing string 125 have an inner surface that forms a cavity 165 that traverses the length of the casing string 125.
- Each casing pipe can be made of one or more of a number of suitable materials, including but not limited to steel.
- Cement 109 is poured into the wellbore 120 through the cavity 165 and then forced upward between the outer surface of the casing string 125 and the wall of the subterranean wellbore 120.
- a liner may additionally be used with, or alternatively be used in place of, some or all of the casing pipes.
- the fractures 101 can be induced by hydraulic fracturing.
- the hydraulic fracturing process involves the injection of large quantities of fluids containing water, chemical additives, and proppant 112 into the subterranean formation 110 from the wellbore 120 to create fracture networks.
- a subterranean formation 110 naturally has fractures 101, but these naturally occurring fractures 101 have inconsistent characteristics (e.g., length, spacing) and so in some cases cannot be relied upon for extracting subterranean resources without having additional fractures 101, such as what is shown in FIG. 1B , induced in the subterranean formation 110.
- Operations that induce fractures 101 in the subterranean formation 110 use any of a number of fluids that include proppant 112 (e.g., sand particles, ceramic pellets).
- proppant 112 e.g., sand particles, ceramic pellets.
- some of the fractures 101 also sometimes called principal or primary fractures
- a remainder of the fractures 101 also sometimes called secondary fractures
- the proppant 112 is designed to become lodged inside at least some of the induced fractures 101 to keep those fractures 101 open after the fracturing operation is complete.
- the size of the proppant 112 is an important design consideration. Sizes (e.g., 40/70 mesh, 50/140 mesh) of the proppant 112 can vary. While the shape of the proppant 112 is shown as being uniformly spherical, and the size is substantially identical among the proppant 112, the actual sizes and shapes of the proppant 112 can vary.
- the proppant 112 If the proppant 112 is too small, the proppant 112 will not be effective at keeping the fractures 101 open enough to effectively allow subterranean resources 111 to flow through the fractures 101 from the rock matrices 162 in the subterranean formation 110 to the wellbore 120. If the proppant 112 is too large, the proppant 112 can plug up the fractures 101, blocking the flow of the subterranean resources 111 through the fractures 101.
- proppant 112 in certain types of subterranean formation 110, such as shale, is important.
- Shale formations typically have permeabilities on the order of microdarcys (mD) to nanodarcys (nD).
- miD microdarcys
- nD nanodarcys
- the wellbore 120 is hydraulically fractured in terms of stages, which are illustrated as Stage1 to StageN in FIG. 1D-1 , 1D-2 , 1D-3 , 1E-1 , 1E-2 , and 1E-3 .
- Each stage includes single or multiple perforations clusters and the fractures 101 are induced from the perforation clusters. Additionally, unique particulate tracers are pumped with the proppant 112 for surveillance purposes to track flow patterns and rates of the fluid to which it is introduced.
- a unique particulate tracer is typically pumped throughout each stage to determine over time which stage is contributing to water or hydrocarbon (e.g., oil) flow.
- the unique particulate tracers are chemical compounds that have negligible effects on the fluid carrying the particulate tracers.
- the unique particulate tracers are pumped throughout the stages and/or throughout the stage groups with the proppant such as illustrated in FIGS. 1D-1 , 1D-2 , 1D-3 , 1E-1 , 1E-2 , and 1E-3 , and thereafter, at least a portion the unique particulate tracers are produced in the produced fluid and sampled to measure for tracer concentration.
- a field operator manually collects at least one sample from the produced fluid, transports the at least one sample to a laboratory, filters the at least one sample, and finally analyzes the at least one sample for tracer concentration.
- the existing practice of pumping unique particulate tracers 170 (illustrated as 170 aoil , 170b oil , and so on) with the proppant 112 in the entirety of each Stage1 through StageN for a single wellbore 120 is illustrated in as illustrated FIGS. 1D-1 , 1D-2 , 1D-3 , 1E-1 , 1E-2 , and 1E-3 .
- FIG. 1E-1 , 1E-2 , and 1E-3 The existing practice of pumping unique particulate tracers 170 with the proppant 112 in the entirety of each Stage1 through StageN for a plurality of wellbores, such as the wellbore 120 and two offset horizontal wellbores 175, is illustrated in FIG. 1E-1 , 1E-2 , and 1E-3 . Due to the limited quantity of unique particulate tracers, costs, logistics, etc., a unique particulate tracer may be pumped with the proppant in the entirety of each stage and/or stage group (i.e., a plurality of stages) in the existing practice.
- stage group i.e., a plurality of stages
- FIG. 1D-1 , 1D-2 , 1D-3 , 1E-1 , 1E-2 , 1E-3 requires a large quantity of unique particulate tracers as well as the associated financial cost, time, equipment, and personnel to handle the large quantity of the unique particulate tracers. Furthermore, quantitative evaluation of stage and/or stage group contribution to flow is not generally possible with the existing manner that the unique particulate tracers are placed throughout the entirety of stages and/or stage groups. First, in FIGS. 1E-1 , 1E-2 , and 1E-3 , quantitative evaluation of stage or stage group contribution to flow is not generally possible because the particulate tracers of wellbore 120 may go to one or both offset wellbores 175.
- tracer recovery curves may simply indicate a binary response of flow vs no-flow.
- FIG. 1G illustrates a single wellbore with a StageM and a StageN and
- FIG. 1H illustrates typical tracer recovery curves indicative of just the binary response of flow vs. no-flow.
- tracer release rate is not a function of the flowrate, so the quantification is generally not possible with the existing tracer design.
- the unique particulate tracers are pumped only in a fraction of each stage such that a substantial portion of the unique particulate tracers are placed in a near wellbore region of the subsurface formation proximate to the wellbore.
- FIGS. 2A , 2B , and 2C illustrate non-limiting embodiments of placing unique particulate tracers in a subterranean formation having a wellbore therewithin consistent with the instant disclosure.
- the proppant 112 is pumped in the entirety of each Stage1 through StageN for the single wellbore 120 as in FIG.
- unique particulate tracers 170 are pumped only in a fraction of each stage such that a substantial portion of the unique particulate tracers 170 are placed in a near wellbore region 180 (illustrated as 180a for the near wellbore region corresponding to Stage1, 180b for the near wellbore region corresponding to Stage2, and so on) of the subterranean formation 110 proximate to the wellbore 120.
- the unique particulate tracers 170 are pumped with the proppant 112 in the near wellbore region 180.
- At least one unique particulate tracer is pumped in the fraction of each stage, and each unique particulate tracer corresponds to an oil phase, a water phase, or a gas phase.
- a lower quantity of unique particulate tracers is utilized in embodiments consistent with the disclosure because the unique particulate tracers are placed in the near wellbore region and not throughout each stage and/or stage group.
- embodiments are provided in this disclosure related to placing unique particulate tracers in fewer stages than all the stages that are available, such as placing particulate tracers 170 in three stages (e.g., Stage1, Stage5, and StageN) of the nine stages that are illustrated in FIGS. 2A , 2B , and 2C , to further decrease the quantity of unique particulate tracers that is utilized without significantly impacting the analysis.
- the placement of the unique particulate tracers in the near wellbore region focuses or concentrates the particulate tracers in this area, which may increase the accuracy of flow rates that are generated based on the unique particulate tracers.
- the existing practice typically does not provide an economic, scalable, and accurate way to generate flow rates (e.g., absolute barrels per day) and/or flow profiles (e.g., percentages) in unconventional long horizontal wells.
- Embodiments consistent with the instant disclosure may provide a cost-effective, long term, non-interventional, and accurate way of profiling the production from individual stages of multi-stage hydraulically fractured wellbores. This may also allow for optimization of hydrocarbon production from unconventional resources.
- the determined flow rates and/or flow profiles may be utilized for completion design optimization, understanding changes in flow profiles as a function of time, understand rock type proximate to the wellbore, where to drill a wellbore, understand production from different parts of the lateral that can be utilized to optimize wellbore length and/or wellbore landing, understand possible optimization equipment or techniques for increasing hydrocarbon recovery, etc.
- the wellbore may comprise a vertical trajectory, a horizontal trajectory, or a deviated trajectory.
- the subterranean formation may be located onshore or located offshore.
- FIG. 4 illustrates an example method of placing unique particulate tracers in a subterranean formation having a wellbore therewithin referred to as a method 400.
- the unique particulate tracers may be practically any unique particulate tracers known in the art, such as unique particulate tracers for hydrocarbons (e.g., oil), unique particulate tracers for water, unique particulate tracers for gas, or any combination thereof.
- types of particulate tracers that are introduced into the subterranean formation may include, but are not limited to, fluorinated benzoic acids (FBAs), fluorescein dyes, FBA/fluorescein synthesis, fluorescing nanocrystals, radioactive tracers, fluorescing nanoparticles, magnetic nanoparticle tracers, etc.
- FBAs fluorinated benzoic acids
- fluorescein dyes fluorescein dyes
- FBA/fluorescein synthesis fluorescing nanocrystals
- radioactive tracers fluorescing nanoparticles
- magnetic nanoparticle tracers etc.
- FIG. 4 is merely one embodiment that can be performed by using a system, such as described in FIGS. 1A, 1B, 1C , and 36 .
- the method 400 of FIG. 4 includes step 401 of placing unique particulate tracers in at least two stages, including a first stage and a second stage, during a hydraulic fracturing operation in a subterranean formation.
- the unique particulate tracers are pumped only in a fraction of each stage such that a substantial portion of the unique particulate tracers are placed in a near wellbore region of the subterranean formation proximate to the wellbore drilled into the subterranean formation.
- At least one unique particulate tracer is pumped in the fraction of each stage, and each unique particulate tracer corresponds to an oil phase, a water phase, or a gas phase.
- a unique oil particulate tracer may be pumped only in a first fraction of a first stage of a stage pair and a different unique oil particulate tracer may be pumped only in a second fraction of a second stage of the stage pair.
- the unique particulate tracers may be pumped using existing techniques and existing equipment as illustrated, for example, in FIG. 2A , 2B , 2C , 3A , 3B , and 3C .
- FIG. 4 may be applied to at least two stages and fewer than all the stages. In the running example based on FIG.
- the unique particulate tracers 170a oil and 170e oil will be placed in Stage1 in near wellbore region 180a and Stage5 in near wellbore region 180e, respectively.
- Stage1 e.g., first stage
- Stage5 e.g., second stage
- the rest of FIG. 4 includes different equations that may facilitate the placement of step 401.
- the method 400 of FIG. 4 includes step 405 to determine a minimum wellbore volume between the first stage and the second stage.
- the unique particulate tracers 170a oil and 170e oil will be placed in Stage1 and Stage5 respectively, and the minimum wellbore volume between Stage1 and Stage5 may be determined at step 405.
- the minimum wellbore volume may be determined using Equation 1 below. The Equation 1 is solved once of each phase.
- V wellbore,min minimum wellbore volume between two unique particulate tracer placements (e.g., in bbls) ⁇
- q max maximum flow rate (e.g., in bbls)
- t fs sampling frequency (e.g., in minutes) ⁇ 1 24 ⁇ 60 ⁇
- Running Example Using Equation 1: 17 bbls 5000 bpd * 5 minutes * 1 24 ⁇ 60
- the method 400 includes step 410 to determine a minimum lateral length between the first stage and the second stage.
- the unique particulate tracers 170a oil and 170e oil will be placed in Stage1 and Stage5 respectively, and the minimum lateral length between Stage1 and Stage5 may be determined at step 410.
- the determined minimum wellbore volume from step 405 and a flow pipe radius (referred to as r w ) may be utilized to determine the minimum lateral length.
- the flow pipe radius may correspond to production casing or production tubing.
- the minimum wellbore length may be determined using Equation 2 below. The Equation 2 is solved once for each phase.
- the method 400 includes step 415 to determine a quantity of stages without unique particulate tracers between the first stage and the second stage.
- the unique particulate tracers will not be placed in three stages (i.e., Stage2, Stage3, and Stage4 in FIG. 2D ) using the minimum lateral length between Stage1 and Stage5 that was determined at step 410.
- the quantity of stages without unique particulate tracers may be determined using Equation 3 below. The Equation 3 is solved once for each phase.
- the method 400 includes step 420 to determine a maximum fluid volume in a stage near the wellbore that is in contact with a unique particulate tracer, which will be utilized later herein to determine a fraction of each stage in which to pump a unique particulate tracer. If the unique particulate tracers are placed inside the subterranean formation with proppant, and the stage in which the tracers are placed does not flow at a sufficient rate, then the particulate tracer signals would overlap inside the wellbore and would not stay distinct, which is used for flow profiling. Thus, minimum flowrate q min,stage (e.g., bbls/day) from a stage is a design parameter to determine tracer placement within the stage.
- minimum flowrate q min,stage e.g., bbls/day
- Equation 4 The maximum fluid volume in a stage near the wellbore that is in contact with a unique particulate tracer may be determined using Equation 4 below.
- the Equation 4 is solved once for each phase. Equation 4: V p bbls ⁇ q min , stage ⁇ t fs 24 ⁇ 60 ⁇ wherein V p is a maximum fluid volume in a stage near the wellbore that is in contact with unique particulate tracer (e.g., in bbls) ⁇ wherein q min,stage is minimum flowrate from a stage (e.g., in bbls) ⁇ wherein t fs is sampling frequency (e.g., in minutes) (e.g., ⁇ 5 minutes ) ⁇
- metric units are utilized, then the following portion of Equation 4 may be omitted: 24 * 60 Running Example Using Equation 4: 1.041667 bbls ⁇ 300 bpd ⁇ 5 minutes 24 ⁇ 60
- the method 400 includes step 425 to determine proppant pack bulk volume, which will be utilized later herein to determine a fraction of each stage in which to pump a unique particulate tracer.
- the corresponding proppant packing bulk volume, V bulk-proppant if the proppant pack porosity is ⁇ , may be determined using Equation 5 below. The Equation 5 is solved once for each phase.
- V bulk ⁇ proppant , bbls V p ⁇ * 1 ⁇ ⁇
- the method 400 includes step 430 to determine proppant mass tagged with a unique particulate tracer if proppant density is ⁇ proppant (e.g., lbs/gallon), which will be utilized later herein to determine a fraction of each stage in which to pump a unique particulate tracer.
- Tagged refers to includes as in what is the proppant mass that includes a unique particulate tracer.
- the proppant mass tagged with unique particulate tracer may be determined using Equation 6 below. The Equation 6 is solved once for each phase (add claim).
- V bulk-proppant is proppant pack bulk volume (e.g., in bbls)
- ⁇ proppant proppant density (e.g., lbs/gallon)
- ⁇ proppant of 22 lb/gal was determined by 2.65 gm/cc
- the method 400 includes step 435 to determine proppant pumped in a stage, which will be utilized later herein to determine a fraction of each stage during which to pump a unique particulate tracer.
- each stage gets completed with M p,stage (e.g., lbs) of proppant.
- the proppant pumped in a stage may be determined using Equation 6 below.
- the Equation 7 is solved once, and substantially the same answer is utilized for each phase.
- Running Example Using Equation 7: 440000 lbs 2000 lb ft ⁇ 200 feet
- the method 400 includes step 440 to determine a fraction of a stage in which to pump a unique particulate tracer.
- a fraction comprises 0.001% to 10%.
- a fraction comprises 0.001% to 25%.
- a fraction comprises 0.001% to 50%.
- the same fraction may be utilized for each stage.
- the fraction of a stage in which to pump a unique particulate tracer may be determined using Equation 8 below: The Equation 8 is solved once for each phase.
- 0.0051 percent of stage tagged with a unique particulate tracer 2256.144 lbs 440000 lbs
- 0.0051 may be represented as 0.51% of stage tagged with a unique particulate tracer
- the fraction is a percentage of the stage such as 0.51% of the stage, and the whole stage is 100%.
- steps 430, 435, and 440 in the running example, about 2256.144 lbs of the proppant 112 will be tagged with the unique particulate tracer 170a oil in 0.51% (i.e., fraction) of Stage1 out of about 440,000 lbs of the proppant 112 that will be pumped into the Stage1.
- Existing practice would have added particulate tracers throughout the 440,000 lbs of proppant in Stage1.
- the method 400 includes a step 445 to pump a proppant mass that is tagged with a unique particulate tracer in a fraction of each stage for each phase.
- the unique particulate tracer is pumped in the determined fraction at the start and/or at the end of a stage injection such that a substantial portion of the unique particulate tracer is placed in a near wellbore region of the subterranean formation proximate to the wellbore of the corresponding stage.
- Start of stage injection Based on some geomechanical models, early in the stage injected proppant stays close to the wellbore.
- End of stage injection Conventional thinking is that the proppant injected at the end stays close to the wellbore.
- the 2256.144 lbs of the proppant 112 tagged with the unique particulate tracer 170a oil may be pumped in 0.51% (i.e., fraction) of Stage1 at the start of the stage injection or at the end of stage injection such that the proppant 112 tagged with the unique particulate tracer 170a oil is pumped into the near wellbore region 180a.
- the 2256.144 lbs of the proppant 112 tagged with the unique particulate tracer 170e oil may be pumped in 0.51% (i.e., fraction) of Stage5 at the start of the stage injection or at the end of stage injection such that the proppant 112 tagged with the unique particulate tracer 170e oil is pumped into the near wellbore region 180e.
- Pumping of the fraction of a stage with proppant mass tagged with the unique particulate tracer at the start/end of stage treatment will allow for the tracer to be placed in the near wellbore region.
- a unique particulate tracer may be kept in an isolation tank and the proppant may be kept in a different isolation tank, and then both get added to the fracturing fluid and the fracturing fluid is injected.
- Separate pumps for the proppant and the the unique particulate tracer may be utilized until they are mixed in the stream (e.g., stream of fracturing fluid). Afterwards, there may be other pumps that further pressurize the mix to be pumped into the wellbore.
- the particulate tracer placement design discussed before allows for the tracer dilution between the volume contained between the locations/stages where the two unique particulate tracers are placed V wellbore,min bbls is mixed with the volume of fluid flowing from the stage downstream V p bbls because the placement is designed such that the time it takes for the fluid to flow in the wellbore from upstream (e.g., location closer to the wellbore's toe) to downstream (e.g., location closer to the wellbore's heel) is less than equal to time it would take particulate contacted volume downstream to flow into the wellbore and mix with the total stream. This would also be the maximum dilution that the tracer would undergo in theory and would be what would be observed at the surface. This is illustrated in FIG. 5 .
- the method 400 includes step 450 to determine surface tracer concentration. This relationship is used to determine the amount of unique particulate tracer mass to be injected.
- the tracer concentration observed at the surface should at least be the equivalent to the tracer quantification limit as determined by a conventional lab analytical method. For most unique particulate tracers such a limit is ⁇ 5 ppb.
- a phase amplification factor may also be incorporated while using this relationship to determine the unique particulate tracer mass design.
- the method 400 includes step 455 to determine a dilution amplification factor.
- the dilution amplification factor could be the ratio of wellbore volume between two tracer placements to the total wellbore volume because it removes any dilution related uncertainty that could be a part of the design.
- the method 400 includes step 460 to determine particulate tracer mass released, which is a minimum to be released in the subsurface in order to see at least 5 ppb in the surface.
- the Equation 11 is solved once for each phase. Equation 11: Tracer conc . @ surface , ppb ⁇ Detection , quantification limit , ppb
- the detection, quantification limit may be 5 ppb in one embodiment.
- the detection, quantification limit may be in a range of 0.1 ppb to 100 ppb. In another embodiment, the detection, quantification limit may be in a range of 0.1 ppb to 10 ppb in another embodiment.
- the detection, quantification limit may be 5 ppb or higher in another embodiment. In one embodiment, the detection, quantification limit may even be 0.1 ppb or lower.
- the particulate tracer mass released may be determined using Equation 12 below.
- the Equation 12 uses concentration in ppb so we multiply the RHS by 10 ⁇ 9, but if we use the concentration in ppm then we would multiply RHS by 10 ⁇ 6. Alternatively, if we use concentration as true fraction/ratio then we would not multiply RHS with just 1.
- Running Example Using Equation 12: 0.000835418 lbs 5 ppb ⁇ 6446.125 lbs ⁇ 26 10 9 wherein Tracer conc @ surface, ppb ⁇ 5 ppb
- the method 400 includes step 465 to determine design particulate mass.
- the amount of tracer released from the particulate tracers is a function of the injected tracer mass as well as the exposure time of the tracer to the fluid which could be seen from the release rate.
- a typical well shut-in duration t shutin is -24 hours so the tracer concentration could be built for analysis would lead to the following particulate mass for injection using the release rate @ Tmin usable tracer release rate so the design would still work for time less than T min_usable_tracer_release_rate because the release rates would be higher for those times.
- the method 400 includes step 470 to determine design particulate mass to tagged proppant ratio.
- the Equation 14 is solved once for each phase.
- the method 400 includes step 475 to handle multi-phase flow dilution.
- phase amplification factor introduced in the design, the produced tracer concentrations would still be at quantification limit as long as the WOR is equal to or greater than the phase amplification factor for water tracers and vice versa for oil tracers.
- the Equation 15 is solved once for each phase. Equation 15: Water particluate tracer surface concentrations ⁇ Quantifiable Limit if WOR ⁇ Phase Amplification Factor
- Equation 16 Oil particluate tracer surface concentrations ⁇ Quantifiable Limit if WOR ⁇ 1 Phase Amplificatin Factor
- the improved implementation of unique particulate tracers with the design methodology outlined is similarly applicable to both oil and water particulate tracers.
- the way the improved application is designed would account for reduction in the tracer mass for oil or water and a corresponding increase in the tracer mass for water or oil if contact area changes between water and oil particulate tracers and its corresponding reduction in the tracer concentration because overall flowrate of the corresponding phase also goes down along with the dilution.
- One or more of the steps described hereinabove in the method 400 of FIG. 4 may be implemented by a system and/or in a system, such as a system 3600 shown in FIG. 36 as illustrated in FIG. 8 .
- the step 405 to determine a minimum wellbore volume between the first stage and the second stage may be implemented by component 804 in FIG. 8 .
- the step 410 to determine a minimum lateral length between the first stage and the second stage may be implemented by component 806 in FIG. 8 .
- the step 440 to determine a fraction of a stage in which to pump a unique particulate tracer may be implemented by component 808 in FIG. 8 .
- a representation of one or more of the values determined in the method 400 of FIG. 4 may be generated and displayed by component 810.
- the unique particulate tracers are pumped in at least one stage pair during a hydraulic fracturing operation performed in the subterranean formation, and wherein the unique particulate tracers are pumped only in a fraction of each stage such that a substantial portion of the unique particulate tracers are placed in a near wellbore region of the subterranean formation proximate to the wellbore.
- At least one unique particulate tracer is pumped in the fraction of each stage, and each unique particulate tracer corresponds to an oil phase, a water phase, or a gas phase.
- determining a flow profile may be embodied in many different forms and should not be construed as limited to the example embodiments set forth herein. Rather, these embodiments and examples are provided so that this disclosure will be thorough and complete, and will fully convey the scope of determining a flow profile to those of ordinary skill in the art. Like, but not necessarily the same, elements (also sometimes called components) in the various figures are denoted by like reference numerals for consistency.
- FIG. 9 illustrates an example method of determining a flow profile for a wellbore using unique particulate tracers referred to as a method 900.
- the unique particulate tracers may be practically any unique particulate tracers known in the art, such as unique particulate tracers for hydrocarbons (e.g., oil), unique particulate tracers for water, unique particulate tracers for gas, or any combination thereof.
- types of particulate tracers that are introduced into the subterranean formation may include, but are not limited to, fluorinated benzoic acids (FBAs), fluorescein dyes, FBA/fluorescein synthesis, fluorescing nanocrystals, radioactive tracers, fluorescing nanoparticles, magnetic nanoparticle tracers, etc.
- FBAs fluorinated benzoic acids
- fluorescein dyes fluorescein dyes
- FBA/fluorescein synthesis fluorescing nanocrystals
- radioactive tracers fluorescing nanoparticles
- magnetic nanoparticle tracers etc.
- FIG. 9 is merely one embodiment that can be performed by using a system, such as described in FIGS. 1A, 1B, 1C , and 36 .
- the method 900 of FIG. 9 includes step 901 to obtain produced fluid samples comprising unique particulate tracers from a wellbore drilled into a subterranean formation.
- the unique particulate tracers are pumped in at least one stage pair (e.g., a first stage and a second stage) during a hydraulic fracturing operation performed in the subterranean formation.
- the unique particulate tracers are pumped only in a fraction of each stage such that a substantial portion of the unique particulate tracers are placed in a near wellbore region of the subterranean formation proximate to the wellbore.
- At least one unique particulate tracer is pumped in the fraction of each stage, and wherein each unique particulate tracer corresponds to an oil phase, a water phase, or a gas phase. Practically any known technique or known equipment may be utilized to obtain the produced fluid samples.
- the method 900 of FIG. 9 includes step 905 to obtain a tracer concentration history for each unique particulate tracer, for example, as described herein.
- the method 900 of FIG. 9 includes step 910 to determine a wellbore volume for the stage pair.
- the wellbore volume may be solved once, and substantially the same answer may be reused for various stage pairs.
- the method 900 of FIG. 9 includes step 915 to determine a flow profile for the wellbore for each phase indicative of flow contribution for each stage pair and stages in between each stage pair using the wellbore volume and the corresponding tracer concentration histories.
- a stage pair includes a first stage that received unique particulate tracer 170a oil and a second stage that received unique particulate tracer 170e oil , with three stages are located between the first stage and the second stage without any unique particulate tracers.
- the flow contribution may include the stage pair of the first stage and the second stage as well as the three stages in between.
- FIG. 10 provides more information including the ⁇ t , which is arrival time difference. With the improved placement and design, the particulate tracer response at the surface could be interpreted like wellbore solid tracers for flow profiling as illustrated in FIG. 10 .
- the method 900 of FIG. 9 includes step 920 as a check by obtaining a production history for the wellbore; summing all flow contributions for each stage pair for each phase; and comparing the sums and the production history to constraint total flow contribution for each phase.
- the production history may be obtained as discussed elsewhere herein. This step may be performed as a check.
- the method 900 may include an optional step 925 to smooth a tracer concentration history for a specific unique particulate tracer before c) of step 915 to reduce noise (e.g., reduce points that show large variations ups and/or downs); and utilize the smoothed tracer concentration history for the specific unique particulate tracer in c) of step 915.
- This optional step 915 may be performed by curve fitting to smoothen out the data (e.g., normal, log normal, or other representative curve fit).
- the method 900 of FIG. 9 includes step 930 to generate, on a graphical user interface, a representation of the flow profile for the wellbore for each phase indicative of the flow contribution for each stage pair and stages within each stage pair; and display, via the graphical user interface, the representation.
- the method 900 may include an optional step 935 to refine the wellbore volume in response to multiple phases in the wellbore.
- Various ways to refine the wellbore volume are provided in FIGS. 11-22 .
- Various other optional steps are also provided in FIGS. 11-22 .
- One or more of the steps described hereinabove in the method 900 of FIG. 9 may be implemented by a system and/or in a system, such as a system 3600 shown in FIG. 36 as illustrated in FIG. 23 .
- the step 905 to obtain a tracer concentration history for each unique particulate tracer may be implemented by component 2304 in FIG. 23 .
- the step 910 to determine a wellbore volume for the stage pair may be implemented by component 2306 in FIG. 23 .
- the step 915 to determine a flow profile for the wellbore for each phase indicative of flow contribution for each stage pair and stages in between each stage pair using the wellbore volume and the corresponding tracer concentration histories may be implemented by component 2308 in FIG. 23 .
- a representation of one or more flow profiles may be generated and displayed by component 2310.
- FIG. 7A-7G include various examples consistent with the disclosure.
- the surface area per ft for wellbore tracers is 0.8 ft2. If installed over two tubing lengths (60 ft). the exposed surface area is 48 ft2. If the wellbore tracer is installed over a stage of 200 ft in length, the exposed surface area is 160 ft2. 1 gm particulate tracers have exposed surface area of 32000 ft2 and occupies 0.00017 ft3 of the volume.
- Example embodiments of determining a flow profile for a wellbore using unique particulate tracers will be described more fully hereinafter with reference to the accompanying drawings.
- At least one unique particulate tracer is pumped throughout each stage, each stage group, or any combination thereof during a hydraulic fracturing operation performed in the subterranean formation in example embodiments, however, determining a flow profile may be embodied in many different forms and should not be construed as limited to the example embodiments set forth herein. Rather, these embodiments and examples are provided so that this disclosure will be thorough and complete, and will fully convey the scope of determining a flow profile to those of ordinary skill in the art.
- Like, but not necessarily the same, elements (also sometimes called components) in the various figures are denoted by like reference numerals for consistency.
- FIGS. 1D-1 , 1D-2 , 1D-3 , 1E-1 , 1E-2 , and 1E-3 quantitative evaluation of stage and/or stage group contribution to flow is not generally possible with the existing manner that unique particulate tracers are placed throughout the entirety of stages and/or stage groups.
- FIG.1E-1 , 1E-2 , and 1E-3 quantitative evaluation of stage and/or stage group contribution to flow is not generally possible because the unique particulate tracers of wellbore 120 may go to one or both offset wellbores 175.
- tracer recovery curves may simply indicate a binary response of flow vs no-flow.
- FIG. 1G illustrates a single wellbore with a StageM and a StageN
- FIG. 1H illustrates typical tracer recovery curves indicative of just the binary response of flow vs. no-flow.
- tracer release rate is not a function of the flowrate, so the quantification is generally not possible with the existing tracer design.
- embodiments are provided in this disclosure related to determining a flow profile for a wellbore using unique particulate tracers that are pumped throughout each stage, each stage group, or any combination thereof. By doing so, these embodiments may be utilized to provide quantitative flow profiles that were not generally available in the existing practice.
- embodiments of two methods referred to as the "response time delay method” and the “decline method” that may be utilized to determine the flow profiles.
- the “response time delay method” may be dependent on the release rate, but the “decline method” is not. In some circumstances, both the “response time delay method” and the “decline method” may be utilized for comparison and validation.
- embodiments provided herein may be utilized for non-interventional time-based flow profiling using the unique particulate tracers.
- the determined flow profiles may be utilized for completion design optimization, understanding changes in flow profiles as a function of time, understand rock type proximate to the wellbore, where to drill a wellbore, understand production from different parts of the lateral that can be utilized to optimize wellbore length and/or wellbore landing, understand possible optimization equipment or techniques for increasing hydrocarbon recovery, etc.
- RESPONSE TIME DELAY METHOD The methods and systems of the present disclosure may be implemented by a system and/or in a system, such as a system 3600 shown in FIG. 36 and FIG. 24 .
- a method of determining a flow profile for a wellbore using unique particulate tracers may be performed by the processor 3618, including input such as at least one tracer concentration history (e.g., a tracer concentration history for each unique particulate tracer) and/or a production history for a wellbore as well as output such as a flow profile for the wellbore for each phase indicative of flow contribution of each stage, each stage group, or any combination thereof.
- tracer concentration history e.g., a tracer concentration history for each unique particulate tracer
- the electronic storage 3622 may store information relating to the tracer concentration history for each unique particulate tracer, the production history of the wellbore, information about the produced fluid samples, and/or other information.
- the graphical display 3624 may present information relating to the flow profile for the wellbore for each phase indicative of the flow contribution of each stage, each stage group, or any combination thereof, and/or other information.
- the processor 3618 may be configured to execute one or more machine-readable instructions 3602 to facilitate determining the flow profile for the wellbore for each phase using the unique particulate tracers.
- the machine-readable instructions 3602 may include one or more computer program components.
- the machine-readable instructions 3602 may include a tracer concentration history component 2404, a production history component 2406, a mean residence time component 2408, a contact volume proxy component 2410, a flow profile component 2412, a smoothing component 2414, a representation component 2416, and/or other computer program components.
- the tracer concentration history component 2404 may be configured to obtain (e.g., from the non-transitory storage medium such as the electronic storage 3622) a tracer concentration history for each unique particulate tracer in produced fluid samples from a wellbore drilled into a subterranean formation. At least one unique particulate tracer was pumped throughout each stage, each stage group, or any combination thereof during a hydraulic fracturing operation performed in the subterranean formation. Each unique particulate tracer corresponds to an oil phase, a water phase, or a gas phase.
- the produced fluid samples comprise at least a portion of the unique particulate tracers that are pumped throughout the stages, the stage groups, or any combination thereof.
- the production history component 2406 may be configured to obtain (e.g., from the non-transitory storage medium such as the electronic storage 3622) a production history for the wellbore.
- the mean residence time component 2408 may be configured to determine (e.g., with the physical computer processor such as the processor 3618) a mean residence time for each unique particulate tracer using the corresponding tracer concentration history.
- the contact volume proxy component 2410 may be configured to determine (e.g., with the physical computer processor such as the processor 3618) a contact volume proxy for each unique particulate tracer using the production history and the corresponding tracer concentration history.
- the flow profile component 2412 may be configured to determine (e.g., with the physical computer processor such as the processor 3618) a flow profile for the wellbore for each phase indicative of flow contribution of each stage, each stage group, or any combination thereof by using the corresponding mean residence times and the corresponding contact volume proxies.
- the smoothing component 2414 may be configured to smooth (e.g., with the physical computer processor such as the processor 3618) a tracer concentration history for a specific unique particulate tracer before determining a mean residence time and before determining a contact volume proxy to reduce noise.
- the smoothed tracer concentration history for the specific unique particulate tracer may be utilized in determining the mean residence time and determining the contact volume proxy.
- the representation component 2416 may be configured to generate (e.g., on the graphical user interface such as the graphical display 3624) a representation of the flow profile for the wellbore for each phase indicative of the flow contribution of each stage, each stage group, or any combination thereof.
- the representation component 2416 may be configured to display (e.g., on the graphical user interface such as the graphical display 3624) the representation.
- FIG. 25 illustrates an example method 2500 for determining a flow profile for a wellbore using unique particulate tracers.
- the method 2500 may be utilized if high frequency data with mode is accurately captured with time (e.g., high frequency sampling depending on the flow rate) and/or low oil rate.
- the response delay method may be applied when data is collected in the first 5 days post POP (i.e., popping the wellbore open for the first time after the unique particulate tracers were pumped in), such as collecting produced fluid samples at least once a day to about 5+ a day, at least once a day to about 10+ a day, etc.
- the method 2500 includes step 2505 to obtain (e.g., from the non-transitory storage medium such as the electronic storage 3622) a tracer concentration history for each unique particulate tracer in produced fluid samples from a wellbore drilled into a subterranean formation. At least one unique particulate tracer is pumped throughout each stage, each stage group, or any combination thereof during a hydraulic fracturing operation performed in the subterranean formation. Each unique particulate tracer corresponds to an oil phase, a water phase, or a gas phase. For example, if a flow profile for the oil phase is desired, then unique oil particulate tracers that will react to oil should be pumped throughout the stages.
- the produced fluid samples comprise at least a portion of the unique particulate tracers that are pumped throughout the stages, the stage groups, or any combination thereof.
- the tracer concentration history of a specific unique particulate tracer may include a tracer concentration (e.g., in parts per billion (ppb)) as a function of time for the specific stage that it is pumped into during the hydraulic fracturing operation.
- the tracer concentration history for each unique particulate tracer that is obtained at the step 2505 may be previously generated using laboratory analysis (discussed in FIG. 27 ).
- the produced fluid samples obtained from the produced fluid from the wellbore may be analyzed in a laboratory using equipment and/or tests such as, but not limited to: chromatography.
- ultra-high-performance liquid chromatography with a fluorescent light scattering detector and a diode array detector (DAD) may be used to obtain the spectral profile of samples
- triple quad mass spec liquid chromatography may be used to integrate target ions and precursor ions of the chemical of interest, or other known techniques to generate a tracer concentration history for each unique particulate tracer.
- This generated tracer concentration history for each unique particulate tracer may be obtained from a non-transitory storage medium at the step 2505.
- Two example tracer concentration histories in curve form are illustrated in FIG. 1H .
- the step 2505 may be performed using the tracer concentration history component 2404.
- the running example based on FIG. 1D-3 assumes that the wellbore 120 produces oil, water, and gas, and therefore, a unique oil particulate tracer, a unique water particulate tracer, and a unique gas particulate tracer are pumped throughout each stage of the figure (i.e., throughout the nine stages). In other words, a total of twenty-seven unique particulate tracers (i.e., nine unique oil particulate tracers, nine unique water particulate tracers, and nine unique gas particulate tracers) are pumped in FIG.
- this running example assumes that all twenty-seven unique particulate tracers 170a oil , 170a water , 170a gas , 170b oil , 170b water , 170b gas , 170c oil , 170c water , 170c gas , 170d oil , 170d water , 170d gas , 170e oil , 170e water , 170e gas , 170f oil , 170f water , 170f gas , 170g oil , 170g water , 170g gas , 170n-1 oil , 170n-1 water , 170n-1 gas , 170n oil , 170n water , and 170n gas were detected by laboratory analysis in the produced fluid samples from the wellbore 120.
- a tracer concentration history is obtained from a non-transitory storage medium for each of the twenty-seven unique particulate tracers (i.e., twenty-seven tracer concentration histories may be obtained from the non-transitory storage medium).
- the method 2500 includes step 2510 to obtain (e.g., from the non-transitory storage medium such as the electronic storage 2422) a production history for the wellbore.
- the production history accounts for the phases of the produced fluid of the wellbore, including the oil phase, the water phase, the gas phase, or any combination thereof.
- the production history that is obtained may include quantity (e.g., barrels (bbls) per day) of oil that is produced from the wellbore, quantity (e.g., barrels (bbls) per day) of water that is produced from the wellbore, quantity (e.g., standard cubic feet (scf) per day) of gas that is produced from the wellbore, or any combination thereof.
- quantity e.g., barrels (bbls) per day
- the production history accounts for all three phases.
- the production history may reflect water, oil, or both water and oil but not gas.
- the production history may include quantity or rate of oil that is produced from the wellbore, quantity or rate of water that is produced from the wellbore, quantity or rate of gas that is produced from the wellbore, or any combination thereof, for example, as a function of time.
- the production history may include additional information, such as, but not limited to, wellbore identification information, well geographic properties (e.g., x coordinate for the heel, y coordinate for the heel, depth, and/or azimuth), geologic properties (e.g., identification information for the subterranean formation), wellbore properties (e.g., tortuosity), completion properties (e.g., perforated length, proppant intensity, and/or fracturing fluid intensity), etc.
- the production history for the wellbore that is obtained from the non-transitory storage medium at the step 2510 may be previously generated using known techniques (discussed in FIG. 27 ).
- the step 2510 may be performed using the production history component 2406.
- a production history may be obtained for the wellbore 120 that includes the quantity or rate of oil that is produced from the wellbore 120, the quantity or rate of water that is produced from the wellbore 120, and the quantity or rate of gas that is produced from the wellbore 120.
- the method 2500 includes step 2515 to determine (e.g., with a physical computer processor such as the processor 3618) a mean residence time for each unique particulate tracer using the corresponding tracer concentration history.
- the mean residence time of a specific unique particulate tracer generally refers to how quickly that specific unique particulate tracer gets produced from the stage that it is pumped into. How quickly a unique particulate tracer could get produced is a function of the flowrate, and flowrate is defined as volume over time (e.g., the contact volume proxy discussed hereinbelow over mean residence time).
- a mean residence time is illustrated in FIG. 26A .
- the unit for mean residence time may be in hours.
- the mean residence time can be thought of as a time proxy over which the contact volume proxy discussed hereinbelow gets produced.
- the mean residence time equation hereinabove may be repeated for each unique particulate tracer using the corresponding tracer concentration history that was obtained.
- the step 2515 may be performed using the mean residence time component 2408.
- a mean residence time may be determined using the equation above for each of the twenty-seven unique particulate tracers (i.e., twenty-seven mean residence times may be determined).
- the method 2500 includes step 2520 to determine (e.g., with the physical computer processor such as the processor 3618) a contact volume proxy for each unique particulate tracer using the production history and the corresponding tracer concentration history.
- the contact volume proxy of a specific unique particulate tracer generally refers to an approximate volume of the subterranean formation that was contacted by the specific unique particulate tracer as it diffused/leached/dissolved in the subterranean formation, or in other words, what is the approximate volume of the subterranean formation contacted by the tracer cloud of the specific unique particulate tracer (discussed in FIG. 27 ).
- FIG. 26B One diagram regarding contact volume proxy in the subterranean formation 110 is illustrated in FIG. 26B .
- the proxy for volume through which the tracer cloud flows i.e., contact volume proxy
- the unit for contact volume proxy may be barrels (bbls).
- the contact volume proxy equation hereinabove may be repeated for each unique particulate tracer using the production history and the corresponding tracer concentration history that were obtained.
- the step 2520 may be performed using the contact volume proxy component 2410.
- a contact volume proxy may be determined using the equation above for each of the twenty-seven unique particulate tracers (i.e., twenty-seven contact volume proxies may be determined).
- the method 2500 includes step 2525 to determine (e.g., with the physical computer processor such as the processor 3618) a flow profile for the wellbore for each phase indicative of flow contribution of each stage, each stage group, or any combination thereof by using the corresponding mean residence times and the corresponding contact volume proxies.
- the flow contribution for each stage or stage group is determined, and then, the flow contributions corresponding to a specific phase are included in a flow profile for that specific phase (e.g., a flow profile for the oil phase, a separate flow profile for the water phase, and/or a separate flow profile for the gas phase).
- Each flow profile provides a quantitative evaluation of each stage or stage group's contribution to flow (e.g., per phase) that is not generally available for unique particulate tracers that are placed throughout the entirety of stages and/or stage groups.
- Each flow profile provides a quantitative evaluation of each stage and/or stage group's contribution to flow that is an improvement over the simple binary information of existing techniques.
- the flow contribution may be in the form of a percentage.
- the flow contribution equation hereinabove may be repeated for each stage or stage group using the corresponding mean residence times and the corresponding contact volume proxies that were determined.
- a flow profile for a phase may include all the corresponding flow contribution percentages determined with the equation hereinabove.
- a flow profile for the oil phase includes all the flow contribution percentages determined with the equation hereinabove corresponding to the unique oil particulate tracers, which should sum up to about 100%.
- a separate flow profile for the water phase includes all the flow contribution percentages determined with the equation hereinabove corresponding to the unique water particulate tracers, which should sum up to about 100%.
- a separate flow profile for the gas phase includes all the flow contribution percentages determined with the equation hereinabove corresponding to the unique gas particulate tracers, which should sum up to about 100%.
- a representation of each flow profile for each phase may be generated and displayed using a bar chart, line graph, curves, etc.
- a representation of a flow profile in terms of cumulative information may be generated and displayed.
- the step 2525 may be performed using the flow profile component 2412.
- a flow contribution may be determined using the equation above for each of the twenty-seven unique particulate tracers (i.e., twenty-seven flow contributions may be determined).
- a flow profile for the oil phase for example, in the form of a bar chart may be made using the nine flow contribution percentages corresponding to the oil phase.
- a flow profile for the water phase for example, in the form of a bar chart may be made using the nine flow contribution percentages corresponding to the water phase.
- a flow profile for the gas phase for example, in the form of a bar chart may be made using the nine flow contribution percentages corresponding to the gas phase.
- the method 2500 includes step 2530 to generate, on a graphical user interface such as the graphical display 3624, a representation of the flow profile for the wellbore for each phase indicative of the flow contribution of each stage, each stage group, or any combination thereof, and display, via the graphical user interface, the representation.
- Visual effects may be utilized to illustrate flow contribution per stage and/or stage group in the flow profile.
- a representation of each flow profile for each phase may be generated and displayed using a bar chart, line graph, curves, etc.
- the representation of each flow profile for each phase may include confidence levels, flow contribution information determined in another manner (e.g., using logging equipment, sensors, or other equipment) for comparison, etc.
- a representation of a flow profile in terms of cumulative information e.g., percentage cum oil along the lateral
- Examples of flow profiles for an oil phase are illustrated in FIGS. 33A-33H .
- three representations of flow profiles may be generated and displayed (e.g., a representation of the flow profile for the oil phase in the form of a bar chart using the nine flow contribution percentages corresponding to the oil phase, a representation of the flow profile for the water phase in the form of a bar chart using the nine flow contribution percentages corresponding to the water phase, and a representation of the flow profile for the gas phase in the form of a bar chart using the nine flow contribution percentages corresponding to the gas phase).
- FIG. 1D-3 illustrates individual stages instead of stage groups for simplicity, however, a person of ordinary skill in the art will appreciate that the steps 2505-2530 are also applicable in the context of one or more stage groups.
- the method 2500 may include an optional step 2535 to smooth a tracer concentration history for a specific unique particulate tracer before c) of step 2515 and d) of step 2520 to reduce noise (e.g., reduce points that show large variations ups and/or downs); and utilize the smoothed tracer concentration history for the specific unique particulate tracer in c) of step 2515 and d) of step 2520.
- This optional step 2535 may be performed by curve fitting to smoothen out the data (e.g., normal, log normal, or other representative curve fit).
- a person of ordinary skill in the art will appreciate that a single phase like the oil phase may be of interest so unique oil particulate tracers only may be pumped throughout the stages and/or stage groups (or two phases may be of interest and those corresponding unique particulate tracers may be pumped throughout the stages and/or stage groups).
- the method 2500 applies to one phase, two phases, or three phases.
- the method 2500 may be used for laterals, vertical wellbores, etc.
- FIG. 27 illustrates an example method 2700 for determining a flow profile for a wellbore using unique particulate tracers.
- the method 2700 of FIG. 27 may include at least one of the steps of the method 2500 of FIG. 25 .
- the method 2700 may be utilized if high frequency data with mode is accurately captured with time (e.g., high frequency sampling depending on the flow rate) and/or low oil rate.
- the response delay method may be applied when data is collected in the first 5 days after POP (i.e., popping the wellbore open after shut-in period), such as collecting produced fluid samples at least once a day to about 5+ a day, at least once a day to about 10+ a day, etc.
- POP i.e., popping the wellbore open after shut-in period
- the discussion of method 2700 of FIG. 27 will focus on physical steps that may be performed at the wellbore, in the field, and/or at a laboratory before the method 2500 of FIG. 25 , as generally illustrated in FIG. 24 .
- the method 2700 includes step 2705 to pump at least one unique particulate tracer throughout each stage, each stage group, or any combination thereof during a hydraulic fracturing operation performed in the subterranean formation, such as in FIG. 1D-3 .
- Each unique particulate tracer corresponds to an oil phase, a water phase, or a gas phase.
- the unique particulate tracers may be blended with proppant (e.g., sand) (e.g., the proppant 112) and pumped throughout stages, stage groups, or any combination thereof.
- the unique particulate tracers may be directly injected into the fracturing fluid stream and pumped throughout stages, stage groups, or any combination thereof. Practically any pumping equipment or pumping technique known in the art for pumping unique particulate tracers throughout stages, stage groups, or any combination thereof may be utilized.
- the method 2700 includes step 2710 to shut-in the wellbore for a period of time to cause tracer clouds to form in the subterranean formation for at least a portion of the unique particulate tracers that are pumped throughout the stages, the stage groups, or any combination thereof.
- Shutting in of the wellbore may help build the tracer cloud for each unique particulate tracer pumped as it diffuses/leaches/dissolves in the subterranean formation.
- the wellbore is shut-in for a period of time that is long enough for the injected unique particulate tracers to be detected in the produced fluid samples.
- the wellbore may be shut-in for a period of time such as 1 day to 3 days (i.e., 24 hours to 72 hours).
- shut-in period in some embodiments, such as a shut-in period of upto 5 days (i.e., upto 120 hours).
- the period of time for the shut-in may depend on the unique particulate tracers pumped, logistics and practical realities associated with shutting in a wellbore, etc.
- the wellbore may be shut-in using known techniques for shutting in wellbores.
- the step 2710 shut-in the wellbore for enough time for tracer clouds to be developed so detectable tracer concentrations are produced.
- FIGS. 28A-28B illustrate an example of shut-in to build up tracer clouds.
- the wellbore 120 is shut-in for a period of time long enough for tracer clouds to be developed for the twenty-seven unique particulate tracers 170a oil , 170a water , 170a gas , 170b oil , 170b water , 170b gas , 170c oil , 170c water , 170c gas , 170d oil , 170d water , 170d gas , 170e ⁇ il , 170e water , 170e gas , 170f oil , 170f water , 170f gas , 170g oil , 170g water , 170g gas , 170n-1 oil , 170n-1 water , 170n-1 gas , 170n oil , 170n water , and 170n gas so detectable tracer concentrations are produced from the wellbore 120 as illustrated in FIG. 24 .
- the wellbore 120 may be
- the method 2700 includes step 2715 to flow back the wellbore to cause produced fluid from the wellbore after the shut-in period.
- the wellbore flows back up for the time in which the tracer clouds are produced back (e.g., typically 5 to 7 days).
- the produced fluid samples comprise at least a portion of the unique particulate tracers that are pumped throughout the stages, the stage groups, or any combination thereof.
- step 2715 the wellbore 120 is flowed back to cause produced fluid to exit the wellbore 120.
- the method 2700 includes step 2720 to obtain produced fluid samples comprising unique particulate tracers from a wellbore drilled into a subterranean formation.
- One embodiment may include sampling frequently for the first few days ( ⁇ 5 days and a function of flow rate) until the tracer clouds get produced.
- the samples from the produced fluid may be obtained directly from a wellhead that is fluidly coupled to the wellbore using practically any technique and/or equipment known in the art for sampling produced fluid.
- Information about an automated tracer sampling and measurement system may be found in U.S. Patent Publication Application No. 2014/0260694 , which is incorporated by reference.
- produced fluid samples may be collected from the wellbore 120, such as from the wellhead of the wellbore 120.
- the produced fluid samples comprise at least a portion of the twenty-seven unique particulate tracers that are pumped throughout the nine stages. For example, produced fluid samples may be collected at least once a day to about 5+ a day, at least once a day to about 10+ a day, etc. for approximately five days.
- the method 2700 includes step 2725 to analyze the produced fluid samples obtained from the produced fluid to generate the tracer concentration history for each unique particulate tracer.
- the produced fluid samples obtained from the produced fluid from the wellbore may be analyzed in a laboratory using equipment and/or tests such as, but not limited to: chromatography, ultra-high-performance liquid chromatography (UHPLC) with a fluorescent light scattering detector and a diode array detector (DAD) may be used to obtain the spectral profile of samples, triple quad mass spec liquid chromatography may be used to integrate target ions and precursor ions of the chemical of interest, or other known techniques to generate a tracer concentration history for each unique particulate tracer.
- UHPLC ultra-high-performance liquid chromatography
- DAD diode array detector
- triple quad mass spec liquid chromatography may be used to integrate target ions and precursor ions of the chemical of interest, or other known techniques to generate a tracer concentration history for each unique particulate tracer.
- the generated tracer concentration histories may be provided to the system 3600 (e.g., one or more remote computing devices of the laboratory may be communicatively coupled to the system 3600 via a wired or wireless connection).
- the generated tracer concentration history for each unique particulate tracer may be obtained from a non-transitory storage medium at the step 2505 and used to determine a flow profile for each phase as described hereinabove in connection with FIGS. 24 , 25 , and 36 .
- twenty-seven tracer concentration histories may be generated in the laboratory and used to determine a flow profile for each phase.
- the method 2700 includes step 2730 to determine the production history of the wellbore.
- any technique and/or equipment e.g., downhole and/or on the surface
- flow meters e.g., temperature sensors, pressure pressures, separators (e.g., using a test separator in the field for about 24 hours), etc.
- separators e.g., using a test separator in the field for about 24 hours
- the production history may be determined in the field using this equipment.
- Information about generating a production history is provided at the following: Izgec, B.., Hasan, A.R.. R., Lin, D, and C.S.. S. Kabir. "Flow-Rate Estimation From Wellhead-Pressure and Temperature Data.” SPE Prod & Oper 25 (2010): 31-39 , which is incorporated by reference.
- the generated production history of the wellbore may be provided to the system 3600 (e.g., one or more remote meters, remote sensors, or computing devices may be communicatively coupled to the system 3600 via a wired or wireless connection).
- the generated production history for the wellbore may be obtained from a non-transitory storage medium at the step 2510 and used to determine a flow profile for each phase as described hereinabove in connection with FIGS. 24 , 25 , and 36 .
- a production history may be generated for the wellbore 120 and used to determine a flow profile for each phase.
- the method 2700 includes a step of determining a flow profile for the wellbore for each phase using the produced fluid samples comprising the unique particulate tracers by: a) obtaining a tracer concentration history for each unique particulate tracer; b) obtaining a production history for the wellbore; c) determining a mean residence time for each unique particulate tracer using the corresponding tracer concentration history; d) determining a contact volume proxy for each unique particulate tracer using the production history and the corresponding tracer concentration history; and e) determining the flow profile for the wellbore for each phase indicative of flow contribution of each stage, each stage group, or any combination thereof by using the corresponding mean residence times and the corresponding contact volume proxies.
- the step may be performed as explained hereinabove in connection with FIGS. 24 , 25 , and 36 .
- the step 2735 may be performed in other ways in some embodiments.
- one or more of the steps of the method 2700 may be implemented using a computing system such as in FIG. 36 .
- DECLINE METHOD The methods and systems of the present disclosure may be implemented by a system and/or in a system, such as a system 3600 shown in FIG. 36 and FIG. 29 .
- a method of determining a flow profile for a wellbore using unique particulate tracers may be performed by the processor 3618, including input such as at least one tracer concentration history (e.g., a tracer concentration history for each unique particulate tracer) and/or optionally a production history for a wellbore as well as output such as a flow profile for the wellbore for each phase indicative of flow contribution of each stage, each stage group, or any combination thereof.
- tracer concentration history e.g., a tracer concentration history for each unique particulate tracer
- output such as a flow profile for the wellbore for each phase indicative of flow contribution of each stage, each stage group, or any combination thereof.
- the electronic storage 3622 may store information relating to the tracer concentration history for each unique particulate tracer, optionally the production history of the wellbore, information about the produced fluid samples, and/or other information.
- the graphical display 3624 may present information relating to the flow profile for the wellbore for each phase indicative of the flow contribution of each stage, each stage group, or any combination thereof, and/or other information.
- the processor 3618 may be configured to execute one or more machine-readable instructions 3602 to facilitate determining the flow profile for the wellbore for each phase using the particulate tracers.
- the machine-readable instructions 3602 may include one or more computer program components.
- the machine-readable instructions 3602 may include a tracer concentration history component 2904, optionally a production history component 2906, a decline rate component 2908, a normalization factor component 2910, a normalized decline rate component 2911, a flow profile component 2912, a smoothing component 2914, a representation component 2916, and/or other computer program components.
- the tracer concentration history component 2904 may be configured to obtain (e.g., from the non-transitory storage medium such as the electronic storage 3622) a tracer concentration history for each unique particulate tracer in produced fluid samples from a wellbore drilled into a subterranean formation. At least one unique particulate tracer is pumped throughout each stage, each stage group, or any combination thereof during a hydraulic fracturing operation performed in the subterranean formation. Each unique particulate tracer corresponds to an oil phase, a water phase, or a gas phase.
- the produced fluid samples comprise at least a portion of the unique particulate tracers that are pumped throughout the stages, the stage groups, or any combination thereof.
- the optional production history component 2906 may be configured to obtain (e.g., from the non-transitory storage medium such as the electronic storage 3622) a production history for the wellbore.
- the decline rate component 2908 may be configured to determine (e.g., with the physical computer processor such as the processor 3618) a decline rate for each unique particulate tracer using the corresponding tracer concentration history.
- the normalization factor component 2910 may be configured to determine (e.g., with the physical computer processor such as the processor 3618) a normalization factor for each unique particulate tracer using the corresponding tracer concentration history and optionally the production history.
- the normalized decline rate component 2911 may be configured to determine (e.g., with the physical computer processor such as the processor 3618) a normalized decline rate for each unique particulate tracer using the corresponding decline rate and the corresponding normalization factor.
- the flow profile component 2912 may be configured to determine (e.g., with the physical computer processor such as the processor 3618) a flow profile for the wellbore for each phase indicative of flow contribution of each stage, each stage group, or any combination thereof by using the corresponding normalized decline rates.
- the smoothing component 2914 may be configured to smooth (e.g., with the physical computer processor such as the processor 3618) a tracer concentration history for a specific unique particulate tracer before determining a decline rate and before determining a normalization factor to reduce noise.
- the smoothed tracer concentration history for the specific unique particulate tracer may be utilized in determining the decline rate and determining the normalization factor.
- the representation component 2916 may be configured to generate (e.g., on the graphical user interface such as the graphical display 3624) a representation of the flow profile for the wellbore for each phase indicative of the flow contribution of each stage, each stage group, or any combination thereof.
- the representation component 2916 may be configured to display (e.g., on the graphical user interface such as the graphical display 3624) the representation.
- FIG. 30 illustrates an example method 3000 for determining a flow profile for a wellbore using unique particulate tracers.
- the method 3000 may be referred to as a decline method herein, however, those of ordinary skill in the art will appreciate that this terminology is not meant to be limiting.
- the method 3000 may be utilized to determine a flow profile for a wellbore per phase during producing life if high frequency data is not available and/or high oil rate (e.g., a high oil rate may be about 1,000 bbls a day).
- the method 3000 may be utilized to determine a flow profile for a wellbore per phase if tracer leach rate (diffusion) is not known.
- the method 3000 includes step 3005 to obtain (e.g., from the non-transitory storage medium such as the electronic storage 3622) a tracer concentration history for each unique particulate tracer in produced fluid samples from a wellbore drilled into a subterranean formation. At least one unique particulate tracer is pumped throughout each stage, each stage group, or any combination thereof during a hydraulic fracturing operation performed in the subterranean formation. Each unique particulate tracer corresponds to an oil phase, a water phase, or a gas phase. For example, if a flow profile for the oil phase is desired, then unique oil particulate tracers that will react to oil should be pumped throughout the stages.
- the produced fluid samples comprise at least a portion of the unique particulate tracers that are pumped throughout the stages, the stage groups, or any combination thereof.
- the tracer concentration history of a specific unique particulate tracer may include a tracer concentration (e.g., in parts per billion (ppb)) as a function of time for the specific stage that it is pumped into during the hydraulic fracturing operation.
- the tracer concentration history for each unique particulate tracer that is obtained at the step 3005 may be previously generated using laboratory analysis (discussed in FIG. 27 ).
- the produced fluid samples obtained from the produced fluid from the wellbore may be analyzed in a laboratory using equipment and/or tests such as, but not limited to: chromatography.
- ultra-high-performance liquid chromatography with a fluorescent light scattering detector and a diode array detector (DAD) may be used to obtain the spectral profile of samples
- triple quad mass spec liquid chromatography may be used to integrate target ions and precursor ions of the chemical of interest, or other known techniques to generate a tracer concentration history for each unique particulate tracer.
- This generated tracer concentration history for each unique particulate tracer may be obtained from a non-transitory storage medium at the step 3005.
- Two example tracer concentration histories in curve form are illustrated in FIG. 1H .
- the step 3005 may be performed using the tracer concentration history component 2904.
- the running example based on FIG. 1D-3 assumes that the wellbore 120 produces oil, water, and gas, and therefore, a unique oil particulate tracer, a unique water particulate tracer, and a unique gas particulate tracer are pumped throughout each stage of the figure (i.e., throughout the nine stages). In other words, a total of twenty-seven unique particulate tracers (i.e., nine unique oil particulate tracers, nine unique water particulate tracers, and nine unique gas particulate tracers) are pumped in FIG.
- this running example assumes that all twenty-seven unique particulate tracers 170a oil , 170a water , 170a gas , 170b oil , 170b water , 170b gas , 170c oil , 170c water , 170c gas , 170d oil , 170d water , 170d gas , 170e oil , 170e water , 170e gas , 170f oil , 170f water , 170f gas , 170g oil , 170g water , 170g gas , 170n-1 oil , 170n-1 water , 170n-1 gas , 170n oil , 170n water , and 170n gas were detected by laboratory analysis in the produced fluid samples from the wellbore 120.
- a tracer concentration history is obtained from a non-transitory storage medium for each of the twenty-seven unique particulate tracers (i.e., twenty-seven tracer concentration histories may be obtained from the non-transitory storage medium).
- the method 3000 includes optional step 3010 to obtain (e.g., from the non-transitory storage medium such as the electronic storage 3622) a production history for the wellbore.
- the production history accounts for the phases of the produced fluid of the wellbore, including the oil phase, the water phase, the gas phase, or any combination thereof.
- the production history that is obtained may include quantity (e.g., barrels (bbls) per day) of oil that is produced from the wellbore, quantity (e.g., barrels (bbls) per day) of water that is produced from the wellbore, quantity (e.g., standard cubic feet (scf) per day) of gas that is produced from the wellbore, or any combination thereof.
- quantity e.g., barrels (bbls) per day
- the production history accounts for all three phases.
- the production history may reflect water, oil, or both water and oil but not gas.
- the production history may include quantity or rate of oil that is produced from the wellbore, quantity or rate of water that is produced from the wellbore, quantity or rate of gas that is produced from the wellbore, or any combination thereof, for example, as a function of time.
- the production history may include additional information, such as, but not limited to, wellbore identification information, well geographic properties (e.g., x coordinate for the heel, y coordinate for the heel, depth, and/or azimuth), geologic properties (e.g., identification information for the subterranean formation), wellbore properties (e.g., tortuosity), completion properties (e.g., perforated length, proppant intensity, and/or fracturing fluid intensity), etc.
- the production history for the wellbore that is obtained from the non-transitory storage medium at the step 3010 may be previously generated using known techniques (discussed in FIG. 27 ).
- the step 3010 may be performed using the production history component 2906.
- a production history may be obtained for the wellbore 120 that includes the quantity or rate of oil that is produced from the wellbore 120, the quantity or rate of water that is produced from the wellbore 120, and the quantity or rate of gas that is produced from the wellbore 120.
- the method 3000 includes step 3015 to determine (e.g., with a physical computer processor such as the processor 3618) a decline rate for each unique particulate tracer using the corresponding tracer concentration history.
- flow rate from the stages and/or stage groups is a function of how quickly the tail of a tracer concentration history curve declines from a stage and/or stage group. The faster the decline, the higher the flow rate because the tracer cloud would be produced quicker and vice versa.
- Two diagrams regarding decline rate are illustrated in FIGS. 31A-31B .
- the decline rate is the slope of a tail for a tracer concentration history curve as shown in the plot to the right as r1 and r2 in FIG. 31B .
- the unit for decline rate may be in parts per billion (ppb) per day.
- the tail of a specific tracer concentration history is where the slope becomes substantially constant (and stops changing).
- the decline rate equation hereinabove may be repeated for each unique particulate tracer using the corresponding tracer concentration history that was obtained.
- the step 3015 may be performed using the mean residence time component 2908.
- a decline rate may be determined using the equation above for each of the twenty-seven unique particulate tracers (i.e., twenty-seven decline rates may be determined).
- the method 3000 includes step 3020 to determine (e.g., with the physical computer processor such as the processor 3618) a normalization factor for each unique particulate tracer using the corresponding tracer concentration history and optionally the production history.
- a normalization factor may be utilized for the normalization, and the normalization factor may be determined in two ways. Normalizing with the maximum/peak value of the concentration or the area under the curve are appropriate normalization factors.
- the unit for normalization factor may be in parts per billion (ppb).
- the normalization factor equation hereinabove may be repeated for each unique particulate tracer using the corresponding tracer concentration history that were obtained.
- the step 3020 may be performed using the normalization factor component 2910.
- norm_factor normalization factor
- t time
- q production history
- ⁇ fluid density (e.g., in pounds per feet 3 )
- c tracer concentration history
- dt integration with respect to time.
- the unit for the normalization factor may be in pounds.
- the normalization factor equation hereinabove may be repeated for each unique particulate tracer using the corresponding tracer concentration history and the production history that were obtained.
- the step 3020 may be performed using the normalization factor component 2910.
- a normalization factor may be determined using one of the equations above for each of the twenty-seven unique particulate tracers (i.e., twenty-seven normalization factors may be determined).
- the method 3000 includes step 3025 to determine (e.g., with the physical computer processor such as the processor 3618) a normalized decline rate for each unique particulate tracer using the corresponding decline rate and the corresponding normalization factor.
- the unit for normalized decline rate may be in 1/pound if the second normalization factor is utilized.
- the normalized decline rate hereinabove may be repeated for each unique particulate tracer using the corresponding decline rate and the corresponding normalization factor that were obtained.
- the step 3025 may be performed using the normalized decline rate component 2911.
- a normalized decline rate may be determined using the equation above for each of the twenty-seven unique particulate tracers (i.e., twenty-seven normalized decline rates may be determined).
- the method 3000 includes step 3030 to determine (e.g., with the physical computer processor such as the processor 3618) a flow profile for the wellbore for each phase indicative of flow contribution of each stage, each stage group, or any combination thereof by using the corresponding normalized decline rates.
- the flow contribution for each stage or stage group is determined, and then, the flow contributions corresponding to a specific phase are included in a flow profile for that specific phase (e.g., a flow profile for the oil phase, a separate flow profile for the water phase, and/or a separate flow profile for the gas phase).
- Each flow profile provides a quantitative evaluation of each stage or stage group's contribution to flow (e.g., per phase) that is not generally available for unique particulate tracers that are placed throughout the entirety of stages and/or stage groups.
- Each flow profile provides a quantitative evaluation of each stage and/or stage group's contribution to flow that is an improvement over the simple binary information of existing techniques.
- the flow contribution may be in the form of a percentage.
- the flow contribution equation hereinabove may be repeated for each stage or stage group using the corresponding normalized decline rates that were determined.
- a flow profile for a phase may include all the corresponding flow contribution percentages determined with the equation hereinabove.
- a flow profile for the oil phase includes all the flow contribution percentages determined with the equation hereinabove corresponding to the unique oil particulate tracers, which should sum up to about 100%.
- a separate flow profile for the water phase includes all the flow contribution percentages determined with the equation hereinabove corresponding to the unique water particulate tracers, which should sum up to about 100%.
- a separate flow profile for the gas phase includes all the flow contribution percentages determined with the equation hereinabove corresponding to the unique gas particulate tracers, which should sum up to about 100%.
- a representation of each flow profile for each phase may be generated and displayed using a bar chart, line graph, curves, etc.
- a representation of a flow profile in terms of cumulative information may be generated and displayed.
- the step 3030 may be performed using the flow profile component 2912.
- a flow contribution may be determined using the equation above for each of the twenty-seven unique particulate tracers (i.e., twenty-seven flow contributions may be determined).
- a flow profile for the oil phase for example, in the form of a bar chart may be made using the nine flow contribution percentages corresponding to the oil phase.
- a flow profile for the water phase for example, in the form of a bar chart may be made using the nine flow contribution percentages corresponding to the water phase.
- a flow profile for the gas phase for example, in the form of a bar chart may be made using the nine flow contribution percentages corresponding to the gas phase.
- the method 3000 includes step 3035 to generate, on a graphical user interface such as the graphical display 3624, a representation of the flow profile for the wellbore for each phase indicative of the flow contribution of each stage, each stage group, or any combination thereof, and display, via the graphical user interface, the representation.
- Visual effects may be utilized to illustrate flow contribution per stage and/or stage group in the flow profile.
- a representation of each flow profile for each phase may be generated and displayed using a bar chart, line graph, curves, etc.
- the representation of each flow profile for each phase may include confidence levels, flow contribution information determined in another manner (e.g., using logging equipment, sensors, or other equipment) for comparison, etc.
- a representation of a flow profile in terms of cumulative information e.g., percentage cum oil along the lateral
- Examples of flow profiles for an oil phase are illustrated in FIGS. 33A-33H .
- three representations of flow profiles may be generated and displayed (e.g., a representation of the flow profile for the oil phase in the form of a bar chart using the nine flow contribution percentages corresponding to the oil phase, a representation of the flow profile for the water phase in the form of a bar chart using the nine flow contribution percentages corresponding to the water phase, and a representation of the flow profile for the gas phase in the form of a bar chart using the nine flow contribution percentages corresponding to the gas phase).
- FIG. 1D-3 illustrates individual stages instead of stage groups for simplicity, however, a person of ordinary skill in the art will appreciate that the steps 3005-3035 are also applicable in the context of one or more stage groups.
- the method 3000 may include an optional step 3040 to smooth a tracer concentration history for a specific unique particulate tracer before c) of step 3015 and d) of step 3020 to reduce noise (e.g., reduce points that show large variations ups and/or downs); and utilize the smoothed tracer concentration history for the specific unique particulate tracer in c) of step 3015 and d) of step 3020.
- the optional step 3040 may smoothen out a tail of the tracer concentration history for a specific unique particulate tracer.
- This optional step 3040 may be performed by curve fitting to smoothen out the data (e.g., linear regression or other representative curve fit).
- a person of ordinary skill in the art will appreciate that a single phase like the oil phase may be of interest so unique oil particulate tracers only may be pumped throughout the stages and/or stage groups (or two phases may be of interest and those corresponding unique particulate tracers may be pumped throughout the stages and/or stage groups).
- the method 2500 applies to one phase, two phases, or three phases.
- the method 3000 may be used for laterals, vertical wellbores, etc.
- FIG. 32 illustrates an example method 3200 for determining a flow profile for a wellbore using unique particulate tracers.
- the method 3200 of FIG. 32 may include at least one of the steps of the method 3000 of FIG. 30 .
- the method 3200 of FIG. 32 may include at least one of the steps of the method 2700 of FIG. 27 and FIG. 29 .
- the method 3200 may also be referred to as a decline method herein, however, those of ordinary skill in the art will appreciate that this terminology is not meant to be limiting.
- the method 3200 may be utilized to determine a flow profile for a wellbore per phase during producing life if high frequency data is not available and/or high oil rate (e.g., a high oil rate may be about 1,000 bbls a day).
- the method 3200 may be utilized to determine a flow profile for a wellbore per phase if tracer leach rate (diffusion) is not known.
- FIGS. 33A-33H illustrate various examples of flow profiles for an oil phase only (i.e., unique oil particulate tracers are pumped throughout stage groups) and corresponding tracer concentrations histories for the examples. Tracer concentration histories for time period A (Post POP) in FIG. 33D and for time period B in 33A are illustrated in the figures. Logging information for time period C was also obtained and utilized for comparisons. In FIGS. 33B-33C and 33G-33H , tracer interpretation shows good correspondence with the logging interpretation. In FIGS.
- tracer interpretation post POP using the response time delay method for period A and using the delay method for period B also show change in the flow contribution from the toe stages in the 3 month production period, which allows for time-based flow profiling.
- the response time delay method and the decline method may be utilized on the substantially same data as illustrated in FIGS. 33G-33H .
- FIGS. 34A-34B and 35A also illustrate tracer concentration histories used with the response time delay method and the decline method as in FIG. 34C and 35B , respectively.
- tracer based flow profiling may accomplish the following: (1) eliminate uncertainty due to well trajectory, (2) uncertainty due to multi-phase flow issues in the wellbore if the reservoir contact volume is larger than the wellbore volume, and/or (3) flow profiling as a function of time with minimal intervention (e.g., shutting in the well for 24 to 48 hours and high frequency sampling post shut-in).
- tracer release rate understanding is important for correct interpretation post POP in the flowing life of the wellbore for response time delay method, but the decline method is independent of the release rate as long as enough tracer is detected,
- flowback sampling frequency post shut-in should be high when the oil flowrates increase for response time delay method to work correctly,
- lower resolution because of the limitation with the number of tracers available, and/or
- 24 hour LPO if flow profiling is desired after initial POP but could be synchronized with planned shut-ins/workovers.
- some considerations include (I) does not depend on the release rate explicitly but assumes that all the particulate tracers have the same release rate as a function of time and would enable flow profiling over time, (II) tracer baseline can be deduced from the tracer signal itself if the previous statement on tracer design is true, and/or (III) particulate tracers may provide meaningful signal over the early life (at least 1 year) of the well. Advantages include: (i) non-interventional flow profiling which could be used upto 12 months and extended to 18 months and/or (ii) test could be planned when changes in well behavior are observed.
- tracer-based flow profiling may provide adequate flow profiles, even though tracer based flow profiling may produce lower resolution data as compared to logging data.
- the system 3600 may include one or more of a processor 3618, an interface 3620 (e.g., bus, wireless interface), an electronic storage 3622, a graphical display 3624, and/or other components.
- the electronic storage 3622 may be configured to include electronic storage medium that electronically stores information (e.g., non-transitory storage media that electronically stores information).
- the electronic storage 3622 may store software algorithms, information determined by the processor 3618, information received remotely, and/or other information that enables the system 3600 to function properly.
- the electronic storage media of the electronic storage 3622 may be provided integrally (i.e., substantially non-removable) with one or more components of the system 3600 and/or as removable storage that is connectable to one or more components of the system 3600 via, for example, a port (e.g., a USB port, a Firewire port, etc.) or a drive (e.g., a disk drive, etc.).
- a port e.g., a USB port, a Firewire port, etc.
- a drive e.g., a disk drive, etc.
- the electronic storage 3622 may include one or more of optically readable storage media (e.g., optical disks, etc.), magnetically readable storage media (e.g., magnetic tape, magnetic hard drive, floppy drive, etc.), electrical charge-based storage media (e.g., EPROM, EEPROM, RAM, etc.), solid-state storage media (e.g., flash drive, etc.), and/or other electronically readable storage media.
- the electronic storage 3622 may be a separate component within the system 3600, or the electronic storage 3622 may be provided integrally with one or more other components of the system 3600 (e.g., the processor 3618). Although the electronic storage 3622 is shown in FIG. 36 as a single entity, this is for illustrative purposes only. In some implementations, the electronic storage 3622 may comprise a plurality of storage units. These storage units may be physically located within the same device, or the electronic storage 3622 may represent storage functionality of a plurality of devices operating in coordination.
- the graphical display 3624 may refer to an electronic device that provides visual presentation of information.
- the graphical display 3624 may include a color display and/or a non-color display.
- the graphical display 3624 may be configured to visually present information.
- the graphical display 3624 may present information using/within one or more graphical user interfaces.
- the processor 3618 may be configured to provide information processing capabilities in the system 3600.
- the processor 3618 may comprise one or more of a digital processor, an analog processor, a digital circuit designed to process information, a central processing unit, a graphics processing unit, a microcontroller, an analog circuit designed to process information, a state machine, and/or other mechanisms for electronically processing information.
- the processor 3618 may be configured to execute one or more machine-readable instructions 3602.
- the machine-readable instructions 3602 may include one or more computer program components.
- computer program components are illustrated in FIG. 36 as being co-located within a single processing unit, one or more of computer program components may be located remotely from the other computer program components. While computer program components are described as performing or being configured to perform operations, computer program components may comprise instructions which may program processor 3618 and/or system 3600 to perform the operation.
- While computer program components are described herein as being implemented via processor 3618 through machine-readable instructions 3602, this is merely for ease of reference and is not meant to be limiting. In some implementations, one or more functions of computer program components described herein may be implemented via hardware (e.g., dedicated chip, field-programmable gate array) rather than software. One or more functions of computer program components described herein may be software-implemented, hardware-implemented, or software and hardware-implemented.
- processor 3618 may be configured to execute one or more additional computer program components that may perform some or all of the functionality attributed to one or more of computer program components described herein.
- the term “if” may be construed to mean “when” or “upon” or “in response to determining” or “in accordance with a determination” or “in response to detecting,” that a stated condition precedent is true, depending on the context.
- the phrase “if it is determined [that a stated condition precedent is true]” or “if [a stated condition precedent is true]” or “when [a stated condition precedent is true]” may be construed to mean “upon determining” or “in response to determining” or “in accordance with a determination” or “upon detecting” or “in response to detecting” that the stated condition precedent is true, depending on the context.
- a range of 10% to 20% includes 10% and also includes 20%, and includes percentages in between 10% and 20%, unless explicitly stated otherwise herein.
- a range of between 10% and 20% includes 10% and also includes 20%, and includes percentages in between 10% and 20%, unless explicitly stated otherwise herein.
- the item described by this phrase could include only a component of type C. In some embodiments, the item described by this phrase could include a component of type A and a component of type B. In some embodiments, the item described by this phrase could include a component of type A and a component of type C. In some embodiments, the item described by this phrase could include a component of type B and a component of type C. In some embodiments, the item described by this phrase could include a component of type A, a component of type B, and a component of type C. In some embodiments, the item described by this phrase could include two or more components of type A (e.g., A1 and A2).
- the item described by this phrase could include two or more components of type B (e.g., B1 and B2). In some embodiments, the item described by this phrase could include two or more components of type C (e.g., C1 and C2). In some embodiments, the item described by this phrase could include two or more of a first component (e.g., two or more components of type A (A1 and A2)), optionally one or more of a second component (e.g., optionally one or more components of type B), and optionally one or more of a third component (e.g., optionally one or more components of type C).
- a first component e.g., two or more components of type A (A1 and A2)
- a second component e.g., optionally one or more components of type B
- a third component e.g., optionally one or more components of type C.
- the item described by this phrase could include two or more of a first component (e.g., two or more components of type B (B1 and B2)), optionally one or more of a second component (e.g., optionally one or more components of type A), and optionally one or more of a third component (e.g., optionally one or more components of type C).
- the item described by this phrase could include two or more of a first component (e.g., two or more components of type C (C1 and C2)), optionally one or more of a second component (e.g., optionally one or more components of type A), and optionally one or more of a third component (e.g., optionally one or more components of type B).
- T-11543A This disclosure includes the following elements:
- T-11543B This disclosure includes the following elements:
- T-11543C This disclosure includes the following elements:
- the various features may be implemented in hardware, or as software modules running on one or more processors/computers.
- the invention also provides a computer program or a computer program product comprising instructions which, when executed by a computer, cause the computer to carry out any of the methods/method steps described herein, and a non-transitory computer-readable medium comprising instructions which, when executed by a computer, cause the computer to carry out any of the methods/method steps described herein.
- a computer program embodying the invention may be stored on a non-transitory computer-readable medium, or it could, for example, be in the form of a signal such as a downloadable data signal provided from an Internet website, or it could be in any other form.
Landscapes
- Life Sciences & Earth Sciences (AREA)
- Engineering & Computer Science (AREA)
- Physics & Mathematics (AREA)
- Geology (AREA)
- Mining & Mineral Resources (AREA)
- Chemical & Material Sciences (AREA)
- Health & Medical Sciences (AREA)
- Environmental & Geological Engineering (AREA)
- General Life Sciences & Earth Sciences (AREA)
- Fluid Mechanics (AREA)
- Geochemistry & Mineralogy (AREA)
- Biochemistry (AREA)
- Immunology (AREA)
- Pathology (AREA)
- General Physics & Mathematics (AREA)
- Food Science & Technology (AREA)
- Medicinal Chemistry (AREA)
- Analytical Chemistry (AREA)
- General Health & Medical Sciences (AREA)
- Geophysics (AREA)
- Chemical Kinetics & Catalysis (AREA)
- General Chemical & Material Sciences (AREA)
- Oil, Petroleum & Natural Gas (AREA)
- Remote Sensing (AREA)
- Geophysics And Detection Of Objects (AREA)
Abstract
Description
- This application claims priority to
United States Provisional Patent Application Serial Number 63/288,447 titled "Surveillance Using Particulate Tracers" and filed on December 10, 2021 - Not applicable.
- The disclosed embodiments relate generally to techniques for surveillance using particulate tracers.
- Tracers are used in the hydrocarbon industry to track flow patterns and rates of the particular fluid to which it is introduced. Tracers are also used to study properties of the subterranean formation in which the fluid resides. Tracers commonly are chemical compounds that have negligible effects on the fluid. In operation, tracers are injected into the subterranean formation, and thereafter produced and sampled to measure for tracer concentration. There exists a need for surveillance using particulate tracers.
- In accordance with some embodiments, a method of determining a flow profile for a wellbore using unique particulate tracers is disclosed. The method comprises obtaining produced fluid samples comprising unique particulate tracers from a wellbore drilled into a subterranean formation, wherein at least one unique particulate tracer is pumped throughout each stage, each stage group, or any combination thereof during a hydraulic fracturing operation performed in the subterranean formation, and wherein each unique particulate tracer corresponds to an oil phase, a water phase, or a gas phase, and wherein the produced fluid samples comprise at least a portion of the unique particulate tracers that were pumped throughout the stages, the stage groups, or any combination thereof. The method further comprises determining a flow profile for the wellbore for each phase using the produced fluid samples comprising the unique particulate tracers by: a) obtaining a tracer concentration history for each unique particulate tracer; b) obtaining a production history for the wellbore; c) determining a mean residence time for each unique particulate tracer using the corresponding tracer concentration history; d) determining a contact volume proxy for each unique particulate tracer using the production history and the corresponding tracer concentration history; and e) determining the flow profile for the wellbore for each phase indicative of flow contribution of each stage, each stage group, or any combination thereof by using the corresponding mean residence times and the corresponding contact volume proxies.
- In accordance with some embodiments, a method of determining a flow profile for a wellbore using unique particulate tracers, the method being implemented in a computer system that includes a physical computer processor and non-transitory storage medium. The method comprises: a) obtaining, from a non-transitory storage medium, a tracer concentration history for each unique particulate tracer in produced fluid samples from a wellbore drilled into a subterranean formation, wherein at least one unique particulate tracer is pumped throughout each stage, each stage group, or any combination thereof during a hydraulic fracturing operation performed in the subterranean formation, and wherein each unique particulate tracer corresponds to an oil phase, a water phase, or a gas phase, and wherein the produced fluid samples comprise at least a portion of the unique particulate tracers that were pumped throughout the stages, the stage groups, or any combination thereof. The method further comprises b) obtaining, from the non-transitory storage medium, a production history for the wellbore; c) determining, with a physical computer processor, a mean residence time for each unique particulate tracer using the corresponding tracer concentration history; d) determining, with the physical computer processor, a contact volume proxy for each unique particulate tracer using the production history and the corresponding tracer concentration history; and e) determining, with the physical computer processor, a flow profile for the wellbore for each phase indicative of flow contribution of each stage, each stage group, or any combination thereof by using the corresponding mean residence times and the corresponding contact volume proxies.
- In accordance with some embodiments, a method of determining a flow profile for a wellbore using unique particulate tracers. The method comprises obtaining produced fluid samples comprising unique particulate tracers from a wellbore drilled into a subterranean formation, wherein at least one unique particulate tracer is pumped throughout each stage, each stage group, or any combination thereof during a hydraulic fracturing operation performed in the subterranean formation, and wherein each unique particulate tracer corresponds to an oil phase, a water phase, or a gas phase, and wherein the produced fluid samples comprise at least a portion of the unique particulate tracers that were pumped throughout the stages, the stage groups, or any combination thereof. The method further comprises determining a flow profile for the wellbore for each phase using the produced fluid samples comprising the unique particulate tracers by: a) obtaining a tracer concentration history for each unique particulate tracer; b) optionally obtaining a production history for the wellbore; c) determining a decline rate for each unique particulate tracer using the corresponding tracer concentration history; d) determining a normalization factor for each unique particulate tracer using the corresponding tracer concentration history and optionally the production history; e) determining a normalized decline rate for each unique particulate tracer using the corresponding decline rate and the corresponding normalization factor; and f) determining a flow profile for the wellbore for each phase indicative of flow contribution of each stage, each stage group, or any combination thereof by using the corresponding normalized decline rates.
- In accordance with some embodiments, a method of determining a flow profile for a wellbore using unique particulate tracers, the method being implemented in a computer system that includes a physical computer processor and non-transitory storage medium. The method comprises a) obtaining, from the non-transitory storage medium, a tracer concentration history for each unique particulate tracer in produced fluid samples from a wellbore drilled into a subterranean formation, wherein at least one unique particulate tracer is pumped throughout each stage, each stage group, or any combination thereof during a hydraulic fracturing operation performed in the subterranean formation, and wherein each unique particulate tracer corresponds to an oil phase, a water phase, or a gas phase, and wherein the produced fluid samples comprise at least a portion of the unique particulate tracers that were pumped throughout the stages, the stage groups, or any combination thereof. The method further comprises b) optionally obtaining, from the non-transitory storage medium, a production history for the wellbore; c) determining, with the physical computer processor, a decline rate for each unique particulate tracer using the corresponding tracer concentration history; d) determining, with the physical computer processor, a normalization factor for each unique particulate tracer using the corresponding tracer concentration history and optionally the production history; e) determining, with the physical computer processor, a normalized decline rate for each unique particulate tracer using the corresponding decline rate and the corresponding normalization factor; and f) determining, with the physical computer processor, a flow profile for the wellbore for each phase indicative of flow contribution of each stage, each stage group, or any combination thereof by using the corresponding normalized decline rates.
-
-
FIGS. 1A, 1B, and 1C show a field system, and details thereof, with which example embodiments can be used. -
FIGS. 1D-1 ,1D-2 ,1D-3 illustrates examples of unique particulate tracers pumped throughout stages in the context of a single wellbore. -
FIGS. 1E-1 ,1E-2 ,1E-3 illustrates examples of unique particulate tracers pumped throughout stages in the context of multiple wellbores. -
FIG. 1F illustrates that the unique particulate tracers may react and diffuse into flowing fluid and the fluid may be produced from a wellbore as produced fluid. -
FIG. 1G-1H illustrate diagram related to binary response. -
FIG. 2A-2D illustrate embodiments of pumping unique particulate tracers in the near wellbore region in the context of a single wellbore. -
FIG. 3A-3C illustrate embodiments of pumping unique particulate tracers in the near wellbore region in the context of a multiple wellbores. -
FIG. 4 illustrates an example method of placing unique particulate tracers in a subterranean formation having a wellbore therewithin. -
FIG. 5 illustrates an example of Vwellbore,min and Lwellbore,min . -
FIG. 6 illustrates an expected tracer release rate plot. -
FIG. 7A-7G include various examples consistent with the disclosure. -
FIG. 8 illustrates an example computer system consistent with the disclosure. -
FIG. 9 illustrates an example method of determining a flow profile for a wellbore using unique particulate tracers -
FIG. 10 illustrates more information including the Δt, which is arrival time difference. -
FIG. 11-22 illustrate various ways to refine the wellbore volume and various other optional steps. -
FIG. 23 illustrates an example computer system consistent with the disclosure. -
FIG. 24 illustrates an example computer system consistent with the disclosure. -
FIG. 25 illustrates an example method for determining a flow profile for a wellbore using unique particulate tracers. -
FIG. 26A illustrates one diagram regarding mean residence time.FIG. 26B illustrates one diagram regarding contact volume proxy. -
FIG. 27 illustrates an example method for determining a flow profile for a wellbore using unique particulate tracers. -
FIG. 28A-28B illustrate an example of shut-in to build up tracer clouds. -
FIG. 29 illustrates an example computer system consistent with the disclosure. -
FIG. 30 illustrates an example method for determining a flow profile for a wellbore using unique particulate tracers. -
FIG. 31A-31B illustrate two diagrams regarding decline rate. -
FIG. 32 illustrates an example method for determining a flow profile for a wellbore using unique particulate tracers. -
FIG. 33A-33H illustrate various examples of flow profiles for an oil phase only and corresponding tracer concentrations histories for the examples. -
FIGS. 34A-34B and 35A also illustrate tracer concentration histories used with the response time delay method and the decline method as inFIG. 34C and35B , respectively. -
FIG. 36 illustrates an example computer system consistent with the disclosure. - Various embodiments and examples are provided in the various figures. Like reference numerals refer to corresponding parts throughout the drawings.
- PARTICULATE TRACERS: The term "particulate tracers" is utilized herein to refer to solid particles with chemical tracers bound to them. The particulate tracers may be practically any particulate tracers known in the art, such as particulate tracers for hydrocarbons (e.g., oil), particulate tracers for water, particulate tracers for gas, or any combination thereof. For example, types of particulate tracers that are introduced into the subterranean formation may include, but are not limited to, fluorinated benzoic acids (FBAs), fluorescein dyes, FBA/fluorescein synthesis, fluorescing nanocrystals, radioactive tracers, fluorescing nanoparticles, magnetic nanoparticle tracers, etc.
- Particulate tracers may differ in density, for example, from specific gravity of 0.90 to 2.75 (e.g., 0.96 to 2.65 in one embodiment, 0.96 to 1.5 in a second embodiment, etc.). The density may affect rheology and flow. The average size of particulate tracer particles may be 40 mesh to 100 mesh. Particulate tracers generally release at the same rate independent of the flowrate. The particulate tracers may be substantially the same size as proppant particles, and as such, the particulate tracers may be pumped with proppant particles and stay with the proppant particles (sometimes simply referred to as "proppant"). Those of ordinary skill in the art will appreciate that the term "particulate tracer" is not meant to be limited, and the term "particulate tracer" may include practically any substance that can function as a particulate tracer as discussed herein.
- For simplicity, the term "unique particulate tracer" is utilized herein to distinguish between different particulate tracers. A unique particulate tracer includes at least one solid particle comprising tracer material. To further distinguish different unique particulate tracers, sometimes the term first, second, each, etc. may be utilized herein (e.g., first unique oil particulate tracer, second unique oil particulate tracer, each unique oil particulate tracer, etc.). Furthermore, a specific particulate tracer, such as a first unique oil particulate tracer, may be pumped into a single stage or a stage group that comprises at least two stages due to a shortage of different particulate tracers, costs, logistics, or other reasons. For simplicity, those of ordinary skill in the art will appreciate that discussion of a "stage" may also include a "stage group" herein unless stated otherwise.
- In the existing practice, a unique oil particulate tracer may be pumped throughout each stage and/or stage group if there is an interest in oil. A unique water particulate tracer may be pumped throughout each stage and/or stage group if there is an interest in water. A unique gas particulate tracer may be pumped throughout each stage and/or stage group if there is an interest in gas.
FIGS. 1D-1 ,1D-2 ,1D-3 ,1E-1 ,1E-2 , and1E-3 illustrate different pumping options in which unique particulate tracers are pumped throughout stages and/or stage groups. - As illustrated in
FIG. 1F , the unique particulate tracers may react and diffuse into flowing fluid and the fluid may be produced from a wellbore as produced fluid. For example, unique oil particulate tracers may react and diffuse into the fluid in response to contact with oil in the fluid. Similarly, unique water particulate tracers may react and diffuse into the fluid in response to contact with water in the fluid. Similarly, unique gas particulate tracers may react and diffuse into the fluid in response to contact with gas in the fluid. Similarly, in a single stage of a hydraulic fracturing operation, different particulate tracers may react and diffuse into the fluid in response to contact with the corresponding item in the fluid. For example, in a single stage of a hydraulic fracturing operation, a unique oil particulate tracer may diffuse into the fluid in response to contact with oil in the fluid and a unique gas particulate tracer may diffuse into the fluid in response to contact with gas in the fluid. The produced fluid may be sampled to analyze the unique particulate tracers in the samples. Each unique particulate tracer pumped into a stage and/or stage group may depend on the desired information that is sought about that stage and/or stage group as discussed further hereinbelow. - PLACING UNIQUE PARTICULATE TRACERS IN A SUBTERRANEAN FORMATION HAVING A WELLBORE THEREWITHIN SUCH THAT A SUBSTANTIAL PORTION OF THE UNIQUE PARTICULATE TRACERS ARE PLACED IN A NEAR WELLBORE REGION OF THE SUBSURFACE FORMATION PROXIMATE TO THE WELLBORE: Described below are methods and systems of placing unique particulate tracers in a subterranean formation having a wellbore therewithin. These embodiments are designed to be of particular use for surveillance within a subsurface formation, including generating flow rates (e.g., barrels per day). The embodiments described herein place particulate tracers in at least two stages, including a first stage and a second stage, during a hydraulic fracturing operation in the subsurface formation. The particulate tracers are pumped only in a fraction of each stage and/or each stage group such that a substantial portion of the unique particulate tracers are placed in a near wellbore region of the subsurface formation proximate to the wellbore. As will be described further, the embodiments provided herein improve upon existing approaches to placing unique particulate tracers in a subterranean formation.
- Reference will now be made in detail to various embodiments, examples of which are illustrated in the accompanying drawings. In the following detailed description, numerous specific details are set forth in order to provide a thorough understanding of the present disclosure and the embodiments described herein. However, embodiments described herein may be practiced without these specific details. In other instances, well-known methods, procedures, components, and mechanical apparatus have not been described in detail so as not to unnecessarily obscure aspects of the embodiments.
- Example embodiments of placing unique particular tracers in a subsurface formation having a wellbore therewithin will be described more fully hereinafter with reference to the accompanying drawings. Placing unique particular tracers in a subterranean formation having a wellbore therewithin may, however, be embodied in many different forms and should not be construed as limited to the example embodiments set forth herein. Rather, these embodiments and examples are provided so that this disclosure will be thorough and complete, and will fully convey the scope of placing unique particular tracers in a subterranean formation having a wellbore therewithin to those of ordinary skill in the art. Like, but not necessarily the same, elements (also sometimes called components) in the various figures are denoted by like reference numerals for consistency.
-
FIGS. 1A through 1C show afield system 199, including details thereof, with which example embodiments can be used. Specifically,FIG. 1A shows a schematic diagram of a land-basedfield system 199 in which awellbore 120 has been drilled in asubterranean formation 110.FIG. 1B shows a detail of a substantiallyhorizontal section 103 of thewellbore 120 ofFIG. 1A. FIG. 1C shows a detail of an inducedfracture 101 ofFIG. 1B . Thefield system 199 in this example includes awellbore 120 disposed in asubterranean formation 110 using field equipment 109 (e.g., a derrick, a tool pusher, a clamp, a tong, drill pipe, casing pipe, a drill bit, a wireline tool, a fluid pumping system) located above asurface 108 and within thewellbore 120. Once thewellbore 120 is drilled, acasing string 125 is inserted into thewellbore 120 to stabilize thewellbore 120 and allow for the extraction of subterranean resources (e.g., hydrocarbon such as natural gas, oil) from thesubterranean formation 110. - The
surface 108 can be ground level for an onshore application and the sea floor/lakebed for an offshore application. For offshore applications, at least some of the field equipment can be located on a platform that sits above the water level. The point where thewellbore 120 begins at thesurface 108 can be called the wellhead. While not shown inFIGS. 1A and 1B , there can bemultiple wellbores 120, each with its own wellhead but that is located close to the other wellheads, drilled into thesubterranean formation 110 and having substantiallyhorizontal sections 103 that are close to each other. In such a case, themultiple wellbores 120 can be drilled at the same pad or at different pads. When the drilling process is complete, other operations, such as fracturing operations, can be performed. Thefractures 101 are shown to be located in thehorizontal section 103 of thewellbore 120 inFIG. 1B . Thefractures 101, whether induced and/or naturally occurring, can additionally or alternatively be located in other sections (e.g., a substantially vertical section, a transition area between a vertical section and a horizontal section) of thewellbore 120. Example embodiments can be used along any portion of thewellbore 120 wherefractures 101 are located. - The
subterranean formation 110 can include one or more of a number of formation types, including but not limited to shale, limestone, sandstone, clay, sand, and salt. In certain embodiments, asubterranean formation 110 can include one or more reservoirs in which one or more resources (e.g., oil, natural gas, water, steam) can be located. One or more of a number of field operations (e.g., fracturing, coring, tripping, drilling, setting casing, extracting downhole resources) can be performed to reach an objective of a user with respect to thesubterranean formation 110. - The
wellbore 120 can have one or more of a number of segments or hole sections, where each segment or hole section can have one or more of a number of dimensions. Examples of such dimensions can include, but are not limited to, a size (e.g., diameter) of thewellbore 120, a curvature of thewellbore 120, a total vertical depth of thewellbore 120, a measured depth of thewellbore 120, and a horizontal displacement of thewellbore 120. There can be multiple overlapping casing strings of various sizes (e.g., length, outer diameter) contained within and between these segments or hole sections to ensure the integrity of the wellbore construction. In this case, one or more of the segments of thesubterranean wellbore 120 is the substantiallyhorizontal section 103. As stated above, in additional or alternative cases, one or more of the segments of thesubterranean wellbore 120 is a substantially vertical section. - As discussed above, inserted into and disposed within the
wellbore 120 ofFigures 1A and 1B are a number of casing pipes that are coupled to each other end-to-end to form thecasing string 125. In this case, each end of a casing pipe has mating threads (a type of coupling feature) disposed thereon, allowing a casing pipe to be directly or indirectly mechanically coupled to another casing pipe in an end-to-end configuration. The casing pipes of thecasing string 125 can be indirectly mechanically coupled to each other using a coupling device, such as a coupling sleeve. - Each casing pipe of the
casing string 125 can have a length and a width (e.g., outer diameter). The length of a casing pipe can vary. For example, a common length of a casing pipe is approximately 40 feet. The length of a casing pipe can be longer (e.g., 60 feet) or shorter (e.g., 10 feet) than 40 feet. The width of a casing pipe can also vary and can depend on the cross-sectional shape of the casing pipe. For example, when the shape of the casing pipe is cylindrical, the width can refer to an outer diameter, an inner diameter, or some other form of measurement of the casing pipe. Examples of a width in terms of an outer diameter can include, but are not limited to, 4-1/2 inches, 7 inches, 7-5/8 inches, 8-5/8 inches, 10-3/4 inches, 13-3/8 inches, and 14 inches. - The size (e.g., width, length) of the
casing string 125 can be based on the information (e.g., diameter of the borehole drilled) gathered using field equipment with respect to thesubterranean wellbore 120. The walls of thecasing string 125 have an inner surface that forms a cavity 165 that traverses the length of thecasing string 125. Each casing pipe can be made of one or more of a number of suitable materials, including but not limited to steel.Cement 109 is poured into thewellbore 120 through the cavity 165 and then forced upward between the outer surface of thecasing string 125 and the wall of thesubterranean wellbore 120. In some cases, a liner may additionally be used with, or alternatively be used in place of, some or all of the casing pipes. - Once the cement dries to form concrete, a number of
fractures 101 are induced in thesubterranean formation 110. Thefractures 101 can be induced by hydraulic fracturing. The hydraulic fracturing process involves the injection of large quantities of fluids containing water, chemical additives, andproppant 112 into thesubterranean formation 110 from thewellbore 120 to create fracture networks. Asubterranean formation 110 naturally hasfractures 101, but these naturally occurringfractures 101 have inconsistent characteristics (e.g., length, spacing) and so in some cases cannot be relied upon for extracting subterranean resources without havingadditional fractures 101, such as what is shown inFIG. 1B , induced in thesubterranean formation 110. - Operations that induce
fractures 101 in thesubterranean formation 110 use any of a number of fluids that include proppant 112 (e.g., sand particles, ceramic pellets). Whenproppant 112 is used, some of the fractures 101 (also sometimes called principal or primary fractures) receiveproppant 112, while a remainder of the fractures 101 (also sometimes called secondary fractures) do not have anyproppant 112 in them. - As shown in
FIG. 1C , theproppant 112 is designed to become lodged inside at least some of the inducedfractures 101 to keep thosefractures 101 open after the fracturing operation is complete. The size of theproppant 112 is an important design consideration. Sizes (e.g., 40/70 mesh, 50/140 mesh) of theproppant 112 can vary. While the shape of theproppant 112 is shown as being uniformly spherical, and the size is substantially identical among theproppant 112, the actual sizes and shapes of theproppant 112 can vary. If theproppant 112 is too small, theproppant 112 will not be effective at keeping thefractures 101 open enough to effectively allowsubterranean resources 111 to flow through thefractures 101 from therock matrices 162 in thesubterranean formation 110 to thewellbore 120. If theproppant 112 is too large, theproppant 112 can plug up thefractures 101, blocking the flow of thesubterranean resources 111 through thefractures 101. - The use of
proppant 112 in certain types ofsubterranean formation 110, such as shale, is important. Shale formations typically have permeabilities on the order of microdarcys (mD) to nanodarcys (nD). Whenfractures 101 are induced in such formations with low permeabilities, it is important to sustain thefractures 101 and their conductivity for an extended period of time in order to extract more of thesubterranean resource 111. - The
wellbore 120 is hydraulically fractured in terms of stages, which are illustrated as Stage1 to StageN inFIG. 1D-1 ,1D-2 ,1D-3 ,1E-1 ,1E-2 , and1E-3 . Each stage includes single or multiple perforations clusters and thefractures 101 are induced from the perforation clusters. Additionally, unique particulate tracers are pumped with theproppant 112 for surveillance purposes to track flow patterns and rates of the fluid to which it is introduced. - In existing practice, a unique particulate tracer is typically pumped throughout each stage to determine over time which stage is contributing to water or hydrocarbon (e.g., oil) flow. The unique particulate tracers are chemical compounds that have negligible effects on the fluid carrying the particulate tracers. In the existing practice, the unique particulate tracers are pumped throughout the stages and/or throughout the stage groups with the proppant such as illustrated in
FIGS. 1D-1 ,1D-2 ,1D-3 ,1E-1 ,1E-2 , and1E-3 , and thereafter, at least a portion the unique particulate tracers are produced in the produced fluid and sampled to measure for tracer concentration. A field operator manually collects at least one sample from the produced fluid, transports the at least one sample to a laboratory, filters the at least one sample, and finally analyzes the at least one sample for tracer concentration. The existing practice of pumping unique particulate tracers 170 (illustrated as 170aoil, 170boil, and so on) with theproppant 112 in the entirety of each Stage1 through StageN for asingle wellbore 120 is illustrated in as illustratedFIGS. 1D-1 ,1D-2 ,1D-3 ,1E-1 ,1E-2 , and1E-3 . The existing practice of pumping uniqueparticulate tracers 170 with theproppant 112 in the entirety of each Stage1 through StageN for a plurality of wellbores, such as thewellbore 120 and two offsethorizontal wellbores 175, is illustrated inFIG. 1E-1 ,1E-2 , and1E-3 . Due to the limited quantity of unique particulate tracers, costs, logistics, etc., a unique particulate tracer may be pumped with the proppant in the entirety of each stage and/or stage group (i.e., a plurality of stages) in the existing practice. - The existing practice, as illustrated in
FIG. 1D-1 ,1D-2 ,1D-3 ,1E-1 ,1E-2 ,1E-3 , requires a large quantity of unique particulate tracers as well as the associated financial cost, time, equipment, and personnel to handle the large quantity of the unique particulate tracers. Furthermore, quantitative evaluation of stage and/or stage group contribution to flow is not generally possible with the existing manner that the unique particulate tracers are placed throughout the entirety of stages and/or stage groups. First, inFIGS. 1E-1 ,1E-2 , and1E-3 , quantitative evaluation of stage or stage group contribution to flow is not generally possible because the particulate tracers ofwellbore 120 may go to one or both offsetwellbores 175. As a result, the particulate tracers affecting the flow in thewellbore 120 may not be known and there may not be a good baseline for flow profiling. As another example, tracer recovery curves may simply indicate a binary response of flow vs no-flow.FIG. 1G illustrates a single wellbore with a StageM and a StageN andFIG. 1H illustrates typical tracer recovery curves indicative of just the binary response of flow vs. no-flow. Second, tracer release rate is not a function of the flowrate, so the quantification is generally not possible with the existing tracer design. Indeed, existing placement of unique particulate tracers have not been able to quantify the flow profile along the lateral during flow so far because tracer release rate for unique particulate tracers is not proportional to the flow rate. For example, the existing practice of placing unique particulate tracers throughout the entirety of stages and/or stage groups make it difficult to quantify the flow profile along the lateral during flow because tracer release rate for particulates is not proportional to the flow rate. Third, if the unique particulate tracers are distributed throughout the injected stage volume, then the produced unique particulate tracer response may be very dispersed so the existing methods (similar to solid wellbore tracer application) for flow profiling called the pulse velocity method or decay method cannot be used. In short, there are current limitations on flow profiling using unique particulate tracers that are placed in the entirety of stages and/or stage groups. - In contrast to the existing practice of placing unique particulate tracers, in the example embodiments of the present disclosure the unique particulate tracers are pumped only in a fraction of each stage such that a substantial portion of the unique particulate tracers are placed in a near wellbore region of the subsurface formation proximate to the wellbore.
FIGS. 2A ,2B , and2C illustrate non-limiting embodiments of placing unique particulate tracers in a subterranean formation having a wellbore therewithin consistent with the instant disclosure. InFIGS. 2 A ,2B , and2C , theproppant 112 is pumped in the entirety of each Stage1 through StageN for thesingle wellbore 120 as inFIG. 1D-1 ,1D-2 , and1D-3 . However, unique particulate tracers 170 (illustrated as 170aoil, 170boil, and so on) are pumped only in a fraction of each stage such that a substantial portion of the uniqueparticulate tracers 170 are placed in a near wellbore region 180 (illustrated as 180a for the near wellbore region corresponding to Stage1, 180b for the near wellbore region corresponding to Stage2, and so on) of thesubterranean formation 110 proximate to thewellbore 120. The uniqueparticulate tracers 170 are pumped with theproppant 112 in thenear wellbore region 180. At least one unique particulate tracer is pumped in the fraction of each stage, and each unique particulate tracer corresponds to an oil phase, a water phase, or a gas phase. - Advantageously, a lower quantity of unique particulate tracers is utilized in embodiments consistent with the disclosure because the unique particulate tracers are placed in the near wellbore region and not throughout each stage and/or stage group. Moreover, as will be described further herein, embodiments are provided in this disclosure related to placing unique particulate tracers in fewer stages than all the stages that are available, such as placing
particulate tracers 170 in three stages (e.g., Stage1, Stage5, and StageN) of the nine stages that are illustrated inFIGS. 2A ,2B , and2C , to further decrease the quantity of unique particulate tracers that is utilized without significantly impacting the analysis. - Advantageously, the placement of the unique particulate tracers in the near wellbore region focuses or concentrates the particulate tracers in this area, which may increase the accuracy of flow rates that are generated based on the unique particulate tracers. The existing practice typically does not provide an economic, scalable, and accurate way to generate flow rates (e.g., absolute barrels per day) and/or flow profiles (e.g., percentages) in unconventional long horizontal wells. Embodiments consistent with the instant disclosure may provide a cost-effective, long term, non-interventional, and accurate way of profiling the production from individual stages of multi-stage hydraulically fractured wellbores. This may also allow for optimization of hydrocarbon production from unconventional resources. The determined flow rates and/or flow profiles may be utilized for completion design optimization, understanding changes in flow profiles as a function of time, understand rock type proximate to the wellbore, where to drill a wellbore, understand production from different parts of the lateral that can be utilized to optimize wellbore length and/or wellbore landing, understand possible optimization equipment or techniques for increasing hydrocarbon recovery, etc. The wellbore may comprise a vertical trajectory, a horizontal trajectory, or a deviated trajectory. The subterranean formation may be located onshore or located offshore.
-
FIG. 4 illustrates an example method of placing unique particulate tracers in a subterranean formation having a wellbore therewithin referred to as amethod 400. The unique particulate tracers may be practically any unique particulate tracers known in the art, such as unique particulate tracers for hydrocarbons (e.g., oil), unique particulate tracers for water, unique particulate tracers for gas, or any combination thereof. For example, types of particulate tracers that are introduced into the subterranean formation may include, but are not limited to, fluorinated benzoic acids (FBAs), fluorescein dyes, FBA/fluorescein synthesis, fluorescing nanocrystals, radioactive tracers, fluorescing nanoparticles, magnetic nanoparticle tracers, etc. - While the various steps in one embodiment of the
method 400 are presented sequentially, one of ordinary skill will appreciate that some or all of the steps may be executed in different orders, may be combined or omitted, and some or all of the steps may be executed in parallel. Further, in one or more of the example embodiments, one or more of the steps shown in this example method may be omitted, repeated, and/or performed in a different order. Furthermore, a person of ordinary skill in the art will appreciate that any equations utilized herein may be modified without changing the meaning, for example, an equation may be modified to use different units such as metric units without changing the meaning. A person of ordinary skill in the art will appreciate that additional steps not shown inFIG. 4 may be included in performing this method. A person of ordinary skill in the art will appreciate that fewer than the steps shown inFIG. 4 may be used in performing this method of pumping unique particulate tracers only in a fraction of each stage. The method shown inFIG. 4 is merely one embodiment that can be performed by using a system, such as described inFIGS. 1A, 1B, 1C , and36 . - Referring to
FIG. 4 , themethod 400 ofFIG. 4 includes step 401 of placing unique particulate tracers in at least two stages, including a first stage and a second stage, during a hydraulic fracturing operation in a subterranean formation. The unique particulate tracers are pumped only in a fraction of each stage such that a substantial portion of the unique particulate tracers are placed in a near wellbore region of the subterranean formation proximate to the wellbore drilled into the subterranean formation. At least one unique particulate tracer is pumped in the fraction of each stage, and each unique particulate tracer corresponds to an oil phase, a water phase, or a gas phase. For example, a unique oil particulate tracer may be pumped only in a first fraction of a first stage of a stage pair and a different unique oil particulate tracer may be pumped only in a second fraction of a second stage of the stage pair. The unique particulate tracers may be pumped using existing techniques and existing equipment as illustrated, for example, inFIG. 2A ,2B ,2C ,3A ,3B , and3C .FIG. 4 may be applied to at least two stages and fewer than all the stages. In the running example based onFIG. 2D and7A-7G , the uniqueparticulate tracers near wellbore region 180a and Stage5 innear wellbore region 180e, respectively. Stage1 (e.g., first stage) and Stage5 (e.g., second stage) are a stage pair. The rest ofFIG. 4 includes different equations that may facilitate the placement of step 401. - The
method 400 ofFIG. 4 includesstep 405 to determine a minimum wellbore volume between the first stage and the second stage. In the running example, the uniqueparticulate tracers step 405. The minimum wellbore volume may be determined usingEquation 1 below. TheEquation 1 is solved once of each phase.Equation 1: 
▪ wherein Vwellbore,min is minimum wellbore volume between two unique particulate tracer placements (e.g., in bbls) ▪ wherein qmax is maximum flow rate (e.g., in bbls) ▪ wherein tfs is sampling frequency (e.g., in minutes) 
Equation 1 may be omitted:Running Example Using Equation 1: 
- The
method 400 includesstep 410 to determine a minimum lateral length between the first stage and the second stage. In the running example, the uniqueparticulate tracers step 410. The determined minimum wellbore volume fromstep 405 and a flow pipe radius (referred to as rw) may be utilized to determine the minimum lateral length. The flow pipe radius may correspond to production casing or production tubing. The minimum wellbore length may be determined usingEquation 2 below. TheEquation 2 is solved once for each phase.Equation 2: 
▪ wherein Lwellbore,min is minimum lateral length between two unique particulate tracer placements (e.g., in feet) ▪ wherein rw is a flow pipe radius (e.g., wellbore diameter in inches) Running Example Using Equation 2: 
- Parameters on which the tracer placement for flow profiling depend are provided and these are utilized in the Equations 1-2 hereinabove: (a) max expected flowrate from the well: qmax bbls/day, and (b) fastest sampling frequency at surface post shut-in possible at the surface (tfs minutes): such as 5-minute interval. Moreover, this unique tracer placement at the above minimum lateral length may allow for obtaining non-overlapping signals at the surface at the practical sampling frequency of 1 sample every 5 minutes.
- The
method 400 includesstep 415 to determine a quantity of stages without unique particulate tracers between the first stage and the second stage. In the running example, the unique particulate tracers will not be placed in three stages (i.e., Stage2, Stage3, and Stage4 inFIG. 2D ) using the minimum lateral length between Stage1 and Stage5 that was determined atstep 410. The quantity of stages without unique particulate tracers may be determined usingEquation 3 below. TheEquation 3 is solved once for each phase.Equation 3: 
▪ Wherein Lwellbore,min is minimum lateral length between two unique particulate tracer placements (e.g., in feet) ▪ wherein Lstage is stage length (e.g., in feet) Running Example Using Equation 3: 
- The
method 400 includesstep 420 to determine a maximum fluid volume in a stage near the wellbore that is in contact with a unique particulate tracer, which will be utilized later herein to determine a fraction of each stage in which to pump a unique particulate tracer. If the unique particulate tracers are placed inside the subterranean formation with proppant, and the stage in which the tracers are placed does not flow at a sufficient rate, then the particulate tracer signals would overlap inside the wellbore and would not stay distinct, which is used for flow profiling. Thus, minimum flowrate qmin,stage (e.g., bbls/day) from a stage is a design parameter to determine tracer placement within the stage. The maximum fluid volume in a stage near the wellbore that is in contact with a unique particulate tracer may be determined usingEquation 4 below. TheEquation 4 is solved once for each phase.Equation 4: 
▪ wherein Vp is a maximum fluid volume in a stage near the wellbore that is in contact with unique particulate tracer (e.g., in bbls) ▪ wherein qmin,stage is minimum flowrate from a stage (e.g., in bbls) ▪ wherein tfs is sampling frequency (e.g., in minutes) (e.g., ~5 minutes) ▪ Of note: If metric units are utilized, then the following portion of Equation 4 may be omitted: 24 * 60Running Example Using Equation 4: 
- The
method 400 includesstep 425 to determine proppant pack bulk volume, which will be utilized later herein to determine a fraction of each stage in which to pump a unique particulate tracer. The corresponding proppant packing bulk volume, Vbulk-proppant, if the proppant pack porosity is Ø, may be determined usingEquation 5 below. TheEquation 5 is solved once for each phase.Equation 5: 
wherein Vbulk-proppant is proppant pack bulk volume (e.g., in bbls) wherein Vp is a maximum fluid volume in a stage near the wellbore that is in contact with unique particulate tracer (e.g., in bbls) wherein Ø is proppant pack porosity Running Example Using Equation 5: 
- The
method 400 includes step 430 to determine proppant mass tagged with a unique particulate tracer if proppant density is ρproppant (e.g., lbs/gallon), which will be utilized later herein to determine a fraction of each stage in which to pump a unique particulate tracer. Tagged refers to includes as in what is the proppant mass that includes a unique particulate tracer. The proppant mass tagged with unique particulate tracer may be determined usingEquation 6 below. TheEquation 6 is solved once for each phase (add claim).Equation 6: 
wherein tagged proppant mass is proppant mass tagged with the unique particulate tracers (e.g., in lbs) wherein Vbulk-proppant is proppant pack bulk volume (e.g., in bbls) wherein ρproppant is proppant density (e.g., lbs/gallon) Of note: If metric units are utilized, then the following portion of Equation 6 may be omitted: 42 *Running Example Using Equation 6: 
Of note: ρproppant of 22 lb/gal was determined by 2.65 gm/cc ∗ 8.34. - The
method 400 includesstep 435 to determine proppant pumped in a stage, which will be utilized later herein to determine a fraction of each stage during which to pump a unique particulate tracer. During fracture design, each stage gets completed with Mp,stage (e.g., lbs) of proppant. The proppant pumped in a stage may be determined usingEquation 6 below. TheEquation 7 is solved once, and substantially the same answer is utilized for each phase.Equation 7: 
wherein Mp,stage is proppant pumped in a stage (e.g., in lbs) wherein proppant intensity may be expressed as lb/ft wherein Lstage is length of a stage (e.g., inches) Running Example Using Equation 7: 
- The
method 400 includesstep 440 to determine a fraction of a stage in which to pump a unique particulate tracer. In some embodiments, a fraction comprises 0.001% to 10%. In some embodiments, a fraction comprises 0.001% to 25%. In some embodiments, a fraction comprises 0.001% to 50%. In some embodiments, the same fraction may be utilized for each stage. The fraction of a stage in which to pump a unique particulate tracer may be determined usingEquation 8 below: TheEquation 8 is solved once for each phase.Equation 8: 
wherein fraction of stage tagged with a unique particulate tracer is percentage of a stage wherein tagged proppant mass is proppant mass tagged with a unique particulate tracer (e.g., in lbs) wherein Mp,stage is proppant pumped in a stage (e.g., in lbs) Running Example Using Equation 8: 
Of note: 0.0051 may be represented as 0.51% of stage tagged with a unique particulate tracer - In the running example, the fraction is a percentage of the stage such as 0.51% of the stage, and the whole stage is 100%. Regarding
steps proppant 112 will be tagged with the uniqueparticulate tracer 170aoil in 0.51% (i.e., fraction) of Stage1 out of about 440,000 lbs of theproppant 112 that will be pumped into the Stage1. Existing practice would have added particulate tracers throughout the 440,000 lbs of proppant in Stage1. Similarly, about 2256.144 lbs ofproppant 112 will be tagged with the uniqueparticulate tracer 170eoil in 0.51% (i.e., fraction) of Stage5 out of the about 440,000 lbs of theproppant 112 that will be pumped into the Stage5. Thus, this running example illustrates a substantial reduction in the quantity of unique particulate tracers that will be utilized in Stage1 and Stage5. The fraction of 0.51% may translate to about 1 minute of pumping time. - The
method 400 includes astep 445 to pump a proppant mass that is tagged with a unique particulate tracer in a fraction of each stage for each phase. The unique particulate tracer is pumped in the determined fraction at the start and/or at the end of a stage injection such that a substantial portion of the unique particulate tracer is placed in a near wellbore region of the subterranean formation proximate to the wellbore of the corresponding stage. Start of stage injection: Based on some geomechanical models, early in the stage injected proppant stays close to the wellbore. End of stage injection: Conventional thinking is that the proppant injected at the end stays close to the wellbore. In the running example, the 2256.144 lbs of theproppant 112 tagged with the uniqueparticulate tracer 170aoil may be pumped in 0.51% (i.e., fraction) of Stage1 at the start of the stage injection or at the end of stage injection such that theproppant 112 tagged with the uniqueparticulate tracer 170aoil is pumped into thenear wellbore region 180a. In the running example, the 2256.144 lbs of theproppant 112 tagged with the uniqueparticulate tracer 170eoil may be pumped in 0.51% (i.e., fraction) of Stage5 at the start of the stage injection or at the end of stage injection such that theproppant 112 tagged with the uniqueparticulate tracer 170eoil is pumped into thenear wellbore region 180e. Pumping of the fraction of a stage with proppant mass tagged with the unique particulate tracer at the start/end of stage treatment will allow for the tracer to be placed in the near wellbore region. - For pumping, a unique particulate tracer may be kept in an isolation tank and the proppant may be kept in a different isolation tank, and then both get added to the fracturing fluid and the fracturing fluid is injected. Separate pumps for the proppant and the the unique particulate tracer may be utilized until they are mixed in the stream (e.g., stream of fracturing fluid). Afterwards, there may be other pumps that further pressurize the mix to be pumped into the wellbore.
- Additional information: The particulate tracer placement design discussed before allows for the tracer dilution between the volume contained between the locations/stages where the two unique particulate tracers are placed Vwellbore,minbbls is mixed with the volume of fluid flowing from the stage downstream Vp bbls because the placement is designed such that the time it takes for the fluid to flow in the wellbore from upstream (e.g., location closer to the wellbore's toe) to downstream (e.g., location closer to the wellbore's heel) is less than equal to time it would take particulate contacted volume downstream to flow into the wellbore and mix with the total stream. This would also be the maximum dilution that the tracer would undergo in theory and would be what would be observed at the surface. This is illustrated in
FIG. 5 . - The
method 400 includesstep 450 to determine surface tracer concentration. This relationship is used to determine the amount of unique particulate tracer mass to be injected. In one embodiment, the tracer concentration observed at the surface should at least be the equivalent to the tracer quantification limit as determined by a conventional lab analytical method. For most unique particulate tracers such a limit is ~ 5 ppb. In one embodiment, a phase amplification factor may also be incorporated while using this relationship to determine the unique particulate tracer mass design. The surface tracer concentration may be determined usingequation 9 below. The surface observed tracer concentration with dilution would beEquation 9. TheEquation 9 is solved once for each phase.Equation 9: 
- The
method 400 includesstep 455 to determine a dilution amplification factor. In one embodiment, the dilution amplification factor could be the ratio of wellbore volume between two tracer placements to the total wellbore volume because it removes any dilution related uncertainty that could be a part of the design. The dilution amplification factor may be determined usingEquation 10 below. TheEquation 10 is solved once for each phase.Equation 10: 

- The
method 400 includesstep 460 to determine particulate tracer mass released, which is a minimum to be released in the subsurface in order to see at least 5 ppb in the surface. The tracer mass in the particulate contacted volume Vp using the below constraint (detection, quantification limit) from laboratory analysis: TheEquation 11 is solved once for each phase.Equation 11: 
- With tracer release rate from a unique particulate tracer measured in the lab, the actual mass of a unique particulate tracer to be injected in the fraction of a stage in the improved configuration could be determined. The expected tracer release rate plot is shown in
FIG. 6 . The detection, quantification limit may be 5 ppb in one embodiment. The detection, quantification limit may be in a range of 0.1 ppb to 100 ppb. In another embodiment, the detection, quantification limit may be in a range of 0.1 ppb to 10 ppb in another embodiment. The detection, quantification limit may be 5 ppb or higher in another embodiment. In one embodiment, the detection, quantification limit may even be 0.1 ppb or lower. The particulate tracer mass released may be determined usingEquation 12 below. TheEquation 12 is solved once for each phase.Equation 12: 
wherein Tracer conc. @ surface, ppb ≥ Detection, quantification limit, ppb Of note: The Equation 12 uses concentration in ppb so we multiply the RHS by 10^9, but if we use the concentration in ppm then we would multiply RHS by 10^6. Alternatively, if we use concentration as true fraction/ratio then we would not multiply RHS with just 1.Running Example Using Equation 12: 
wherein Tracer conc @ surface, ppb ≥ 5 ppb - The
method 400 includesstep 465 to determine design particulate mass. The amount of tracer released from the particulate tracers is a function of the injected tracer mass as well as the exposure time of the tracer to the fluid which could be seen from the release rate. A typical well shut-in duration tshutin is -24 hours so the tracer concentration could be built for analysis would lead to the following particulate mass for injection using the release rate @ Tmin usable tracer release rate so the design would still work for time less than Tmin_usable_tracer_release_rate because the release rates would be higher for those times. TheEquation 13 is solved once for each phase.Equation 13: 
Of note: The equation could have the 24 removed from the denominator if everything else is in standard units. Running Example Using Equation 13: 
- The
method 400 includesstep 470 to determine design particulate mass to tagged proppant ratio. TheEquation 14 is solved once for each phase.Equation 14: 
Running Example Using Equation 14: 
- The
method 400 includesstep 475 to handle multi-phase flow dilution. With phase amplification factor introduced in the design, the produced tracer concentrations would still be at quantification limit as long as the WOR is equal to or greater than the phase amplification factor for water tracers and vice versa for oil tracers. TheEquation 15 is solved once for each phase.Equation 15: 
- With large phase amplification factors, if the water or oil tracer fall below detectable limit, the flowrate of the respective phase is small compared to the other phase and thus should be the main flow phase of concern. The
Equation 16 is solved once for each phase.Equation 16: 
- The improved implementation of unique particulate tracers with the design methodology outlined is similarly applicable to both oil and water particulate tracers. With oil and water flowing simultaneously, the way the improved application is designed would account for reduction in the tracer mass for oil or water and a corresponding increase in the tracer mass for water or oil if contact area changes between water and oil particulate tracers and its corresponding reduction in the tracer concentration because overall flowrate of the corresponding phase also goes down along with the dilution.
- Each of the following items are incorporated by reference: (1) Jain, Lokendra, Doorwar, Shashvat, and Daniel Emery. "Analytical Tracer Interpretation Model for Fracture Flow Characterization and Swept Volume Estimation in Unconventional Wells." Paper presented at the SPE/AAPG/SEG Unconventional Resources Technology Conference, Houston, Texas, USA, July 2021; (2)
U.S. Patent No. 8,949,029 ; (3) Haitao Li, et al., Evaluation of the Release Mechanism of Sustained-Release Tracers and its Application in Horizontal Well Inflow Profile Monitoring, ACS Omega 2021 6 (29), 19269-19280; and (4) Flow loop testing to validate Tracerco's solid chemical inflow tracer technology, Tracerco Limited, 2021, available at https://www.tracerco.com/downloads/case-studies/flow-loop-testing-to-validate-tracercos-solid-chemical-inflow-tracer-technology/. - One or more of the steps described hereinabove in the
method 400 ofFIG. 4 may be implemented by a system and/or in a system, such as asystem 3600 shown inFIG. 36 as illustrated inFIG. 8 . For example, thestep 405 to determine a minimum wellbore volume between the first stage and the second stage may be implemented by component 804 inFIG. 8 . Thestep 410 to determine a minimum lateral length between the first stage and the second stage may be implemented bycomponent 806 inFIG. 8 . Thestep 440 to determine a fraction of a stage in which to pump a unique particulate tracer may be implemented bycomponent 808 inFIG. 8 . A representation of one or more of the values determined in themethod 400 ofFIG. 4 may be generated and displayed bycomponent 810. - Reference will now be made in detail to various embodiments, examples of which are illustrated in the accompanying drawings. In the following detailed description, numerous specific details are set forth in order to provide a thorough understanding of the present disclosure and the embodiments described herein. However, embodiments described herein may be practiced without these specific details. In other instances, well-known methods, procedures, components, and mechanical apparatus have not been described in detail so as not to unnecessarily obscure aspects of the embodiments.
- Example embodiments of determining a flow profile for a wellbore using unique particulate tracers will be described more fully hereinafter with reference to the accompanying drawings. The unique particulate tracers are pumped in at least one stage pair during a hydraulic fracturing operation performed in the subterranean formation, and wherein the unique particulate tracers are pumped only in a fraction of each stage such that a substantial portion of the unique particulate tracers are placed in a near wellbore region of the subterranean formation proximate to the wellbore. At least one unique particulate tracer is pumped in the fraction of each stage, and each unique particulate tracer corresponds to an oil phase, a water phase, or a gas phase. However, determining a flow profile may be embodied in many different forms and should not be construed as limited to the example embodiments set forth herein. Rather, these embodiments and examples are provided so that this disclosure will be thorough and complete, and will fully convey the scope of determining a flow profile to those of ordinary skill in the art. Like, but not necessarily the same, elements (also sometimes called components) in the various figures are denoted by like reference numerals for consistency.
-
FIG. 9 illustrates an example method of determining a flow profile for a wellbore using unique particulate tracers referred to as amethod 900. The unique particulate tracers may be practically any unique particulate tracers known in the art, such as unique particulate tracers for hydrocarbons (e.g., oil), unique particulate tracers for water, unique particulate tracers for gas, or any combination thereof. For example, types of particulate tracers that are introduced into the subterranean formation may include, but are not limited to, fluorinated benzoic acids (FBAs), fluorescein dyes, FBA/fluorescein synthesis, fluorescing nanocrystals, radioactive tracers, fluorescing nanoparticles, magnetic nanoparticle tracers, etc. - While the various steps in one embodiment of the
method 900 are presented sequentially, one of ordinary skill will appreciate that some or all of the steps may be executed in different orders, may be combined or omitted, and some or all of the steps may be executed in parallel. Further, in one or more of the example embodiments, one or more of the steps shown in this example method may be omitted, repeated, and/or performed in a different order. Furthermore, a person of ordinary skill in the art will appreciate that any equations utilized herein may be modified without changing the meaning, for example, an equation may be modified to use different units such as metric units without changing the meaning. A person of ordinary skill in the art will appreciate that additional steps not shown inFIG. 9 may be included in performing this method. A person of ordinary skill in the art will appreciate that fewer than the steps shown inFIG. 9 may be used in performing this method of determining a flow profile for a wellbore using unique particulate tracers. The method shown inFIG. 9 is merely one embodiment that can be performed by using a system, such as described inFIGS. 1A, 1B, 1C , and36 . - Referring to
FIG. 9 , themethod 900 ofFIG. 9 includes step 901 to obtain produced fluid samples comprising unique particulate tracers from a wellbore drilled into a subterranean formation. The unique particulate tracers are pumped in at least one stage pair (e.g., a first stage and a second stage) during a hydraulic fracturing operation performed in the subterranean formation. The unique particulate tracers are pumped only in a fraction of each stage such that a substantial portion of the unique particulate tracers are placed in a near wellbore region of the subterranean formation proximate to the wellbore. At least one unique particulate tracer is pumped in the fraction of each stage, and wherein each unique particulate tracer corresponds to an oil phase, a water phase, or a gas phase. Practically any known technique or known equipment may be utilized to obtain the produced fluid samples. - The
method 900 ofFIG. 9 includesstep 905 to obtain a tracer concentration history for each unique particulate tracer, for example, as described herein. - The
method 900 ofFIG. 9 includesstep 910 to determine a wellbore volume for the stage pair. In one embodiment, the wellbore volume is determined using an equation as follows:
- The
method 900 ofFIG. 9 includesstep 915 to determine a flow profile for the wellbore for each phase indicative of flow contribution for each stage pair and stages in between each stage pair using the wellbore volume and the corresponding tracer concentration histories. In one embodiment, the flow contribution is determined using an equation as follows:
FIG. 2D , a stage pair includes a first stage that received uniqueparticulate tracer 170aoil and a second stage that received uniqueparticulate tracer 170eoil, with three stages are located between the first stage and the second stage without any unique particulate tracers. Thus, the flow contribution may include the stage pair of the first stage and the second stage as well as the three stages in between.FIG. 10 provides more information including the Δt, which is arrival time difference. With the improved placement and design, the particulate tracer response at the surface could be interpreted like wellbore solid tracers for flow profiling as illustrated inFIG. 10 . - The
method 900 ofFIG. 9 includes step 920 as a check by obtaining a production history for the wellbore; summing all flow contributions for each stage pair for each phase; and comparing the sums and the production history to constraint total flow contribution for each phase. The production history may be obtained as discussed elsewhere herein. This step may be performed as a check. - If there is an inconsistency, then the
method 900 may include anoptional step 925 to smooth a tracer concentration history for a specific unique particulate tracer before c) ofstep 915 to reduce noise (e.g., reduce points that show large variations ups and/or downs); and utilize the smoothed tracer concentration history for the specific unique particulate tracer in c) ofstep 915. Thisoptional step 915 may be performed by curve fitting to smoothen out the data (e.g., normal, log normal, or other representative curve fit). - The
method 900 ofFIG. 9 includes step 930 to generate, on a graphical user interface, a representation of the flow profile for the wellbore for each phase indicative of the flow contribution for each stage pair and stages within each stage pair; and display, via the graphical user interface, the representation. - Those of ordinary skill in the art will appreciate that various modifications may be made to the description above. For example, the
method 900 may include an optional step 935 to refine the wellbore volume in response to multiple phases in the wellbore. Various ways to refine the wellbore volume are provided inFIGS. 11-22 . Various other optional steps are also provided inFIGS. 11-22 . - One or more of the steps described hereinabove in the
method 900 ofFIG. 9 may be implemented by a system and/or in a system, such as asystem 3600 shown inFIG. 36 as illustrated inFIG. 23 . For example, thestep 905 to obtain a tracer concentration history for each unique particulate tracer may be implemented bycomponent 2304 inFIG. 23 . Thestep 910 to determine a wellbore volume for the stage pair may be implemented bycomponent 2306 inFIG. 23 . Thestep 915 to determine a flow profile for the wellbore for each phase indicative of flow contribution for each stage pair and stages in between each stage pair using the wellbore volume and the corresponding tracer concentration histories may be implemented bycomponent 2308 inFIG. 23 . A representation of one or more flow profiles may be generated and displayed bycomponent 2310.FIG. 7A-7G include various examples consistent with the disclosure. - Comparison Between Solid Wellbore Tracer vs Concentrated Particulate Tracers: In a typical wellbore with 3 inch id, the surface area per ft for wellbore tracers is 0.8 ft2. If installed over two tubing lengths (60 ft). the exposed surface area is 48 ft2. If the wellbore tracer is installed over a stage of 200 ft in length, the exposed surface area is 160 ft2. 1 gm particulate tracers have exposed surface area of 32000 ft2 and occupies 0.00017 ft3 of the volume. Over a length of 1 ft and ~2000lbs of proppant loading in the reservoir and random closed packing has a pore volume of ~ 19 ft3 and bulk volume of ~12 ft3 so a tracer loading of 1 kg of tracer in last 10% of the stage with 1.2 ft3 of near wellbore bulk volume would occupy 0.17 ft3 which would end up providing the exposed surface area of 32∗10^6 ft2. The maximum fluid contacted volume in the last 10% of a stage with above specifications would be 1.9 ft3 per ft of a stage. For a stage with the length of 200 ft, the tracer contacted volume could be ~67 bbls with large exposed tracer surface area as calculated. This would allow for a significant tracer concentration spike 6 orders of magnitude higher than the conventional wellbore tracers and should also act similar to wellbore tracers to estimate flowrate across the well using pulse velocity method. The technique would use high frequency sampling like for a deepwater well and equivalent to 24 to 48 hours. These tracers should also last a while but the life span would be smaller 10 times smaller (6 to 12 months, field observation) than the conventional wellbore tracers (upto 5 years). Non-interventional, allows for determining water breakthrough stages, allows for oil/water rate quantification for stages over time, allows for same tracers to be installed in multiple wells nearby because we can focus on the tracer flowback with pulse velocity method.
- Reference will now be made in detail to various embodiments, examples of which are illustrated in the accompanying drawings. In the following detailed description, numerous specific details are set forth in order to provide a thorough understanding of the present disclosure and the embodiments described herein. However, embodiments described herein may be practiced without these specific details. In other instances, well-known methods, procedures, components, and mechanical apparatus have not been described in detail so as not to unnecessarily obscure aspects of the embodiments.
- Example embodiments of determining a flow profile for a wellbore using unique particulate tracers will be described more fully hereinafter with reference to the accompanying drawings. At least one unique particulate tracer is pumped throughout each stage, each stage group, or any combination thereof during a hydraulic fracturing operation performed in the subterranean formation in example embodiments, however, determining a flow profile may be embodied in many different forms and should not be construed as limited to the example embodiments set forth herein. Rather, these embodiments and examples are provided so that this disclosure will be thorough and complete, and will fully convey the scope of determining a flow profile to those of ordinary skill in the art. Like, but not necessarily the same, elements (also sometimes called components) in the various figures are denoted by like reference numerals for consistency.
- As explained hereinabove, in the existing practice, as illustrated in
FIGS. 1D-1 ,1D-2 ,1D-3 ,1E-1 ,1E-2 , and1E-3 , quantitative evaluation of stage and/or stage group contribution to flow is not generally possible with the existing manner that unique particulate tracers are placed throughout the entirety of stages and/or stage groups. First, inFIG.1E-1 ,1E-2 , and1E-3 , quantitative evaluation of stage and/or stage group contribution to flow is not generally possible because the unique particulate tracers ofwellbore 120 may go to one or both offsetwellbores 175. As a result, the unique particulate tracers affecting the flow in thewellbore 120 may not be known and there may not be a good baseline for flow profiling. As another example, tracer recovery curves may simply indicate a binary response of flow vs no-flow.FIG. 1G illustrates a single wellbore with a StageM and a StageN, andFIG. 1H illustrates typical tracer recovery curves indicative of just the binary response of flow vs. no-flow. Second, tracer release rate is not a function of the flowrate, so the quantification is generally not possible with the existing tracer design. Indeed, existing placement of unique particulate tracers have not been able to quantify the flow profile along the lateral during flow so far because tracer release rate for unique particulate tracers is not proportional to the flow rate. For example, the existing practice of placing unique particulate tracers throughout the entirety of stages and/or stage groups make it difficult to quantify the flow profile along the lateral during flow because tracer release rate for particulates is not proportional to the flow rate. Third, if the unique particulate tracers are distributed throughout the injected stage volume, then the produced unique particulate tracer response may be very dispersed so the existing methods (similar to solid wellbore tracer application) for flow profiling called the pulse velocity method or decay method cannot be used. In short, there are current limitations on flow profiling using unique particulate tracers that are placed in the entirety of stages and/or stage groups. - Advantageously, as will be described further herein, embodiments are provided in this disclosure related to determining a flow profile for a wellbore using unique particulate tracers that are pumped throughout each stage, each stage group, or any combination thereof. By doing so, these embodiments may be utilized to provide quantitative flow profiles that were not generally available in the existing practice. Furthermore, provided herein are embodiments of two methods referred to as the "response time delay method" and the "decline method" that may be utilized to determine the flow profiles. The "response time delay method" may be dependent on the release rate, but the "decline method" is not. In some circumstances, both the "response time delay method" and the "decline method" may be utilized for comparison and validation.
- Advantageously, embodiments provided herein may be utilized for non-interventional time-based flow profiling using the unique particulate tracers. The determined flow profiles may be utilized for completion design optimization, understanding changes in flow profiles as a function of time, understand rock type proximate to the wellbore, where to drill a wellbore, understand production from different parts of the lateral that can be utilized to optimize wellbore length and/or wellbore landing, understand possible optimization equipment or techniques for increasing hydrocarbon recovery, etc.
- RESPONSE TIME DELAY METHOD: The methods and systems of the present disclosure may be implemented by a system and/or in a system, such as a
system 3600 shown inFIG. 36 andFIG. 24 . A method of determining a flow profile for a wellbore using unique particulate tracers may be performed by theprocessor 3618, including input such as at least one tracer concentration history (e.g., a tracer concentration history for each unique particulate tracer) and/or a production history for a wellbore as well as output such as a flow profile for the wellbore for each phase indicative of flow contribution of each stage, each stage group, or any combination thereof. Theelectronic storage 3622 may store information relating to the tracer concentration history for each unique particulate tracer, the production history of the wellbore, information about the produced fluid samples, and/or other information. Thegraphical display 3624 may present information relating to the flow profile for the wellbore for each phase indicative of the flow contribution of each stage, each stage group, or any combination thereof, and/or other information. - The
processor 3618 may be configured to execute one or more machine-readable instructions 3602 to facilitate determining the flow profile for the wellbore for each phase using the unique particulate tracers. The machine-readable instructions 3602 may include one or more computer program components. The machine-readable instructions 3602 may include a tracerconcentration history component 2404, aproduction history component 2406, a meanresidence time component 2408, a contactvolume proxy component 2410, aflow profile component 2412, asmoothing component 2414, arepresentation component 2416, and/or other computer program components. - The tracer
concentration history component 2404 may be configured to obtain (e.g., from the non-transitory storage medium such as the electronic storage 3622) a tracer concentration history for each unique particulate tracer in produced fluid samples from a wellbore drilled into a subterranean formation. At least one unique particulate tracer was pumped throughout each stage, each stage group, or any combination thereof during a hydraulic fracturing operation performed in the subterranean formation. Each unique particulate tracer corresponds to an oil phase, a water phase, or a gas phase. The produced fluid samples comprise at least a portion of the unique particulate tracers that are pumped throughout the stages, the stage groups, or any combination thereof. - The
production history component 2406 may be configured to obtain (e.g., from the non-transitory storage medium such as the electronic storage 3622) a production history for the wellbore. - The mean
residence time component 2408 may be configured to determine (e.g., with the physical computer processor such as the processor 3618) a mean residence time for each unique particulate tracer using the corresponding tracer concentration history. - The contact
volume proxy component 2410 may be configured to determine (e.g., with the physical computer processor such as the processor 3618) a contact volume proxy for each unique particulate tracer using the production history and the corresponding tracer concentration history. - The
flow profile component 2412 may be configured to determine (e.g., with the physical computer processor such as the processor 3618) a flow profile for the wellbore for each phase indicative of flow contribution of each stage, each stage group, or any combination thereof by using the corresponding mean residence times and the corresponding contact volume proxies. - The
smoothing component 2414 may be configured to smooth (e.g., with the physical computer processor such as the processor 3618) a tracer concentration history for a specific unique particulate tracer before determining a mean residence time and before determining a contact volume proxy to reduce noise. The smoothed tracer concentration history for the specific unique particulate tracer may be utilized in determining the mean residence time and determining the contact volume proxy. - The
representation component 2416 may be configured to generate (e.g., on the graphical user interface such as the graphical display 3624) a representation of the flow profile for the wellbore for each phase indicative of the flow contribution of each stage, each stage group, or any combination thereof. Therepresentation component 2416 may be configured to display (e.g., on the graphical user interface such as the graphical display 3624) the representation. -
FIG. 25 illustrates anexample method 2500 for determining a flow profile for a wellbore using unique particulate tracers. Themethod 2500 may be referred to as a response time delay method herein (e.g., Response time delay, rate = volume/time), however, those of ordinary skill in the art will appreciate that this terminology is not meant to be limiting. Themethod 2500 may be utilized if high frequency data with mode is accurately captured with time (e.g., high frequency sampling depending on the flow rate) and/or low oil rate. For example, the response delay method may be applied when data is collected in the first 5 days post POP (i.e., popping the wellbore open for the first time after the unique particulate tracers were pumped in), such as collecting produced fluid samples at least once a day to about 5+ a day, at least once a day to about 10+ a day, etc. - While the various steps in one embodiment of the
method 2500 are presented sequentially, one of ordinary skill will appreciate that some or all of the steps may be executed in different orders, may be combined or omitted, and some or all of the steps may be executed in parallel. Further, in one or more of the example embodiments, one or more of the steps shown in this example method may be omitted, repeated, and/or performed in a different order. Furthermore, a person of ordinary skill in the art will appreciate that any equations utilized herein may be modified without changing the meaning, for example, an equation may be modified to use different units such as metric units without changing the meaning. A person of ordinary skill in the art will appreciate that additional steps not shown inFIG. 25 may be included in performing this method. The method shown inFIG. 25 is merely one embodiment that can be performed by using a system, such as described inFIG. 36 andFIG. 24 .FIG. 1D-3 ,24 , and36 are utilized in the discussion ofFIG. 25 for ease of understanding. - Referring to
FIG. 25 , themethod 2500 includesstep 2505 to obtain (e.g., from the non-transitory storage medium such as the electronic storage 3622) a tracer concentration history for each unique particulate tracer in produced fluid samples from a wellbore drilled into a subterranean formation. At least one unique particulate tracer is pumped throughout each stage, each stage group, or any combination thereof during a hydraulic fracturing operation performed in the subterranean formation. Each unique particulate tracer corresponds to an oil phase, a water phase, or a gas phase. For example, if a flow profile for the oil phase is desired, then unique oil particulate tracers that will react to oil should be pumped throughout the stages. If a flow profile for the water phase is desired, then water unique particulate tracers that will react to water should be pumped throughout the stages. If a flow profile for the gas phase is desired, then gas unique particulate tracers that will react to gas should be pumped throughout the stages. The produced fluid samples comprise at least a portion of the unique particulate tracers that are pumped throughout the stages, the stage groups, or any combination thereof. - The tracer concentration history of a specific unique particulate tracer may include a tracer concentration (e.g., in parts per billion (ppb)) as a function of time for the specific stage that it is pumped into during the hydraulic fracturing operation. The tracer concentration history for each unique particulate tracer that is obtained at the
step 2505 may be previously generated using laboratory analysis (discussed inFIG. 27 ). For example, the produced fluid samples obtained from the produced fluid from the wellbore may be analyzed in a laboratory using equipment and/or tests such as, but not limited to: chromatography. ultra-high-performance liquid chromatography (UHPLC) with a fluorescent light scattering detector and a diode array detector (DAD) may be used to obtain the spectral profile of samples, triple quad mass spec liquid chromatography may be used to integrate target ions and precursor ions of the chemical of interest, or other known techniques to generate a tracer concentration history for each unique particulate tracer. This generated tracer concentration history for each unique particulate tracer may be obtained from a non-transitory storage medium at thestep 2505. Two example tracer concentration histories in curve form are illustrated inFIG. 1H . Thestep 2505 may be performed using the tracerconcentration history component 2404. - Turning to the running example, the running example based on
FIG. 1D-3 assumes that thewellbore 120 produces oil, water, and gas, and therefore, a unique oil particulate tracer, a unique water particulate tracer, and a unique gas particulate tracer are pumped throughout each stage of the figure (i.e., throughout the nine stages). In other words, a total of twenty-seven unique particulate tracers (i.e., nine unique oil particulate tracers, nine unique water particulate tracers, and nine unique gas particulate tracers) are pumped inFIG. 1D-3 For simplicity, this running example assumes that all twenty-seven uniqueparticulate tracers wellbore 120. Atstep 2505, a tracer concentration history is obtained from a non-transitory storage medium for each of the twenty-seven unique particulate tracers (i.e., twenty-seven tracer concentration histories may be obtained from the non-transitory storage medium). - The
method 2500 includesstep 2510 to obtain (e.g., from the non-transitory storage medium such as the electronic storage 2422) a production history for the wellbore. The production history accounts for the phases of the produced fluid of the wellbore, including the oil phase, the water phase, the gas phase, or any combination thereof. The production history that is obtained may include quantity (e.g., barrels (bbls) per day) of oil that is produced from the wellbore, quantity (e.g., barrels (bbls) per day) of water that is produced from the wellbore, quantity (e.g., standard cubic feet (scf) per day) of gas that is produced from the wellbore, or any combination thereof. For example, if the wellbore produces all three phases, then the production history accounts for all three phases. However, if the wellbore does not produce gas, for example, then the production history may reflect water, oil, or both water and oil but not gas. - In one embodiment, the production history may include quantity or rate of oil that is produced from the wellbore, quantity or rate of water that is produced from the wellbore, quantity or rate of gas that is produced from the wellbore, or any combination thereof, for example, as a function of time. In one embodiment, the production history may include additional information, such as, but not limited to, wellbore identification information, well geographic properties (e.g., x coordinate for the heel, y coordinate for the heel, depth, and/or azimuth), geologic properties (e.g., identification information for the subterranean formation), wellbore properties (e.g., tortuosity), completion properties (e.g., perforated length, proppant intensity, and/or fracturing fluid intensity), etc. The production history for the wellbore that is obtained from the non-transitory storage medium at the
step 2510 may be previously generated using known techniques (discussed inFIG. 27 ). Thestep 2510 may be performed using theproduction history component 2406. - The running example based on
FIG. 1D-3 assumes that thewellbore 120 produces oil, water, and gas. Atstep 2510, a production history may be obtained for thewellbore 120 that includes the quantity or rate of oil that is produced from thewellbore 120, the quantity or rate of water that is produced from thewellbore 120, and the quantity or rate of gas that is produced from thewellbore 120. - The
method 2500 includesstep 2515 to determine (e.g., with a physical computer processor such as the processor 3618) a mean residence time for each unique particulate tracer using the corresponding tracer concentration history. For example, the mean residence time of a specific unique particulate tracer generally refers to how quickly that specific unique particulate tracer gets produced from the stage that it is pumped into. How quickly a unique particulate tracer could get produced is a function of the flowrate, and flowrate is defined as volume over time (e.g., the contact volume proxy discussed hereinbelow over mean residence time). One diagram regarding mean residence time is illustrated inFIG. 26A . - In one embodiment, the mean residence time is determined using an equation as follows:

step 2515 may be performed using the meanresidence time component 2408. - In the running example based on
FIG. 1D-3 , atstep 2515, a mean residence time may be determined using the equation above for each of the twenty-seven unique particulate tracers (i.e., twenty-seven mean residence times may be determined). - The
method 2500 includesstep 2520 to determine (e.g., with the physical computer processor such as the processor 3618) a contact volume proxy for each unique particulate tracer using the production history and the corresponding tracer concentration history. For example, the contact volume proxy of a specific unique particulate tracer generally refers to an approximate volume of the subterranean formation that was contacted by the specific unique particulate tracer as it diffused/leached/dissolved in the subterranean formation, or in other words, what is the approximate volume of the subterranean formation contacted by the tracer cloud of the specific unique particulate tracer (discussed inFIG. 27 ). One diagram regarding contact volume proxy in thesubterranean formation 110 is illustrated inFIG. 26B . The proxy for volume through which the tracer cloud flows (i.e., contact volume proxy) is illustrated as the area under the curves inFIG. 26A . - In one embodiment, the contact volume proxy is determined using an equation as follows:

step 2520 may be performed using the contactvolume proxy component 2410. - In the running example based on
FIG. 1D-3 , atstep 2520, a contact volume proxy may be determined using the equation above for each of the twenty-seven unique particulate tracers (i.e., twenty-seven contact volume proxies may be determined). - The
method 2500 includes step 2525 to determine (e.g., with the physical computer processor such as the processor 3618) a flow profile for the wellbore for each phase indicative of flow contribution of each stage, each stage group, or any combination thereof by using the corresponding mean residence times and the corresponding contact volume proxies. The flow contribution for each stage or stage group is determined, and then, the flow contributions corresponding to a specific phase are included in a flow profile for that specific phase (e.g., a flow profile for the oil phase, a separate flow profile for the water phase, and/or a separate flow profile for the gas phase). Each flow profile provides a quantitative evaluation of each stage or stage group's contribution to flow (e.g., per phase) that is not generally available for unique particulate tracers that are placed throughout the entirety of stages and/or stage groups. Each flow profile provides a quantitative evaluation of each stage and/or stage group's contribution to flow that is an improvement over the simple binary information of existing techniques. - In one embodiment, the flow profile is determined using an equation as follows:

- A flow profile for a phase may include all the corresponding flow contribution percentages determined with the equation hereinabove. For example, a flow profile for the oil phase includes all the flow contribution percentages determined with the equation hereinabove corresponding to the unique oil particulate tracers, which should sum up to about 100%. A separate flow profile for the water phase includes all the flow contribution percentages determined with the equation hereinabove corresponding to the unique water particulate tracers, which should sum up to about 100%. A separate flow profile for the gas phase includes all the flow contribution percentages determined with the equation hereinabove corresponding to the unique gas particulate tracers, which should sum up to about 100%. A representation of each flow profile for each phase may be generated and displayed using a bar chart, line graph, curves, etc. using conventional techniques as discussed hereinbelow at step 2530. In one embodiment, a representation of a flow profile in terms of cumulative information (e.g., percentage cum oil along the lateral) may be generated and displayed. The step 2525 may be performed using the
flow profile component 2412. - In the running example based on
FIG. 1D-3 , at step 2525, a flow contribution may be determined using the equation above for each of the twenty-seven unique particulate tracers (i.e., twenty-seven flow contributions may be determined). A flow profile for the oil phase, for example, in the form of a bar chart may be made using the nine flow contribution percentages corresponding to the oil phase. A flow profile for the water phase, for example, in the form of a bar chart may be made using the nine flow contribution percentages corresponding to the water phase. A flow profile for the gas phase, for example, in the form of a bar chart may be made using the nine flow contribution percentages corresponding to the gas phase. - The
method 2500 includes step 2530 to generate, on a graphical user interface such as thegraphical display 3624, a representation of the flow profile for the wellbore for each phase indicative of the flow contribution of each stage, each stage group, or any combination thereof, and display, via the graphical user interface, the representation. Visual effects may be utilized to illustrate flow contribution per stage and/or stage group in the flow profile. A representation of each flow profile for each phase may be generated and displayed using a bar chart, line graph, curves, etc. The representation of each flow profile for each phase may include confidence levels, flow contribution information determined in another manner (e.g., using logging equipment, sensors, or other equipment) for comparison, etc. In one embodiment, a representation of a flow profile in terms of cumulative information (e.g., percentage cum oil along the lateral) may be generated and displayed. Examples of flow profiles for an oil phase are illustrated inFIGS. 33A-33H . - In the running example based on
FIG. 1D-3 , at step 2530, three representations of flow profiles may be generated and displayed (e.g., a representation of the flow profile for the oil phase in the form of a bar chart using the nine flow contribution percentages corresponding to the oil phase, a representation of the flow profile for the water phase in the form of a bar chart using the nine flow contribution percentages corresponding to the water phase, and a representation of the flow profile for the gas phase in the form of a bar chart using the nine flow contribution percentages corresponding to the gas phase). - Those of ordinary skill in the art will appreciate that various modifications may be made to the description above. As an example,
FIG. 1D-3 illustrates individual stages instead of stage groups for simplicity, however, a person of ordinary skill in the art will appreciate that the steps 2505-2530 are also applicable in the context of one or more stage groups. As another example, themethod 2500 may include anoptional step 2535 to smooth a tracer concentration history for a specific unique particulate tracer before c) ofstep 2515 and d) ofstep 2520 to reduce noise (e.g., reduce points that show large variations ups and/or downs); and utilize the smoothed tracer concentration history for the specific unique particulate tracer in c) ofstep 2515 and d) ofstep 2520. Thisoptional step 2535 may be performed by curve fitting to smoothen out the data (e.g., normal, log normal, or other representative curve fit). As another example, a person of ordinary skill in the art will appreciate that a single phase like the oil phase may be of interest so unique oil particulate tracers only may be pumped throughout the stages and/or stage groups (or two phases may be of interest and those corresponding unique particulate tracers may be pumped throughout the stages and/or stage groups). Thus, themethod 2500 applies to one phase, two phases, or three phases. As another example, themethod 2500 may be used for laterals, vertical wellbores, etc. -
FIG. 27 illustrates anexample method 2700 for determining a flow profile for a wellbore using unique particulate tracers. Themethod 2700 ofFIG. 27 may include at least one of the steps of themethod 2500 ofFIG. 25 . Themethod 2700 may also be referred to as a response time delay method herein (e.g., Response time delay, rate = volume/time), however, those of ordinary skill in the art will appreciate that this terminology is not meant to be limiting. Themethod 2700 may be utilized if high frequency data with mode is accurately captured with time (e.g., high frequency sampling depending on the flow rate) and/or low oil rate. For example, the response delay method may be applied when data is collected in the first 5 days after POP (i.e., popping the wellbore open after shut-in period), such as collecting produced fluid samples at least once a day to about 5+ a day, at least once a day to about 10+ a day, etc. The discussion ofmethod 2700 ofFIG. 27 will focus on physical steps that may be performed at the wellbore, in the field, and/or at a laboratory before themethod 2500 ofFIG. 25 , as generally illustrated inFIG. 24 . - While the various steps in one embodiment of the
method 2700 are presented sequentially, one of ordinary skill will appreciate that some or all of the steps may be executed in different orders, may be combined or omitted, and some or all of the steps may be executed in parallel. Further, in one or more of the example embodiments, one or more of the steps shown in this example method may be omitted, repeated, and/or performed in a different order. Furthermore, a person of ordinary skill in the art will appreciate that any equations utilized herein may be modified without changing the meaning, for example, an equation may be modified to use different units such as metric units without changing the meaning. A person of ordinary skill in the art will appreciate that additional steps not shown inFIG. 27 may be included in performing this method. The method shown inFIG. 27 is merely one embodiment that can be performed by using a system, such as described inFIG. 36 andFIG. 24 .FIG. 1D-3 ,24 , and36 are utilized in the discussion ofFIG. 27 for ease of understanding. - Referring to
FIG. 27 , themethod 2700 includesstep 2705 to pump at least one unique particulate tracer throughout each stage, each stage group, or any combination thereof during a hydraulic fracturing operation performed in the subterranean formation, such as inFIG. 1D-3 . Each unique particulate tracer corresponds to an oil phase, a water phase, or a gas phase. For example, the unique particulate tracers may be blended with proppant (e.g., sand) (e.g., the proppant 112) and pumped throughout stages, stage groups, or any combination thereof. As another example, the unique particulate tracers may be directly injected into the fracturing fluid stream and pumped throughout stages, stage groups, or any combination thereof. Practically any pumping equipment or pumping technique known in the art for pumping unique particulate tracers throughout stages, stage groups, or any combination thereof may be utilized. - In the running example based on
FIG. 1D-3 , atstep 2705, theproppant 112 and the twenty-seven uniqueparticulate tracers FIG. 24 . - The
method 2700 includes step 2710 to shut-in the wellbore for a period of time to cause tracer clouds to form in the subterranean formation for at least a portion of the unique particulate tracers that are pumped throughout the stages, the stage groups, or any combination thereof. Shutting in of the wellbore may help build the tracer cloud for each unique particulate tracer pumped as it diffuses/leaches/dissolves in the subterranean formation. The wellbore is shut-in for a period of time that is long enough for the injected unique particulate tracers to be detected in the produced fluid samples. The wellbore may be shut-in for a period of time such as 1 day to 3 days (i.e., 24 hours to 72 hours). The longer the wellbore has been producing, then the longer the shut-in period in some embodiments, such as a shut-in period of upto 5 days (i.e., upto 120 hours). The period of time for the shut-in may depend on the unique particulate tracers pumped, logistics and practical realities associated with shutting in a wellbore, etc. The wellbore may be shut-in using known techniques for shutting in wellbores. In short, the step 2710 shut-in the wellbore for enough time for tracer clouds to be developed so detectable tracer concentrations are produced.FIGS. 28A-28B illustrate an example of shut-in to build up tracer clouds. - In the running example based on
FIG. 1D-3 , at step 2710, thewellbore 120 is shut-in for a period of time long enough for tracer clouds to be developed for the twenty-seven uniqueparticulate tracers wellbore 120 as illustrated inFIG. 24 . For example, thewellbore 120 may be shut-in long enough to develop the twenty-seven tracer clouds for the twenty-seven unique particulate tracers. - The
method 2700 includes step 2715 to flow back the wellbore to cause produced fluid from the wellbore after the shut-in period. For example, the wellbore flows back up for the time in which the tracer clouds are produced back (e.g., typically 5 to 7 days). The produced fluid samples comprise at least a portion of the unique particulate tracers that are pumped throughout the stages, the stage groups, or any combination thereof. - In the running example based on
FIG. 1D-3 , at step 2715, thewellbore 120 is flowed back to cause produced fluid to exit thewellbore 120. - The
method 2700 includesstep 2720 to obtain produced fluid samples comprising unique particulate tracers from a wellbore drilled into a subterranean formation. One embodiment may include sampling frequently for the first few days (~ 5 days and a function of flow rate) until the tracer clouds get produced. The samples from the produced fluid may be obtained directly from a wellhead that is fluidly coupled to the wellbore using practically any technique and/or equipment known in the art for sampling produced fluid. Information about an automated tracer sampling and measurement system may be found inU.S. Patent Publication Application No. 2014/0260694 , which is incorporated by reference. - In the running example based on
FIG. 1D-3 , atstep 2720, produced fluid samples may be collected from thewellbore 120, such as from the wellhead of thewellbore 120. The produced fluid samples comprise at least a portion of the twenty-seven unique particulate tracers that are pumped throughout the nine stages. For example, produced fluid samples may be collected at least once a day to about 5+ a day, at least once a day to about 10+ a day, etc. for approximately five days. - The
method 2700 includesstep 2725 to analyze the produced fluid samples obtained from the produced fluid to generate the tracer concentration history for each unique particulate tracer. For example, the produced fluid samples obtained from the produced fluid from the wellbore may be analyzed in a laboratory using equipment and/or tests such as, but not limited to: chromatography, ultra-high-performance liquid chromatography (UHPLC) with a fluorescent light scattering detector and a diode array detector (DAD) may be used to obtain the spectral profile of samples, triple quad mass spec liquid chromatography may be used to integrate target ions and precursor ions of the chemical of interest, or other known techniques to generate a tracer concentration history for each unique particulate tracer. The generated tracer concentration histories may be provided to the system 3600 (e.g., one or more remote computing devices of the laboratory may be communicatively coupled to thesystem 3600 via a wired or wireless connection). The generated tracer concentration history for each unique particulate tracer may be obtained from a non-transitory storage medium at thestep 2505 and used to determine a flow profile for each phase as described hereinabove in connection withFIGS. 24 ,25 , and36 . - In the running example based on
FIG. 1D-3 , atstep 2725, twenty-seven tracer concentration histories may be generated in the laboratory and used to determine a flow profile for each phase. - The
method 2700 includesstep 2730 to determine the production history of the wellbore. Practically any technique and/or equipment (e.g., downhole and/or on the surface) such as flow meters, temperature sensors, pressure pressures, separators (e.g., using a test separator in the field for about 24 hours), etc. may be utilized to generate the production history. The production history may be determined in the field using this equipment. Information about generating a production history is provided at the following: Izgec, B.., Hasan, A.R.. R., Lin, D, and C.S.. S. Kabir. "Flow-Rate Estimation From Wellhead-Pressure and Temperature Data." SPE Prod & Oper 25 (2010): 31-39, which is incorporated by reference. The generated production history of the wellbore may be provided to the system 3600 (e.g., one or more remote meters, remote sensors, or computing devices may be communicatively coupled to thesystem 3600 via a wired or wireless connection). The generated production history for the wellbore may be obtained from a non-transitory storage medium at thestep 2510 and used to determine a flow profile for each phase as described hereinabove in connection withFIGS. 24 ,25 , and36 . - In the running example based on
FIG. 1D-3 , atstep 2730, a production history may be generated for thewellbore 120 and used to determine a flow profile for each phase. - The
method 2700 includes a step of determining a flow profile for the wellbore for each phase using the produced fluid samples comprising the unique particulate tracers by: a) obtaining a tracer concentration history for each unique particulate tracer; b) obtaining a production history for the wellbore; c) determining a mean residence time for each unique particulate tracer using the corresponding tracer concentration history; d) determining a contact volume proxy for each unique particulate tracer using the production history and the corresponding tracer concentration history; and e) determining the flow profile for the wellbore for each phase indicative of flow contribution of each stage, each stage group, or any combination thereof by using the corresponding mean residence times and the corresponding contact volume proxies. In one embodiment, the step may be performed as explained hereinabove in connection withFIGS. 24 ,25 , and36 . However, the step 2735 may be performed in other ways in some embodiments. In one embodiment, one or more of the steps of themethod 2700 may be implemented using a computing system such as inFIG. 36 . - DECLINE METHOD: The methods and systems of the present disclosure may be implemented by a system and/or in a system, such as a
system 3600 shown inFIG. 36 andFIG. 29 . A method of determining a flow profile for a wellbore using unique particulate tracers may be performed by theprocessor 3618, including input such as at least one tracer concentration history (e.g., a tracer concentration history for each unique particulate tracer) and/or optionally a production history for a wellbore as well as output such as a flow profile for the wellbore for each phase indicative of flow contribution of each stage, each stage group, or any combination thereof. Theelectronic storage 3622 may store information relating to the tracer concentration history for each unique particulate tracer, optionally the production history of the wellbore, information about the produced fluid samples, and/or other information. Thegraphical display 3624 may present information relating to the flow profile for the wellbore for each phase indicative of the flow contribution of each stage, each stage group, or any combination thereof, and/or other information. - The
processor 3618 may be configured to execute one or more machine-readable instructions 3602 to facilitate determining the flow profile for the wellbore for each phase using the particulate tracers. The machine-readable instructions 3602 may include one or more computer program components. The machine-readable instructions 3602 may include a tracerconcentration history component 2904, optionally aproduction history component 2906, adecline rate component 2908, anormalization factor component 2910, a normalizeddecline rate component 2911, aflow profile component 2912, asmoothing component 2914, arepresentation component 2916, and/or other computer program components. - The tracer
concentration history component 2904 may be configured to obtain (e.g., from the non-transitory storage medium such as the electronic storage 3622) a tracer concentration history for each unique particulate tracer in produced fluid samples from a wellbore drilled into a subterranean formation. At least one unique particulate tracer is pumped throughout each stage, each stage group, or any combination thereof during a hydraulic fracturing operation performed in the subterranean formation. Each unique particulate tracer corresponds to an oil phase, a water phase, or a gas phase. The produced fluid samples comprise at least a portion of the unique particulate tracers that are pumped throughout the stages, the stage groups, or any combination thereof. - The optional
production history component 2906 may be configured to obtain (e.g., from the non-transitory storage medium such as the electronic storage 3622) a production history for the wellbore. - The
decline rate component 2908 may be configured to determine (e.g., with the physical computer processor such as the processor 3618) a decline rate for each unique particulate tracer using the corresponding tracer concentration history. - The
normalization factor component 2910 may be configured to determine (e.g., with the physical computer processor such as the processor 3618) a normalization factor for each unique particulate tracer using the corresponding tracer concentration history and optionally the production history. - The normalized
decline rate component 2911 may be configured to determine (e.g., with the physical computer processor such as the processor 3618) a normalized decline rate for each unique particulate tracer using the corresponding decline rate and the corresponding normalization factor. - The
flow profile component 2912 may be configured to determine (e.g., with the physical computer processor such as the processor 3618) a flow profile for the wellbore for each phase indicative of flow contribution of each stage, each stage group, or any combination thereof by using the corresponding normalized decline rates. - The
smoothing component 2914 may be configured to smooth (e.g., with the physical computer processor such as the processor 3618) a tracer concentration history for a specific unique particulate tracer before determining a decline rate and before determining a normalization factor to reduce noise. The smoothed tracer concentration history for the specific unique particulate tracer may be utilized in determining the decline rate and determining the normalization factor. - The
representation component 2916 may be configured to generate (e.g., on the graphical user interface such as the graphical display 3624) a representation of the flow profile for the wellbore for each phase indicative of the flow contribution of each stage, each stage group, or any combination thereof. Therepresentation component 2916 may be configured to display (e.g., on the graphical user interface such as the graphical display 3624) the representation. -
FIG. 30 illustrates anexample method 3000 for determining a flow profile for a wellbore using unique particulate tracers. Themethod 3000 may be referred to as a decline method herein, however, those of ordinary skill in the art will appreciate that this terminology is not meant to be limiting. Themethod 3000 may be utilized to determine a flow profile for a wellbore per phase during producing life if high frequency data is not available and/or high oil rate (e.g., a high oil rate may be about 1,000 bbls a day). Themethod 3000 may be utilized to determine a flow profile for a wellbore per phase if tracer leach rate (diffusion) is not known. - While the various steps in one embodiment of the
method 3000 are presented sequentially, one of ordinary skill will appreciate that some or all of the steps may be executed in different orders, may be combined or omitted, and some or all of the steps may be executed in parallel. Further, in one or more of the example embodiments, one or more of the steps shown in this example method may be omitted, repeated, and/or performed in a different order. Furthermore, a person of ordinary skill in the art will appreciate that any equations utilized herein may be modified without changing the meaning, for example, an equation may be modified to use different units such as metric units without changing the meaning. A person of ordinary skill in the art will appreciate that additional steps not shown inFIG. 30 may be included in performing this method. The method shown inFIG. 30 is merely one embodiment that can be performed by using a system, such as described inFIG. 36 andFIG. 29 .FIG. 1D-3 ,29 , and36 are utilized in the discussion ofFIG. 30 for ease of understanding. - Referring to
FIG. 30 , themethod 3000 includesstep 3005 to obtain (e.g., from the non-transitory storage medium such as the electronic storage 3622) a tracer concentration history for each unique particulate tracer in produced fluid samples from a wellbore drilled into a subterranean formation. At least one unique particulate tracer is pumped throughout each stage, each stage group, or any combination thereof during a hydraulic fracturing operation performed in the subterranean formation. Each unique particulate tracer corresponds to an oil phase, a water phase, or a gas phase. For example, if a flow profile for the oil phase is desired, then unique oil particulate tracers that will react to oil should be pumped throughout the stages. If a flow profile for the water phase is desired, then water unique particulate tracers that will react to water should be pumped throughout the stages. If a flow profile for the gas phase is desired, then gas unique particulate tracers that will react to gas should be pumped throughout the stages. The produced fluid samples comprise at least a portion of the unique particulate tracers that are pumped throughout the stages, the stage groups, or any combination thereof. - The tracer concentration history of a specific unique particulate tracer may include a tracer concentration (e.g., in parts per billion (ppb)) as a function of time for the specific stage that it is pumped into during the hydraulic fracturing operation. The tracer concentration history for each unique particulate tracer that is obtained at the
step 3005 may be previously generated using laboratory analysis (discussed inFIG. 27 ). For example, the produced fluid samples obtained from the produced fluid from the wellbore may be analyzed in a laboratory using equipment and/or tests such as, but not limited to: chromatography. ultra-high-performance liquid chromatography (UHPLC) with a fluorescent light scattering detector and a diode array detector (DAD) may be used to obtain the spectral profile of samples, triple quad mass spec liquid chromatography may be used to integrate target ions and precursor ions of the chemical of interest, or other known techniques to generate a tracer concentration history for each unique particulate tracer. This generated tracer concentration history for each unique particulate tracer may be obtained from a non-transitory storage medium at thestep 3005. Two example tracer concentration histories in curve form are illustrated inFIG. 1H . Thestep 3005 may be performed using the tracerconcentration history component 2904. - Turning to the running example, the running example based on
FIG. 1D-3 assumes that thewellbore 120 produces oil, water, and gas, and therefore, a unique oil particulate tracer, a unique water particulate tracer, and a unique gas particulate tracer are pumped throughout each stage of the figure (i.e., throughout the nine stages). In other words, a total of twenty-seven unique particulate tracers (i.e., nine unique oil particulate tracers, nine unique water particulate tracers, and nine unique gas particulate tracers) are pumped inFIG. 1D-3 For simplicity, this running example assumes that all twenty-seven uniqueparticulate tracers wellbore 120. Atstep 3005, a tracer concentration history is obtained from a non-transitory storage medium for each of the twenty-seven unique particulate tracers (i.e., twenty-seven tracer concentration histories may be obtained from the non-transitory storage medium). - The
method 3000 includesoptional step 3010 to obtain (e.g., from the non-transitory storage medium such as the electronic storage 3622) a production history for the wellbore. The production history accounts for the phases of the produced fluid of the wellbore, including the oil phase, the water phase, the gas phase, or any combination thereof. The production history that is obtained may include quantity (e.g., barrels (bbls) per day) of oil that is produced from the wellbore, quantity (e.g., barrels (bbls) per day) of water that is produced from the wellbore, quantity (e.g., standard cubic feet (scf) per day) of gas that is produced from the wellbore, or any combination thereof. For example, if the wellbore produces all three phases, then the production history accounts for all three phases. However, if the wellbore does not produce gas, for example, then the production history may reflect water, oil, or both water and oil but not gas. - In one embodiment, the production history may include quantity or rate of oil that is produced from the wellbore, quantity or rate of water that is produced from the wellbore, quantity or rate of gas that is produced from the wellbore, or any combination thereof, for example, as a function of time. In one embodiment, the production history may include additional information, such as, but not limited to, wellbore identification information, well geographic properties (e.g., x coordinate for the heel, y coordinate for the heel, depth, and/or azimuth), geologic properties (e.g., identification information for the subterranean formation), wellbore properties (e.g., tortuosity), completion properties (e.g., perforated length, proppant intensity, and/or fracturing fluid intensity), etc. The production history for the wellbore that is obtained from the non-transitory storage medium at the
step 3010 may be previously generated using known techniques (discussed inFIG. 27 ). Thestep 3010 may be performed using theproduction history component 2906. - The running example based on
FIG. 1D-3 assumes that thewellbore 120 produces oil, water, and gas. Atstep 3010, a production history may be obtained for thewellbore 120 that includes the quantity or rate of oil that is produced from thewellbore 120, the quantity or rate of water that is produced from thewellbore 120, and the quantity or rate of gas that is produced from thewellbore 120. - The
method 3000 includesstep 3015 to determine (e.g., with a physical computer processor such as the processor 3618) a decline rate for each unique particulate tracer using the corresponding tracer concentration history. For example, flow rate from the stages and/or stage groups is a function of how quickly the tail of a tracer concentration history curve declines from a stage and/or stage group. The faster the decline, the higher the flow rate because the tracer cloud would be produced quicker and vice versa. Two diagrams regarding decline rate are illustrated inFIGS. 31A-31B . - In one embodiment, the decline rate is determined using an equation as follows:

FIG. 31B . The unit for decline rate may be in parts per billion (ppb) per day. The tail of a specific tracer concentration history is where the slope becomes substantially constant (and stops changing). The decline rate equation hereinabove may be repeated for each unique particulate tracer using the corresponding tracer concentration history that was obtained. Thestep 3015 may be performed using the meanresidence time component 2908. - In the running example based on
FIG. 1D-3 , atstep 3015, a decline rate may be determined using the equation above for each of the twenty-seven unique particulate tracers (i.e., twenty-seven decline rates may be determined). - The
method 3000 includesstep 3020 to determine (e.g., with the physical computer processor such as the processor 3618) a normalization factor for each unique particulate tracer using the corresponding tracer concentration history and optionally the production history. Each tracer cloud has a different amount of particulate tracer in it so themethod 3000 normalizes the concentration so that the decline rates define the flow rate properly. A normalization factor may be utilized for the normalization, and the normalization factor may be determined in two ways. Normalizing with the maximum/peak value of the concentration or the area under the curve are appropriate normalization factors. - In one embodiment, a first normalization factor is represented as:

step 3020 may be performed using thenormalization factor component 2910. - In one embodiment, a second normalization factor is determined using an equation as follows:

step 3020 may be performed using thenormalization factor component 2910. - In the running example based on
FIG. 1D-3 , atstep 3020, a normalization factor may be determined using one of the equations above for each of the twenty-seven unique particulate tracers (i.e., twenty-seven normalization factors may be determined). - The
method 3000 includes step 3025 to determine (e.g., with the physical computer processor such as the processor 3618) a normalized decline rate for each unique particulate tracer using the corresponding decline rate and the corresponding normalization factor. In one embodiment, the normalized decline rate is determined using an equation as follows:
decline rate component 2911. - In the running example based on
FIG. 1D-3 , at step 3025, a normalized decline rate may be determined using the equation above for each of the twenty-seven unique particulate tracers (i.e., twenty-seven normalized decline rates may be determined). - The
method 3000 includes step 3030 to determine (e.g., with the physical computer processor such as the processor 3618) a flow profile for the wellbore for each phase indicative of flow contribution of each stage, each stage group, or any combination thereof by using the corresponding normalized decline rates. The flow contribution for each stage or stage group is determined, and then, the flow contributions corresponding to a specific phase are included in a flow profile for that specific phase (e.g., a flow profile for the oil phase, a separate flow profile for the water phase, and/or a separate flow profile for the gas phase). Each flow profile provides a quantitative evaluation of each stage or stage group's contribution to flow (e.g., per phase) that is not generally available for unique particulate tracers that are placed throughout the entirety of stages and/or stage groups. Each flow profile provides a quantitative evaluation of each stage and/or stage group's contribution to flow that is an improvement over the simple binary information of existing techniques. - In one embodiment, the flow profile is determined using an equation as follows:

- A flow profile for a phase may include all the corresponding flow contribution percentages determined with the equation hereinabove. For example, a flow profile for the oil phase includes all the flow contribution percentages determined with the equation hereinabove corresponding to the unique oil particulate tracers, which should sum up to about 100%. A separate flow profile for the water phase includes all the flow contribution percentages determined with the equation hereinabove corresponding to the unique water particulate tracers, which should sum up to about 100%. A separate flow profile for the gas phase includes all the flow contribution percentages determined with the equation hereinabove corresponding to the unique gas particulate tracers, which should sum up to about 100%. A representation of each flow profile for each phase may be generated and displayed using a bar chart, line graph, curves, etc. using conventional techniques as discussed hereinbelow at step 3030. In one embodiment, a representation of a flow profile in terms of cumulative information (e.g., percentage cum oil along the lateral) may be generated and displayed. The step 3030 may be performed using the
flow profile component 2912. - In the running example based on
FIG. 1D-3 , at step 3030, a flow contribution may be determined using the equation above for each of the twenty-seven unique particulate tracers (i.e., twenty-seven flow contributions may be determined). A flow profile for the oil phase, for example, in the form of a bar chart may be made using the nine flow contribution percentages corresponding to the oil phase. A flow profile for the water phase, for example, in the form of a bar chart may be made using the nine flow contribution percentages corresponding to the water phase. A flow profile for the gas phase, for example, in the form of a bar chart may be made using the nine flow contribution percentages corresponding to the gas phase. - The
method 3000 includesstep 3035 to generate, on a graphical user interface such as thegraphical display 3624, a representation of the flow profile for the wellbore for each phase indicative of the flow contribution of each stage, each stage group, or any combination thereof, and display, via the graphical user interface, the representation. Visual effects may be utilized to illustrate flow contribution per stage and/or stage group in the flow profile. A representation of each flow profile for each phase may be generated and displayed using a bar chart, line graph, curves, etc. The representation of each flow profile for each phase may include confidence levels, flow contribution information determined in another manner (e.g., using logging equipment, sensors, or other equipment) for comparison, etc. In one embodiment, a representation of a flow profile in terms of cumulative information (e.g., percentage cum oil along the lateral) may be generated and displayed. Examples of flow profiles for an oil phase are illustrated inFIGS. 33A-33H . - In the running example based on
FIG. 1D-3 , atstep 3035, three representations of flow profiles may be generated and displayed (e.g., a representation of the flow profile for the oil phase in the form of a bar chart using the nine flow contribution percentages corresponding to the oil phase, a representation of the flow profile for the water phase in the form of a bar chart using the nine flow contribution percentages corresponding to the water phase, and a representation of the flow profile for the gas phase in the form of a bar chart using the nine flow contribution percentages corresponding to the gas phase). - Those of ordinary skill in the art will appreciate that various modifications may be made to the description above. As an example,
FIG. 1D-3 illustrates individual stages instead of stage groups for simplicity, however, a person of ordinary skill in the art will appreciate that the steps 3005-3035 are also applicable in the context of one or more stage groups. As another example, themethod 3000 may include anoptional step 3040 to smooth a tracer concentration history for a specific unique particulate tracer before c) ofstep 3015 and d) ofstep 3020 to reduce noise (e.g., reduce points that show large variations ups and/or downs); and utilize the smoothed tracer concentration history for the specific unique particulate tracer in c) ofstep 3015 and d) ofstep 3020. For example, theoptional step 3040 may smoothen out a tail of the tracer concentration history for a specific unique particulate tracer. Thisoptional step 3040 may be performed by curve fitting to smoothen out the data (e.g., linear regression or other representative curve fit). As another example, a person of ordinary skill in the art will appreciate that a single phase like the oil phase may be of interest so unique oil particulate tracers only may be pumped throughout the stages and/or stage groups (or two phases may be of interest and those corresponding unique particulate tracers may be pumped throughout the stages and/or stage groups). Thus, themethod 2500 applies to one phase, two phases, or three phases. As another example, themethod 3000 may be used for laterals, vertical wellbores, etc. -
FIG. 32 illustrates anexample method 3200 for determining a flow profile for a wellbore using unique particulate tracers. Themethod 3200 ofFIG. 32 may include at least one of the steps of themethod 3000 ofFIG. 30 . Themethod 3200 ofFIG. 32 may include at least one of the steps of themethod 2700 ofFIG. 27 andFIG. 29 . Themethod 3200 may also be referred to as a decline method herein, however, those of ordinary skill in the art will appreciate that this terminology is not meant to be limiting. Themethod 3200 may be utilized to determine a flow profile for a wellbore per phase during producing life if high frequency data is not available and/or high oil rate (e.g., a high oil rate may be about 1,000 bbls a day). Themethod 3200 may be utilized to determine a flow profile for a wellbore per phase if tracer leach rate (diffusion) is not known. - While the various steps in one embodiment of the
method 3200 are presented sequentially, one of ordinary skill will appreciate that some or all of the steps may be executed in different orders, may be combined or omitted, and some or all of the steps may be executed in parallel. Further, in one or more of the example embodiments, one or more of the steps shown in this example method may be omitted, repeated, and/or performed in a different order. Furthermore, a person of ordinary skill in the art will appreciate that any equations utilized herein may be modified without changing the meaning, for example, an equation may be modified to use different units such as metric units without changing the meaning. A person of ordinary skill in the art will appreciate that additional steps not shown inFIG. 32 may be included in performing this method. The method shown inFIG. 32 is merely one embodiment that can be performed by using a system, such as described inFIG. 36 andFIG. 29 . In one embodiment, one or more of the steps of themethod 3200 may be implemented using a computing system such as inFIG. 36 . - RESPONSE TIME DELAY METHOD AND DECLINE METHOD EXAMPLES:
FIGS. 33A-33H illustrate various examples of flow profiles for an oil phase only (i.e., unique oil particulate tracers are pumped throughout stage groups) and corresponding tracer concentrations histories for the examples. Tracer concentration histories for time period A (Post POP) inFIG. 33D and for time period B in 33A are illustrated in the figures. Logging information for time period C was also obtained and utilized for comparisons. InFIGS. 33B-33C and33G-33H , tracer interpretation shows good correspondence with the logging interpretation. InFIGS. 33D-33E , tracer interpretation post POP using the response time delay method for period A and using the delay method for period B also show change in the flow contribution from the toe stages in the 3 month production period, which allows for time-based flow profiling. The response time delay method and the decline method may be utilized on the substantially same data as illustrated inFIGS. 33G-33H .FIGS. 34A-34B and35A also illustrate tracer concentration histories used with the response time delay method and the decline method as inFIG. 34C and35B , respectively. - A person of ordinary skill in the art will appreciate that tracer based flow profiling may accomplish the following: (1) eliminate uncertainty due to well trajectory, (2) uncertainty due to multi-phase flow issues in the wellbore if the reservoir contact volume is larger than the wellbore volume, and/or (3) flow profiling as a function of time with minimal intervention (e.g., shutting in the well for 24 to 48 hours and high frequency sampling post shut-in). Of note, (a) tracer release rate understanding is important for correct interpretation post POP in the flowing life of the wellbore for response time delay method, but the decline method is independent of the release rate as long as enough tracer is detected, (b) flowback sampling frequency post shut-in should be high when the oil flowrates increase for response time delay method to work correctly, (c) lower resolution because of the limitation with the number of tracers available, and/or (d) 24 hour LPO if flow profiling is desired after initial POP but could be synchronized with planned shut-ins/workovers. Of note, some considerations include (I) does not depend on the release rate explicitly but assumes that all the particulate tracers have the same release rate as a function of time and would enable flow profiling over time, (II) tracer baseline can be deduced from the tracer signal itself if the previous statement on tracer design is true, and/or (III) particulate tracers may provide meaningful signal over the early life (at least 1 year) of the well. Advantages include: (i) non-interventional flow profiling which could be used upto 12 months and extended to 18 months and/or (ii) test could be planned when changes in well behavior are observed. Indeed, it is oftentimes difficult, expensive, or not practical to use logging tools and generate logging data (e.g., especially in geographically remote areas) so tracer-based flow profiling may provide adequate flow profiles, even though tracer based flow profiling may produce lower resolution data as compared to logging data.
- COMPUTER SYSTEM: The
system 3600 may include one or more of aprocessor 3618, an interface 3620 (e.g., bus, wireless interface), anelectronic storage 3622, agraphical display 3624, and/or other components. Theelectronic storage 3622 may be configured to include electronic storage medium that electronically stores information (e.g., non-transitory storage media that electronically stores information). Theelectronic storage 3622 may store software algorithms, information determined by theprocessor 3618, information received remotely, and/or other information that enables thesystem 3600 to function properly. The electronic storage media of theelectronic storage 3622 may be provided integrally (i.e., substantially non-removable) with one or more components of thesystem 3600 and/or as removable storage that is connectable to one or more components of thesystem 3600 via, for example, a port (e.g., a USB port, a Firewire port, etc.) or a drive (e.g., a disk drive, etc.). Theelectronic storage 3622 may include one or more of optically readable storage media (e.g., optical disks, etc.), magnetically readable storage media (e.g., magnetic tape, magnetic hard drive, floppy drive, etc.), electrical charge-based storage media (e.g., EPROM, EEPROM, RAM, etc.), solid-state storage media (e.g., flash drive, etc.), and/or other electronically readable storage media. Theelectronic storage 3622 may be a separate component within thesystem 3600, or theelectronic storage 3622 may be provided integrally with one or more other components of the system 3600 (e.g., the processor 3618). Although theelectronic storage 3622 is shown inFIG. 36 as a single entity, this is for illustrative purposes only. In some implementations, theelectronic storage 3622 may comprise a plurality of storage units. These storage units may be physically located within the same device, or theelectronic storage 3622 may represent storage functionality of a plurality of devices operating in coordination. - The
graphical display 3624 may refer to an electronic device that provides visual presentation of information. Thegraphical display 3624 may include a color display and/or a non-color display. Thegraphical display 3624 may be configured to visually present information. Thegraphical display 3624 may present information using/within one or more graphical user interfaces. - The
processor 3618 may be configured to provide information processing capabilities in thesystem 3600. As such, theprocessor 3618 may comprise one or more of a digital processor, an analog processor, a digital circuit designed to process information, a central processing unit, a graphics processing unit, a microcontroller, an analog circuit designed to process information, a state machine, and/or other mechanisms for electronically processing information. Theprocessor 3618 may be configured to execute one or more machine-readable instructions 3602. The machine-readable instructions 3602 may include one or more computer program components. - It should be appreciated that although computer program components are illustrated in
FIG. 36 as being co-located within a single processing unit, one or more of computer program components may be located remotely from the other computer program components. While computer program components are described as performing or being configured to perform operations, computer program components may comprise instructions which may programprocessor 3618 and/orsystem 3600 to perform the operation. - While computer program components are described herein as being implemented via
processor 3618 through machine-readable instructions 3602, this is merely for ease of reference and is not meant to be limiting. In some implementations, one or more functions of computer program components described herein may be implemented via hardware (e.g., dedicated chip, field-programmable gate array) rather than software. One or more functions of computer program components described herein may be software-implemented, hardware-implemented, or software and hardware-implemented. - The description of the functionality provided by the different computer program components described herein is for illustrative purposes, and is not intended to be limiting, as any of computer program components may provide more or less functionality than is described. For example, one or more of computer program components may be eliminated, and some or all of its functionality may be provided by other computer program components. As another example,
processor 3618 may be configured to execute one or more additional computer program components that may perform some or all of the functionality attributed to one or more of computer program components described herein. - While particular embodiments are described above, it will be understood it is not intended to limit the invention to these particular embodiments. On the contrary, the invention includes alternatives, modifications and equivalents that are within the spirit and scope of the appended claims. Numerous specific details are set forth in order to provide a thorough understanding of the subject matter presented herein. But it will be apparent to one of ordinary skill in the art that the subject matter may be practiced without these specific details. In other instances, well-known methods, procedures, components, and circuits have not been described in detail so as not to unnecessarily obscure aspects of the embodiments.
- The terminology used in the description of the invention herein is for the purpose of describing particular embodiments only and is not intended to be limiting of the invention. As used in the description of the invention and the appended claims, the singular forms "a," "an," and "the" are intended to include the plural forms as well, unless the context clearly indicates otherwise. It will also be understood that the term "and/or" as used herein refers to and encompasses any and all possible combinations of one or more of the associated listed items. It will be further understood that the terms "includes," "including," "comprises," and/or "comprising," when used in this specification, specify the presence of stated features, operations, elements, and/or components, but do not preclude the presence or addition of one or more other features, operations, elements, components, and/or groups thereof.
- As used herein, the term "if" may be construed to mean "when" or "upon" or "in response to determining" or "in accordance with a determination" or "in response to detecting," that a stated condition precedent is true, depending on the context. Similarly, the phrase "if it is determined [that a stated condition precedent is true]" or "if [a stated condition precedent is true]" or "when [a stated condition precedent is true]" may be construed to mean "upon determining" or "in response to determining" or "in accordance with a determination" or "upon detecting" or "in response to detecting" that the stated condition precedent is true, depending on the context.
- The use of the term "about" applies to all numeric values, whether or not explicitly indicated. This term generally refers to a range of numbers that one of ordinary skill in the art would consider as a reasonable amount of deviation to the recited numeric values (i.e., having the equivalent function or result). For example, this term can be construed as including a deviation of ±10 percent of the given numeric value provided such a deviation does not alter the end function or result of the value. Therefore, a value of about 1% can be construed to be a range from 0.9% to 1.1%. Furthermore, a range may be construed to include the start and the end of the range. For example, a range of 10% to 20% (i.e., range of 10%-20%) includes 10% and also includes 20%, and includes percentages in between 10% and 20%, unless explicitly stated otherwise herein. Similarly, a range of between 10% and 20% (i.e., range between 10% - 20%) includes 10% and also includes 20%, and includes percentages in between 10% and 20%, unless explicitly stated otherwise herein.
- It is understood that when combinations, subsets, groups, etc. of elements are disclosed (e.g., combinations of components in a composition, or combinations of steps in a method), that while specific reference of each of the various individual and collective combinations and permutations of these elements may not be explicitly disclosed, each is specifically contemplated and described herein. By way of example, if an item is described herein as including a component of type A, a component of type B, a component of type C, or any combination thereof, it is understood that this phrase describes all of the various individual and collective combinations and permutations of these components. For example, in some embodiments, the item described by this phrase could include only a component of type A. In some embodiments, the item described by this phrase could include only a component of type B. In some embodiments, the item described by this phrase could include only a component of type C. In some embodiments, the item described by this phrase could include a component of type A and a component of type B. In some embodiments, the item described by this phrase could include a component of type A and a component of type C. In some embodiments, the item described by this phrase could include a component of type B and a component of type C. In some embodiments, the item described by this phrase could include a component of type A, a component of type B, and a component of type C. In some embodiments, the item described by this phrase could include two or more components of type A (e.g., A1 and A2). In some embodiments, the item described by this phrase could include two or more components of type B (e.g., B1 and B2). In some embodiments, the item described by this phrase could include two or more components of type C (e.g., C1 and C2). In some embodiments, the item described by this phrase could include two or more of a first component (e.g., two or more components of type A (A1 and A2)), optionally one or more of a second component (e.g., optionally one or more components of type B), and optionally one or more of a third component (e.g., optionally one or more components of type C). In some embodiments, the item described by this phrase could include two or more of a first component (e.g., two or more components of type B (B1 and B2)), optionally one or more of a second component (e.g., optionally one or more components of type A), and optionally one or more of a third component (e.g., optionally one or more components of type C). In some embodiments, the item described by this phrase could include two or more of a first component (e.g., two or more components of type C (C1 and C2)), optionally one or more of a second component (e.g., optionally one or more components of type A), and optionally one or more of a third component (e.g., optionally one or more components of type B).
- This written description uses examples to disclose the invention, including the best mode, and also to enable any person skilled in the art to make and use the invention. The patentable scope is defined by the claims, and may include other examples that occur to those skilled in the art. Such other examples are intended to be within the scope of the claims if they have elements that do not differ from the literal language of the claims, or if they include equivalent elements with insubstantial differences from the literal language of the claims.
- Unless defined otherwise, all technical and scientific terms used herein have the same meanings as commonly understood by one of skill in the art to which the disclosed invention belongs. All citations referred herein are expressly incorporated by reference.
- T-11543A: This disclosure includes the following elements:
-
Element 1. A method of placing unique particulate tracers in a subterranean formation having a wellbore therewithin, the method comprising: placing unique particulate tracers in at least two stages, including a first stage and a second stage, during a hydraulic fracturing operation in a subterranean formation, wherein the unique particulate tracers are pumped only in a fraction of each stage such that a substantial portion of the unique particulate tracers are placed in a near wellbore region of the subterranean formation proximate to the wellbore drilled into the subterranean formation, and wherein at least one unique particulate tracer is pumped in the fraction of each stage, and wherein each unique particulate tracer corresponds to an oil phase, a water phase, or a gas phase. -
Element 2. The method ofelement 1, further comprising determining a minimum wellbore volume between the first stage and the second stage. -
Element 3. The method of element 1 (or any of the preceding elements), further comprising determining a minimum length between the first stage and the second stage. -
Element 4. The method of element 1 (or any of the preceding elements), further comprising determining a quantity of stages without the unique particulate tracers between the first stage and the second stage. -
Element 5. The method of element 1 (or any of the preceding elements), further comprising determining a maximum fluid volume in a stage near the wellbore that is in contact with unique particulate tracer once for each phase. -
Element 6. The method of element 1 (or any of the preceding elements), further comprising determining a proppant pack bulk volume once for each phase. -
Element 7. The method of element 1 (or any of the preceding elements), further comprising determining a proppant mass tagged with a unique particulate tracer once for each phase. -
Element 8. The method of element 1 (or any of the preceding elements), further comprising determining proppant pumped in a stage once, and utilizing the substantially same answer for each phase. -
Element 9. The method of element 1 (or any of the preceding elements), further comprising determining a fraction of a stage in which to pump a unique particulate tracer once for each phase. -
Element 10. The method of element 1 (or any of the preceding elements), wherein a fraction of a stage is determined with an equation as follows:
-
Element 11. The method of element 1 (or any of the preceding elements), wherein a fraction of a stage in which to pump a unique particulate tracer comprises 0.001% to 50%. -
Element 12. The method of element 1 (or any of the preceding elements), further comprising pumping a proppant mass that is tagged with a unique particulate tracer in a fraction of a stage. -
Element 13. The method of element 1 (or any of the preceding elements), further comprising determining a dilution amplification factor once for each phase. -
Element 14. The method of element 1 (or any of the preceding elements), further comprising determining a unique particulate tracer mass released once for each phase. -
Element 15. The method of element 1 (or any of the preceding elements), further comprising determining design particulate mass once for each phase. -
Element 16. The method of element 1 (or any of the preceding elements), further comprising determining design particulate mass to tagged proppant ratio once for each phase. -
Element 17. A system of placing unique particulate tracers in a subterranean formation having a wellbore therewithin, the system comprising: a wellbore drilled into a subterranean formation; and unique particulate tracers, wherein the unique particulate tracers are placed in at least two stages, including a first stage and a second stage, during a hydraulic fracturing operation in the subterranean formation, wherein the unique particulate tracers are pumped only in a fraction of each stage such that a substantial portion of the unique particulate tracers are placed in a near wellbore region of the subterranean formation proximate to the wellbore, and wherein at least one unique particulate tracer is pumped in the fraction of each stage, and wherein each unique particulate tracer corresponds to an oil phase, a water phase, or a gas phase. -
Element 18. A method of determining a fraction of a stage in which to place a unique particulate tracer, the method comprising: determining, with a physical computer processor, a fraction of a stage in which to place a unique particulate tracer to facilitate placement of unique particulate tracers in at least two stages, including a first stage and a second stage, during a hydraulic fracturing operation in a subterranean formation, wherein the unique particulate tracers are pumped only in a fraction of each stage such that a substantial portion of the unique particulate tracers are placed in a near wellbore region of the subterranean formation proximate to the wellbore drilled into the subterranean formation, and wherein at least one unique particulate tracer is pumped in the fraction of each stage, and wherein each unique particulate tracer corresponds to an oil phase, a water phase, or a gas phase. -
Element 19. The method ofelement 18, wherein a fraction of a stage is determined with an equation as follows:
-
Element 20. The method of element 1 (or any ofelements 1 to 16, 18 or 19), wherein a fraction of a stage in which to pump a unique particulate tracer comprises 0.001% to 50%. - T-11543B: This disclosure includes the following elements:
-
Element 1. A method of determining a flow profile for a wellbore using unique particulate tracers, the method comprising: obtaining produced fluid samples comprising unique particulate tracers from a wellbore drilled into a subterranean formation, wherein the unique particulate tracers are pumped in at least one stage pair during a hydraulic fracturing operation performed in the subterranean formation, and wherein the unique particulate tracers are pumped only in a fraction of each stage such that a substantial portion of the unique particulate tracers are placed in a near wellbore region of the subterranean formation proximate to the wellbore, and wherein at least one unique particulate tracer is pumped in the fraction of each stage, and wherein each unique particulate tracer corresponds to an oil phase, a water phase, or a gas phase; and determining a flow profile for the wellbore for each phase using the produced fluid samples comprising the unique particulate tracers by: i) obtaining a tracer concentration history for each unique particulate tracer; ii) determining a wellbore volume for the stage pair; and (iii) determining a flow profile for the wellbore for each phase indicative of flow contribution for each stage pair and stages within each stage pair using the wellbore volume and the corresponding tracer concentration histories. -
Element 2. The method ofelement 1, wherein the wellbore volume is determined using an equation as follows:
-
Element 3. The method of element 1 (or any of the preceding elements), wherein the flow contribution is determined using an equation as follows:
-
Element 4. The method of element 1 (or any of the preceding elements), further comprising: obtaining a production history for the wellbore; summing all flow contributions for each stage pair for each phase; and comparing the sums and the production history to constraint total flow contribution for each phase. -
Element 5. The method of element 1 (or any of the preceding elements), further comprising: smoothing a tracer concentration history for a specific unique particulate tracer before iii) to reduce noise; and utilizing the smoothed tracer concentration history for the specific unique particulate
tracer in iii). -
Element 6. The method of element 1 (or any of the preceding elements), further comprising refining the wellbore volume in response to multiple phases in the wellbore. -
Element 7. The method of element 1 (or any of the preceding elements), further comprising: generating, on a graphical user interface, a representation of the flow profile for the wellbore for each phase indicative of the flow contribution for each stage pair and stages within each stage pair; and displaying, via the graphical user interface, the representation. -
Element 8. A method of determining a flow profile for a wellbore using unique particulate tracers, the method being implemented in a computer system that includes a physical computer processor and non-transitory storage medium, the method comprising: i) obtaining, the from a non-transitory storage medium, a tracer concentration history for each unique particulate tracer in produced fluid samples from a wellbore drilled into a subterranean formation, wherein the unique particulate tracers are pumped in at least one stage pair during a hydraulic fracturing operation performed in the subterranean formation, and wherein the unique particulate tracers are pumped only in a fraction of each stage such that a substantial portion of the unique particulate tracers are placed in a near wellbore region of the subterranean formation proximate to the wellbore, and wherein at least one unique particulate tracer is pumped in the fraction of each stage, and wherein each unique particulate tracer corresponds to an oil phase, a water phase, or a gas phase; ii) determining, with the physical computer processor, a wellbore volume for the stage pair; and iii) determining, with the physical computer processor, a flow profile for the wellbore for each phase indicative of flow contribution for each stage pair and stages within each stage pair using the wellbore volume and the corresponding tracer concentration histories. -
Element 9. The method ofelement 8, wherein the wellbore volume is determined using an equation as follows:
-
Element 10. The method ofelement 
-
Element 11. The method of element 8 (or any ofelements 8 to 10), further comprising: obtaining a production history for the wellbore; summing all flow contributions for each stage pair for each phase; and comparing the sums and the production history to constraint total flow contribution for each phase. -
Element 12. The method of element 8 (or any ofelements 8 to 11), further comprising: smoothing a tracer concentration history for a specific unique particulate tracer before iii) to reduce noise; and utilizing the smoothed tracer concentration history for the specific unique particulate
tracer in iii). -
Element 13. The method of element 8 (or any ofelements 8 to 12), further comprising refining the wellbore volume in response to multiple phases in the wellbore. -
Element 14. The method of element 8 (or any ofelements 8 to 13), further comprising: generating, on a graphical user interface, a representation of the flow profile for the wellbore for each phase indicative of the flow contribution for each stage pair and stages within each stage pair; and
displaying, via the graphical user interface, the representation. -
Element 15. A computer system, comprising: one or more processors; memory; and one or more programs, wherein the one or more programs are stored in the memory and configured to be executed by the one or more processors, the one or more programs including instructions that when executed by the one or more processors cause the system to a method of determining a flow profile for a wellbore using unique particulate tracers, the method comprising: i) obtaining a tracer concentration history for each unique particulate tracer in produced fluid samples from a wellbore drilled into a subterranean formation, wherein the unique particulate tracers are pumped in at least one stage pair during a hydraulic fracturing operation performed in the subterranean formation, and wherein the unique particulate tracers are pumped only in a fraction of each stage such that a substantial portion of the unique particulate tracers are placed in a near wellbore region of the subterranean formation proximate to the wellbore, and wherein at least one unique particulate tracer is pumped in the fraction of each stage, and wherein each unique particulate tracer corresponds to an oil phase, a water phase, or a gas phase; ii) determining a wellbore volume for the stage pair; and iii) determining a flow profile for the wellbore for each phase indicative of flow contribution for each stage pair and stages within each stage pair using the wellbore volume and the corresponding tracer concentration histories. -
Element 16. The system ofelement 15, wherein the wellbore volume is determined using an equation as follows:
-
Element 17. The system ofelement 
-
Element 18. The system of element 15 (or any ofelements 15 to 17), further comprising: obtaining a production history for the wellbore; summing all flow contributions for each stage pair for each phase; and comparing the sums and the production history to constraint total flow contribution for each phase. -
Element 19. The system of element 15 (or any ofelements 15 to 18), further comprising: smoothing a tracer concentration history for a specific unique particulate tracer before iii) to reduce noise; and utilizing the smoothed tracer concentration history for the specific unique particulate
tracer in iii). -
Element 20. The system of element 15 (or any ofelements 15 to 19), further comprising refining the wellbore volume in response to multiple phases in the wellbore. -
Element 21. The system of element 15 (or any ofelements 15 to 20), further comprising a graphical user interface: generating, on the graphical user interface, a representation of the flow profile for the wellbore for each phase indicative of the flow contribution for each stage pair and stages within each stage pair; and displaying, via the graphical user interface, the representation. - T-11543C: This disclosure includes the following elements:
-
Element 1. A method of determining a flow profile for a wellbore using unique particulate tracers, the method comprising: obtaining produced fluid samples comprising unique particulate tracers from a wellbore drilled into a subterranean formation, wherein at least one unique particulate tracer is pumped throughout each stage, each stage group, or any combination thereof during a hydraulic fracturing operation performed in the subterranean formation, and wherein each unique particulate tracer corresponds to an oil phase, a water phase, or a gas phase, and wherein the produced fluid samples comprise at least a portion of the unique particulate tracers that were pumped throughout the stages, the stage groups, or any combination thereof; and determining a flow profile for the wellbore for each phase using the produced fluid samples comprising the unique particulate tracers by: a) obtaining a tracer concentration history for each unique particulate tracer; b) obtaining a production history for the wellbore; c) determining a mean residence time for each unique particulate tracer using the corresponding tracer concentration history; d) determining a contact volume proxy for each unique particulate tracer using the production history and the corresponding tracer concentration history; and e) determining the flow profile for the wellbore for each phase indicative of flow contribution of each stage, each stage group, or any combination thereof by using the corresponding mean residence times and the corresponding contact volume proxies. -
Element 2. The method ofelement 1, wherein the mean residence time is determined using an equation as follows:
-
Element 3. The method of element 1 (or any of the preceding elements), wherein the contact volume proxy is determined using an equation as follows:
-
Element 4. The method of element 1 (or any of the preceding elements), wherein the flow profile is determined using an equation as follows:
-
Element 5. The method of element 1 (or any of the preceding elements), further comprising:
smoothing a tracer concentration history for a specific unique particulate tracer before c) and d) to reduce noise; and utilizing the smoothed tracer concentration history for the specific unique particulate tracer in c) and d). -
Element 6. The method of element 1 (or any of the preceding elements), wherein the computer system further includes a graphical user interface, and the method further comprises: generating, on the graphical user interface, a representation of the flow profile for the wellbore for each phase indicative of the flow contribution of each stage, each stage group, or any combination thereof; and displaying, via the graphical user interface, the representation. -
Element 7. The method of element 1 (or any of the preceding elements), before obtaining the produced fluid samples, further comprising: shutting in the wellbore for a period of time to cause tracer clouds to form in the subterranean formation for at least a portion of the unique particulate tracers that were pumped throughout the stages, the stage groups, or any combination thereof. -
Element 8. The method of element 7 (or any of the preceding elements), after the period of time, further comprising flowing back the wellbore to cause produced fluid from the wellbore and the produced fluid samples are obtained from the produced fluid, and wherein the produced fluid samples comprise at least a portion of the unique particulate tracers that were pumped throughout the stages, the stage groups, or any combination thereof from the tracer clouds. -
Element 9. The method of element 7 (or any of the preceding elements), further comprising analyzing the produced fluid samples obtained from the produced fluid to generate the tracer concentration history for each unique particulate tracer. -
Element 10. A method of determining a flow profile for a wellbore using unique particulate tracers, the method being implemented in a computer system that includes a physical computer processor and non-transitory storage medium, the method comprising: a) obtaining, from a non-transitory storage medium, a tracer concentration history for each unique particulate tracer in produced fluid samples from a wellbore drilled into a subterranean formation, wherein at least one unique particulate tracer is pumped throughout each stage, each stage group, or any combination thereof during a hydraulic fracturing operation performed in the subterranean formation, and wherein each unique particulate tracer corresponds to an oil phase, a water phase, or a gas phase, and wherein the produced fluid samples comprise at least a portion of the unique particulate tracers that were pumped throughout the stages, the stage groups, or any combination thereof; b) obtaining, from the non-transitory storage medium, a production history for the wellbore; c) determining, with a physical computer processor, a mean residence time for each unique particulate tracer using the corresponding tracer concentration history; d) determining, with the physical computer processor, a contact volume proxy for each unique particulate tracer using the production history and the corresponding tracer concentration history; and e) determining, with the physical computer processor, a flow profile for the wellbore for each phase indicative of flow contribution of each stage, each stage group, or any combination thereof by using the corresponding mean residence times and the corresponding contact volume proxies. -
Element 11. The method ofelement 10, wherein the mean residence time is determined using an equation as follows: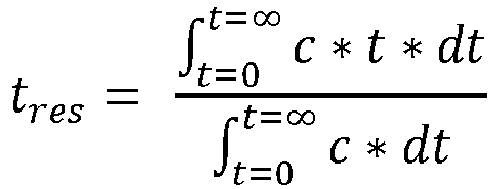
-
Element 12. The method ofelement 
-
Element 13. The method of element 10 (or any ofelements 10 to 12), wherein the flow profile is determined using an equation as follows:
-
Element 14. The method of element 10 (or any ofelements 10 to 13), further comprising: smoothing a tracer concentration history for a specific unique particulate tracer before c) and d) to reduce noise; and utilizing the smoothed tracer concentration history for the specific unique particulate tracer in c) and d). -
Element 15. The method of element 10 (or any ofelements 10 to 14), wherein the computer system further includes a graphical user interface, and the method further comprises: generating, on the graphical user interface, a representation of the flow profile for the wellbore for each phase indicative of the flow contribution of each stage, each stage group, or any combination thereof; and displaying, via the graphical user interface, the representation. -
Element 16. A method of determining a flow profile for a wellbore using unique particulate tracers, the method comprising: obtaining produced fluid samples comprising unique particulate tracers from a wellbore drilled into a subterranean formation, wherein at least one unique particulate tracer is pumped throughout each stage, each stage group, or any combination thereof during a hydraulic fracturing operation performed in the subterranean formation, and wherein each unique particulate tracer corresponds to an oil phase, a water phase, or a gas phase, and wherein the produced fluid samples comprise at least a portion of the unique particulate tracers that were pumped throughout the stages, the stage groups, or any combination thereof; and determining a flow profile for the wellbore for each phase using the produced fluid samples comprising the unique particulate tracers by: a) obtaining a tracer concentration history for each unique particulate tracer; b) optionally obtaining a production history for the wellbore; c) determining a decline rate for each unique particulate tracer using the corresponding tracer concentration history; d) determining a normalization factor for each unique particulate tracer using the corresponding tracer concentration history and optionally the production history; e) determining a normalized decline rate for each unique particulate tracer using the corresponding decline rate and the corresponding normalization factor; and f) determining a flow profile for the wellbore for each phase indicative of flow contribution of each stage, each stage group, or any combination thereof by using the corresponding normalized decline rates. -
Element 17. The method ofelement 16, wherein the decline rate is determined using an equation as follows:
-
Element 18. The method ofelement
wherein norm_factor is normalization factor and c_mode is a maximum value of a tracer concentration history. -
Element 19. The method of element 16 (or any ofelements 16 to 18), wherein the normalization factor is determined using an equation as follows:
- wherein norm_factor is normalization factor, t is time, q is production history,
- ρ is fluid density, c is tracer concentration history, and dt is integration with respect to time.
-
Element 20. The method of element 16 (or any ofelements 16 to 19), wherein the normalized decline rate is determined using an equation as follows:
-
Element 21. The method of element 16 (or any ofelements 16 to 20), wherein the flow profile is determined using an equation as follows:
-
Element 22. The method of element 16 (or any ofelements 16 to 21), further comprising: smoothing a tracer concentration history for a specific unique particulate tracer before c) and d) to reduce noise; and utilizing the smoothed tracer concentration history for the specific unique particulate tracer in c) and d). -
Element 23. The method of element 16 (or any ofelements 16 to 22), wherein the computer system further includes a graphical user interface, and the method further comprises: generating, on the graphical user interface, a representation of the flow profile for the wellbore for each phase indicative of the flow contribution of each stage, each stage group, or any combination thereof; and displaying, via the graphical user interface, the representation. -
Element 24. A method of determining a flow profile for a wellbore using unique particulate tracers, the method being implemented in a computer system that includes a physical computer processor and non-transitory storage medium, the method comprising: a) obtaining, from a non-transitory storage medium, a tracer concentration history for each unique particulate tracer in produced fluid samples from a wellbore drilled into a subterranean formation, wherein at least one unique particulate tracer is pumped throughout each stage, each stage group, or any combination thereof during a hydraulic fracturing operation performed in the subterranean formation, and wherein each unique particulate tracer corresponds to an oil phase, a water phase, or a gas phase, and wherein the produced fluid samples comprise at least a portion of the unique particulate tracers that were pumped throughout the stages, the stage groups, or any combination thereof; b) optionally obtaining, from the non-transitory storage medium, a production history for the wellbore; c) determining, with a physical computer processor, a decline rate for each unique particulate tracer using the corresponding tracer concentration history; d) determining, with the physical computer processor, a normalization factor for each unique particulate tracer using the corresponding tracer concentration history and optionally the production history; e) determining, with the physical computer processor, a normalized decline rate for each unique particulate tracer using the corresponding decline rate and the corresponding normalization factor; and f) determining, with the physical computer processor, a flow profile for the wellbore for each phase indicative of flow contribution of each stage, each stage group, or any combination thereof by using the corresponding normalized decline rates. -
Element 25. The method ofelement 24, wherein the decline rate is determined using an equation as follows:
-
Element 26. The method ofelement 
-
Element 27. The method of element 24 (or any ofelements 24 to 26), wherein the normalization factor is determined using an equation as follows:
- Element 28. The method of element 24 (or any of
elements 24 to 27), wherein the normalized decline rate is determined using an equation as follows:
- Element 29. The method of element 24 (or any of
elements 24 to 28), wherein the flow profile is determined using an equation as follows:
-
Element 30. The method of element 24 (or any ofelements 24 to 29), further comprising: smoothing a tracer concentration history for a specific unique particulate tracer before c) and d) to reduce noise; and utilizing the smoothed tracer concentration history for the specific unique particulate tracer in c) and d). - Element 31. The method of element 24 (or any of
elements 24 to 30), wherein the computer system further includes a graphical user interface, and the method further comprises: generating, on the graphical user interface, a representation of the flow profile for the wellbore for each phase indicative of the flow contribution of each stage, each stage group, or any combination thereof; and displaying, via the graphical user interface, the representation. - The foregoing description, for purpose of explanation, has been described with reference to specific embodiments. However, the illustrative discussions above are not intended to be exhaustive or to limit the invention to the precise forms disclosed. Many modifications and variations are possible in view of the above teachings. The embodiments were chosen and described in order to best explain the principles of the invention and its practical applications, to thereby enable others skilled in the art to best utilize the invention and various embodiments with various modifications as are suited to the particular use contemplated.
- In any of the above aspects, the various features may be implemented in hardware, or as software modules running on one or more processors/computers.
- The invention also provides a computer program or a computer program product comprising instructions which, when executed by a computer, cause the computer to carry out any of the methods/method steps described herein, and a non-transitory computer-readable medium comprising instructions which, when executed by a computer, cause the computer to carry out any of the methods/method steps described herein. A computer program embodying the invention may be stored on a non-transitory computer-readable medium, or it could, for example, be in the form of a signal such as a downloadable data signal provided from an Internet website, or it could be in any other form.
Claims (15)
- A method of determining a flow profile for a wellbore using unique particulate tracers, the method comprising:obtaining produced fluid samples comprising unique particulate tracers from a wellbore drilled into a subterranean formation, wherein at least one unique particulate tracer is pumped throughout each stage, each stage group, or any combination thereof during a hydraulic fracturing operation performed in the subterranean formation, and wherein each unique particulate tracer corresponds to an oil phase, a water phase, or a gas phase, and wherein the produced fluid samples comprise at least a portion of the unique particulate tracers that were pumped throughout the stages, the stage groups, or any combination thereof; anddetermining a flow profile for the wellbore for each phase using the produced fluid samples comprising the unique particulate tracers by:a) obtaining a tracer concentration history for each unique particulate tracer;b) obtaining a production history for the wellbore;c) determining a mean residence time for each unique particulate tracer using the corresponding tracer concentration history;d) determining a contact volume proxy for each unique particulate tracer using the production history and the corresponding tracer concentration history; ande) determining the flow profile for the wellbore for each phase indicative of flow contribution of each stage, each stage group, or any combination thereof by using the corresponding mean residence times and the corresponding contact volume proxies.
- The method of claim 1, wherein:the mean residence time is determined using an equation as follows:
 the contact volume proxy is determined using an equation as follows:
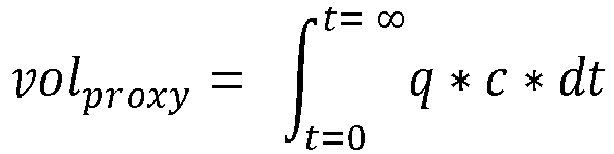 the flow profile is determined using an equation as follows:
- The method of claim 1 or 2, wherein:the method further comprises: smoothing a tracer concentration history for a specific unique particulate tracer before c) and d) to reduce noise; and utilizing the smoothed tracer concentration history for the specific unique particulate tracer in c) and d); and/orthe computer system further includes a graphical user interface, and the method further comprises: generating, on the graphical user interface, a representation of the flow profile for the wellbore for each phase indicative of the flow contribution of each stage, each stage group, or any combination thereof; and displaying, via the graphical user interface, the representation.
- The method of any of the preceding claims, before obtaining the produced fluid samples, further comprising:
shutting in the wellbore for a period of time to cause tracer clouds to form in the subterranean formation for at least a portion of the unique particulate tracers that were pumped throughout the stages, the stage groups, or any combination thereof. - The method of claim 4, wherein:after the period of time, the method further comprises flowing back the wellbore to cause produced fluid from the wellbore and the produced fluid samples are obtained from the produced fluid, and wherein the produced fluid samples comprise at least a portion of the unique particulate tracers that were pumped throughout the stages, the stage groups, or any combination thereof from the tracer clouds; and/orthe method further comprises analyzing the produced fluid samples obtained from the produced fluid to generate the tracer concentration history for each unique particulate tracer.
- A method of determining a flow profile for a wellbore using unique particulate tracers, the method being implemented in a computer system that includes a physical computer processor and non-transitory storage medium, the method comprising:a) obtaining, from a non-transitory storage medium, a tracer concentration history for each unique particulate tracer in produced fluid samples from a wellbore drilled into a subterranean formation, wherein at least one unique particulate tracer is pumped throughout each stage, each stage group, or any combination thereof during a hydraulic fracturing operation performed in the subterranean formation, and wherein each unique particulate tracer corresponds to an oil phase, a water phase, or a gas phase, and wherein the produced fluid samples comprise at least a portion of the unique particulate tracers that were pumped throughout the stages, the stage groups, or any combination thereof;b) obtaining, from the non-transitory storage medium, a production history for the wellbore;c) determining, with a physical computer processor, a mean residence time for each unique particulate tracer using the corresponding tracer concentration history;d) determining, with the physical computer processor, a contact volume proxy for each unique particulate tracer using the production history and the corresponding tracer concentration history; ande) determining, with the physical computer processor, a flow profile for the wellbore for each phase indicative of flow contribution of each stage, each stage group, or any combination thereof by using the corresponding mean residence times and the corresponding contact volume proxies.
- The method of claim 6, wherein:the mean residence time is determined using an equation as follows:
 the contact volume proxy is determined using an equation as follows:
 the flow profile is determined using an equation as follows:
- The method of claim 6 or 7, wherein:the method further comprises: smoothing a tracer concentration history for a specific unique particulate tracer before c) and d) to reduce noise; and utilizing the smoothed tracer concentration history for the specific unique particulate tracer in c) and d); and/orthe computer system further includes a graphical user interface, and the method further comprises: generating, on the graphical user interface, a representation of the flow profile for the wellbore for each phase indicative of the flow contribution of each stage, each stage group, or any combination thereof; and displaying, via the graphical user interface, the representation.
- A method of determining a flow profile for a wellbore using unique particulate tracers, the method comprising:obtaining produced fluid samples comprising unique particulate tracers from a wellbore drilled into a subterranean formation, wherein at least one unique particulate tracer is pumped throughout each stage, each stage group, or any combination thereof during a hydraulic fracturing operation performed in the subterranean formation, and wherein each unique particulate tracer corresponds to an oil phase, a water phase, or a gas phase, and wherein the produced fluid samples comprise at least a portion of the unique particulate tracers that were pumped throughout the stages, the stage groups, or any combination thereof; anddetermining a flow profile for the wellbore for each phase using the produced fluid samples comprising the unique particulate tracers by:a) obtaining a tracer concentration history for each unique particulate tracer;b) optionally obtaining a production history for the wellbore;c) determining a decline rate for each unique particulate tracer using the corresponding tracer concentration history;d) determining a normalization factor for each unique particulate tracer using the corresponding tracer concentration history and optionally the production history;e) determining a normalized decline rate for each unique particulate tracer using the corresponding decline rate and the corresponding normalization factor; andf) determining a flow profile for the wellbore for each phase indicative of flow contribution of each stage, each stage group, or any combination thereof by using the corresponding normalized decline rates.
- The method of claim 9, wherein:the decline rate is determined using an equation as follows:
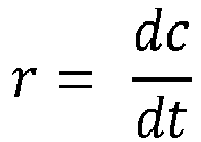 the normalization factor is represented asthe normalization factor is determined using an equation as follows:
 the normalized decline rate is determined using an equation as follows:
 the flow profile is determined using an equation as follows:
- The method of claim 9 or 10, wherein:the method further comprises: smoothing a tracer concentration history for a specific unique particulate tracer before c) and d) to reduce noise; and utilizing the smoothed tracer concentration history for the specific unique particulate tracer in c) and d); and/orthe computer system further includes a graphical user interface, and the method further comprises: generating, on the graphical user interface, a representation of the flow profile for the wellbore for each phase indicative of the flow contribution of each stage, each stage group, or any combination thereof; and displaying, via the graphical user interface, the representation.
- A method of determining a flow profile for a wellbore using unique particulate tracers, the method being implemented in a computer system that includes a physical computer processor and non-transitory storage medium the method comprising:a) obtaining, from a non-transitory storage medium, a tracer concentration history for each unique particulate tracer in produced fluid samples from a wellbore drilled into a subterranean formation, wherein at least one unique particulate tracer is pumped throughout each stage, each stage group, or any combination thereof during a hydraulic fracturing operation performed in the subterranean formation, and wherein each unique particulate tracer corresponds to an oil phase, a water phase, or a gas phase, and wherein the produced fluid samples comprise at least a portion of the unique particulate tracers that were pumped throughout the stages, the stage groups, or any combination thereof;b) optionally obtaining, from the non-transitory storage medium, a production history for the wellbore;c) determining, with a physical computer processor, a decline rate for each unique particulate tracer using the corresponding tracer concentration history;d) determining, with the physical computer processor, a normalization factor for each unique particulate tracer using the corresponding tracer concentration history and optionally the production history;e) determining, with the physical computer processor, a normalized decline rate for each unique particulate tracer using the corresponding decline rate and the corresponding normalization factor; andf) determining, with the physical computer processor, a flow profile for the wellbore for each phase indicative of flow contribution of each stage, each stage group, or any combination thereof by using the corresponding normalized decline rates.
- The method of claim 12, wherein:the decline rate is determined using an equation as follows:
 the normalization factor is represented as
 the normalization factor is determined using an equation as follows:
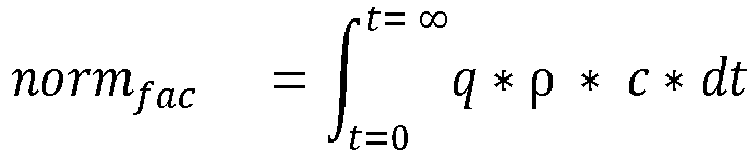 the normalized decline rate is determined using an equation as follows:
 the flow profile is determined using an equation as follows:
- The method of claim 12 or 13, further comprising:smoothing a tracer concentration history for a specific unique particulate tracer before c) and d) to reduce noise; andutilizing the smoothed tracer concentration history for the specific unique particulate tracer in c) and d).
- The method of claim 12, 13 or 14, wherein the computer system further includes a graphical user interface, and the method further comprises:generating, on the graphical user interface, a representation of the flow profile for the wellbore for each phase indicative of the flow contribution of each stage, each stage group, or any combination thereof; anddisplaying, via the graphical user interface, the representation.
Applications Claiming Priority (1)
| Application Number | Priority Date | Filing Date | Title |
|---|---|---|---|
| US202163288447P | 2021-12-10 | 2021-12-10 |
Publications (3)
| Publication Number | Publication Date |
|---|---|
| EP4194663A2 true EP4194663A2 (en) | 2023-06-14 |
| EP4194663A3 EP4194663A3 (en) | 2023-08-30 |
| EP4194663B1 EP4194663B1 (en) | 2025-09-24 |
Family
ID=84488355
Family Applications (1)
| Application Number | Title | Priority Date | Filing Date |
|---|---|---|---|
| EP22212927.2A Active EP4194663B1 (en) | 2021-12-10 | 2022-12-12 | Surveillance using particulate tracers |
Country Status (2)
| Country | Link |
|---|---|
| US (3) | US12655753B2 (en) |
| EP (1) | EP4194663B1 (en) |
Cited By (2)
| Publication number | Priority date | Publication date | Assignee | Title |
|---|---|---|---|---|
| WO2024050340A1 (en) * | 2022-08-29 | 2024-03-07 | Chevron U.S.A. Inc. | Tracer injection and analysis |
| WO2025226490A1 (en) * | 2024-04-23 | 2025-10-30 | Halliburton Energy Services, Inc. | Method of measuring the composition of production fluid flowing through an icd |
Families Citing this family (4)
| Publication number | Priority date | Publication date | Assignee | Title |
|---|---|---|---|---|
| US12655753B2 (en) | 2021-12-10 | 2026-06-16 | Chevron U.S.A. Inc. | Surveillance using particulate tracers |
| US20230279770A1 (en) * | 2022-03-07 | 2023-09-07 | Talgat Shokanov | Method of using an ultrahigh resolution nanoparticle tracer additive in a wellbore, hydraulic fractures and subsurface reservoir |
| CN119860215B (en) * | 2023-10-20 | 2025-11-25 | 中国石油天然气股份有限公司 | A method for testing the production profile of horizontal wells |
| CN120489879B (en) * | 2025-07-08 | 2026-07-17 | 浙江大学 | Method, device, equipment and medium for detecting residence time distribution of granular materials |
Citations (2)
| Publication number | Priority date | Publication date | Assignee | Title |
|---|---|---|---|---|
| US20140260694A1 (en) | 2013-03-15 | 2014-09-18 | Chevron U.S.A. Inc. | Automated Tracer Sampling and Measurement System |
| US8949029B2 (en) | 2010-10-29 | 2015-02-03 | Resman As | Method for using tracer flowback for estimating influx volumes of fluids from different influx zones |
Family Cites Families (15)
| Publication number | Priority date | Publication date | Assignee | Title |
|---|---|---|---|---|
| WO2010118315A1 (en) * | 2009-04-10 | 2010-10-14 | Shell Oil Company | Treatment methodologies for subsurface hydrocarbon containing formations |
| US8393395B2 (en) * | 2009-06-03 | 2013-03-12 | Schlumberger Technology Corporation | Use of encapsulated chemical during fracturing |
| US8230731B2 (en) | 2010-03-31 | 2012-07-31 | Schlumberger Technology Corporation | System and method for determining incursion of water in a well |
| US20130132052A1 (en) * | 2011-11-18 | 2013-05-23 | Chevron U.S.A. Inc. | System and method for assessing heterogeneity of a geologic volume of interest with process-based models and dynamic heterogeneity |
| NO340688B1 (en) * | 2013-12-23 | 2017-05-29 | Inst Energiteknik | tracing Substance |
| CA2906504A1 (en) * | 2014-10-03 | 2016-04-03 | Chevron U.S.A. Inc. | Magnetic nanoparticles and integration platform |
| US11084966B2 (en) * | 2015-04-30 | 2021-08-10 | Jolmson Matthey Public Limited Company | Controlled release system for the release of oil field chemicals and use of the system for reservoir treatment and monitoring |
| GB201507480D0 (en) | 2015-04-30 | 2015-06-17 | Johnson Matthey Plc | Oil field chemical delivery fluids, methods for their use in the targeted delivery of oil field chemicals to subterranean hydrocarbon reservoirs and methods |
| US10914139B2 (en) * | 2017-02-22 | 2021-02-09 | Weatherford Technology Holdings, Llc | Systems and methods for optimization of the number of diverter injections and the timing of the diverter injections relative to stimulant injection |
| CN108825226A (en) | 2018-07-02 | 2018-11-16 | 四川圣诺油气工程技术服务有限公司 | A kind of method and device for assessing gas production after pressure using chemical tracer |
| RU2685600C1 (en) * | 2018-07-20 | 2019-04-22 | Общество с ограниченной ответственностью "ГеоСплит" | Method for determination of downhole fluid inflows at multi-stage hydraulic fracturing of formation |
| WO2020086599A1 (en) * | 2018-10-22 | 2020-04-30 | Chevron U.S.A. Inc. | Ph control in fluid treatment |
| US10961445B2 (en) | 2019-03-08 | 2021-03-30 | Multi-Chem Group, Llc | Tracking production of oil, gas, and water from subterranean formation by adding soluble tracers coated onto solid particulate |
| RU2749223C1 (en) | 2020-03-27 | 2021-06-07 | Общество с ограниченной ответственностью «ГеоСплит» | Method of qualitative and quantitative estimation of downhole gas inflows in multistage hydraulic fracturing in a multiphase flow system |
| US12655753B2 (en) | 2021-12-10 | 2026-06-16 | Chevron U.S.A. Inc. | Surveillance using particulate tracers |
-
2022
- 2022-12-12 US US18/079,068 patent/US12655753B2/en active Active
- 2022-12-12 US US18/079,045 patent/US12196075B2/en active Active
- 2022-12-12 US US18/079,052 patent/US12571302B2/en active Active
- 2022-12-12 EP EP22212927.2A patent/EP4194663B1/en active Active
Patent Citations (2)
| Publication number | Priority date | Publication date | Assignee | Title |
|---|---|---|---|---|
| US8949029B2 (en) | 2010-10-29 | 2015-02-03 | Resman As | Method for using tracer flowback for estimating influx volumes of fluids from different influx zones |
| US20140260694A1 (en) | 2013-03-15 | 2014-09-18 | Chevron U.S.A. Inc. | Automated Tracer Sampling and Measurement System |
Non-Patent Citations (4)
| Title |
|---|
| "Flow loop testing to validate Tracerco's solid chemical inflow tracer technology", TRACERCO LIMITED, 2021, Retrieved from the Internet <URL:https://www.tracerco.com/downloads/case-studies/flow-loop-testing-to-validate-tracercos-solid-chemical-inflow-tracer-technology> |
| HAITAO LI ET AL.: "Evaluation of the Release Mechanism of Sustained-Release Tracers and its Application in Horizontal Well Inflow Profile Monitoring", ACS OMEGA, vol. 6, no. 29, 2021, pages 19269 - 19280 |
| IZGEC, B..HASAN, A.R.. R.LIN, DC.S.. S. KABIR: "Flow-Rate Estimation From Wellhead-Pressure and Temperature Data", SPE PROD & OPER, vol. 25, 2010, pages 31 - 39 |
| JAIN, LOKENDRADOORWAR, SHASHVATDANIEL EMERY: "Analytical Tracer Interpretation Model for Fracture Flow Characterization and Swept Volume Estimation in Unconventional Wells", PAPER PRESENTED AT THE SPE/AAPG/SEG UNCONVENTIONAL RESOURCES TECHNOLOGY CONFERENCE, HOUSTON, TEXAS, USA, July 2021 (2021-07-01) |
Cited By (2)
| Publication number | Priority date | Publication date | Assignee | Title |
|---|---|---|---|---|
| WO2024050340A1 (en) * | 2022-08-29 | 2024-03-07 | Chevron U.S.A. Inc. | Tracer injection and analysis |
| WO2025226490A1 (en) * | 2024-04-23 | 2025-10-30 | Halliburton Energy Services, Inc. | Method of measuring the composition of production fluid flowing through an icd |
Also Published As
| Publication number | Publication date |
|---|---|
| EP4194663A3 (en) | 2023-08-30 |
| US20230184096A1 (en) | 2023-06-15 |
| EP4194663B1 (en) | 2025-09-24 |
| US12571302B2 (en) | 2026-03-10 |
| US12655753B2 (en) | 2026-06-16 |
| US12196075B2 (en) | 2025-01-14 |
| US20230184097A1 (en) | 2023-06-15 |
| US20230184098A1 (en) | 2023-06-15 |
Similar Documents
| Publication | Publication Date | Title |
|---|---|---|
| EP4194663B1 (en) | Surveillance using particulate tracers | |
| US20240287899A1 (en) | Hydraulic integrity analysis | |
| RU2274747C2 (en) | Optimization method for oil production from multilayer compound beds with the use of dynamics of oil recovery from compound beds and geophysical production well investigation data | |
| US10570730B2 (en) | Hydrocarbon filled fracture formation testing before shale fracturing | |
| US9822626B2 (en) | Planning and performing re-fracturing operations based on microseismic monitoring | |
| US8141632B2 (en) | Method for hydraulic fracture dimensions determination | |
| CN109415936B (en) | Methods and systems for establishing well performance during plug grinding out or cleanout/workover operations | |
| US20190330975A1 (en) | Determining Wellbore Parameters Through Analysis Of The Multistage Treatments | |
| US9708906B2 (en) | Method and system for hydraulic fracture diagnosis with the use of a coiled tubing dual isolation service tool | |
| Jones* et al. | Estimating reservoir pressure from early flowback data | |
| US9976402B2 (en) | Method and system for hydraulic fracture diagnosis with the use of a coiled tubing dual isolation service tool | |
| AU2011251674B2 (en) | Method and system for treating a subterranean formation | |
| WO2024050340A1 (en) | Tracer injection and analysis | |
| US20240368987A1 (en) | System and method for carbonated water injection for production surveillance and well stimulation | |
| WO2016025672A1 (en) | Method of treating an underground formation featuring single-point stimulation | |
| US12110788B2 (en) | System of chemical in-flow tracers for early water breakthrough detection | |
| US11352883B2 (en) | In-situ rheology behavior characterization using data analytics techniques | |
| Al-Morakhi et al. | Real time advanced flow analysis for early kick/loss detection & identification of open fractures | |
| CA3189078A1 (en) | Method of using an ultrahigh resolution nanoparticle tracer additive in a wellbore, hydraulic fractures and subsurface reservoir | |
| Spady et al. | Is bigger always better? Using chemical tracers to optimize the size of your multistage fracturing | |
| GB2539001A (en) | Improvements in or relating to hydrocarbon production from shale | |
| Clark et al. | A Comprehensive Approach to Surveillance in Appraisal of a Tight Gas Project in Central Oman | |
| US20250075617A1 (en) | Method of using non-magnetic solid tracers | |
| US20260117645A1 (en) | Method of using tracers for providing a data set related to wellbore performance |
Legal Events
| Date | Code | Title | Description |
|---|---|---|---|
| PUAI | Public reference made under article 153(3) epc to a published international application that has entered the european phase |
Free format text: ORIGINAL CODE: 0009012 |
|
| STAA | Information on the status of an ep patent application or granted ep patent |
Free format text: STATUS: THE APPLICATION HAS BEEN PUBLISHED |
|
| AK | Designated contracting states |
Kind code of ref document: A2 Designated state(s): AL AT BE BG CH CY CZ DE DK EE ES FI FR GB GR HR HU IE IS IT LI LT LU LV MC ME MK MT NL NO PL PT RO RS SE SI SK SM TR |
|
| PUAL | Search report despatched |
Free format text: ORIGINAL CODE: 0009013 |
|
| AK | Designated contracting states |
Kind code of ref document: A3 Designated state(s): AL AT BE BG CH CY CZ DE DK EE ES FI FR GB GR HR HU IE IS IT LI LT LU LV MC ME MK MT NL NO PL PT RO RS SE SI SK SM TR |
|
| RIC1 | Information provided on ipc code assigned before grant |
Ipc: E21B 43/267 20060101ALI20230724BHEP Ipc: E21B 47/11 20120101AFI20230724BHEP |
|
| STAA | Information on the status of an ep patent application or granted ep patent |
Free format text: STATUS: REQUEST FOR EXAMINATION WAS MADE |
|
| 17P | Request for examination filed |
Effective date: 20240228 |
|
| RBV | Designated contracting states (corrected) |
Designated state(s): AL AT BE BG CH CY CZ DE DK EE ES FI FR GB GR HR HU IE IS IT LI LT LU LV MC ME MK MT NL NO PL PT RO RS SE SI SK SM TR |
|
| RAP3 | Party data changed (applicant data changed or rights of an application transferred) |
Owner name: CHEVRON U.S.A. INC. |
|
| GRAP | Despatch of communication of intention to grant a patent |
Free format text: ORIGINAL CODE: EPIDOSNIGR1 |
|
| STAA | Information on the status of an ep patent application or granted ep patent |
Free format text: STATUS: GRANT OF PATENT IS INTENDED |
|
| INTG | Intention to grant announced |
Effective date: 20250424 |
|
| GRAS | Grant fee paid |
Free format text: ORIGINAL CODE: EPIDOSNIGR3 |
|
| GRAA | (expected) grant |
Free format text: ORIGINAL CODE: 0009210 |
|
| STAA | Information on the status of an ep patent application or granted ep patent |
Free format text: STATUS: THE PATENT HAS BEEN GRANTED |
|
| AK | Designated contracting states |
Kind code of ref document: B1 Designated state(s): AL AT BE BG CH CY CZ DE DK EE ES FI FR GB GR HR HU IE IS IT LI LT LU LV MC ME MK MT NL NO PL PT RO RS SE SI SK SM TR |
|
| P01 | Opt-out of the competence of the unified patent court (upc) registered |
Free format text: CASE NUMBER: UPC_APP_3849_4194663/2025 Effective date: 20250820 |
|
| REG | Reference to a national code |
Ref country code: GB Ref legal event code: FG4D |
|
| REG | Reference to a national code |
Ref country code: CH Ref legal event code: EP |
|
| REG | Reference to a national code |
Ref country code: DE Ref legal event code: R096 Ref document number: 602022021902 Country of ref document: DE |
|
| REG | Reference to a national code |
Ref country code: IE Ref legal event code: FG4D |
|
| REG | Reference to a national code |
Ref country code: NL Ref legal event code: FP |
|
| PGFP | Annual fee paid to national office [announced via postgrant information from national office to epo] |
Ref country code: NL Payment date: 20251112 Year of fee payment: 4 |
|
| PGFP | Annual fee paid to national office [announced via postgrant information from national office to epo] |
Ref country code: NO Payment date: 20251210 Year of fee payment: 4 |
|
| REG | Reference to a national code |
Ref country code: LT Ref legal event code: MG9D |
|
| PGFP | Annual fee paid to national office [announced via postgrant information from national office to epo] |
Ref country code: AT Payment date: 20260113 Year of fee payment: 4 |
|
| PG25 | Lapsed in a contracting state [announced via postgrant information from national office to epo] |
Ref country code: FI Free format text: LAPSE BECAUSE OF FAILURE TO SUBMIT A TRANSLATION OF THE DESCRIPTION OR TO PAY THE FEE WITHIN THE PRESCRIBED TIME-LIMIT Effective date: 20250924 |
|
| PG25 | Lapsed in a contracting state [announced via postgrant information from national office to epo] |
Ref country code: HR Free format text: LAPSE BECAUSE OF FAILURE TO SUBMIT A TRANSLATION OF THE DESCRIPTION OR TO PAY THE FEE WITHIN THE PRESCRIBED TIME-LIMIT Effective date: 20250924 |
|
| PGFP | Annual fee paid to national office [announced via postgrant information from national office to epo] |
Ref country code: FR Payment date: 20251110 Year of fee payment: 4 |
|
| PG25 | Lapsed in a contracting state [announced via postgrant information from national office to epo] |
Ref country code: GR Free format text: LAPSE BECAUSE OF FAILURE TO SUBMIT A TRANSLATION OF THE DESCRIPTION OR TO PAY THE FEE WITHIN THE PRESCRIBED TIME-LIMIT Effective date: 20251225 |
|
| PG25 | Lapsed in a contracting state [announced via postgrant information from national office to epo] |
Ref country code: SE Free format text: LAPSE BECAUSE OF FAILURE TO SUBMIT A TRANSLATION OF THE DESCRIPTION OR TO PAY THE FEE WITHIN THE PRESCRIBED TIME-LIMIT Effective date: 20250924 |
|
| PG25 | Lapsed in a contracting state [announced via postgrant information from national office to epo] |
Ref country code: LV Free format text: LAPSE BECAUSE OF FAILURE TO SUBMIT A TRANSLATION OF THE DESCRIPTION OR TO PAY THE FEE WITHIN THE PRESCRIBED TIME-LIMIT Effective date: 20250924 |
|
| PG25 | Lapsed in a contracting state [announced via postgrant information from national office to epo] |
Ref country code: BG Free format text: LAPSE BECAUSE OF FAILURE TO SUBMIT A TRANSLATION OF THE DESCRIPTION OR TO PAY THE FEE WITHIN THE PRESCRIBED TIME-LIMIT Effective date: 20250924 |
|
| PG25 | Lapsed in a contracting state [announced via postgrant information from national office to epo] |
Ref country code: RS Free format text: LAPSE BECAUSE OF FAILURE TO SUBMIT A TRANSLATION OF THE DESCRIPTION OR TO PAY THE FEE WITHIN THE PRESCRIBED TIME-LIMIT Effective date: 20251224 |
|
| REG | Reference to a national code |
Ref country code: AT Ref legal event code: MK05 Ref document number: 1840475 Country of ref document: AT Kind code of ref document: T Effective date: 20250924 |
|
| PG25 | Lapsed in a contracting state [announced via postgrant information from national office to epo] |
Ref country code: SM Free format text: LAPSE BECAUSE OF FAILURE TO SUBMIT A TRANSLATION OF THE DESCRIPTION OR TO PAY THE FEE WITHIN THE PRESCRIBED TIME-LIMIT Effective date: 20250924 |
|
| PG25 | Lapsed in a contracting state [announced via postgrant information from national office to epo] |
Ref country code: ES Free format text: LAPSE BECAUSE OF FAILURE TO SUBMIT A TRANSLATION OF THE DESCRIPTION OR TO PAY THE FEE WITHIN THE PRESCRIBED TIME-LIMIT Effective date: 20250924 |
|
| PG25 | Lapsed in a contracting state [announced via postgrant information from national office to epo] |
Ref country code: AT Free format text: LAPSE BECAUSE OF FAILURE TO SUBMIT A TRANSLATION OF THE DESCRIPTION OR TO PAY THE FEE WITHIN THE PRESCRIBED TIME-LIMIT Effective date: 20250924 |
|
| PG25 | Lapsed in a contracting state [announced via postgrant information from national office to epo] |
Ref country code: RO Free format text: LAPSE BECAUSE OF FAILURE TO SUBMIT A TRANSLATION OF THE DESCRIPTION OR TO PAY THE FEE WITHIN THE PRESCRIBED TIME-LIMIT Effective date: 20250924 Ref country code: IT Free format text: LAPSE BECAUSE OF FAILURE TO SUBMIT A TRANSLATION OF THE DESCRIPTION OR TO PAY THE FEE WITHIN THE PRESCRIBED TIME-LIMIT Effective date: 20250924 |
|
| PG25 | Lapsed in a contracting state [announced via postgrant information from national office to epo] |
Ref country code: IS Free format text: LAPSE BECAUSE OF FAILURE TO SUBMIT A TRANSLATION OF THE DESCRIPTION OR TO PAY THE FEE WITHIN THE PRESCRIBED TIME-LIMIT Effective date: 20260124 |
|
| PG25 | Lapsed in a contracting state [announced via postgrant information from national office to epo] |
Ref country code: CZ Free format text: LAPSE BECAUSE OF FAILURE TO SUBMIT A TRANSLATION OF THE DESCRIPTION OR TO PAY THE FEE WITHIN THE PRESCRIBED TIME-LIMIT Effective date: 20250924 Ref country code: PT Free format text: LAPSE BECAUSE OF FAILURE TO SUBMIT A TRANSLATION OF THE DESCRIPTION OR TO PAY THE FEE WITHIN THE PRESCRIBED TIME-LIMIT Effective date: 20260126 |
|
| PG25 | Lapsed in a contracting state [announced via postgrant information from national office to epo] |
Ref country code: PL Free format text: LAPSE BECAUSE OF FAILURE TO SUBMIT A TRANSLATION OF THE DESCRIPTION OR TO PAY THE FEE WITHIN THE PRESCRIBED TIME-LIMIT Effective date: 20250924 |
|
| PG25 | Lapsed in a contracting state [announced via postgrant information from national office to epo] |
Ref country code: SK Free format text: LAPSE BECAUSE OF FAILURE TO SUBMIT A TRANSLATION OF THE DESCRIPTION OR TO PAY THE FEE WITHIN THE PRESCRIBED TIME-LIMIT Effective date: 20250924 Ref country code: EE Free format text: LAPSE BECAUSE OF FAILURE TO SUBMIT A TRANSLATION OF THE DESCRIPTION OR TO PAY THE FEE WITHIN THE PRESCRIBED TIME-LIMIT Effective date: 20250924 |
|
| REG | Reference to a national code |
Ref country code: DE Ref legal event code: R097 Ref document number: 602022021902 Country of ref document: DE |
|
| PG25 | Lapsed in a contracting state [announced via postgrant information from national office to epo] |
Ref country code: LT Free format text: LAPSE BECAUSE OF FAILURE TO SUBMIT A TRANSLATION OF THE DESCRIPTION OR TO PAY THE FEE WITHIN THE PRESCRIBED TIME-LIMIT Effective date: 20250924 |
|
| REG | Reference to a national code |
Ref country code: DE Ref legal event code: R119 Ref document number: 602022021902 Country of ref document: DE |
|
| PG25 | Lapsed in a contracting state [announced via postgrant information from national office to epo] |
Ref country code: MC Free format text: LAPSE BECAUSE OF FAILURE TO SUBMIT A TRANSLATION OF THE DESCRIPTION OR TO PAY THE FEE WITHIN THE PRESCRIBED TIME-LIMIT Effective date: 20250924 |
|
| PG25 | Lapsed in a contracting state [announced via postgrant information from national office to epo] |
Ref country code: DK Free format text: LAPSE BECAUSE OF FAILURE TO SUBMIT A TRANSLATION OF THE DESCRIPTION OR TO PAY THE FEE WITHIN THE PRESCRIBED TIME-LIMIT Effective date: 20250924 |
|
| REG | Reference to a national code |
Ref country code: CH Ref legal event code: H13 Free format text: ST27 STATUS EVENT CODE: U-0-0-H10-H13 (AS PROVIDED BY THE NATIONAL OFFICE) Effective date: 20260723 |
|
| PLBE | No opposition filed within time limit |
Free format text: ORIGINAL CODE: 0009261 |
|
| STAA | Information on the status of an ep patent application or granted ep patent |
Free format text: STATUS: NO OPPOSITION FILED WITHIN TIME LIMIT |
|
| REG | Reference to a national code |
Ref country code: CH Ref legal event code: L10 Free format text: ST27 STATUS EVENT CODE: U-0-0-L10-L00 (AS PROVIDED BY THE NATIONAL OFFICE) Effective date: 20260805 |