FIELD OF THE INVENTION
-
The invention relates to a method of predicting an outcome of a breast cancer subject and to a computer program product for predicting an outcome of a breast cancer subject. Moreover, the invention relates to a diagnostic kit, to a use of the kit, to a use of the kit in a method of predicting an outcome of a breast cancer subject, to a use of a gene expression profile of one or more immune defense response genes, one or more T-Cell receptor signalling genes and/or one or more PDE4D7-correlated genes in a method of predicting an outcome of a breast cancer subject, and to a corresponding computer program product.
INTRODUCTION
-
Cancer is a class of diseases in which a group of cells displays uncontrolled growth, invasion and sometimes metastasis. These three malignant properties of cancers differentiate them from benign tumours, which are self-limited and do not invade or metastasize.
-
Breast cancer is the most commonly-occurring and second most lethal non-skin malignancy in women, with an estimated 300.000 new cases annually diagnosed and an estimated 45.000 breast cancer related deaths in 2021 in the US alone (see
ACS (American Cancer Society), "Cancer Facts & Figures 2021", 2021). The median age at diagnosis is 62 years, and the 5-year relative survival is 90%. However, this survival rate is not representative for all breast cancer patients and is strongly dependent on the stage and type of breast cancer a patient has. In general, the earlier the cancers are diagnosed, the higher the chance of surviving more than 5 years after diagnosis. For breast cancer, 63% is diagnosed at the local stage, for which the 5-year relative survival is 98,9%. However, when diagnosed at the regional (30%) or distant stage (6%), the 5-year relative survival drops to 85,7% and 28,1%, respectively. In the past decade, age-adjusted rates for new female breast cancer cases have been rising on average 0.3% each year over 2008-2017, but age-adjusted death rates have been falling on average 1.4% each year over 2009-2018. Breast cancer almost exclusively affects women, but it can occur in men as well (SEER Cancer Stat Facts).
-
Although male breast cancer is rare, men may suffer from breast cancer. In 2021 it is estimated that 2.650 new cases of invasive breast cancer will be diagnosed in American men, resulting in about 530 breast-cancer related deaths (ACS 2021).
-
Several risk factors for breast cancer are known. Life-style related factors are consumption of alcohol, being overweight or obese, not being physically active, not having children by the age of 30, not breast feeding, being on hormonal birth control, receiving hormonal therapy after menopause, and having breast implants. Other factors that contribute to the risk of breast cancer are older age, inheriting certain genetic changes (e.g. in BRCA1 and BRCA2, or less common, in the ATM, TP53, CHEK2, PTEN, CDH1, STK11, PALB2 genes), having a family history, race and ethnicity, being tall, having dense breast tissue, having certain benign breast conditions, starting menstrual periods early (before 12) or going into menopause after 55, having chest radiation, and being exposed to DES. For some risk factors, evidence is not conclusive, such as night shift work, smoking, diet and vitamins, and certain environmental chemicals. There are many factors that research has shown are not linked to breast cancer, although there is a lot of information spread that they might be, such as antiperspirant use and induced abortion.
-
Breast cancer can originate in different areas of the breast, such as the ducts, the lobules and the tissue in between. The most common type of breast cancer is the invasive ductal carcinoma (IDC) making up about 70 - 80% of all breast cancers. The breast cancer is classified as invasive due to its aggressive spreading into surrounding breast tissue, in contrast to for example in situ ductal carcinoma. Another common invasive breast cancer variety is the invasive lobular carcinoma (see ACS (American Cancer Society) ibid.) Other types of breast cancer are for example medullary carcinoma of the breast, mucinous carcinoma and tubular carcinoma; all are (very) rare varieties of IDC.
-
According to the American Cancer Society, the overall breast cancer survival rate after 5 years is about 90%. However, this survival rate depends on many factors, including treatment option, type of breast cancer, stage of progression of the cancer and overall health.
-
The treatment of breast cancer depends on the extent of the disease but also on the risk whether the disease is going to spread after primary treatment. The six standard treatment options for breast cancer are surgical resection (e.g. radical mastectomy or lumpectomy), radiation therapy (RT), chemotherapy, hormonal therapy, targeted therapy and immunotherapy. Surgery is the most used treatment and most women with breast cancer will undergo some type of surgery as part of their standard-of-care therapy. RT is commonly administered via an external beam or via the implantation of radioactive seeds into the breast (brachytherapy (internal radiation)) or a combination of both. It is especially preferable to use RT for patients who are not eligible for surgery or who have metastasized carcinoma cells or in cases where the cancer is found in many lymph nodes or if certain surgical margins have cancer such as the skin or muscle (see ACS (American Cancer Society) ibid.).
-
The more likely the selected treatment (or treatment combination) will be inducing significant morbidities for the patient the more relevant it gets to be able to predict whether a patient (or patient group) will benefit from a treatment (or treatment combination) or not. Treatment (combinations) with a significant deteriorating effect on quality of life for the patient should only be considered if there is a significant probability that the treatment will prevent, reduce, or minimize disease progression.
-
To diagnose a breast cancer and decide on the treatment multiple tests are done to determine the presence of cancer. These tests range from physical examination of the body to checking general signs of health or disease to various forms of imaging exams (X-ray, ultrasound, or MR) and biochemical tests in blood or taking tissues and bodily fluids for pathology via a biopsy procedure. A wide range of biomarker candidates in tissue and bodily fluids has been investigated, but validation is often limited and generally demonstrates prognostic information and not a predictive (therapy-specific) value. Examples of such molecular tests to decide on treatment are the estrogen (ER) and progesterone (PR) receptor test and the human epidermal growth factor type 2 receptor (HER2/neu) test. The ER- and PR-receptor test measures the expression of ER and PR on breast tumour cells. ER/PR positive tumours are commonly treated with molecules that block the activity of these receptors. The HER2/neu test measures the expression of HER2/neu gene/protein in the tumour cells. HER2/neu positive breast cancer are commonly treated with drugs or antibodies that target the HER2/neu protein on the tumour cells
-
Numerous investigations have been conducted to determine molecular signatures, based on multiple genes, of breast cancer by means of the expression profile of a set of genes within the tumour (see Sørlie, T et al. Proc Natl Acad Sci U S A. 2001 Sep 11;98(19):10869-74.). The potential relevance of gene expression for a prognostic intent in breast cancer has led to the development of at least three separate commercially available multigene tests for breast cancer, comprising: the Oncotype DX® test (Genomic Health, Redwood, CA, USA), the MammaPrint® test (Netherlands Cancer Institute™ and Agendia™, The Netherlands), and the Prosigna® one (NanoString Technologies, Seattle, WA, USA). The Oncotype DX test is a RT reverse transcriptase chain reaction assay that measures the expression of a panel of 21 genes (16 cancer related genes ER, PR, Bcl2, SCUBE2, HER2, GRB7, Ki-67, STK15, survivin, cyclin B1, MYBL2, stromelysin 3, cathepsin L2, GSTM1, CD68, and BAG1 and 5 housekeeping genes (beta-actin, GAPDH, RPLPO, GUS, and TFRC)) and generates a stratification of breast cancer patients into three risk groups based on the recurrence rate of the cancer (ACS 2019). The MammaPrint test measures the gene expression profiles of 70 genes involved in various intracellular pathways and generates a stratification of breast cancer patients into a low- and high risk group based on the outcome of early distant recurrence. The MammaPrint, e.g. in combination with the BluePrint® test, is also predictive for adjuvant chemotherapy responsiveness of a breast cancer subject (Longbottom et al. Cancer Res February 15 (4 supplement) PS6-30 (2021)). The Prosigna One test is based on the PAM50 (Prediction Analysis of Microarray 50) gene signature. The Prosigna assay is a genomic test that analyses the activity of certain genes in early-stage, hormone-receptor-positive breast cancer . The assay specifically provides a prognosis on risk of distant recurrence for hormone receptor-positive stage I―III breast cancers to be treated with adjuvant hormone therapy (Wallden, B et al. BMC Med Genomics 8, 54 (2015)). The PAM50 signature used in the assay comprises a panel consisting of 50 genes for a method for predicting intrinsic biological subtypes of breast cancer. Using a risk model that incorporates the gene expression-based "intrinsic" subtypes luminal A, luminal B, HER2-enriched, and basal-like the investigators were able to identify and diagnose for intrinsic subtypes of breast cancer (Parker, JS et al. J Clin Oncol. Mar 10;27(8):1160-7 (2009)). One further study reports that the PAM50 gene signature, however highly prognostic, did not predict for improved outcomes with dose-dense chemotherapy (Liu, M. et al. Breast Cancer 2, 15023 (2016)). A further study reported that the PAM50 intrinsic subtype classification and a "risk of recurrence"-score allows for classification of patient into prognostic groups that allow prediction of the risk of recurrence and for the need of adjuvant treatment (Ohnstad, H.O. et al. Breast Cancer Res 19, 120 (2017)).
-
Although these clinically available tools provide means of patient stratification in various risk groups based on the endpoint of (distant) recurrence of the cancer or responsiveness to chemotherapy, there is a need for better predictive tools for the outcome of breast cancer.
SUMMARY OF THE INVENTION
-
The prediction of the therapy outcome is very complicated as many factors play a role in therapy effectiveness and disease recurrence. It is likely that important factors have not yet been identified, while the effect of others cannot be determined precisely. The inventors hypothesized that an improved prediction of the outcome of breast cancer for each patient would improve therapy selection and potentially survival. The inventors determined that this can be achieved by 1) optimizing stratification of subjects suffering from a (subtype of) breast cancer into risk groups based on the outcome after surgery, and 2) guiding patients where surgery is predicted to be hardly effective to an alternative, secondary, potentially more effective form of treatment. Further the inventors found that this would reduce suffering for those patients who would be spared ineffective therapy and would reduce costs spent on ineffective therapies.
-
In conclusion, the inventors hypothesized that there is a strong need for better prediction of the outcome of breast cancer, and thus of a breast cancer subject, and herein provide a method and a means of achieving an improved prediction of the outcome.
-
In a first aspect the invention relates to a method of predicting an outcome of a breast cancer subject, comprising: determining or receiving the result of a determination of a first gene expression profile for each of one or more, for example, 1, 2, 3, 4, 5, 6, 7, 8, 9, 10, 11, 12, 13 or all, immune defense response genes selected from the group consisting of: AIM2, APOBEC3A, CIAO1, DDX58, DHX9, IFI16, IFIH1, IFIT1, IFIT3, LRRFIP1, MYD88, OAS1, TLR8, and ZBP1, said first gene expression profile(s) being determined in a biological sample obtained from the subject, and/or determining or receiving the result of a determination of a second gene expression profile for each of one or more, for example, 1, 2, 3, 4, 5, 6, 7, 8, 9, 10, 11, 12, 13, 14, 15, 16 or all, T-Cell receptor signalling genes selected from the group consisting of: CD2, CD247, CD28, CD3E, CD3G, CD4, CSK, EZR, FYN, LAT, LCK, PAG1, PDE4D, PRKACA, PRKACB, PTPRC, and ZAP70, said second gene expression profile(s) being determined in a biological sample obtained from the subject, and/or determining or receiving the result of a determination of a third gene expression profile for each of one or more, for example, 1, 2, 3, 4, 5, 6, 7 or all, PDE4D7 correlated genes selected from the group consisting of: ABCC5, CUX2, KIAA1549, PDE4D, RAP1GAP2, SLC39A11, TDRD1, and VWA2, said third gene expression profile(s) being determined in a biological sample obtained from the subject, determining the prediction of the outcome based on the first, second, and/or third gene expression profile(s), wherein said prediction is a favourable risk or a non-favourable risk of breast-cancer related death, loco-regional recurrence and/or distant recurrence.
-
In a second aspect, the invention relates to a computer program product comprising instructions which, when the program is executed by a computer, cause the computer to carry out a method comprising: receiving data indicative of a first gene expression profile for each of one or more, for example, 1, 2, 3, 4, 5, 6, 7, 8, 9, 10, 11, 12, 13 or all, immune defense response genes selected from the group consisting of: AIM2, APOBEC3A, CIAO1, DDX58, DHX9, IFI16, IFIH1, IFIT1, IFIT3, LRRFIP1, MYD88, OAS1, TLR8, and ZBP1, said first gene expression profile(s) being determined in a biological sample obtained from a breast cancer subject, and/or of a second gene expression profile for each of one or more, for example, 1, 2, 3, 4, 5, 6, 7, 8, 9, 10, 11, 12, 13, 14, 15, 16 or all, T-Cell receptor signalling genes selected from the group consisting of: CD2, CD247, CD28, CD3E, CD3G, CD4, CSK, EZR, FYN, LAT, LCK, PAG1, PDE4D, PRKACA, PRKACB, PTPRC, and ZAP70, said second gene expression profile(s) being determined in a biological sample obtained from a breast cancer subject, and/or of a third gene expression profile for each of one or more, for example, 1, 2, 3, 4, 5, 6, 7 or all, PDE4D7 correlated genes selected from the group consisting of: ABCC5, CUX2, KIAA1549, PDE4D, RAP1GAP2, SLC39A11, TDRD1, and VWA2, said third gene expression profile(s) being determined in a biological sample obtained from a breast cancer subject, determining a prediction of an outcome of the subject based on the first gene expression profile(s), or on the second gene expression profile(s), or on the third gene expression profile(s), or on the first, second, and third gene expression profile(s), wherein said prediction is a favourable risk or a non-favourable risk of breast-cancer related death, loco-regional recurrence and/or distant recurrence.
-
In a third aspect the invention relates to a diagnostic kit, comprising: at least one polymerase chain reaction primer, and optionally at least one probe, for determining the gene expression profile(s) for each of one or more, for example, 1, 2, 3, 4, 5, 6, 7, 8, 9, 10, 11, 12, 13 or all, immune defense response genes selected from the group consisting of: AIM2, APOBEC3A, CIAO1, DDX58, DHX9, IFI16, IFIH1, IFIT1, IFIT3, LRRFIP1, MYD88, OAS1, TLR8, and ZBP1, each of one or more, for example, 1, 2, 3, 4, 5, 6, 7, 8, 9, 10, 11, 12, 13, 14, 15, 16 or all, T-Cell receptor signalling genes selected from the group consisting of: CD2, CD247, CD28, CD3E, CD3G, CD4, CSK, EZR, FYN, LAT, LCK, PAG1, PDE4D, PRKACA, PRKACB, PTPRC, and ZAP70, and/or each of one or more, for example, 1, 2, 3, 4, 5, 6, 7 or all, PDE4D7 correlated genes selected from the group consisting of: ABCC5, CUX2, KIAA1549, PDE4D, RAP1GAP2, SLC39A11, TDRD1, and VWA2, in a biological sample obtained from a breast cancer subject and/or in a sample.
-
In a fourth aspect, the invention relates to use of the kit as defined in third aspect of the invention in a method of predicting an outcome of a breast cancer subject, preferably for use in the method as defined in the first aspect of the invention.
-
In a fifth aspect, the invention relates to a method, comprising: receiving a biological sample obtained from a breast cancer subject, using the kit according to the third aspect to determine the gene expression profile(s) for each of one or more, for example, 1, 2, 3, 4, 5, 6, 7, 8, 9, 10, 11, 12, 13 or all, immune defense response genes selected from the group consisting of: AIM2, APOBEC3A, CIAO1, DDX58, DHX9, IFI16, IFIH1, IFIT1, IFIT3, LRRFIP1, MYD88, OAS1, TLR8, and ZBP1, each of one or more, for example, 1, 2, 3, 4, 5, 6, 7, 8, 9, 10, 11, 12, 13, 14, 15, 16 or all, T-Cell receptor signalling genes selected from the group consisting of: CD2, CD247, CD28, CD3E, CD3G, CD4, CSK, EZR, FYN, LAT, LCK, PAG1, PDE4D, PRKACA, PRKACB, PTPRC, and ZAP70, and/or each of one or more, for example, 1, 2, 3, 4, 5, 6, 7 or all, PDE4D7 correlated genes selected from the group consisting of: ABCC5, CUX2, KIAA1549, PDE4D, RAP1GAP2, SLC39A11, TDRD1, and VWA2, in a biological sample obtained from a breast cancer subject and/or in a sample.
-
In a final aspect the invention relates to a use of a first gene expression profile for each of one or more, for example, 1, 2, 3, 4, 5, 6, 7, 8, 9, 10, 11, 12, 13 or all, immune defense response genes selected from the group consisting of: AIM2, APOBEC3A, CIAO1, DDX58, DHX9, IFI16, IFIH1, IFIT1, IFIT3, LRRFIP1, MYD88, OAS1, TLR8, and ZBP1, a second gene expression profile for each of one or more, for example, 1, 2, 3, 4, 5, 6, 7, 8, 9, 10, 11, 12, 13, 14, 15, 16 or all, T-Cell receptor signalling genes selected from the group consisting of: CD2, CD247, CD28, CD3E, CD3G, CD4, CSK, EZR, FYN, LAT, LCK, PAG1, PDE4D, PRKACA, PRKACB, PTPRC, and ZAP70, and/or a third gene expression profile for each of one or more, for example, 1, 2, 3, 4, 5, 6, 7 or all, PDE4D7 correlated genes selected from the group consisting of: ABCC5, CUX2, KIAA1549, PDE4D, RAP1GAP2, SLC39A11, TDRD1, and VWA2, in a method of predicting an outcome of a breast cancer subject, comprising determining the prediction of the outcome based on the gene expression levels for the three or more genes, wherein said prediction is a favourable risk or a non-favourable risk of breast-cancer related death, loco-regional recurrence and/or distant recurrence.
BRIEF DESCRIPTION OF THE DRAWINGS
-
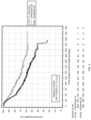
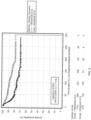
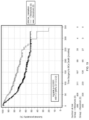
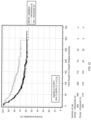
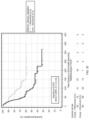
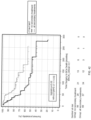
- Fig 1. shows a Kaplan-Meier curve of the IDR_14 model in a 997 patient cohort (training set used to develop the IDR_14 model) with all patients having undergone surgery. The clinical endpoint tested was breast cancer specific death (BCa Death) after surgery. Logrank, HR and confidence interval are included in the figure. The included supplementary lists indicate the number of patients at risk (threshold = 0, low risk (<=0), high risk(>0)) for the IDR_14 model classes analysed, i.e. the patients at risk at any time interval +25 months after surgery are shown.
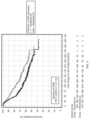
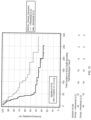
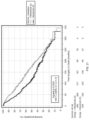
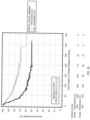
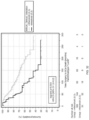
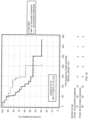
- Fig 2. shows a Kaplan-Meier curve of the TCR_17 model in a 997 patient cohort (training set used to develop the TCR_17 model) with all patients having undergone surgery. The clinical endpoint tested was breast cancer specific death (BCa Death) after surgery. Logrank, HR and confidence interval are included in the figure. The included supplementary lists indicate the number of patients at risk (threshold = 0, low risk (<=0), high risk(>0)) for the TCR_17 model classes analysed, i.e. the patients at risk at any time interval +25 months after surgery are shown.
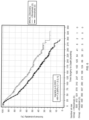
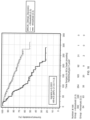
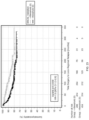
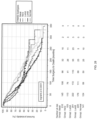
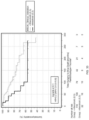
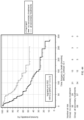
- Fig 3. shows a Kaplan-Meier curve of the PDE4D7_CORR model in a 997 patient cohort (training set used to develop the PDE4D7_CORR model) with all patients having undergone surgery. The clinical endpoint tested was breast cancer specific death (BCa Death) after surgery. Logrank, HR and confidence interval are included in the figure. The included supplementary lists indicate the number of patients at risk (threshold = 0, low risk (<=0), high risk (>0)) for the PDE4D7_CORR model classes analysed, i.e. the patients at risk at any time interval +25 months after surgery are shown.
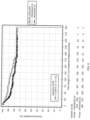
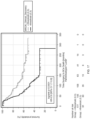
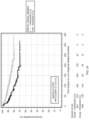
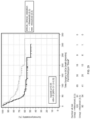
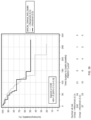
- Fig. 4 shows a Kaplan-Meier curve of the BRCAI_model in a 997 patient cohort (training set used to develop the BRCAI_model) with all patients having undergone surgery. The clinical endpoint tested was breast cancer specific death (BCa Death) after surgery. Logrank, HR and confidence interval are included in the figure. The included supplementary lists indicate the number of patients at risk (threshold = 0, low risk (<=0), high risk (>0)) for the BRCAI_model classes analysed, i.e. the patients at risk at any time interval +25 months after surgery are shown.
- Fig. 5 shows a Kaplan-Meier curve of the BRCAI_clinical_model in a 997 patient cohort (training set used to develop the BRCAI_clinical_model) with all patients having undergone surgery. The clinical endpoint tested was breast cancer specific death (BCa Death) after surgery. Logrank, HR and confidence interval are included in the figure. The included supplementary lists indicate the number of patients at risk (threshold = 0.3, low risk (<=0.3), high risk (>0.3)) for the BRCAI_clinical_model classes analysed, i.e. the patients at risk at any time interval +50 months after surgery are shown.
- Fig. 6 shows a Kaplan-Meier curve of the BRCAI_model in a 997 patient cohort (training set used to develop the BRCAI _model) with all patients having undergone surgery. The clinical endpoint tested was overall death (Death) after surgery. Logrank, HR and confidence interval are included in the figure. The included supplementary lists indicate the number of patients at risk (threshold = 0, low risk (<=0), high risk (>0)) for the BRCAI_model classes analysed, i.e. the patients at risk at any time interval +25 months after surgery are shown.
- Fig. 7 shows a Kaplan-Meier curve of the BRCAI_clinical_model in a 997 patient cohort (training set used to develop the BRCAI_clinical_model) with all patients having undergone surgery. The clinical endpoint tested was overall death (Death) after surgery. Logrank, HR and confidence interval are included in the figure. The included supplementary lists indicate the number of patients at risk (threshold = 0.3, low risk (<=0.3), high risk (>0.3)) for the BRCAI_clinical_model classes analysed, i.e. the patients at risk at any time interval +50 months after surgery are shown.
- Fig. 8 shows a Kaplan-Meier curve of the BRCAI_model in a 997 patient cohort (training set used to develop the BRCAI_model) with all patients having undergone surgery. The clinical endpoint tested was loco-regional relapse after surgery. Logrank, HR and confidence interval are included in the figure. The included supplementary lists indicate the number of patients at risk (threshold = 0, low risk (<=0), high risk (>0)) for the BRCAI_model classes analysed, i.e. the patients at risk at any time interval +25 months after surgery are shown.
- Fig. 9 shows a Kaplan-Meier curve of the BRCAI_clinical_model in a 997 patient cohort (training set used to develop the BRCAI_clinical_model) with all patients having undergone surgery. The clinical endpoint tested was loco-regional relapse after surgery. Logrank, HR and confidence interval are included in the figure. The included supplementary lists indicate the number of patients at risk (threshold = 0.3, low risk (<=0.3), high risk (>0.3)) for the BRCAI_clinical_model classes analysed, i.e. the patients at risk at any time interval +50 months after surgery are shown.
- Fig. 10 shows a Kaplan-Meier curve of the BRCAI_model in a 997 patient cohort (training set used to develop the BRCAI _model) with all patients having undergone surgery. The clinical endpoint tested was distant relapse after surgery. Logrank, HR and confidence interval are included in the figure. The included supplementary lists indicate the number of patients at risk (threshold = 0, low risk (<=0), high risk (>0)) for the BRCAI_model classes analysed, i.e. the patients at risk at any time interval +25 months after surgery are shown.
- Fig. 11 shows a Kaplan-Meier curve of the BRCAI_clinical_model in a 997 patient cohort (training set used to develop the BRCAI_clinical_model) with all patients having undergone surgery. The clinical endpoint tested was distant relapse after surgery. Logrank, HR and confidence interval are included in the figure. The included supplementary lists indicate the number of patients at risk (threshold = 0.3, low risk (<=0.3), high risk (>0.3)) for the BRCAI_clinical_model classes analysed, i.e. the patients at risk at any time interval +50 months after surgery are shown.
- Fig. 12 shows a Kaplan-Meier curve of the PAM50 subtypes model in a 997 patient cohort (training set) with all patients having undergone surgery. The clinical endpoint tested was breast cancer specific death (BCa Death). The Logrank is included in the figure. The included supplementary lists indicate the number of patients at risk of the groups Basal, Her2, LumA, LumB and Normal for the PAM50 subtypes analysed, i.e. the patients at risk at any time interval +25 months after surgery are shown.
- Fig. 13 shows a Kaplan-Meier curve of the PAM50 subtypes model in a 997 patient cohort (training set) with all patients having undergone surgery. The clinical endpoint tested was overall death (Death). The logrank is included in the figure. The included supplementary lists indicate the number of patients at risk of the groups Basal, Her2, LumA, LumB and Normal for the PAM50 subtypes analysed, i.e. the patients at risk at any time interval +25 months after surgery are shown.
- Fig. 14 shows a Kaplan-Meier curve of the BRCAI_clinical_model in a 118 PAM50 Basal subtype patient cohort with all patients having undergone surgery. The clinical endpoint tested was breast cancer specific death (BCa Death) after surgery. Logrank, HR and confidence interval are included in the figure. The included supplementary lists indicate the number of patients at risk (threshold = 0.3, low risk (<=0.3), high risk (>0.3)) for the BRCAI_clinical_model classes analysed, i.e. the patients at risk at any time interval +50 months after surgery are shown.
- Fig. 15 shows a Kaplan-Meier curve of the BRCAI_clinical_model in an 87 PAM50 Her2 subtype patient cohort with all patients having undergone surgery. The clinical endpoint tested was breast cancer specific death (BCa Death) after surgery. Logrank, HR and confidence interval are included in the figure. The included supplementary lists indicate the number of patients at risk (threshold = 0.3, low risk (<=0.3), high risk (>0.3)) for the BRCAI_clinical_model classes analysed, i.e. the patients at risk at any time interval +50 months after surgery are shown.
- Fig. 16 shows a Kaplan-Meier curve of the BRCAI_clinical_model in a 466 PAM50 LumA subtype patient cohort with all patients having undergone surgery. The clinical endpoint tested was breast cancer specific death (BCa Death) after surgery. Logrank, HR and confidence interval are included in the figure. The included supplementary lists indicate the number of patients at risk (threshold = 0.3, low risk (<=0.3), high risk (>0.3)) for the BRCAI_clinical_model classes analysed, i.e. the patients at risk at any time interval +50 months after surgery are shown.
- Fig. 17 shows a Kaplan-Meier curve of the BRCAI_clinical_model in a 268 PAM50 LumB subtype patient cohort with all patients having undergone surgery. The clinical endpoint tested was breast cancer specific death (BCa Death) after surgery. Logrank, HR and confidence interval are included in the figure. The included supplementary lists indicate the number of patients at risk (threshold = 0.3, low risk (<=0.3), high risk (>0.3)) for the BRCAI_clinical_model classes analysed, i.e. the patients at risk at any time interval +50 months after surgery are shown.
- Fig. 18 shows a Kaplan-Meier curve of the BRCAI_clinical_model in a 58 PAM50 Normal subtype patient cohort with all patients having undergone surgery. The clinical endpoint tested was breast cancer specific death (BCa Death) after surgery. Logrank, HR and confidence interval are included in the figure. The included supplementary lists indicate the number of patients at risk (threshold = 0.3, low risk (<=0.3), high risk (>0.3)) for the BRCAI_clinical_model classes analysed, i.e. the patients at risk at any time interval +50 months after surgery are shown.
- Fig. 19 shows a Kaplan-Meier curve of the BRCAI_model in a 953 patient cohort (validation set used to validate the BRCAI _model) with all patients having undergone surgery. The clinical endpoint tested was breast cancer specific death (BCa Death) after surgery. Logrank, HR and confidence interval are included in the figure. The included supplementary lists indicate the number of patients at risk (threshold = 0, low risk (<=0), high risk (>0)) for the BRCAI_model classes analysed, i.e. the patients at risk at any time interval +50 months after surgery are shown.
- Fig. 20 shows a Kaplan-Meier curve of the BRCAI_clinical_model in a 953 patient cohort (validation set used to validate the BRCAI_clinical_model) with all patients having undergone surgery. The clinical endpoint tested was breast cancer specific death (BCa Death) after surgery. Logrank, HR and confidence interval are included in the figure. The included supplementary lists indicate the number of patients at risk (threshold = 0.3, low risk (<=0.3), high risk (>0.3)) for the BRCAI_clinical_model classes analysed, i.e. the patients at risk at any time interval +50 months after surgery are shown.
- Fig. 21 shows a Kaplan-Meier curve of the BRCAI_model in a 953 patient cohort (validation set used to validate the BRCAI_model) with all patients having undergone surgery. The clinical endpoint tested was overall death (Death) after surgery. Logrank, HR and confidence interval are included in the figure. The included supplementary lists indicate the number of patients at risk (threshold = 0, low risk (<=0), high risk (>0)) for the BRCAI_model classes analysed, i.e. the patients at risk at any time interval +50 months after surgery are shown.
- Fig. 22 shows a Kaplan-Meier curve of the BRCAI_clinical_model in a 953 patient cohort (validation set used to validate the BRCAI_clinical_model) with all patients having undergone surgery. The clinical endpoint tested was overall death (Death) after surgery. Logrank, HR and confidence interval are included in the figure. The included supplementary lists indicate the number of patients at risk (threshold = 0.3, low risk (<=0.3), high risk (>0.3)) for the BRCAI_clinical_model classes analysed, i.e. the patients at risk at any time interval +50 months after surgery are shown.
- Fig. 23 shows a Kaplan-Meier curve of the BRCAI_model in a 950 patient cohort (validation set used to validate the BRCAI _model) with all patients having undergone surgery. The clinical endpoint tested was logo-regional relapse after surgery. Logrank, HR and confidence interval are included in the figure. The included supplementary lists indicate the number of patients at risk (threshold = 0, low risk (<=0), high risk (>0)) for the BRCAI_model classes analysed, i.e. the patients at risk at any time interval +50 months after surgery are shown.
- Fig. 24 shows a Kaplan-Meier curve of the BRCAI_clinical_model in a 950 patient cohort (validation set used to validate the BRCAI_clinical_model) with all patients having undergone surgery. The clinical endpoint tested was logo-regional relapse after surgery. Logrank, HR and confidence interval are included in the figure. The included supplementary lists indicate the number of patients at risk (threshold = 0.3, low risk (<=0.3), high risk (>0.3)) for the BRCAI_clinical_model classes analysed, i.e. the patients at risk at any time interval +50 months after surgery are shown.
- Fig. 25 shows a Kaplan-Meier curve of the BRCAI_model in a 953 patient cohort (validation set used to validate the BRCAI _model) with all patients having undergone surgery. The clinical endpoint tested was distant relapse after surgery. Logrank, HR and confidence interval are included in the figure. The included supplementary lists indicate the number of patients at risk (threshold = 0, low risk (<=0), high risk (>0)) for the BRCAI_model classes analysed, i.e. the patients at risk at any time interval +50 months after surgery are shown.
- Fig. 26 shows a Kaplan-Meier curve of the BRCAI_clinical_model in a 953 patient cohort (validation set used to validate the BRCAI_clinical_model) with all patients having undergone surgery. The clinical endpoint tested was distant relapse after surgery. Logrank, HR and confidence interval are included in the figure. The included supplementary lists indicate the number of patients at risk (threshold = 0.3, low risk (<=0.3), high risk (>0.3)) for the BRCAI_clinical_model classes analysed, i.e. the patients at risk at any time interval +50 months after surgery are shown.
- Fig. 27 shows a Kaplan-Meier curve of the PAM50 subtypes model in a 975 patient cohort (validation set) with all patients having undergone surgery. The clinical endpoint tested was breast cancer related death (BCa Death). The logrank is included in the figure. The included supplementary lists indicate the number of patients at risk of the groups Basal, Her2, LumA, LumB and Normal for the PAM50 subtypes analysed, i.e. the patients at risk at any time interval +50 months after surgery are shown.
- Fig. 28 shows a Kaplan-Meier curve of the PAM50 subtypes model in a 975 patient cohort (validation set) with all patients having undergone surgery. The clinical endpoint tested was overall death (Death). The logrank is included in the figure. The included supplementary lists indicate the number of patients at risk of the groups Basal, Her2, LumA, LumB and Normal for the PAM50 subtypes analysed, i.e. the patients at risk at any time interval +50 months after surgery are shown.
- Fig. 29 shows a Kaplan-Meier curve of the BRCAI_clinical_model in a 210 PAM50 Basal subtype patient cohort with all patients having undergone surgery. The clinical endpoint tested was breast cancer specific death (BCa Death) after surgery. Logrank, HR and confidence interval are included in the figure. The included supplementary lists indicate the number of patients at risk (threshold = 0.3, low risk (<=0.3), high risk (>0.3)) for the BRCAI_clinical_model classes analysed, i.e. the patients at risk at any time interval +50 months after surgery are shown.
- Fig. 30 shows a Kaplan-Meier curve of the BRCAI_clinical_model in a 153 PAM50 Her2 subtype patient cohort with all patients having undergone surgery. The clinical endpoint tested was breast cancer specific death (BCa Death) after surgery. Logrank, HR and confidence interval are included in the figure. The included supplementary lists indicate the number of patients at risk (threshold = 0.3, low risk (<=0.3), high risk (>0.3)) for the BRCAI_clinical_model classes analysed, i.e. the patients at risk at any time interval +50 months after surgery are shown.
- Fig. 31 shows a Kaplan-Meier curve of the BRCAI_clinical_model in a 251 PAM50 LumA subtype patient cohort with all patients having undergone surgery. The clinical endpoint tested was breast cancer specific death (BCa Death) after surgery. Logrank, HR and confidence interval are included in the figure. The included supplementary lists indicate the number of patients at risk (threshold = 0.3, low risk (<=0.3), high risk (>0.3)) for the BRCAI_clinical_model classes analysed, i.e. the patients at risk at any time interval +50 months after surgery are shown.
- Fig. 32 shows a Kaplan-Meier curve of the BRCAI_clinical_model in a 220 PAM50 LumB subtype patient cohort with all patients having undergone surgery. The clinical endpoint tested was breast cancer specific death (BCa Death) after surgery. Logrank, HR and confidence interval are included in the figure. The included supplementary lists indicate the number of patients at risk (threshold = 0.3, low risk (<=0.3), high risk (>0.3)) for the BRCAI_clinical_model classes analysed, i.e. the patients at risk at any time interval +50 months after surgery are shown.
- Fig. 33 shows a Kaplan-Meier curve of the BRCAI_clinical_model in a 141 PAM50 Normal subtype patient cohort with all patients having undergone surgery. The clinical endpoint tested was breast cancer specific death (BCa Death) after surgery. Logrank, HR and confidence interval are included in the figure. The included supplementary lists indicate the number of patients at risk (threshold = 0.3, low risk (<=0.3), high risk (>0.3)) for the BRCAI_clinical_model classes analysed, i.e. the patients at risk at any time interval +50 months after surgery are shown.
- Fig. 34 shows a Kaplan-Meier curve of the BRCAI_MB model in a 673 patient cohort (validation set used to validate the BRCAI_MB model) with all patients having undergone surgery. The clinical endpoint tested was overall death (Death) after surgery. Logrank, HR and confidence interval are included in the figure. The included supplementary lists indicate the number of patients at risk (threshold = 0.3, low risk (<=0.3), high risk (>0.3)) for the BRCAI_model classes analysed, i.e. the patients at risk at any time interval +50 months after surgery are shown.
- Fig. 35 shows a Kaplan-Meier curve of the BRCAI_clinical_MB model in a 563 patient cohort (validation set used to validate the BRCAI_clinical_MB model) with all patients having undergone surgery. The clinical endpoint tested was overall death (Death) after surgery. Logrank, HR and confidence interval are included in the figure. The included supplementary lists indicate the number of patients at risk (threshold = 0.3, low risk (<=0.3), high risk (>0.3)) for the BRCAI_model classes analysed, i.e. the patients at risk at any time interval +50 months after surgery are shown.
- Fig. 36 shows a Kaplan-Meier curve of the PAM50 subtypes model in a 563 patient cohort (training set) with all patients having undergone surgery. The clinical endpoint tested was overall death (Death). The logrank is included in the figure. The included supplementary lists indicate the number of patients at risk of the groups Basal, Her2, LumA, LumB and Normal for the PAM50 subtypes analysed, i.e. the patients at risk at any time interval +50 months after surgery are shown.
- Fig. 37 shows a Kaplan-Meier curve of the BRCAI_clinical_MB model in a 116 PAM50 Basal subtype patient cohort with all patients having undergone surgery. The clinical endpoint tested was overall death (Death) after surgery. Logrank, HR and confidence interval are included in the figure. The included supplementary lists indicate the number of patients at risk (threshold = 0.3, low risk (<=0.3), high risk (>0.3)) for the BRCAI_clinical_model classes analysed, i.e. the patients at risk at any time interval +50 months after surgery are shown.
- Fig. 38 shows a Kaplan-Meier curve of the BRCAI_clinical_MB model in a 36 PAM50 Her2 subtype patient cohort with all patients having undergone surgery. The clinical endpoint tested was overall death (Death) after surgery. Logrank, HR and confidence interval are included in the figure. The included supplementary lists indicate the number of patients at risk (threshold = 0.3, low risk (<=0.3), high risk (>0.3)) for the BRCAI_clinical_model classes analysed, i.e. the patients at risk at any time interval +50 months after surgery are shown.
- Fig. 39 shows a Kaplan-Meier curve of the BRCAI_clinical_MB model in a 305 PAM50 LumA subtype patient cohort with all patients having undergone surgery. The clinical endpoint tested was overall death (Death) after surgery. Logrank, HR and confidence interval are included in the figure. The included supplementary lists indicate the number of patients at risk (threshold = 0.3, low risk (<=0.3), high risk (>0.3)) for the BRCAI_clinical_model classes analysed, i.e. the patients at risk at any time interval +50 months after surgery are shown.
- Fig. 40 shows a Kaplan-Meier curve of the BRCAI_clinical_MB model in a 106 PAM50 LumB subtype patient cohort with all patients having undergone surgery. The clinical endpoint tested was overall death (Death) after surgery. Logrank, HR and confidence interval are included in the figure. The included supplementary lists indicate the number of patients at risk (threshold = 0.3, low risk (<=0.3), high risk (>0.3)) for the BRCAI_clinical_model classes analysed, i.e. the patients at risk at any time interval +20 months after surgery are shown.
- Fig. 41 shows a Kaplan-Meier curve of the CT&HT&RT model in a 60 BRCAI_clinical low risk patient cohort with all patients having undergone surgery. The clinical endpoint tested was breast cancer specific death (BCa Death) after surgery. Logrank, HR and confidence interval are included in the figure. The included supplementary lists indicate the number of patients at risk (no secondary treatment, all secondary treatment) for the CT&HT&RT model classes analysed, i.e. the patients at risk at any time interval +50 months after surgery are shown.
- Fig. 42 shows a Kaplan-Meier curve of the CT&HT&RT model in a 125 BRCAI_clinical high risk patient cohort with all patients having undergone surgery. The clinical endpoint tested was breast cancer specific death (BCa Death) after surgery. Logrank, HR and confidence interval are included in the figure. The included supplementary lists indicate the number of patients at risk (no secondary treatment, all secondary treatment) for the CT&HT&RT model classes analysed, i.e. the patients at risk at any time interval +50 months after surgery are shown.
- Fig. 43 shows a Kaplan-Meier curve of the CT&HT&RT model in a 60 BRCAI_clinical low risk patient cohort with all patients having undergone surgery. The clinical endpoint tested was overall death (Death) after surgery. Logrank, HR and confidence interval are included in the figure. The included supplementary lists indicate the number of patients at risk (no secondary treatment, all secondary treatment) for the CT&HT&RT model classes analysed, i.e. the patients at risk at any time interval +50 months after surgery are shown.
- Fig. 44 shows a Kaplan-Meier curve of the CT&HT&RT model in a 125 BRCAI_clinical high risk patient cohort with all patients having undergone surgery. The clinical endpoint tested was overall death (Death) after surgery. Logrank, HR and confidence interval are included in the figure. The included supplementary lists indicate the number of patients at risk (no secondary treatment, all secondary treatment) for the CT&HT&RT model classes analysed, i.e. the patients at risk at any time interval +50 months after surgery are shown.
DEFINITIONS
-
As used herein the indefinite term "a" or "an" does not exclude a plurality.
-
The term "biological sample" or "sample obtained from a subject" refers to any biological material obtained via suitable methods known to the person skilled in the art from a subject, e.g. a breast cancer subject.
-
As used herein, the term "and/or" indicates that one or more of the stated cases may occur, alone or in combination with at least one of the stated cases, up to with all of the stated cases. As used herein, the term "at least" a particular value means that particular value or more. For example, "at least 2" is understood to be the same as "2 or more" i.e.. 2, 3, 4, 5, 6, 7, 8, 9, 10, 11, 12, 13, 14, 15, ..., etc.
-
The term "breast cancer" refers to a cancer of the breast tissue, which occurs when cells in the breast mutate and begin to grow out of control.
-
The term "breast cancer specific death or disease specific death" refers to death of a patient from a breast cancer.
-
The term "clinical recurrence" refers to the presence of clinical signs indicating the presence of tumour cells as measured, for example using in vivo imaging.
-
As used herein, the word "comprise" or variations thereof such as "comprises" or "comprising" will be understood to include a stated element, integer or step, or group of elements, integers or steps, but not to exclude any other element, integer or steps, or groups of elements, integers or steps. The verb "comprising" includes the verbs "essentially consisting of" and "consisting of".
-
When used herein, the term "immune defense response genes" is interchangeably used with "IDR genes" or "immune defense genes" refers to one or more of the genes selected from AIM2, APOBEC3A, CIAO1, DDX58, DHX9, IFI16, IFIH1, IFIT1, IFIT3, LRRFIP1, MYD88, OAS1, TLR8, and ZBP1.
-
The term "metastases" refers to the presence of metastatic disease in organs other than a breast tissue.
-
When used herein, the term "PDE4D7 correlated genes" is interchangeably used with "PDE4D7 genes" refers to one or more of the genes selected from: ABCC5, CUX2, KIAA1549, PDE4D, RAP1GAP2, SLC39A11, TDRD1, and VWA2.
-
When used herein, the term "T-cell receptor signalling genes" is interchangeably used with "TCR signalling genes" or "TCR genes" refers to one or more of the genes selected from: CD2, CD247, CD28, CD3E, CD3G, CD4, CSK, EZR, FYN, LAT, LCK, PAG1, PDE4D, PRKACA, PRKACB, PTPRC, and ZAP70.
DETAILED DESCRIPTION OF THE INVENTION
Immune system in cancer
-
In recent years, the importance of the immune system in cancer inhibition as well as in cancer initiation, promotion and metastasis has become very evident (Mantovani et al. Nature. 454(7203):436-44 (2008); Giraldo et al. Br J Cancer. 120(1):45-53 (2019)). The immune cells and the molecules they secrete form a crucial part of the tumour microenvironment and most immune cells can infiltrate the tumour tissue. The immune system and the tumour affect and shape one another. Thus, antitumour immunity can prevent tumour formation while an inflammatory tumour environment may promote cancer initiation and proliferation. At the same time, tumour cells that may have originated in an immune system-independent manner will shape the immune microenvironment by recruiting immune cells and can have a pro-inflammatory effect while also suppressing anti-cancer immunity.
-
Some of the immune cells in the tumour microenvironment will have either a general tumour-promoting or a general tumour-inhibiting effect, while other immune cells exhibit plasticity and show both tumour-promoting and tumour-inhibiting potential. Thus, the overall immune microenvironment of the tumour is a mixture of the various immune cells present, the cytokines they produce and their interactions with tumour cells and with other cells in the tumour microenvironment (Giraldo Br J Cancer. 120(1):45-53 (2019)).
-
While a therapy will be influenced by the immune components of the tumour microenvironment, RT itself extensively affects the make-up of these components. Because suppressive cell types are comparably radiation-insensitive, their relative numbers will increase. Counteractively, the inflicted radiation damage activates cell survival pathways and stimulates the immune system, triggering inflammatory responses and immune cell recruitment. Whether the net effect will be tumour-promoting or tumour-suppressing is yet uncertain, but its potential for enhancement of cancer immunotherapies is being investigated.
-
In summary, the status of the immune system and of the immune microenvironment have an impact on therapy effectiveness.
-
The inventors have identified gene signatures, and combination of these signatures with clinical parameters, of which the resulting models show a significant relation to mortality and therefore are expected to improve the prediction of the effectiveness of these treatments.
Immune response defense genes
-
The integrity and stability of genomic DNA is permanently under stress induced by various cell internal and external factors like exposure to radiation, viral or bacterial infections, but also oxidation and replication stress (see
Gasser S. et al. "Sensing of dangerous DNA", Mechanisms of Aging and Development, Vol. 165, pages 33-46, 2017). In order to maintain DNA structure and stability, a cell must be able to recognize all types of DNA damages like single or double strand breaks etc. induced by various factors. This process involves the participation of a multitude of specific proteins depending on the kind of damage as part of DNA recognition pathways.
-
Recent evidence suggests that mis-localized DNA (e.g. DNA unnaturally appearing in the cytosolic fraction of the cell in contrast to the nucleus) and damaged DNA (e.g. through mutations occurring in cancer development) is used by the immune system to identify infected or otherwise diseased cells while genomic and mitochondrial DNA present in healthy cells is ignored by DNA recognition pathways. In diseased cells, cytosolic DNA sensor proteins have been demonstrated to be involved in the detection of DNA occurring unnaturally in the cytosol of the cell. Detection of such DNA by different nucleic acid sensors translates into similar responses leading to nuclear factor kappa-B (NF-kB) and interferon type I (IFN type I) signalling followed by the activation of innate immune system components. While the recognition of viral DNA is known to induce an IFN type I response, evidence that sensing of DNA damage can initiate immune responses has only recently been accumulating.
-
TLR9 (Toll-like receptor 9) located in the endosomes was one of the first DNA sensors molecules identified to be involved in the immune recognition of DNA by signalling downstream via the adaptor protein myeloid differentiation primary-response protein88 (MYD88). This interaction in turn activates mitogen-activated protein kinases (MAPKs) and NF-kB. TLR9 also induces the generation of type I interferons through the activation of IRF7 via IkB Kinase alpha (IKKalpha) in plasmacytoid dendritic cells (pDCs). Various other DNA immune receptors including IFI16 (IFN-gamma-inducible protein 16), cGAS (cyclic DMP-AMP synthase, DDX41 (DEAD-box helicase 41), as well as ZBP1 (Z-DNA-binding protein 1) interact with STING (stimulator of IFN genes), which activates the IKK complex and IRF3 through TBK1 (TANK binding kinase 1). ZBP1 also activates NF-kB via recruitment of RIP1 and RIP3 (receptor-interacting protein 1 and 3, respectively). While the helicase DHX36 (DEAH-box helicase 36) interacts in a complex with TRID to induce NF-kB and IRF-3/7 the DHX9 helicase stimulates MYD88-dependent signalling in plasmacytoid dendritic cells. The DNA sensor LRRFIP1 (leucine-rich repeat flightless-interacting protein) complexes with beta-catenin to activate the transcription of IRF3 whereas AIM2 (absent in melanoma 2) recruits the adaptor protein ASC (apoptosis speck-like protein) to induce a caspase-1-activating inflammasome complex leading to the secretion of interleukin-lbeta (IL-1beta) and IL-18 (see Fig. 1 of Gasser S. et al., 2017, ibid, which provides a schematic overview of DNA damage and DNA sensor pathways leading to the production of inflammatory cytokines and the expression of ligands for activating innate immune receptors. Members of the non-homologous end joining pathway (orange), homologous recombination (red), inflammasome (dark green), NF- kB and interferon responses (light green) are shown).
-
The factors and mechanisms responsible for activating the DNA sensor pathways in cancer are currently not well elucidated. It will be important to identify the intratumoural DNA species, sensors and pathways implicated in the expression of IFNs in different cancer types at all stages of the disease. In addition to therapeutic targets in cancer, such factors may also have prognostic and predictive value. Novel DNA sensor pathway agonists and antagonists are currently being developed and tested in preclinical trials. Such compounds will be useful in characterizing the role of DNA sensor pathways in the pathogenesis of cancer, autoimmunity and potentially other diseases.
T-Cell receptor signalling genes
-
An immune response against pathogens can be elicited at different levels: there are physical barriers, such as the skin, to keep invaders out. If breached, innate immunity comes into play; a first and fast non-specific response. If this is not sufficient, the adaptive immune response is elicited. This is much more specific and needs time to develop when encountering a pathogen for the first time. Lymphocytes are activated by interacting with activated antigen presenting cells from the innate immune system and are also responsible for maintenance of memory for faster responses upon next encounters with the same pathogen.
-
As lymphocytes are highly specific and effective when activated, they are subject to negative selection for their ability to recognize self, a process known as central tolerance. As not all self-antigens are expressed at selection sites, peripheral tolerance mechanisms evolved as well, such as ligation of the TCR in absence of co-stimulation, expression of inhibitory co-receptors, and suppression by Tregs. A disturbed balance between activation and suppression may lead to autoimmune disorders, or immune deficiencies and cancer, respectively.
-
T-cell activation can have different functional consequences, depending on the location the type of T-cell involved. CD8+ T-cells differentiate into cytotoxic effector cells, whereas CD4+ T-cells can differentiate into Th1 (IFNγ secretion and promotion of cell mediated immunity) or Th2 (IL4/5/13 secretion and promotion of B cell and humoral immunity). Differentiation towards other, more recently identified T-cell subsets is also possible, for example the Tregs, which have a suppressive effect on immune activation (see
Mosenden R. and Tasken K., "Cyclic AMP-mediated immune regulation - Overview of mechanisms of action in T-cells", Cell Signal, Vol. 23, No. 6, pages 1009-1016 (2011), in particular,
Fig. 4, which T-cell activation and its modulation by PKA, and
Tasken K. and Ruppelt A., "Negative regulation of T-cell receptor activation by the cAMP-PKA-Csk signalling pathway in T-cell lipid rafts", Front Biosci, Vol. 11, pages 2929-2939 (2006)).
-
T cell activation can take place in naive and differentiated T cells. On a molecular level, the events following the ligation of the TCR with cognate antigen, and crosstalk with signalling induced by co-stimulatory and co-inhibitory receptors determine whether the T cell will become activated or if it will become anergic. Just triggering the TCR itself is not enough, this leads to T cell anergy. The B7:CD28 family of co-stimulatory molecules plays a central role in controlling the activation status of T cells upon antigenic stimulation (
Torheim E.A., "Immunity Leashed - Mechanisms of Regulation in the Human Immune System", Thesis for the degree of Philosophiae Doctor (PhD), The Biotechnology Centre of Ola, University of Oslo, Norway, 2009).
-
Activation occurs upon interaction of the TCR on the surface of the T cell with MHC-peptide complexes on APCs or target cells (Figure 2). An immunological synapse is formed, lipid rafts in the T cell membrane coalesce and Lck and Fyn are activated. These molecules phosphorylate ITAMs in the CD3 subunits of the TCR, which facilitates recruitment of Zap-70 in proximation with Lck. Lck phosphorylates and activates Zap-70, which in turn then phosphorylates LAT, SLP76, and PLCγ1. LAT is a docking site for other signalling molecules and is essential for downstream TCR signalling. Grb2, Gads, PI3K and NCK are recruited to LAT, propagating signalling involving activation of RAS, PKC, mobilization of Ca2+, calcineurin and polymerization of the actin cytoskeleton (Tasken et al. Front in Bioscience 11:2929-2939 (2006)). This eventually leads to activation of transcription factors of the NFkB, NFAT, API, and ATF families, resulting in transcription of genes for immune activation (Mosenden et al. Cell Signalling 23:1009-1016 (2011); Tasken et al. Front in Bioscience 11:2929-2939 (2006)).
-
Both PKA and PDE4 regulated signalling intersect with TCR induced T-cell activation to fine-tune its regulation, with opposing effects (see Abrahamsen H. et al., "TCR- and CD28-mediated recruitment of ), in particular, Fig. 6, which shows opposing effects of PKA and PDE4 on TCR activation). The molecule that connects these effectors is cyclic AMP (cAMP), an intracellular second messenger of extracellular ligand action. In T-cells, it mediates effects of prostaglandins, adenosine, histamine, beta-adrenergic agonists, neuropeptide hormones and beta-endorphin. Binding of these extracellular molecules to GPCRs leads to their conformational change, release of stimulatory subunits and subsequent activation of adenylate cyclases (AC), which hydrolyse ATP to cAMP (see Fig. 6 of Abrahamsen H. et al., 2004, ibid). Although not the only one, PKA is the principal effector of cAMP signalling (see Mosenden R. and Tasken K., 2011, ibid, and Tasken K. and Ruppelt A., 2006, ibid). At a functional level, increased levels of cAMP lead to reduced IFNγ and IL-2 production in T-cells (see Abrahamsen H. et al., 2004, ibid). Aside from interfering with TCR activation, PKA has many more effectors (see Fig. 15 of Torheim E.A., 2009, ibid).
-
In naive T-cells, hyperphosphorylated PAG targets Csk to lipid rafts. Via the Ezrin-EBP50-PAG scaffold complex PKA is targeted to Csk. Through specific phosphorylation by PKA, Csk can negatively regulate Lck and Fyn to dampen their activity and downregulate T-cell activation (see Fig. 6 of Abrahamsen H. et al., 2004, ibid). Upon TCR activation, PAG is dephosphorylated and Csk is released from the rafts. Dissociation of Csk is needed for T-cell activation to proceed. Within the same time course, a Csk-G3BP complex is formed and seems to sequester Csk outside lipid rafts (see Mosenden R. and Tasken K., 2011, ibid, and Tasken K. and Ruppelt A., 2006, ibid).
-
In contrast, combined TCR and CD28 stimulation mediates recruitment of the cyclic nucleotide phosphodiesterase PDE4 to lipid rafts, which enhances cAMP degradation (see Fig. 6 of Abrahamsen H. et al., 2004, ibid). As such, TCR induced production of cAMP is countered, and the T-cell immune response potentiated. Upon TCR stimulation alone, PDE4 recruitment may be too low to fully reduce the cAMP levels and therefore maximal T-cell activation cannot occur (see Abrahamsen H. et al., 2004, ibid).
-
Thus, by active suppression of proximal TCR signalling, signalling via cAMP-PKA-Csk is thought to set the threshold for T-cell activation. Recruitment of PDEs can counter this suppression. Tissue or cell-type specific regulation is accomplished through expression of multiple isoforms of AC, PKA, and PDEs. As mentioned above, the balance between activation and suppression needs to be tightly regulated to prevent development of autoimmune disorders, immune deficiencies and cancer.
PDE4D7 correlated genes
-
Phosphodiesterases (PDEs) provide the sole means for the degradation of the second messenger 3'-5'-cyclic AMP. As such they are poised to provide a key regulatory role. Thus, aberrant changes in their expression, activity and intracellular location may all contribute to the underlying molecular pathology of particular disease states. Indeed, it has recently been shown that mutations in PDE genes are enriched in prostate cancer patients leading to elevated cAMP signalling and a potential predisposition to prostate cancer. However, varied expression profiles in different cell types coupled with complex arrays of isoform variants within each PDE family makes understanding the links between aberrant changes in PDE expression and functionality during disease progression challenging. Several studies have endeavoured to describe the complement of PDEs in prostate, all of which identified significant levels of PDE4 expression alongside other PDEs, leading to the development of a PDE4D7 biomarker (see
Alves de Inda M. et al., "Validation of Cyclic Adenosine Monophosphate Phosphodiesterase-4D7 for its Independent Contribution to Risk Stratification in a Prostate Cancer Patient Cohort with Longitudinal Biological Outcomes", Eur Urol Focus, Vol. 4, No. 3, pages 376-384, 2018). Since the PDE4D7 biomarker has been proven to be a good predictor, it was assumed that the ability to identify markers that are highly correlated with the PDE47 biomarker might also be helpful in prognosticating the outcome of certain cancer subjects.
-
Based on the correlation between PDE4D7 expression and pathological features of the disease, the defined aim was to identify prognostic associations between the expression of PDE4D7 in a patient prostate tissue, collected by either biopsy or surgery, and clinically useful information relevant to the outcome of individual patients. Clinically relevant endpoints, or surrogate endpoints that are significantly correlated to the development of metastases, cancer specific or overall mortality have, typically, been evaluated as prognostic cancer biomarkers. The most relevant rational for using a surrogate endpoint relates to situations where either data on established clinical endpoints are not available or when the number of events in the data cohort is too limited for statistical data analysis. For the development of the PDE4D7 prognostic biomarker either BCR (biochemical relapse) progression-free survival or start of post-surgical secondary treatment were evaluated as surrogate endpoints for metastases and prostate cancer death. Using these particular endpoints, a relevant number of events in the selected clinical cohorts (e.g., >30% for BCR) were identified, which is particularly relevant for multivariable data analysis.
-
In the performed evaluation, standard methods of multivariable analysis such as Cox regression and Kaplan-Meier survival analysis were selected in order to investigate the added and independent value of the continuous and/or the categorical 'PDE4D7 score' compared to established prognostic clinical variables such as PSA and Gleason score (Alves de Inda, 2018). Risk models were built wherein the 'PDE4D7 score' was combined with either pre- or post-surgical clinical predictors of post-surgical progression using logistic regression. The resulting models were subsequently tested on multiple independent patient cohorts in Kaplan-Meier survival and ROC curve analysis in order to predict post-treatment progression free survival (Alves de Inda, 2018).
-
Using such a strategy, the prognostic value of the PDE4D7 score on a biopsy from retrospectively collected, resected prostate tissue in a consecutively managed patient cohort from a single surgery center in a post-surgical setting (Alves de Inda, 2018) was tested. The patient population comprised some 500 individuals where longitudinal follow-up, of both pathology and biological outcomes, was undertaken. These clinical data were available for all patients and collected during a follow-up of a median 120 months after treatment. The 'PDE4D7 score' was determined as described above and then tested in both uni- and multivariable analyses using the available post-surgical co-variates (i.e. pathology Gleason score, pT stage, surgical margin status, seminal vesicle invasion status, and lymph node invasion status) in order to adjust for the multivariable setting. In this instance, biochemical progression-free survival after primary intervention was set as the evaluated clinical endpoint. The univariable analysis of these clinical samples (Alves de Inda, 2018), showing the inverse association between PDE4D7 expression (in terms of 'PDE4D7 score') and post-surgical biological relapse (HR=0.53 per unit change; 95% CI 0.41-0.67; p<0.0001), robustly confirmed previous data (Boettcher 2015; Boettcher, 2016). In multivariable analysis with such clinical variables, the 'PDE4D7 score' remained as an independent and effective means for predicting clinical outcome (HR=0.56 per unit change; 95% CI 0.43-0.73; p<0.0001). Furthermore, a very similar outcome was obtained when the 'PDE4D7 score' in multivariable analysis (HR=0.54 95% CI 0.42-0.69; p<0.0001) with the validated and clinically-used risk model CAPRA-S was evaluated. The CAPRA-S score, which is based on pre-operative PSA and pathologic parameters determined at the time of surgery, was developed to provide clinicians with information aimed to help predict disease recurrence, including BCR, systemic progression, and PCSM and has been validated in US and other populations.
-
Interestingly, when assessing the hazard ratio (HR) compared to the continuous 'PDE4D7 score' a linear increase in risk with decreasing 'PDE4D7 score' for score values lying between 2 and 5 was uncovered. However, at PDE4D7 scores less than 2, then the risk of post-surgical progression increases steeply (Alves de Inda, 2018). This is also evident in the Kaplan-Meier survival curves where patients that are grouped within the lowest 'PDE4D7 scores' category exhibit the highest risk of disease recurrence. Using logistic regression analysis, the CAPRA-S score was combined with the continuous 'PDE4D7 score'. Testing this model using ROC curve analysis a 4-6% significant improvement in AUC was noticed when compared to the CAPRA-S alone for both 2- and 5-year predictions of post-treatment progression to BCR. Thus, a combined CAPRA-S & 'PDE4D7 score' Cox regression combination model was evaluated in Kaplan-Meier survival analysis and compared this to the CAPRA-S score categories alone. Undertaking this, it was confirmed that the added value in risk prediction when using a model, the combined 'PDE4D7 & CAPRA-S' score, compared to using the clinical metric of CAPRA-S score alone (Alves de Inda, 2018).
-
Subsequent to the diagnosis of prostate cancer, an accurate risk assessment needs to be undertaken before stratification to a defined primary treatment. With this in mind, it was tested whether it was possible to translate the prognostic use of the 'PDE4D7 score' in a pre-surgery situation testing tumour tissue obtained from diagnostic needle biopsy samples (van Strijp 2018). In this, needle biopsies were performed on 168 patients, from a single diagnostic clinical centre, who had undergone surgery as a primary treatment. The minimum follow-up period for each patient was 60 months after this intervention. The clinical co-variates used to adjust the 'PDE4D7 score' in the multivariable analysis were age at surgery, pre-operative PSA, PSA density, biopsy Gleason score, percentage of tumour positive biopsy cores, percentage of tumour in the biopsy and clinical cT stage. In this the utility of the 'PDE4D7 score' and the combined 'PDE4D7 & CAPRA' scores compared to the pre-surgical CAPRA score in Cox regression analysis for biochemical relapse (van Strijp 2018) were evaluated.
-
Evaluating this patient cohort it was found (van Strijp 2018) that the 'PDE4D7 score' was inversely associated with BCR in multivariable analysis when adjusting for clinical variables (HR=0.43; 95% CI 0.29-0.63; p<0.0001) as well as for the clinical CAPRA score (HR=0.53; 95% CI 0.38-0.74; p=0.0001). Kaplan-Meier analysis demonstrated that, as before, in a post-surgical setting, the 'PDE4D7 score' categories were significantly associated with BCR progression free survival (logrank p<0.0001) and secondary treatment free survival (logrank p=0.01). Next a combination logistic regression model, which was developed on the previous cohort, was employed (van Strijp 2018). This consisted of the combined 'CAPRA & PDE4D7' score, demonstrating that patients within the highest combined 'CAPRA & PDE4D7' combined score category have virtually no risk of biochemical progression or transfer to any secondary treatment after surgery. This logistic regression model was also evaluated using ROC curve analysis in order to predict 5-year BCR after surgery. This revealed an increase in AUC of 5% over the CAPRA score alone (AUC=0.82 vs. 0.77, respectively; p=0.004). Decision curve analysis of the combined 'CAPRA & PDE4D7' score model confirmed the superior net benefit of using this combined score, compared to either score alone, across all decision thresholds in order to decide on whether to undertake intervention (e.g. surgery) based on the risk threshold of an individual patient to experience post-surgical disease progression (van Strijp 2018).
-
The prediction of the therapy outcome is very complicated as many factors play a role in therapy effectiveness and disease recurrence. It is likely that important factors have not yet been identified, while the effect of others cannot be determined precisely. Multiple clinico-pathological measures are currently investigated and applied in a clinical setting to improve response prediction and therapy selection, providing some degree of improvement. Nevertheless, a strong need remains for better prediction of the treatment response, in order to increase the success rate of these therapies.
Selection of the genes
-
Gene signatures, and combinations of these signatures with clinical parameters, have been identified of which the resulting models show a significant relation to mortality and therefore are expected to improve the prediction of the effectiveness of these treatments.
-
The identified immune defense response genes AIM2, APOBEC3A, CIAO1, DDX58, DHX9, IFI16, IFIH1, IFIT1, IFIT3, LRRFIP1, MYD88, OAS1, TLR8, and ZBP1, respectively, were identified as follows: A group of 538 prostate cancer patients were treated with RP and the prostate cancer tissue was stored together with clinical (e.g. pathological Gleason grade group (pGGG), pathology state (pT stage)) as well as relevant outcome parameters (e.g. biochemical recurrence (BCR), metastatic recurrence, prostate cancer specific death (PCa death), salvage radiation treatment (SRT), salvage androgen deprivation treatment (SADT), chemotherapy (CTX)). For each of these patients, a PDE4D7 score was calculated and categorized into four PDE4D7 score classes (see Alves de Inda M. et al., 2018, ibid). PDE4D7 score class 1 represents patient samples with lowest expression levels of PDE4D7, whereas PDE4D7 score class 4 represents patient samples with highest levels of PDE4D7 expression. RNASeq expression data (TPM - Transcripts Per Million) of the 538 prostate cancer subjects was then investigated for differential gene expression between the PDE4D7 score classes 1 and 4. In particular, it was determined for around 20,000 protein coding transcripts whether the mean expression level of the PDE4D7 score class 1 patients was more than twice as high as the mean expression level of the PDE4D7 score class 4 patients. This analysis resulted in 637 genes with a ratio PDE4D7 score class 1 / PDE4D7 score class 4 of > 2 with a minimum mean expression of 1 TPM in each of the four PDE4D7 score classes. These 637 genes were then further subjected to molecular pathway analysis, which resulted in a range of enriched annotation clusters. The annotation cluster #2 demonstrated enrichment (enrichment score: 10.8) in 30 genes with a function in defense response to viruses, negative regulation of viral genome replication as well as type I interferon signalling. A further heat map analysis confirmed that these immune defense response genes were generally higher expressed in samples from patients in PDE4D7 score class 1 than from patients in PDE4D7 score class 4. The class of genes with a function in defense response to viruses, negative regulation of viral genome replication as well as type I interferon signalling was further enriched to 61 genes by literature search to identify additional genes with the same molecular function. A further selection from the 61 genes was made based on the combinatorial power to separate patients who died from prostate cancer vs. those who did not, resulting of a preferred set of 14 genes. It was found that the number of events (metastases, prostate cancer specific death) was enriched in sub-cohorts with a low expression of these genes compared to the total patient cohort (#538) and a sub-cohort of 151 patients undergoing salvage RT (SRT) after post-surgical disease recurrence.
-
The identified T-Cell receptor signalling genes CD2, CD247, CD28, CD3E, CD3G, CD4, CSK, EZR, FYN, LAT, LCK, PAG1, PDE4D, PRKACA, PRKACB, PTPRC, and ZAP70 were identified as follows: A group of 538 prostate cancer patients were treated with RP and the prostate cancer tissue was stored together with clinical (e.g. pathological Gleason grade group (pGGG), pathology state (pT stage)) as well as relevant outcome parameters (e.g. biochemical recurrence (BCR), metastatic recurrence, prostate cancer specific death (PCa death), salvage radiation treatment (SRT), salvage androgen deprivation treatment (SADT), chemotherapy (CTX)). For each of these patients, a PDE4D7 score was calculated and categorized into four PDE4D7 score classes (see Alves de Inda M. et al., 2018, ibid). PDE4D7 score class 1 represents patient samples with lowest expression levels of PDE4D7, whereas PDE4D7 score class 4 represents patient samples with highest levels of PDE4D7 expression. RNASeq expression data (TPM - Transcripts Per Million) of the 538 prostate cancer subjects was then investigated for differential gene expression between the PDE4D7 score classes 1 and 4. In particular, it was determined for around 20,000 protein coding transcripts whether the mean expression level of the PDE4D7 score class 1 patients was more than twice as high as the mean expression level of the PDE4D7 score class 4 patients. This analysis resulted in 637 genes with a ratio PDE4D7 score class 1 / PDE4D7 score class 4 of > 2 with a minimum mean expression of 1 TPM in each of the four PDE4D7 score classes. These 637 genes were then further subjected to molecular pathway analysis, which resulted in a range of enriched annotation clusters. The annotation cluster #6 demonstrated enrichment (enrichment score: 5.9) in 17 genes with a function in primary immune deficiency and activation of T-Cell receptor signalling. A further heat map analysis confirmed that these T-Cell receptor signalling genes were generally higher expressed in samples from patients in PDE4D7 score class 1 than from patients in PDE4D7 score class 4.
-
The identified PDE4D7 correlated genes ABCC5, CUX2, KIAA1549, PDE4D, RAP1GAP2, SLC39A11, TDRD1, and VWA2 were identified as follows: In RNAseq data generated on 571 prostate cancer patients on close to 60,000 transcripts a range of genes were identified that are correlated to the expression of the known biomarker PDE4D7 in this data. The correlation between the expression of any of these genes and PDE4D7 across the 571 samples was done by Pearson correlation and is expressed as a value between 0 to 1 in case of positive correlation or a value between -1 to 0 in case of negative correlation. As input data for the calculation of the correlation coefficient the PDE4D7 score (see Alves de Inda M. et al., 2018, ibid) and the RNAseq determined TPM gene expression value per gene of interest (see below) were used.
-
The maximum negative correlation coefficient identified between the expression of any of the approximately 60,000 transcripts and the expression of PDE4D7 was -0.38 while the maximum positive correlation coefficient identified between the expression of any of the approximately 60,000 transcripts and the expression of PDE4D7 was +0.56. Genes in the range of correlation -0.31 to -0.38 as well as +0.41 to +0.56 were selected. In total 77 transcripts matching these characteristics were identified. From those 77 transcripts the eight PDE4D7 correlated genes ABCC5, CUX2, KIAA1549, PDE4D, RAP1GAP2, SLC39A11, TDRD1, and VWA2 were selected by testing Cox regression combination models iteratively in a sub-cohort of 186 patients who were undergoing salvage radiation treatment (SRT) due to post-surgical biochemical relapse. The clinical endpoint tested was prostate cancer specific death after start of SRT. The boundary condition for the selection of the eight genes was given by the restriction that the p-values in the multivariate Cox-regression were <0.1 for all genes retained in the model.
-
In this document, it is shown that these genes are also of prognostic value with respect to an outcome of a breast cancer subject, preferably in invasive breast cancer subjects.
-
Therefore, in a first embodiment the invention provides for a method of predicting an outcome of a breast cancer subject, comprising:
- determining or receiving the result of a determination of a first gene expression profile for each of one or more, for example, 1, 2, 3, 4, 5, 6, 7, 8, 9, 10, 11, 12, 13 or all, immune defense response genes selected from the group consisting of: AIM2, APOBEC3A, CIAO1, DDX58, DHX9, IFI16, IFIH1, IFIT1, IFIT3, LRRFIP1, MYD88, OAS1, TLR8, and ZBP1, said first gene expression profile(s) being determined in a biological sample obtained from the subject, and/or
- determining or receiving the result of a determination of a second gene expression profile for each of one or more, for example, 1, 2, 3, 4, 5, 6, 7, 8, 9, 10, 11, 12, 13, 14, 15, 16 or all, T-Cell receptor signalling genes selected from the group consisting of: CD2, CD247, CD28, CD3E, CD3G, CD4, CSK, EZR, FYN, LAT, LCK, PAG1, PDE4D, PRKACA, PRKACB, PTPRC, and ZAP70, said second gene expression profile(s) being determined in a biological sample obtained from the subject, and/or
- determining or receiving the result of a determination of a third gene expression profile for each of one or more, for example, 1, 2, 3, 4, 5, 6, 7 or all, PDE4D7 correlated genes selected from the group consisting of: ABCC5, CUX2, KIAA1549, PDE4D, RAP1GAP2, SLC39A11, TDRD1, and VWA2, said third gene expression profile(s) being determined in a biological sample obtained from the subject,
- determining the prediction of the outcome based on the first, second, and/or third gene expression profile(s),
- wherein said prediction is a favourable risk or a non-favourable risk of breast-cancer related death, loco-regional recurrence and/or distant recurrence.
-
Optionally, the method further comprises a step of providing the prediction of the outcome to a medical caregiver or the subject.
-
In an embodiment the invention provides for a computer implemented method of predicting an outcome of a breast cancer subject, comprising:
- receiving the result of a determination of a first gene expression profile for each of one or more, for example, 1, 2, 3, 4, 5, 6, 7, 8, 9, 10, 11, 12, 13 or all, immune defense response genes selected from the group consisting of: AIM2, APOBEC3A, CIAO1, DDX58, DHX9, IFI16, IFIH1, IFIT1, IFIT3, LRRFIP1, MYD88, OAS1, TLR8, and ZBP1, said first gene expression profile(s) being determined in a biological sample obtained from the subject, and/or
- receiving the result of a determination of a second gene expression profile for each of one or more, for example, 1, 2, 3, 4, 5, 6, 7, 8, 9, 10, 11, 12, 13, 14, 15, 16 or all, T-Cell receptor signalling genes selected from the group consisting of: CD2, CD247, CD28, CD3E, CD3G, CD4, CSK, EZR, FYN, LAT, LCK, PAG1, PDE4D, PRKACA, PRKACB, PTPRC, and ZAP70, said second gene expression profile(s) being determined in a biological sample obtained from the subject, and/or
- receiving the result of a determination of a third gene expression profile for each of one or more, for example, 1, 2, 3, 4, 5, 6, 7 or all, PDE4D7 correlated genes selected from the group consisting of: ABCC5, CUX2, KIAA1549, PDE4D, RAP1GAP2, SLC39A11, TDRD1, and VWA2, said third gene expression profile(s) being determined in a biological sample obtained from the subject,
- determining the prediction of the outcome based on the first, second, and/or third gene expression profile(s),
- wherein said prediction is a favourable risk or a non-favourable risk of breast-cancer related death, loco-regional recurrence and/or distant recurrence. Optionally, the method further comprises a step of providing the prediction of the outcome to a medical caregiver or the subject.
-
In the present invention breast-cancer related death preferably is breast-cancer specific death.
-
With respect to the biological processes described above, three immune system related gene signatures were selected, including the genes listed in tables 1-3. Before, the relevance of these signatures to prediction of prostate cancer survival was shown.
Table 1: Immune Defence Response (IDR) Signature. | Gene Symbol | Ensembl_ID |
| AIM2 | ENSG00000163568 |
| APOBEC3A | ENSG00000128383 |
| CIAO1 | ENSG00000144021 |
| DDX58 | ENSG00000107201 |
| DHX9 | ENSG00000135829 |
| IFI16 | ENSG00000163565 |
| IFIH1 | ENSG00000115267 |
| IFIT1 | ENSG00000185745 |
| IFIT3 | ENSG00000119917 |
| LRRFIP1 | ENSG00000124831 |
| MYD88 | ENSG00000172936 |
| OAS1 | ENSG00000089127 |
| TLR8 | ENSG00000101916 |
| ZBP1 | ENSG00000124256 |
Table 2: T-Cell Receptor (TCR) Signature. | Gene Symbol | Ensembl_ID |
| CD2 | ENSG00000116824 |
| CD247 | ENSG00000198821 |
| CD28 | ENSG00000178562 |
| CD3E | ENSG00000198851 |
| CD3G | ENSG00000160654 |
| CD4 | ENSG00000010610 |
| CSK | ENSG00000103653 |
| EZR | ENSG00000092820 |
| FYN | ENSG00000010810 |
| LAT | ENSG00000213658 |
| LCK | ENSG00000182866 |
| PAG1 | ENSG00000076641 |
| PDE4D | ENSG00000113448 |
| PRKACA | ENSG00000072062 |
| PRKACB | ENSG00000142875 |
| PTPRC | ENSG00000081237 |
| ZAP70 | ENSG00000115085 |
Table 3: PDE4D7 Correlated (PDE4D7_R2) signature. | Gene Symbol | Ensembl_ID |
| ABCC5 | ENSG00000114770 |
| CUX2 | ENSG00000111249 |
| KIAA1549 | ENSG00000122778 |
| PDE4D | ENSG00000113448 |
| RAP1GAP2 | ENSG00000132359 |
| SLC39A11 | ENSG00000133195 |
| TDRD1 | ENSG00000095627 |
| VWA2 | ENSG00000165816 |
-
It was found that the genes AIM2, APOBEC3A, CIAO1, DDX58, DHX9, IFI16, IFIH1, IFIT1, IFIT3, LRRFIP1, MYD88, OAS1, TLR8, ZBP1, CD2, CD247, CD28, CD3E, CD3G, CD4, CSK, EZR, FYN, LAT, LCK, PAG1, PDE4D, PRKACA, PRKACB, PTPRC, ZAP70, ABCC5, CUX2, KIAA1549, PDE4D, RAP1GAP2, SLC39A11, TDRD1, and VWA2 each individually, one or more per gene panel, in a combination of one or more per gene panel or when all combined, are able to predict the outcome in a breast cancer subject.
-
The term "ABCC5" refers to the human ATP binding cassette subfamily C member 5 gene (Ensembl: ENSG00000114770), for example, to the sequence as defined in NCBI Reference Sequence NM_001023587.2 or in NCBI Reference Sequence NM_005688.3, specifically, to the nucleotide sequence as set forth in SEQ ID NO:1 or in SEQ ID NO:2, which correspond to the sequences of the above indicated NCBI Reference Sequences of the ABCC5 transcript, and also relates to the corresponding amino acid sequence for example as set forth in SEQ ID NO:3 or in SEQ ID NO:4, which correspond to the protein sequences defined in NCBI Protein Accession Reference Sequence NP_001018881.1 and in NCBI Protein Accession Reference Sequence NP_005679 encoding the ABCC5 polypeptide.
-
The term "ABCC5" also comprises nucleotide sequences showing a high degree of homology to ABCC5, e.g. nucleic acid sequences being at least 75%, 80%, 85%, 90%, 91%, 92%, 93%, 94%, 95%, 96%, 97%, 98% or 99% identical to the sequence as set forth in SEQ ID NO:1 or in SEQ ID NO:2 or amino acid sequences being at least 75%, 80%, 85%, 90%, 91%, 92%, 93%, 94%, 95%, 96%, 97%, 98% or 99% identical to the sequence as set forth in SEQ ID NO:3 or in SEQ ID NO:4 or nucleic acid sequences encoding amino acid sequences being at least 75%, 80%, 85%, 90%, 91%, 92%, 93%, 94%, 95%, 96%, 97%, 98% or 99% identical to the sequence as set forth in SEQ ID NO:3 or in SEQ ID NO:4 or amino acid sequences being encoded by nucleic acid sequences being at least 75%, 80%, 85%, 90%, 91%, 92%, 93%, 94%, 95%, 96%, 97%, 98% or 99% identical to the sequence as set forth in SEQ ID NO:1 or in SEQ ID NO:2.
-
The term "AIM2" refers to the Absent in Melanoma 2 gene (Ensembl: ENSG00000163568), for example, to the sequence as defined in NCBI Reference Sequence NM_004833, specifically, to the nucleotide sequence as set forth in SEQ ID NO:5, which corresponds to the sequence of the above indicated NCBI Reference Sequence of the AIM2 transcript, and also relates to the corresponding amino acid sequence for example as set forth in SEQ ID NO:6, which corresponds to the protein sequence defined in NCBI Protein Accession Reference Sequence NP_004824 encoding the AIM2 polypeptide.
-
The term "AIM2" also comprises nucleotide sequences showing a high degree of homology to AIM2, e.g. nucleic acid sequences being at least 75%, 80%, 85%, 90%, 91%, 92%, 93%, 94%, 95%, 96%, 97%, 98% or 99% identical to the sequence as set forth in SEQ ID NO:5 or amino acid sequences being at least 75%, 80%, 85%, 90%, 91%, 92%, 93%, 94%, 95%, 96%, 97%, 98% or 99% identical to the sequence as set forth in SEQ ID NO:6 or nucleic acid sequences encoding amino acid sequences being at least 75%, 80%, 85%, 90%, 91%, 92%, 93%, 94%, 95%, 96%, 97%, 98% or 99% identical to the sequence as set forth in SEQ ID NO:6 or amino acid sequences being encoded by nucleic acid sequences being at least 75%, 80%, 85%, 90%, 91%, 92%, 93%, 94%, 95%, 96%, 97%, 98% or 99% identical to the sequence as set forth in SEQ ID NO:5.
-
The term "APOBEC3A" refers to the Apolipoprotein B mRNA Editing Enzyme Catalytic Subunit 3A gene (Ensembl: ENSG00000128383), for example, to the sequence as defined in NCBI
-
Reference Sequence NM_145699, specifically, to the nucleotide sequence as set forth in SEQ ID NO:7, which corresponds to the sequence of the above indicated NCBI Reference Sequence of the APOBEC3A transcript, and also relates to the corresponding amino acid sequence for example as set forth in SEQ ID NO:8, which corresponds to the protein sequence defined in NCBI Protein Accession Reference Sequence NP_663745 encoding the APOBEC3A polypeptide.
-
The term "APOBEC3A" also comprises nucleotide sequences showing a high degree of homology to APOBEC3A, e.g. nucleic acid sequences being at least 75%, 80%, 85%, 90%, 91%, 92%, 93%, 94%, 95%, 96%, 97%, 98% or 99% identical to the sequence as set forth in SEQ ID NO:7 or amino acid sequences being at least 75%, 80%, 85%, 90%, 91%, 92%, 93%, 94%, 95%, 96%, 97%, 98% or 99% identical to the sequence as set forth in SEQ ID NO:8 or nucleic acid sequences encoding amino acid sequences being at least 75%, 80%, 85%, 90%, 91%, 92%, 93%, 94%, 95%, 96%, 97%, 98% or 99% identical to the sequence as set forth in SEQ ID NO:8 or amino acid sequences being encoded by nucleic acid sequences being at least 75%, 80%, 85%, 90%, 91%, 92%, 93%, 94%, 95%, 96%, 97%, 98% or 99% identical to the sequence as set forth in SEQ ID NO:7.
-
The term "CD2" refers to the Cluster Of Differentiation 2 gene (Ensembl: ENSG00000116824), for example, to the sequence as defined in NCBI Reference Sequence NM_001767, specifically, to the nucleotide sequence as set forth in SEQ ID NO:9, which corresponds to the sequence of the above indicated NCBI Reference Sequence of the CD2 transcript, and also relates to the corresponding amino acid sequence for example as set forth in SEQ ID NO: 10, which corresponds to the protein sequence defined in NCBI Protein Accession Reference Sequence NP_001758 encoding the CD2 polypeptide.
-
The term "CD2" also comprises nucleotide sequences showing a high degree of homology to CD2, e.g. nucleic acid sequences being at least 75%, 80%, 85%, 90%, 91%, 92%, 93%, 94%, 95%, 96%, 97%, 98% or 99% identical to the sequence as set forth in SEQ ID NO:9 or amino acid sequences being at least 75%, 80%, 85%, 90%, 91%, 92%, 93%, 94%, 95%, 96%, 97%, 98% or 99% identical to the sequence as set forth in SEQ ID NO: 10 or nucleic acid sequences encoding amino acid sequences being at least 75%, 80%, 85%, 90%, 91%, 92%, 93%, 94%, 95%, 96%, 97%, 98% or 99% identical to the sequence as set forth in SEQ ID NO:10 or amino acid sequences being encoded by nucleic acid sequences being at least 75%, 80%, 85%, 90%, 91%, 92%, 93%, 94%, 95%, 96%, 97%, 98% or 99% identical to the sequence as set forth in SEQ ID NO:9.
-
The term "CD247" refers to the Cluster Of Differentiation 247 gene (Ensembl: ENSG00000198821), for example, to the sequence as defined in NCBI Reference Sequence NM_000734 or in NCBI Reference Sequence NM_198053, specifically, to the nucleotide sequence as set forth in SEQ ID NO:11 or in SEQ ID NO:12, which correspond to the sequences of the above indicated NCBI Reference Sequences of the CD247 transcript, and also relates to the corresponding amino acid sequence for example as set forth in SEQ ID NO:13 or in SEQ ID NO:14, which correspond to the protein sequences defined in NCBI Protein Accession Reference Sequence NP_000725 and in NCBI Protein Accession Reference Sequence NP_932170 encoding the CD247 polypeptide.
-
The term "CD247" also comprises nucleotide sequences showing a high degree of homology to CD247, e.g. nucleic acid sequences being at least 75%, 80%, 85%, 90%, 91%, 92%, 93%, 94%, 95%, 96%, 97%, 98% or 99% identical to the sequence as set forth in SEQ ID NO:11 or in SEQ ID NO:12 or amino acid sequences being at least 75%, 80%, 85%, 90%, 91%, 92%, 93%, 94%, 95%, 96%, 97%, 98% or 99% identical to the sequence as set forth in SEQ ID NO:13 or in SEQ ID NO:14 or nucleic acid sequences encoding amino acid sequences being at least 75%, 80%, 85%, 90%, 91%, 92%, 93%, 94%, 95%, 96%, 97%, 98% or 99% identical to the sequence as set forth in SEQ ID NO:13 or in SEQ ID NO:14 or amino acid sequences being encoded by nucleic acid sequences being at least 75%, 80%, 85%, 90%, 91%, 92%, 93%, 94%, 95%, 96%, 97%, 98% or 99% identical to the sequence as set forth in SEQ ID NO:11 or in SEQ ID NO:12.
-
The term "CD28" refers to the Cluster Of Differentiation 28 gene (Ensembl: ENSG00000178562), for example, to the sequence as defined in NCBI Reference Sequence NM_006139 or in NCBI Reference Sequence NM_001243078, specifically, to the nucleotide sequence as set forth in SEQ ID NO:15 or in SEQ ID NO:16, which correspond to the sequences of the above indicated NCBI Reference Sequences of the CD28 transcript, and also relates to the corresponding amino acid sequence for example as set forth in SEQ ID NO:17 or in SEQ ID NO: 18, which correspond to the protein sequences defined in NCBI Protein Accession Reference Sequence NP_006130 and in NCBI Protein Accession Reference Sequence NP_001230007 encoding the CD28 polypeptide.
-
The term "CD28" also comprises nucleotide sequences showing a high degree of homology to CD28, e.g. nucleic acid sequences being at least 75%, 80%, 85%, 90%, 91%, 92%, 93%, 94%, 95%, 96%, 97%, 98% or 99% identical to the sequence as set forth in SEQ ID NO: 15 or in SEQ ID NO:16 or amino acid sequences being at least 75%, 80%, 85%, 90%, 91%, 92%, 93%, 94%, 95%, 96%, 97%, 98% or 99% identical to the sequence as set forth in SEQ ID NO: 17 or in SEQ ID NO:18 or nucleic acid sequences encoding amino acid sequences being at least 75%, 80%, 85%, 90%, 91%, 92%, 93%, 94%, 95%, 96%, 97%, 98% or 99% identical to the sequence as set forth in SEQ ID NO: 17 or in SEQ ID NO:18 or amino acid sequences being encoded by nucleic acid sequences being at least 75%, 80%, 85%, 90%, 91%, 92%, 93%, 94%, 95%, 96%, 97%, 98% or 99% identical to the sequence as set forth in SEQ ID NO:15 or in SEQ ID NO:16.
-
The term "CD3E" refers to the Cluster Of Differentiation 3E gene (Ensembl: ENSG00000198851), for example, to the sequence as defined in NCBI Reference Sequence NM_000733, specifically, to the nucleotide sequence as set forth in SEQ ID NO: 19, which corresponds to the sequence of the above indicated NCBI Reference Sequence of the CD3E transcript, and also relates to the corresponding amino acid sequence for example as set forth in SEQ ID NO:20, which corresponds to the protein sequence defined in NCBI Protein Accession Reference Sequence NP_000724 encoding the CD3E polypeptide.
-
The term "CD3E" also comprises nucleotide sequences showing a high degree of homology to CD3E, e.g. nucleic acid sequences being at least 75%, 80%, 85%, 90%, 91%, 92%, 93%, 94%, 95%, 96%, 97%, 98% or 99% identical to the sequence as set forth in SEQ ID NO:19 or amino acid sequences being at least 75%, 80%, 85%, 90%, 91%, 92%, 93%, 94%, 95%, 96%, 97%, 98% or 99% identical to the sequence as set forth in SEQ ID NO:20 or nucleic acid sequences encoding amino acid sequences being at least 75%, 80%, 85%, 90%, 91%, 92%, 93%, 94%, 95%, 96%, 97%, 98% or 99% identical to the sequence as set forth in SEQ ID NO:20 or amino acid sequences being encoded by nucleic acid sequences being at least 75%, 80%, 85%, 90%, 91%, 92%, 93%, 94%, 95%, 96%, 97%, 98% or 99% identical to the sequence as set forth in SEQ ID NO: 19.
-
The term "CD3G" refers to the Cluster Of Differentiation 3G gene (Ensembl: ENSG00000160654), for example, to the sequence as defined in NCBI Reference Sequence NM_000073, specifically, to the nucleotide sequence as set forth in SEQ ID NO:21, which corresponds to the sequence of the above indicated NCBI Reference Sequence of the CD3G transcript, and also relates to the corresponding amino acid sequence for example as set forth in SEQ ID NO:22, which corresponds to the protein sequence defined in NCBI Protein Accession Reference Sequence NP_000064 encoding the CD3G polypeptide.
-
The term "CD3G" also comprises nucleotide sequences showing a high degree of homology to CD3G, e.g. nucleic acid sequences being at least 75%, 80%, 85%, 90%, 91%, 92%, 93%, 94%, 95%, 96%, 97%, 98% or 99% identical to the sequence as set forth in SEQ ID NO:21 or amino acid sequences being at least 75%, 80%, 85%, 90%, 91%, 92%, 93%, 94%, 95%, 96%, 97%, 98% or 99% identical to the sequence as set forth in SEQ ID NO:22 or nucleic acid sequences encoding amino acid sequences being at least 75%, 80%, 85%, 90%, 91%, 92%, 93%, 94%, 95%, 96%, 97%, 98% or 99% identical to the sequence as set forth in SEQ ID NO:22 or amino acid sequences being encoded by nucleic acid sequences being at least 75%, 80%, 85%, 90%, 91%, 92%, 93%, 94%, 95%, 96%, 97%, 98% or 99% identical to the sequence as set forth in SEQ ID NO:21.
-
The term "CD4" refers to the Cluster Of Differentiation 4 gene (Ensembl: ENSG00000010610), for example, to the sequence as defined in NCBI Reference Sequence NM_000616, specifically, to the nucleotide sequence as set forth in SEQ ID NO:23, which corresponds to the sequence of the above indicated NCBI Reference Sequence of the CD4 transcript, and also relates to the corresponding amino acid sequence for example as set forth in SEQ ID NO:24, which corresponds to the protein sequence defined in NCBI Protein Accession Reference Sequence NP_000607 encoding the CD4 polypeptide.
-
The term "CD4" also comprises nucleotide sequences showing a high degree of homology to CD4, e.g. nucleic acid sequences being at least 75%, 80%, 85%, 90%, 91%, 92%, 93%, 94%, 95%, 96%, 97%, 98% or 99% identical to the sequence as set forth in SEQ ID NO:23 or amino acid sequences being at least 75%, 80%, 85%, 90%, 91%, 92%, 93%, 94%, 95%, 96%, 97%, 98% or 99% identical to the sequence as set forth in SEQ ID NO:24 or nucleic acid sequences encoding amino acid sequences being at least 75%, 80%, 85%, 90%, 91%, 92%, 93%, 94%, 95%, 96%, 97%, 98% or 99% identical to the sequence as set forth in SEQ ID NO:24 or amino acid sequences being encoded by nucleic acid sequences being at least 75%, 80%, 85%, 90%, 91%, 92%, 93%, 94%, 95%, 96%, 97%, 98% or 99% identical to the sequence as set forth in SEQ ID NO:23.
-
The term "CIAO1" refers to the Cytosolic Iron-Sulfur Assembly Component 1 gene (Ensembl: ENSG00000144021), for example, to the sequence as defined in NCBI Reference Sequence NM_004804, specifically, to the nucleotide sequence as set forth in SEQ ID NO:25, which corresponds to the sequence of the above indicated NCBI Reference Sequence of the CIA01 transcript, and also relates to the corresponding amino acid sequence for example as set forth in SEQ ID NO:26, which corresponds to the protein sequence defined in NCBI Protein Accession Reference Sequence NP_663745 encoding the CIAO1 polypeptide.
-
The term "CIAO1" also comprises nucleotide sequences showing a high degree of homology to CIAO1, e.g. nucleic acid sequences being at least 75%, 80%, 85%, 90%, 91%, 92%, 93%, 94%, 95%, 96%, 97%, 98% or 99% identical to the sequence as set forth in SEQ ID NO:25 or amino acid sequences being at least 75%, 80%, 85%, 90%, 91%, 92%, 93%, 94%, 95%, 96%, 97%, 98% or 99% identical to the sequence as set forth in SEQ ID NO:26 or nucleic acid sequences encoding amino acid sequences being at least 75%, 80%, 85%, 90%, 91%, 92%, 93%, 94%, 95%, 96%, 97%, 98% or 99% identical to the sequence as set forth in SEQ ID NO:26 or amino acid sequences being encoded by nucleic acid sequences being at least 75%, 80%, 85%, 90%, 91%, 92%, 93%, 94%, 95%, 96%, 97%, 98% or 99% identical to the sequence as set forth in SEQ ID NO:25.
-
The term "CSK" refers to the C-Terminal Src Kinase gene (Ensembl: ENSG00000103653), for example, to the sequence as defined in NCBI Reference Sequence NM_004383, specifically, to the nucleotide sequence as set forth in SEQ ID NO:27, which corresponds to the sequence of the above indicated NCBI Reference Sequence of the CSK transcript, and also relates to the corresponding amino acid sequence for example as set forth in SEQ ID NO:28, which corresponds to the protein sequence defined in NCBI Protein Accession Reference Sequence NP_004374 encoding the CSK polypeptide.
-
The term "CSK" also comprises nucleotide sequences showing a high degree of homology to CSK, e.g. nucleic acid sequences being at least 75%, 80%, 85%, 90%, 91%, 92%, 93%, 94%, 95%, 96%, 97%, 98% or 99% identical to the sequence as set forth in SEQ ID NO:27 or amino acid sequences being at least 75%, 80%, 85%, 90%, 91%, 92%, 93%, 94%, 95%, 96%, 97%, 98% or 99% identical to the sequence as set forth in SEQ ID NO:28 or nucleic acid sequences encoding amino acid sequences being at least 75%, 80%, 85%, 90%, 91%, 92%, 93%, 94%, 95%, 96%, 97%, 98% or 99% identical to the sequence as set forth in SEQ ID NO:28 or amino acid sequences being encoded by nucleic acid sequences being at least 75%, 80%, 85%, 90%, 91%, 92%, 93%, 94%, 95%, 96%, 97%, 98% or 99% identical to the sequence as set forth in SEQ ID NO:27.
-
The term "CUX2" refers to the human Cut Like Homeobox 2 gene (Ensembl: ENSG00000111249), for example, to the sequence as defined in NCBI Reference Sequence
-
NM_015267.3, specifically, to the nucleotide sequence as set forth in SEQ ID NO:29, which corresponds to the sequence of the above indicated NCBI Reference Sequence of the CUX2 transcript, and also relates to the corresponding amino acid sequence for example as set forth in SEQ ID NO:30, which corresponds to the protein sequence defined in NCBI Protein Accession Reference Sequence NP_056082.2 encoding the CUX2 polypeptide.
-
The term "CUX2" also comprises nucleotide sequences showing a high degree of homology to CUX2, e.g. nucleic acid sequences being at least 75%, 80%, 85%, 90%, 91%, 92%, 93%, 94%, 95%, 96%, 97%, 98% or 99% identical to the sequence as set forth in SEQ ID NO:29 or amino acid sequences being at least 75%, 80%, 85%, 90%, 91%, 92%, 93%, 94%, 95%, 96%, 97%, 98% or 99% identical to the sequence as set forth in SEQ ID NO:30 or nucleic acid sequences encoding amino acid sequences being at least 75%, 80%, 85%, 90%, 91%, 92%, 93%, 94%, 95%, 96%, 97%, 98% or 99% identical to the sequence as set forth in SEQ ID NO:30 or amino acid sequences being encoded by nucleic acid sequences being at least 75%, 80%, 85%, 90%, 91%, 92%, 93%, 94%, 95%, 96%, 97%, 98% or 99% identical to the sequence as set forth in SEQ ID NO:29.
-
The term "DDX58" refers to the DExD/H-box Helicase 58 gene (Ensembl: ENSG00000107201), for example, to the sequence as defined in NCBI Reference Sequence NM_014314, specifically, to the nucleotide sequence as set forth in SEQ ID NO:31, which corresponds to the sequence of the above indicated NCBI Reference Sequence of the DDX58 transcript, and also relates to the corresponding amino acid sequence for example as set forth in SEQ ID NO:32, which corresponds to the protein sequence defined in NCBI Protein Accession Reference Sequence NP_055129 encoding the DDX58 polypeptide.
-
The term "DDX58" also comprises nucleotide sequences showing a high degree of homology to DDX58, e.g. nucleic acid sequences being at least 75%, 80%, 85%, 90%, 91%, 92%, 93%, 94%, 95%, 96%, 97%, 98% or 99% identical to the sequence as set forth in SEQ ID NO:31 or amino acid sequences being at least 75%, 80%, 85%, 90%, 91%, 92%, 93%, 94%, 95%, 96%, 97%, 98% or 99% identical to the sequence as set forth in SEQ ID NO:32 or nucleic acid sequences encoding amino acid sequences being at least 75%, 80%, 85%, 90%, 91%, 92%, 93%, 94%, 95%, 96%, 97%, 98% or 99% identical to the sequence as set forth in SEQ ID NO:32 or amino acid sequences being encoded by nucleic acid sequences being at least 75%, 80%, 85%, 90%, 91%, 92%, 93%, 94%, 95%, 96%, 97%, 98% or 99% identical to the sequence as set forth in SEQ ID NO:31.
-
The term "DHX9" refers to the DExD/H-box Helicase 9 gene (Ensembl: ENSG00000135829), for example, to the sequence as defined in NCBI Reference Sequence NM_001357, specifically, to the nucleotide sequence as set forth in SEQ ID NO:33, which corresponds to the sequence of the above indicated NCBI Reference Sequence of the DHX9 transcript, and also relates to the corresponding amino acid sequence for example as set forth in SEQ ID NO:34, which corresponds to the protein sequence defined in NCBI Protein Accession Reference Sequence NP_001348 encoding the DHX9 polypeptide.
-
The term "DHX9" also comprises nucleotide sequences showing a high degree of homology to DHX9, e.g. nucleic acid sequences being at least 75%, 80%, 85%, 90%, 91%, 92%, 93%, 94%, 95%, 96%, 97%, 98% or 99% identical to the sequence as set forth in SEQ ID NO:33 or amino acid sequences being at least 75%, 80%, 85%, 90%, 91%, 92%, 93%, 94%, 95%, 96%, 97%, 98% or 99% identical to the sequence as set forth in SEQ ID NO:34 or nucleic acid sequences encoding amino acid sequences being at least 75%, 80%, 85%, 90%, 91%, 92%, 93%, 94%, 95%, 96%, 97%, 98% or 99% identical to the sequence as set forth in SEQ ID NO:34 or amino acid sequences being encoded by nucleic acid sequences being at least 75%, 80%, 85%, 90%, 91%, 92%, 93%, 94%, 95%, 96%, 97%, 98% or 99% identical to the sequence as set forth in SEQ ID NO:33.
-
The term "EZR" refers to the Ezrin gene (Ensembl: ENSG00000092820), for example, to the sequence as defined in NCBI Reference Sequence NM_003379, specifically, to the nucleotide sequence as set forth in SEQ ID NO:35, which corresponds to the sequence of the above indicated NCBI Reference Sequence of the EZR transcript, and also relates to the corresponding amino acid sequence for example as set forth in SEQ ID NO:36, which corresponds to the protein sequence defined in NCBI Protein Accession Reference Sequence NP_003370 encoding the EZR polypeptide.
-
The term "EZR" also comprises nucleotide sequences showing a high degree of homology to EZR, e.g. nucleic acid sequences being at least 75%, 80%, 85%, 90%, 91%, 92%, 93%, 94%, 95%, 96%, 97%, 98% or 99% identical to the sequence as set forth in SEQ ID NO:35 or amino acid sequences being at least 75%, 80%, 85%, 90%, 91%, 92%, 93%, 94%, 95%, 96%, 97%, 98% or 99% identical to the sequence as set forth in SEQ ID NO:36 or nucleic acid sequences encoding amino acid sequences being at least 75%, 80%, 85%, 90%, 91%, 92%, 93%, 94%, 95%, 96%, 97%, 98% or 99% identical to the sequence as set forth in SEQ ID NO:36 or amino acid sequences being encoded by nucleic acid sequences being at least 75%, 80%, 85%, 90%, 91%, 92%, 93%, 94%, 95%, 96%, 97%, 98% or 99% identical to the sequence as set forth in SEQ ID NO:35.
-
The term "FYN" refers to the FYN Proto-Oncogene gene (Ensembl: ENSG00000010810), for example, to the sequence as defined in NCBI Reference Sequence NM_002037 or in NCBI Reference Sequence NM_153047 or in NCBI Reference Sequence NM_153048, specifically, to the nucleotide sequence as set forth in SEQ ID NO:37 or in SEQ ID NO:38 or in SEQ ID NO:39, which correspond to the sequences of the above indicated NCBI Reference Sequences of the FYN transcript, and also relates to the corresponding amino acid sequence for example as set forth in SEQ ID NO:40 or in SEQ ID NO:41 or in SEQ ID NO:42, which correspond to the protein sequences defined in NCBI Protein Accession Reference Sequence NP_002028 and in NCBI Protein Accession Reference Sequence NP_694592 and in NCBI Protein Accession Reference Sequence XP_005266949 encoding the FYN polypeptide.
-
The term "FYN" also comprises nucleotide sequences showing a high degree of homology to FYN, e.g. nucleic acid sequences being at least 75%, 80%, 85%, 90%, 91%, 92%, 93%, 94%, 95%, 96%, 97%, 98% or 99% identical to the sequence as set forth in SEQ ID NO:37 or in SEQ ID NO:38 or in SEQ ID NO:39 or amino acid sequences being at least 75%, 80%, 85%, 90%, 91%, 92%, 93%, 94%, 95%, 96%, 97%, 98% or 99% identical to the sequence as set forth in SEQ ID NO:40 or in SEQ ID NO:41 or in SEQ ID NO:42 or nucleic acid sequences encoding amino acid sequences being at least 75%, 80%, 85%, 90%, 91%, 92%, 93%, 94%, 95%, 96%, 97%, 98% or 99% identical to the sequence as set forth in SEQ ID NO:40 or in SEQ ID NO:41 or in SEQ ID NO:42 or amino acid sequences being encoded by nucleic acid sequences being at least 75%, 80%, 85%, 90%, 91%, 92%, 93%, 94%, 95%, 96%, 97%, 98% or 99% identical to the sequence as set forth in SEQ ID NO:37 or in SEQ ID NO:38 or in SEQ ID NO:39.
-
The term "IFI16" refers to the Interferon Gamma Inducible Protein 16 gene (Ensembl: ENSG00000163565), for example, to the sequence as defined in NCBI Reference Sequence NM_005531, specifically, to the nucleotide sequence as set forth in SEQ ID NO:43, which corresponds to the sequence of the above indicated NCBI Reference Sequence of the IFI16 transcript, and also relates to the corresponding amino acid sequence for example as set forth in SEQ ID NO:44, which corresponds to the protein sequence defined in NCBI Protein Accession Reference Sequence NP_005522 encoding the IFI16 polypeptide.
-
The term "IFI16" also comprises nucleotide sequences showing a high degree of homology to IFI16, e.g. nucleic acid sequences being at least 75%, 80%, 85%, 90%, 91%, 92%, 93%, 94%, 95%, 96%, 97%, 98% or 99% identical to the sequence as set forth in SEQ ID NO:43 or amino acid sequences being at least 75%, 80%, 85%, 90%, 91%, 92%, 93%, 94%, 95%, 96%, 97%, 98% or 99% identical to the sequence as set forth in SEQ ID NO:44 or nucleic acid sequences encoding amino acid sequences being at least 75%, 80%, 85%, 90%, 91%, 92%, 93%, 94%, 95%, 96%, 97%, 98% or 99% identical to the sequence as set forth in SEQ ID NO:44 or amino acid sequences being encoded by nucleic acid sequences being at least 75%, 80%, 85%, 90%, 91%, 92%, 93%, 94%, 95%, 96%, 97%, 98% or 99% identical to the sequence as set forth in SEQ ID NO:43.
-
The term "IFIH1" refers to the Interferon Induced With Helicase C Domain 1 gene (Ensembl: ENSG00000115267), for example, to the sequence as defined in NCBI Reference Sequence
-
NM_022168, specifically, to the nucleotide sequence as set forth in SEQ ID NO:45, which corresponds to the sequence of the above indicated NCBI Reference Sequence of the IFIH1 transcript, and also relates to the corresponding amino acid sequence for example as set forth in SEQ ID NO:46, which corresponds to the protein sequence defined in NCBI Protein Accession Reference Sequence NP_071451 encoding the IFIH1 polypeptide.
-
The term "IFIH1" also comprises nucleotide sequences showing a high degree of homology to IFIH1, e.g. nucleic acid sequences being at least 75%, 80%, 85%, 90%, 91%, 92%, 93%, 94%, 95%, 96%, 97%, 98% or 99% identical to the sequence as set forth in SEQ ID NO:45 or amino acid sequences being at least 75%, 80%, 85%, 90%, 91%, 92%, 93%, 94%, 95%, 96%, 97%, 98% or 99% identical to the sequence as set forth in SEQ ID NO:46 or nucleic acid sequences encoding amino acid sequences being at least 75%, 80%, 85%, 90%, 91%, 92%, 93%, 94%, 95%, 96%, 97%, 98% or 99% identical to the sequence as set forth in SEQ ID NO:46 or amino acid sequences being encoded by nucleic acid sequences being at least 75%, 80%, 85%, 90%, 91%, 92%, 93%, 94%, 95%, 96%, 97%, 98% or 99% identical to the sequence as set forth in SEQ ID NO:45.
-
The term "IFIT1" refers to the Interferon Induced Protein With Tetratricopeptide Repeats 1 gene (Ensembl: ENSG00000185745), for example, to the sequence as defined in NCBI Reference Sequence NM_001270929 or in NCBI Reference Sequence NM_001548.5, specifically, to the nucleotide sequence as set forth in SEQ ID NO:47 or in SEQ ID NO:48, which correspond to the sequences of the above indicated NCBI Reference Sequences of the IFIT1 transcript, and also relates to the corresponding amino acid sequence for example as set forth in SEQ ID NO:49 or in SEQ ID NO:50, which correspond to the protein sequences defined in NCBI Protein Accession Reference Sequence NP_001257858 and in NCBI Protein Accession Reference Sequence NP_001539 encoding the IFIT1 polypeptide.
-
The term "IFIT1" also comprises nucleotide sequences showing a high degree of homology to IFIT1, e.g. nucleic acid sequences being at least 75%, 80%, 85%, 90%, 91%, 92%, 93%, 94%, 95%, 96%, 97%, 98% or 99% identical to the sequence as set forth in SEQ ID NO:47 or in SEQ ID NO:48 or amino acid sequences being at least 75%, 80%, 85%, 90%, 91%, 92%, 93%, 94%, 95%, 96%, 97%, 98% or 99% identical to the sequence as set forth in SEQ ID NO:49 or in SEQ ID NO:50 or nucleic acid sequences encoding amino acid sequences being at least 75%, 80%, 85%, 90%, 91%, 92%, 93%, 94%, 95%, 96%, 97%, 98% or 99% identical to the sequence as set forth in SEQ ID NO:49 or SEQ ID NO:50 or amino acid sequences being encoded by nucleic acid sequences being at least 75%, 80%, 85%, 90%, 91%, 92%, 93%, 94%, 95%, 96%, 97%, 98% or 99% identical to the sequence as set forth in SEQ ID NO:47 or in SEQ ID NO:48.
-
The term "IFIT3" refers to the Interferon Induced Protein With Tetratricopeptide Repeats 3 gene (Ensembl: ENSG00000119917), for example, to the sequence as defined in NCBI Reference Sequence NM_001031683, specifically, to the nucleotide sequence as set forth in SEQ ID NO:51, which corresponds to the sequence of the above indicated NCBI Reference Sequence of the IFIT3 transcript, and also relates to the corresponding amino acid sequence for example as set forth in SEQ ID NO:52, which corresponds to the protein sequence defined in NCBI Protein Accession Reference Sequence NP_001026853 encoding the IFIT3 polypeptide.
-
The term "IFIT3" also comprises nucleotide sequences showing a high degree of homology to IFIT3, e.g. nucleic acid sequences being at least 75%, 80%, 85%, 90%, 91%, 92%, 93%, 94%, 95%, 96%, 97%, 98% or 99% identical to the sequence as set forth in SEQ ID NO:51 or amino acid sequences being at least 75%, 80%, 85%, 90%, 91%, 92%, 93%, 94%, 95%, 96%, 97%, 98% or 99% identical to the sequence as set forth in SEQ ID NO:52 or nucleic acid sequences encoding amino acid sequences being at least 75%, 80%, 85%, 90%, 91%, 92%, 93%, 94%, 95%, 96%, 97%, 98% or 99% identical to the sequence as set forth in SEQ ID NO:52 or amino acid sequences being encoded by nucleic acid sequences being at least 75%, 80%, 85%, 90%, 91%, 92%, 93%, 94%, 95%, 96%, 97%, 98% or 99% identical to the sequence as set forth in SEQ ID NO:51.
-
The term "KIAA1549" refers to the human KIAA1549 gene (Ensembl: ENSG00000122778), for example, to the sequence as defined in NCBI Reference Sequence NM_020910 or in NCBI Reference Sequence NM_001164665, specifically, to the nucleotide sequence as set forth in SEQ ID NO:53 or in SEQ ID NO:54, which correspond to the sequences of the above indicated NCBI Reference Sequence of the KIAA1549 transcript, and also relates to the corresponding amino acid sequence for example as set forth in SEQ ID NO:55 or in SEQ ID NO:56, which correspond to the protein sequences defined in NCBI Protein Accession Reference Sequence NP_065961 and in NCBI Protein Accession Reference Sequence NP_001158137 encoding the KIAA1549 polypeptide.
-
The term "KIAA1549" also comprises nucleotide sequences showing a high degree of homology to KIAA1549, e.g. nucleic acid sequences being at least 75%, 80%, 85%, 90%, 91%, 92%, 93%, 94%, 95%, 96%, 97%, 98% or 99% identical to the sequence as set forth in SEQ ID NO:53 or in SEQ ID NO:54 or amino acid sequences being at least 75%, 80%, 85%, 90%, 91%, 92%, 93%, 94%, 95%, 96%, 97%, 98% or 99% identical to the sequence as set forth in SEQ ID NO:55 or in SEQ ID NO:56 or nucleic acid sequences encoding amino acid sequences being at least 75%, 80%, 85%, 90%, 91%, 92%, 93%, 94%, 95%, 96%, 97%, 98% or 99% identical to the sequence as set forth in SEQ ID NO:55 or in SEQ ID NO:56 or amino acid sequences being encoded by nucleic acid sequences being at least 75%, 80%, 85%, 90%, 91%, 92%, 93%, 94%, 95%, 96%, 97%, 98% or 99% identical to the sequence as set forth in SEQ ID NO:53 or in SEQ ID NO:54.
-
The term "LAT" refers to the Linker For Activation Of T-Cells gene (Ensembl: ENSG00000213658), for example, to the sequence as defined in NCBI Reference Sequence NM_001014987 or in NCBI Reference Sequence NM_014387, specifically, to the nucleotide sequence as set forth in SEQ ID NO:57 or in SEQ ID NO:58, which correspond to the sequences of the above indicated NCBI Reference Sequences of the LAT transcript, and also relates to the corresponding amino acid sequence for example as set forth in SEQ ID NO:59 or in SEQ ID NO:60, which corresponds to the protein sequences defined in NCBI Protein Accession Reference Sequence NP_001014987 and in NCBI Protein Accession Reference Sequence NP_055202 encoding the LAT polypeptide.
-
The term "LAT" also comprises nucleotide sequences showing a high degree of homology to LAT, e.g. nucleic acid sequences being at least 75%, 80%, 85%, 90%, 91%, 92%, 93%, 94%, 95%, 96%, 97%, 98% or 99% identical to the sequence as set forth in SEQ ID NO:57 or in SEQ ID NO:58 or amino acid sequences being at least 75%, 80%, 85%, 90%, 91%, 92%, 93%, 94%, 95%, 96%, 97%, 98% or 99% identical to the sequence as set forth in SEQ ID NO:59 or in SEQ ID NO:60 or nucleic acid sequences encoding amino acid sequences being at least 75%, 80%, 85%, 90%, 91%, 92%, 93%, 94%, 95%, 96%, 97%, 98% or 99% identical to the sequence as set forth in SEQ ID NO:59 or in SEQ ID NO:60 or amino acid sequences being encoded by nucleic acid sequences being at least 75%, 80%, 85%, 90%, 91%, 92%, 93%, 94%, 95%, 96%, 97%, 98% or 99% identical to the sequence as set forth in SEQ ID NO:57 or in SEQ ID NO:58.
-
The term "LCK" refers to the LCK Proto-Oncogene gene (Ensembl: ENSG00000182866), for example, to the sequence as defined in NCBI Reference Sequence NM_005356, specifically, to the nucleotide sequence as set forth in SEQ ID NO:61, which corresponds to the sequence of the above indicated NCBI Reference Sequence of the LCK transcript, and also relates to the corresponding amino acid sequence for example as set forth in SEQ ID NO:62, which corresponds to the protein sequence defined in NCBI Protein Accession Reference Sequence NP_005347 encoding the LCK polypeptide.
-
The term "LCK" also comprises nucleotide sequences showing a high degree of homology to LCK, e.g. nucleic acid sequences being at least 75%, 80%, 85%, 90%, 91%, 92%, 93%, 94%, 95%, 96%, 97%, 98% or 99% identical to the sequence as set forth in SEQ ID NO:61 or amino acid sequences being at least 75%, 80%, 85%, 90%, 91%, 92%, 93%, 94%, 95%, 96%, 97%, 98% or 99% identical to the sequence as set forth in SEQ ID NO:62 or nucleic acid sequences encoding amino acid sequences being at least 75%, 80%, 85%, 90%, 91%, 92%, 93%, 94%, 95%, 96%, 97%, 98% or 99% identical to the sequence as set forth in SEQ ID NO:62 or amino acid sequences being encoded by nucleic acid sequences being at least 75%, 80%, 85%, 90%, 91%, 92%, 93%, 94%, 95%, 96%, 97%, 98% or 99% identical to the sequence as set forth in SEQ ID NO:61.
-
The term "LRRFIP1" refers to the LRR Binding FLII Interacting Protein 1 gene (Ensembl: ENSG00000124831), for example, to the sequence as defined in NCBI Reference Sequence NM_004735 or in NCBI Reference Sequence NM_001137550 or in NCBI Reference Sequence NM_001137553 or in NCBI Reference Sequence NM_001137552, specifically, to the nucleotide sequence as set forth in SEQ ID NO:63 or in SEQ ID NO:64 or in SEQ ID NO:65 or in SEQ ID NO:66, which correspond to the sequences of the above indicated NCBI Reference Sequences of the LRRFIP1 transcript, and also relates to the corresponding amino acid sequence for example as set forth in SEQ ID NO:67 or in SEQ ID NO:68 or in SEQ ID NO:69 or in SEQ ID NO:70, which correspond to the protein sequences defined in NCBI Protein Accession Reference Sequence NP_004726 and in NCBI Protein Accession Reference Sequence NP_001131022 and in NCBI Protein Accession Reference Sequence NP_001131025 and in NCBI Protein Accession Reference Sequence NP_001131024 encoding the LRRFIP1 polypeptide.
-
The term "LRRFIP1" also comprises nucleotide sequences showing a high degree of homology to LRRFIP1, e.g. nucleic acid sequences being at least 75%, 80%, 85%, 90%, 91%, 92%, 93%, 94%, 95%, 96%, 97%, 98% or 99% identical to the sequence as set forth in SEQ ID NO:63 or in SEQ ID NO:64 or in SEQ ID NO:65 or in SEQ ID NO:66 or amino acid sequences being at least 75%, 80%, 85%, 90%, 91%, 92%, 93%, 94%, 95%, 96%, 97%, 98% or 99% identical to the sequence as set forth in SEQ ID NO:67 or in SEQ ID NO:68 or in SEQ ID NO:69 or in SEQ ID NO:70 or nucleic acid sequences encoding amino acid sequences being at least 75%, 80%, 85%, 90%, 91%, 92%, 93%, 94%, 95%, 96%, 97%, 98% or 99% identical to the sequence as set forth in SEQ ID NO:67 or in SEQ ID NO:68 or in SEQ ID NO:69 or in SEQ ID NO:70 or amino acid sequences being encoded by nucleic acid sequences being at least 75%, 80%, 85%, 90%, 91%, 92%, 93%, 94%, 95%, 96%, 97%, 98% or 99% identical to the sequence as set forth in SEQ ID NO:63 or in SEQ ID NO:64 or in SEQ ID NO:65 or in SEQ ID NO:66.
-
The term "MYD88" refers to the MYD88 Innate Immune Signal Transduction Adaptor gene (Ensembl: ENSG00000172936), for example, to the sequence as defined in NCBI Reference Sequence NM_001172567 or in NCBI Reference Sequence NM_001172568 or in NCBI Reference Sequence NM_001172569 or in NCBI Reference Sequence NM_001172566 or in NCBI Reference Sequence NM_002468, specifically, to the nucleotide sequences as set forth in SEQ ID NO:71 or in SEQ ID NO:72 or in SEQ ID NO:73 or in SEQ ID NO:74 or in SEQ ID NO:75, which correspond to the sequences of the above indicated NCBI Reference Sequences of the MYD88 transcript, and also relates to the corresponding amino acid sequence for example as set forth in SEQ ID NO:76 or in SEQ ID NO:77 or in SEQ ID NO:78 or in SEQ ID NO:79 or in SEQ ID NO:80, which correspond to the protein sequences defined in NCBI Protein Accession Reference Sequence NP_001166038 and in NCBI Protein Accession Reference Sequence NP_001166039 and in NCBI Protein Accession Reference Sequence NP_001166040 and in NCBI Protein Accession Reference Sequence NP_001166037 and in NCBI Protein Accession Reference Sequence NP_002459 encoding the MYD88 polypeptide.
-
The term "MYD88" also comprises nucleotide sequences showing a high degree of homology to MYD88, e.g. nucleic acid sequences being at least 75%, 80%, 85%, 90%, 91%, 92%, 93%, 94%, 95%, 96%, 97%, 98% or 99% identical to the sequence as set forth in SEQ ID NO:71 or in SEQ ID NO:72 or in SEQ ID NO:73 or in SEQ ID NO:74 or in SEQ ID NO:75 or amino acid sequences being at least 75%, 80%, 85%, 90%, 91%, 92%, 93%, 94%, 95%, 96%, 97%, 98% or 99% identical to the sequence as set forth in SEQ ID NO:76 or in SEQ ID NO:77 or in SEQ ID NO:78 or in SEQ ID NO:79 or in SEQ ID NO:80 or nucleic acid sequences encoding amino acid sequences being at least 75%, 80%, 85%, 90%, 91%, 92%, 93%, 94%, 95%, 96%, 97%, 98% or 99% identical to the sequence as set forth in SEQ ID NO:76 or in SEQ ID NO:77 or in SEQ ID NO:78 or in SEQ ID NO:79 or in SEQ ID NO:80 or amino acid sequences being encoded by nucleic acid sequences being at least 75%, 80%, 85%, 90%, 91%, 92%, 93%, 94%, 95%, 96%, 97%, 98% or 99% identical to the sequence as set forth in SEQ ID NO:71 or in SEQ ID NO:72 or in SEQ ID NO:73 or in SEQ ID NO:74 or in SEQ ID NO:75.
-
The term "OAS1" refers to the 2'-5'-Oligoadenylate Synthetase 1 gene (Ensembl: ENSG00000089127), for example, to the sequence as defined in NCBI Reference Sequence NM_001320151 or in NCBI Reference Sequence NM_002534 or in NCBI Reference Sequence NM_001032409 or in NCBI Reference Sequence NM_016816, specifically, to the nucleotide sequences as set forth in SEQ ID NO:81 or in SEQ ID NO:82 or in SEQ ID NO:83 or in SEQ ID NO:84, which correspond to the sequences of the above indicated NCBI Reference Sequences of the OAS1 transcript, and also relates to the corresponding amino acid sequences for example as set forth in SEQ ID NO:85 or in SEQ ID NO:86 or in SEQ ID NO:87 or in SEQ ID NO:88, which correspond to the protein sequences defined in NCBI Protein Accession Reference Sequence NP_001307080 and in NCBI Protein Accession Reference Sequence NP_002525 and in NCBI Protein Accession Reference Sequence NP_001027581 and in NCBI Protein Accession Reference Sequence NP_058132 encoding the OAS1 polypeptide.
-
The term "OAS1" also comprises nucleotide sequences showing a high degree of homology to OAS1, e.g. nucleic acid sequences being at least 75%, 80%, 85%, 90%, 91%, 92%, 93%, 94%, 95%, 96%, 97%, 98% or 99% identical to the sequence as set forth in SEQ ID NO:81 or in SEQ ID NO:82 or in SEQ ID NO:83 or in SEQ ID NO:84 or amino acid sequences being at least 75%, 80%, 85%, 90%, 91%, 92%, 93%, 94%, 95%, 96%, 97%, 98% or 99% identical to the sequence as set forth in SEQ ID NO:85 or in SEQ ID NO:86 or in SEQ ID NO:87 or in SEQ ID NO:88 or nucleic acid sequences encoding amino acid sequences being at least 75%, 80%, 85%, 90%, 91%, 92%, 93%, 94%, 95%, 96%, 97%, 98% or 99% identical to the sequence as set forth in SEQ ID NO:85 or in SEQ ID NO:86 or in SEQ ID NO:87 or in SEQ ID NO:88 or amino acid sequences being encoded by nucleic acid sequences being at least 75%, 80%, 85%, 90%, 91%, 92%, 93%, 94%, 95%, 96%, 97%, 98% or 99% identical to the sequence as set forth in SEQ ID NO:81 or in SEQ ID NO:82 or in SEQ ID NO:83 or in SEQ ID NO:84.
-
The term "PAG1" refers to the Phosphoprotein Membrane Anchor With Glycosphingolipid Microdomains 1 gene (Ensembl: ENSG00000076641), for example, to the sequence as defined in NCBI Reference Sequence NM_018440, specifically, to the nucleotide sequence as set forth in SEQ ID NO:89, which corresponds to the sequence of the above indicated NCBI Reference Sequence of the PAG1 transcript, and also relates to the corresponding amino acid sequence for example as set forth in SEQ ID NO:90, which corresponds to the protein sequence defined in NCBI Protein Accession Reference Sequence NP_060910 encoding the PAG1 polypeptide.
-
The term "PAG1" also comprises nucleotide sequences showing a high degree of homology to PAG1, e.g. nucleic acid sequences being at least 75%, 80%, 85%, 90%, 91%, 92%, 93%, 94%, 95%, 96%, 97%, 98% or 99% identical to the sequence as set forth in SEQ ID NO:89 or amino acid sequences being at least 75%, 80%, 85%, 90%, 91%, 92%, 93%, 94%, 95%, 96%, 97%, 98% or 99% identical to the sequence as set forth in SEQ ID NO:90 or nucleic acid sequences encoding amino acid sequences being at least 75%, 80%, 85%, 90%, 91%, 92%, 93%, 94%, 95%, 96%, 97%, 98% or 99% identical to the sequence as set forth in SEQ ID NO:90 or amino acid sequences being encoded by nucleic acid sequences being at least 75%, 80%, 85%, 90%, 91%, 92%, 93%, 94%, 95%, 96%, 97%, 98% or 99% identical to the sequence as set forth in SEQ ID NO:89.
-
The term "PDE4D" refers to the human Phosphodiesterase 4D gene (Ensembl: ENSG00000113448), for example, to the sequence as defined in NCBI Reference Sequence NM_001104631 or in NCBI Reference Sequence NM_001349242 or in NCBI Reference Sequence NM_001197218 or in NCBI Reference Sequence NM_006203 or in NCBI Reference Sequence NM_001197221 or in NCBI Reference Sequence NM_001197220 or in NCBI Reference Sequence NM_001197223 or in NCBI Reference Sequence NM_001165899 or in NCBI Reference Sequence NM_001165899, specifically, to the nucleotide sequence as set forth in SEQ ID NO:91 or in SEQ ID NO:92 or in SEQ ID NO:93 or in SEQ ID NO:94 or in SEQ ID NO:95 or in SEQ ID NO:96 or in SEQ ID NO:97 or in SEQ ID NO:98 or in SEQ ID NO:99, which correspond to the sequences of the above indicated NCBI Reference Sequence of the PDE4D transcript, and also relates to the corresponding amino acid sequence for example as set forth in SEQ ID NO:100 or in SEQ ID NO:101 or in SEQ ID NO:102 or in SEQ ID NO:103 or in SEQ ID NO:104 or in SEQ ID NO:105 or in SEQ ID NO:106 or in SEQ ID NO: 107 or in SEQ ID NO: 108, which correspond to the protein sequences defined in NCBI Protein Accession Reference Sequence NP_001098101 and in NCBI Protein Accession Reference Sequence NP_001336171 and in NCBI Protein Accession Reference Sequence NP_001184147 and in NCBI Protein Accession Reference Sequence NP_006194 and in NCBI Protein Accession Reference Sequence NP_001184150 and in NCBI Protein Accession Reference Sequence NP_001184149 and in NCBI Protein Accession Reference Sequence NP_001184152 and in NCBI Protein Accession Reference Sequence NP_001159371 and in NCBI Protein Accession Reference Sequence NP_001184148 encoding the PDE4D polypeptide.
-
The term "PDE4D" also comprises nucleotide sequences showing a high degree of homology to PDE4D, e.g. nucleic acid sequences being at least 75%, 80%, 85%, 90%, 91%, 92%, 93%, 94%, 95%, 96%, 97%, 98% or 99% identical to the sequence as set forth in SEQ ID NO:91 or in SEQ ID NO:92 or in SEQ ID NO:93 or in SEQ ID NO:94 or in SEQ ID NO:95 or in SEQ ID NO:96 or in SEQ ID NO:97 or in SEQ ID NO:98 or in SEQ ID NO:99 or amino acid sequences being at least 75%, 80%, 85%, 90%, 91%, 92%, 93%, 94%, 95%, 96%, 97%, 98% or 99% identical to the sequence as set forth in SEQ ID NO:100 or in SEQ ID NO:101 or in SEQ ID NO:102 or in SEQ ID NO:103 or in SEQ ID NO:104 or in SEQ ID NO:105 or in SEQ ID NO:106 or in SEQ ID NO:107 or in SEQ ID NO:108 or nucleic acid sequences encoding amino acid sequences being at least 75%, 80%, 85%, 90%, 91%, 92%, 93%, 94%, 95%, 96%, 97%, 98% or 99% identical to the sequence as set forth in SEQ ID NO: 100 or in SEQ ID NO:101 or in SEQ ID NO:102 or in SEQ ID NO:103 or in SEQ ID NO:104 or in SEQ ID NO:105 or in SEQ ID NO:106 or in SEQ ID NO:107 or in SEQ ID NO:108 or amino acid sequences being encoded by nucleic acid sequences being at least 75%, 80%, 85%, 90%, 91%, 92%, 93%, 94%, 95%, 96%, 97%, 98% or 99% identical to the sequence as set forth in SEQ ID NO:91 or in SEQ ID NO:92 or in SEQ ID NO:93 or in SEQ ID NO:94 or in SEQ ID NO:95 or in SEQ ID NO:96 or in SEQ ID NO:97 or in SEQ ID NO:98 or in SEQ ID NO:99.
-
The term "PRKACA" refers to the Protein Kinase cAMP-Activated Catalytic Subunit Alpha gene (Ensembl: ENSG00000072062), for example, to the sequence as defined in NCBI Reference Sequence NM_002730 or in NCBI Reference Sequence NM_207518, specifically, to the nucleotide sequences as set forth in SEQ ID NO:109 or in SEQ ID NO:110, which correspond to the sequences of the above indicated NCBI Reference Sequences of the PRKACA transcript, and also relates to the corresponding amino acid sequence for example as set forth in SEQ ID NO:111 or in SEQ ID NO:112, which correspond to the protein sequences defined in NCBI Protein Accession Reference Sequence NP_002721 and in NCBI Protein Accession Reference Sequence NP_997401 encoding the PRKACA polypeptide.
-
The term "PRKACA" also comprises nucleotide sequences showing a high degree of homology to PRKACA, e.g. nucleic acid sequences being at least 75%, 80%, 85%, 90%, 91%, 92%, 93%, 94%, 95%, 96%, 97%, 98% or 99% identical to the sequence as set forth in SEQ ID NO:109 or in SEQ ID NO:110 or amino acid sequences being at least 75%, 80%, 85%, 90%, 91%, 92%, 93%, 94%, 95%, 96%, 97%, 98% or 99% identical to the sequence as set forth in SEQ ID NO:111 or in SEQ ID NO:112 or nucleic acid sequences encoding amino acid sequences being at least 75%, 80%, 85%, 90%, 91%, 92%, 93%, 94%, 95%, 96%, 97%, 98% or 99% identical to the sequence as set forth in SEQ ID NO:111 or in SEQ ID NO:112 or amino acid sequences being encoded by nucleic acid sequences being at least 75%, 80%, 85%, 90%, 91%, 92%, 93%, 94%, 95%, 96%, 97%, 98% or 99% identical to the sequence as set forth in SEQ ID NO:109 or in SEQ ID NO:110.
-
The term "PRKACB" refers to the Protein Kinase cAMP-Activated Catalytic Subunit Beta gene (Ensembl: ENSG00000142875), for example, to the sequence as defined in NCBI Reference Sequence NM_002731 or in NCBI Reference Sequence NM_182948 or in NCBI Reference Sequence NM_001242860 or in NCBI Reference Sequence NM_001242859 or in NCBI Reference Sequence NM_001242858 or in NCBI Reference Sequence NM_001242862 or in NCBI Reference Sequence NM_001242861 or in NCBI Reference Sequence NM_001300915 or in NCBI Reference Sequence NM_207578 or in NCBI Reference Sequence NM_001242857 or in NCBI Reference Sequence NM_001300917, specifically, to the nucleotide sequence as set forth in SEQ ID NO:113 or in SEQ ID NO: 114 or in SEQ ID NO:115 or in SEQ ID NO:116 or in SEQ ID NO:117 or in SEQ ID NO:118 or in SEQ ID NO:119 or in SEQ ID NO:120 or in SEQ ID NO:121 or in SEQ ID NO:122 or in SEQ ID NO:123, which correspond to the sequences of the above indicated NCBI Reference Sequences of the PRKACB transcript, and also relates to the corresponding amino acid sequence for example as set forth in SEQ ID NO:124 or in SEQ ID NO:125 or in SEQ ID NO:126 or in SEQ ID NO:127 or in SEQ ID NO:128 or in SEQ ID NO:129 or in SEQ ID NO:130 or in SEQ ID NO:131 or in SEQ ID NO:132 or in SEQ ID NO:133 or in SEQ ID NO:134, which correspond to the protein sequences defined in NCBI Protein Accession Reference Sequence NP_002722 and in NCBI Protein Accession Reference Sequence NP_891993 and in NCBI Protein Accession Reference Sequence NP_001229789 and in NCBI Protein Accession Reference Sequence NP_001229788 and in NCBI Protein Accession Reference Sequence NP_001229787 and in NCBI Protein Accession Reference Sequence NP_001229791 and in NCBI Protein Accession Reference Sequence NP_001229790 and in NCBI Protein Accession Reference Sequence NP_001287844 and in NCBI Protein Accession Reference Sequence NP_997461 and in NCBI Protein Accession Reference Sequence NP_001229786 and in NCBI Protein Accession Reference Sequence NP_001287846 encoding the PRKACB polypeptide.
-
The term "PRKACB" also comprises nucleotide sequences showing a high degree of homology to PRKACB, e.g. nucleic acid sequences being at least 75%, 80%, 85%, 90%, 91%, 92%, 93%, 94%, 95%, 96%, 97%, 98% or 99% identical to the sequence as set forth in SEQ ID NO:113 or in SEQ ID NO: 114 or in SEQ ID NO:115 or in SEQ ID NO:116 or in SEQ ID NO:117 or in SEQ ID NO:118 or in SEQ ID NO:119 or in SEQ ID NO:120 or in SEQ ID NO:121 or in SEQ ID NO:122 or in SEQ ID NO:123 or amino acid sequences being at least 75%, 80%, 85%, 90%, 91%, 92%, 93%, 94%, 95%, 96%, 97%, 98% or 99% identical to the sequence as set forth in SEQ ID NO:124 or in SEQ ID NO:125 or in SEQ ID NO:126 or in SEQ ID NO:127 or in SEQ ID NO:128 or in SEQ ID NO:129 or in SEQ ID NO:130 or in SEQ ID NO:131 or in SEQ ID NO:132 or in SEQ ID NO:133 or in SEQ ID NO:134 or nucleic acid sequences encoding amino acid sequences being at least 75%, 80%, 85%, 90%, 91%, 92%, 93%, 94%, 95%, 96%, 97%, 98% or 99% identical to the sequence as set forth in SEQ ID NO:124 or in SEQ ID NO:125 or in SEQ ID NO:126 or in SEQ ID NO:127 or in SEQ ID NO:128 or in SEQ ID NO:129 or in SEQ ID NO:130 or in SEQ ID NO:131 or in SEQ ID NO:132 or in SEQ ID NO:133 or in SEQ ID NO:134 or amino acid sequences being encoded by nucleic acid sequences being at least 75%, 80%, 85%, 90%, 91%, 92%, 93%, 94%, 95%, 96%, 97%, 98% or 99% identical to the sequence as set forth in SEQ ID NO:113 or in SEQ ID NO: 114 or in SEQ ID NO:115 or in SEQ ID NO:116 or in SEQ ID NO:117 or in SEQ ID NO:118 or in SEQ ID NO:119 or in SEQ ID NO:120 or in SEQ ID NO:121 or in SEQ ID NO:122 or in SEQ ID NO:123.
-
The term "PTPRC" refers to the Protein Tyrosine Phosphatase Receptor Type C gene (Ensembl: ENSG00000081237), for example, to the sequence as defined in NCBI Reference Sequence NM_002838 or in NCBI Reference Sequence NM_080921, specifically, to the nucleotide sequence as set forth in SEQ ID NO:135 or in SEQ ID NO:136, which correspond to the sequences of the above indicated NCBI Reference Sequences of the PTPRC transcript, and also relates to the corresponding amino acid sequence for example as set forth in SEQ ID NO:137 or in SEQ ID NO:138, which correspond to the protein sequences defined in NCBI Protein Accession Reference Sequence NP_002829 encoding the PTPRC polypeptide and in NCBI Protein Accession Reference Sequence NP_563578.
-
The term "PTPRC" also comprises nucleotide sequences showing a high degree of homology to PTPRC, e.g. nucleic acid sequences being at least 75%, 80%, 85%, 90%, 91%, 92%, 93%, 94%, 95%, 96%, 97%, 98% or 99% identical to the sequence as set forth in SEQ ID NO:135 or in SEQ ID NO:136 or amino acid sequences being at least 75%, 80%, 85%, 90%, 91%, 92%, 93%, 94%, 95%, 96%, 97%, 98% or 99% identical to the sequence as set forth in SEQ ID NO:137 or in SEQ ID NO:138 or nucleic acid sequences encoding amino acid sequences being at least 75%, 80%, 85%, 90%, 91%, 92%, 93%, 94%, 95%, 96%, 97%, 98% or 99% identical to the sequence as set forth in SEQ ID NO:137 or in SEQ ID NO:138 or amino acid sequences being encoded by nucleic acid sequences being at least 75%, 80%, 85%, 90%, 91%, 92%, 93%, 94%, 95%, 96%, 97%, 98% or 99% identical to the sequence as set forth in SEQ ID NO:135 or in SEQ ID NO:136.
-
The term "RAP1GAP2" refers to the human RAP1 GTPase Activating Protein 2 gene (ENSG00000132359), for example, to the sequence as defined in NCBI Reference Sequence NM_015085 or in NCBI Reference Sequence NM_001100398 or in NCBI Reference Sequence NM_001330058, specifically, to the nucleotide sequence as set forth in SEQ ID NO:139 or in SEQ ID NO:140 or in SEQ ID NO:141, which correspond to the sequences of the above indicated NCBI Reference Sequences of the RAP1GAP2 transcript, and also relates to the corresponding amino acid sequence for example as set forth in SEQ ID NO:142 or in SEQ ID NO:143 or in SEQ ID NO:144, which correspond to the protein sequences defined in NCBI Protein Accession Reference Sequence NP_055900 and in NCBI Protein Accession Reference Sequence NP_001093868 and in NCBI Protein Accession Reference Sequence NP_001316987 encoding the RAP1GAP2 polypeptide.
-
The term "RAP1GAP2" also comprises nucleotide sequences showing a high degree of homology to RAP1GAP2, e.g. nucleic acid sequences being at least 75%, 80%, 85%, 90%, 91%, 92%, 93%, 94%, 95%, 96%, 97%, 98% or 99% identical to the sequence as set forth in SEQ ID NO:139 or in SEQ ID NO:140 or in SEQ ID NO:141 or amino acid sequences being at least 75%, 80%, 85%, 90%, 91%, 92%, 93%, 94%, 95%, 96%, 97%, 98% or 99% identical to the sequence as set forth in SEQ ID NO:142 or in SEQ ID NO:143 or in SEQ ID NO:144 or nucleic acid sequences encoding amino acid sequences being at least 75%, 80%, 85%, 90%, 91%, 92%, 93%, 94%, 95%, 96%, 97%, 98% or 99% identical to the sequence as set forth in SEQ ID NO:142 or in SEQ ID NO:143 or in SEQ ID NO:144 or amino acid sequences being encoded by nucleic acid sequences being at least 75%, 80%, 85%, 90%, 91%, 92%, 93%, 94%, 95%, 96%, 97%, 98% or 99% identical to the sequence as set forth in SEQ ID NO:139 or in SEQ ID NO:140 or in SEQ ID NO:141.
-
The term "SLC39A11" refers to the human Solute Carrier Family 39 Member 11 gene (Ensembl: ENSG00000133195), for example, to the sequence as defined in NCBI Reference Sequence NM_139177 or in NCBI Reference Sequence NM_001352692, specifically, to the nucleotide sequence as set forth in SEQ ID NO:145 or in SEQ ID NO:146, which correspond to the sequences of the above indicated NCBI Reference Sequences of the SLC39A11 transcript, and also relates to the corresponding amino acid sequence for example as set forth in SEQ ID NO:147 or in SEQ ID NO:148, which correspond to the protein sequences defined in NCBI Protein Accession Reference Sequence NP_631916 and in NCBI Protein Accession Reference Sequence NP_001339621 encoding the SLC39A11 polypeptide.
-
The term "SLC39A11" also comprises nucleotide sequences showing a high degree of homology to SLC39A11, e.g. nucleic acid sequences being at least 75%, 80%, 85%, 90%, 91%, 92%, 93%, 94%, 95%, 96%, 97%, 98% or 99% identical to the sequence as set forth in SEQ ID NO:145 or in SEQ ID NO:146 or amino acid sequences being at least 75%, 80%, 85%, 90%, 91%, 92%, 93%, 94%, 95%, 96%, 97%, 98% or 99% identical to the sequence as set forth in SEQ ID NO:147 or in SEQ ID NO:148 or nucleic acid sequences encoding amino acid sequences being at least 75%, 80%, 85%, 90%, 91%, 92%, 93%, 94%, 95%, 96%, 97%, 98% or 99% identical to the sequence as set forth in SEQ ID NO:147 or in SEQ ID NO:148 or amino acid sequences being encoded by nucleic acid sequences being at least 75%, 80%, 85%, 90%, 91%, 92%, 93%, 94%, 95%, 96%, 97%, 98% or 99% identical to the sequence as set forth in SEQ ID NO:145 or in SEQ ID NO:146.
-
The term "TDRD1" refers to the human Tudor Domain Containing 1 gene (Ensembl: ENSG00000095627), for example, to the sequence as defined in NCBI Reference Sequence NM_198795, specifically, to the nucleotide sequence as set forth in SEQ ID NO:149, which corresponds to the sequence of the above indicated NCBI Reference Sequence of the TDRD1 transcript, and also relates to the corresponding amino acid sequence for example as set forth in SEQ ID NO:150, which corresponds to the protein sequence defined in NCBI Protein Accession Reference Sequence NP_942090 encoding the TDRD1 polypeptide.
-
The term "TDRD1" also comprises nucleotide sequences showing a high degree of homology to TDRD1, e.g. nucleic acid sequences being at least 75%, 80%, 85%, 90%, 91%, 92%, 93%, 94%, 95%, 96%, 97%, 98% or 99% identical to the sequence as set forth in SEQ ID NO:149 or amino acid sequences being at least 75%, 80%, 85%, 90%, 91%, 92%, 93%, 94%, 95%, 96%, 97%, 98% or 99% identical to the sequence as set forth in SEQ ID NO:150 or nucleic acid sequences encoding amino acid sequences being at least 75%, 80%, 85%, 90%, 91%, 92%, 93%, 94%, 95%, 96%, 97%, 98% or 99% identical to the sequence as set forth in SEQ ID NO:150 or amino acid sequences being encoded by nucleic acid sequences being at least 75%, 80%, 85%, 90%, 91%, 92%, 93%, 94%, 95%, 96%, 97%, 98% or 99% identical to the sequence as set forth in SEQ ID NO:149.
-
The term "TLR8" refers to the Toll Like Receptor 8 gene (Ensembl: ENSG00000101916), for example, to the sequence as defined in NCBI Reference Sequence NM_138636 or in NCBI Reference Sequence NM_016610, specifically, to the nucleotide sequences as set forth in SEQ ID NO:151 or in SEQ ID NO:152, which correspond to the sequences of the above indicated NCBI Reference Sequences of the TLR8 transcript, and also relates to the corresponding amino acid sequences for example as set forth in SEQ ID NO:153 or in SEQ ID NO:154, which corresponds to the protein sequences defined in NCBI Protein Accession Reference Sequence NP_619542 and in NCBI Protein Accession Reference Sequence NP_057694 encoding the TLR8 polypeptide.
-
The term "TLR8" also comprises nucleotide sequences showing a high degree of homology to TLR8, e.g. nucleic acid sequences being at least 75%, 80%, 85%, 90%, 91%, 92%, 93%, 94%, 95%, 96%, 97%, 98% or 99% identical to the sequence as set forth in SEQ ID NO:151 or in SEQ ID NO:152 or amino acid sequences being at least 75%, 80%, 85%, 90%, 91%, 92%, 93%, 94%, 95%, 96%, 97%, 98% or 99% identical to the sequence as set forth in SEQ ID NO:153 or in SEQ ID NO:154 or nucleic acid sequences encoding amino acid sequences being at least 75%, 80%, 85%, 90%, 91%, 92%, 93%, 94%, 95%, 96%, 97%, 98% or 99% identical to the sequence as set forth in SEQ ID NO:153 or in SEQ ID NO:154 or amino acid sequences being encoded by nucleic acid sequences being at least 75%, 80%, 85%, 90%, 91%, 92%, 93%, 94%, 95%, 96%, 97%, 98% or 99% identical to the sequence as set forth in SEQ ID NO:151 or in SEQ ID NO:152.
-
The term "VWA2" refers to the human Von Willebrand Factor A Domain Containing 2 gene (Ensembl: ENSG00000165816), for example, to the sequence as defined in NCBI Reference Sequence NM_001320804, specifically, to the nucleotide sequence as set forth in SEQ ID NO:155, which corresponds to the sequence of the above indicated NCBI Reference Sequence of the VWA2 transcript, and also relates to the corresponding amino acid sequence for example as set forth in SEQ ID NO: 156, which corresponds to the protein sequence defined in NCBI Protein Accession Reference Sequence NP_001307733 encoding the VWA2 polypeptide.
-
The term "VWA2" also comprises nucleotide sequences showing a high degree of homology to VWA2, e.g. nucleic acid sequences being at least 75%, 80%, 85%, 90%, 91%, 92%, 93%, 94%, 95%, 96%, 97%, 98% or 99% identical to the sequence as set forth in SEQ ID NO:155 or amino acid sequences being at least 75%, 80%, 85%, 90%, 91%, 92%, 93%, 94%, 95%, 96%, 97%, 98% or 99% identical to the sequence as set forth in SEQ ID NO:156 or nucleic acid sequences encoding amino acid sequences being at least 75%, 80%, 85%, 90%, 91%, 92%, 93%, 94%, 95%, 96%, 97%, 98% or 99% identical to the sequence as set forth in SEQ ID NO:156 or amino acid sequences being encoded by nucleic acid sequences being at least 75%, 80%, 85%, 90%, 91%, 92%, 93%, 94%, 95%, 96%, 97%, 98% or 99% identical to the sequence as set forth in SEQ ID NO:155.
-
The term "ZAP70" refers to the Zeta Chain Of T-Cell Receptor Associated Protein Kinase 70 gene (Ensembl: ENSG00000115085), for example, to the sequence as defined in NCBI Reference Sequence NM_001079 or in NCBI Reference Sequence NM_207519, specifically, to the nucleotide sequences as set forth in SEQ ID NO:157 or in SEQ ID NO:158, which correspond to the sequences of the above indicated NCBI Reference Sequences of the ZAP70 transcript, and also relates to the corresponding amino acid sequence for example as set forth in SEQ ID NO:159 or in SEQ ID NO:160, which corresponds to the protein sequences defined in NCBI Protein Accession Reference Sequence NP_001070 and in NCBI Protein Accession Reference Sequence NP_997402 encoding the ZAP70 polypeptide.
-
The term "ZAP70" also comprises nucleotide sequences showing a high degree of homology to ZAP70, e.g. nucleic acid sequences being at least 75%, 80%, 85%, 90%, 91%, 92%, 93%, 94%, 95%, 96%, 97%, 98% or 99% identical to the sequence as set forth in SEQ ID NO:157 or in SEQ ID NO:158or amino acid sequences being at least 75%, 80%, 85%, 90%, 91%, 92%, 93%, 94%, 95%, 96%, 97%, 98% or 99% identical to the sequence as set forth in SEQ ID NO:159 or in SEQ ID NO:160 or nucleic acid sequences encoding amino acid sequences being at least 75%, 80%, 85%, 90%, 91%, 92%, 93%, 94%, 95%, 96%, 97%, 98% or 99% identical to the sequence as set forth in SEQ ID NO:159 or in SEQ ID NO:160 or amino acid sequences being encoded by nucleic acid sequences being at least 75%, 80%, 85%, 90%, 91%, 92%, 93%, 94%, 95%, 96%, 97%, 98% or 99% identical to the sequence as set forth in SEQ ID NO:157 or in SEQ ID NO:158.
-
The term "ZBP1" refers to the Z-DNA Binding Protein 1 gene (Ensembl: ENSG00000124256), for example, to the sequence as defined in NCBI Reference Sequence NM_030776 or in NCBI Reference Sequence NM_001160418 or in NCBI Reference Sequence NM_001160419, specifically, to the nucleotide sequence as set forth in SEQ ID NO:161 or in SEQ ID NO:162 or in SEQ ID NO:163, which corresponds to the sequence of the above indicated NCBI Reference Sequence of the ZBP1 transcript, and also relates to the corresponding amino acid sequence for example as set forth in SEQ ID NO:164 or in SEQ ID NO:165 or in SEQ ID NO:166, which corresponds to the protein sequences defined in NCBI Protein Accession Reference Sequence NP_110403 and in NCBI Protein Accession Reference Sequence NP_001153890 and in NCBI Protein Accession Reference Sequence NP_001153891 encoding the ZBP1 polypeptide.
-
The term "ZBP1" also comprises nucleotide sequences showing a high degree of homology to ZBP1, e.g. nucleic acid sequences being at least 75%, 80%, 85%, 90%, 91%, 92%, 93%, 94%, 95%, 96%, 97%, 98% or 99% identical to the sequence as set forth in SEQ ID NO:161 or in SEQ ID NO:162 or in SEQ ID NO:163 or amino acid sequences being at least 75%, 80%, 85%, 90%, 91%, 92%, 93%, 94%, 95%, 96%, 97%, 98% or 99% identical to the sequence as set forth in SEQ ID NO:164 or in SEQ ID NO:165 or in SEQ ID NO:166 or nucleic acid sequences encoding amino acid sequences being at least 75%, 80%, 85%, 90%, 91%, 92%, 93%, 94%, 95%, 96%, 97%, 98% or 99% identical to the sequence as set forth in SEQ ID NO:164 or in SEQ ID NO:165 or in SEQ ID NO:166 or amino acid sequences being encoded by nucleic acid sequences being at least 75%, 80%, 85%, 90%, 91%, 92%, 93%, 94%, 95%, 96%, 97%, 98% or 99% identical to the sequence as set forth in SEQ ID NO:161 or in SEQ ID NO:162 or in SEQ ID NO:163.
-
As provided herein the biological sample used may be collected in a clinically acceptable manner, e.g. in a way that nucleic acids (in particular RNA) or proteins are preserved.
-
The biological sample(s) may include body tissue and/or a fluid, such as, but not limited to, blood, sweat, saliva, and urine. Furthermore, the biological sample may contain a cell extract derived from or a cell population including an epithelial cell, such as a cancerous epithelial cell or an epithelial cell derived from tissue suspected to be cancerous. The biological sample may contain a cell population derived from a tissue, for example a glandular tissue, e.g. the sample may be derived from the breast of a subject. Additionally, cells may be purified from obtained body tissues and fluids if necessary, and then used as the biological sample. In some realizations, the sample may be a tissue sample, a fluid sample, a blood sample, a saliva sample, a sample including circulating tumour cells, extracellular vesicles, a sample containing breast secreted exosomes, or cell lines or cancer cell line. In one particular realization, biopsy or resections samples may be obtained and/or used. Such samples may include cells or cell lysates.
-
Therefore, in an embodiment the biological sample obtained from a subject is a biopsy. In a further preferred embodiment, the method includes providing or obtaining a biopsy. In a preferred embodiment the biopsy is a breast biopsy, for example a tissue or a fluid from the breast.
-
It is also conceivable that the content of a biological sample is submitted to an enrichment step. For instance, a sample may be contacted with ligands specific for the cell membrane or organelles of certain cell types, e.g. breast cells, functionalized for example with magnetic particles. The material concentrated by the magnetic particles may subsequently be used for detection and analysis steps as described herein above or below.
-
Furthermore, cells, e.g. tumour cells, may be enriched via filtration processes of fluid or liquid samples, e.g. blood, urine, etc. Such filtration processes may also be combined with enrichment steps based on ligand specific interactions as described herein above.
-
It is preferred that a biological sample as provided herein is obtained from the subject before the start of the therapy. It is also preferred that said biological sample is a breast sample or a breast cancer sample.
-
Thus, in a preferred embodiment the method according to the invention comprises that the biological sample is obtained from the subject before the start of the therapy, preferably wherein the biological sample is a breast sample or a breast cancer sample. Alternatively, the method according to the invention comprises providing the biological sample obtained from the subject before the start of the therapy, preferably wherein the biological sample is a breast sample or a breast cancer sample.
-
It is contemplated herein that the outcome of a breast cancer subject may be a favourable one or a non-favourable one. In one aspect of the invention a prediction of the outcome of a breast cancer subject can result in the determination of a favourable risk or a non-favourable risk of a certain one or more outcomes. The outcomes may comprise breast-cancer related death, loco-regional recurrence and/or distant recurrence. Preferably, breast-cancer related death is breast-cancer specific death. A prediction provided by the method of the invention can provide for a prediction of the risk of a breast cancer subject for a certain outcome. Moreover, the method of the invention can predict whether the subject having a breast cancer has a low risk of a certain outcome or a high risk of a certain outcome. The outcomes breast-cancer related death, loco-regional recurrence and/or distant recurrence, as used herein, comprise outcomes that are non-favourable to a subject. A further outcome is overall death. Overall death as used herein is an outcome that can be predicted by the method of the invention, but that is not directly associable with death of a subject due to the breast cancer.
-
It is preferred that the method of the invention as provided comprises that the predicting of an outcome of a breast cancer subject comprises that the prediction is a favourable risk or a non-favourable risk of breast-cancer related death, loco-regional recurrence and/or distant recurrence after surgery. In other words, surgery is performed on a breast cancer subject prior to predicting the risk of a certain outcome.
-
A breast cancer subject having a high risk (i.e. above a certain threshold) to one or more of the outcomes breast-cancer related death, loco-regional recurrence and/or distant recurrence, as predicted by the method of the invention, is contemplated to be associated with a non-favourable risk, preferably after surgery, for a respective outcome.
-
A breast cancer subject having a low risk (i.e. below or equal to a certain threshold) to one or more of the outcomes breast-cancer related death, loco-regional recurrence and/or distant recurrence, as predicted by the method of the invention, is contemplated to be associated with a favourable risk, preferably after surgery, for a respective outcome. A favourable risk may comprise a different follow-up strategy, for example a different recommended (follow-up) therapy, than a non-favourable risk for a subject. For example, a different follow-up strategy, for example a different recommended (follow-up) therapy, can be considered for a breast cancer subject, preferably who has undergone surgery of the breast (cancer), to improve survival chances for said breast cancer subject.
-
It is preferred that a therapy comprises surgery, radiotherapy, hormone therapy, cytotoxic chemotherapy and/or immunotherapy. Combination therapy in cancer, i.e. a therapy that combines two or more therapeutic methods and/or agents, for example combining radiotherapy and chemotherapy, is widely regarded as a cornerstone in treating cancer.
-
Thus, in a preferred embodiment the method according to the invention comprises that the biological sample, preferably the sample of a breast of a subject or breast cancer of a subject, is obtained prior to the start of therapy comprising surgery, radiotherapy, hormone therapy, cytotoxic chemotherapy and/or immunotherapy.
-
A non-favourable risk of an outcome is contemplated to impact the recommended therapy of said breast cancer subject associated with the non-favourable risk. In a case wherein a non-favourable risk is predicted by the method of the invention it is contemplated that the recommended therapy comprises one or more of:
- (i) radiotherapy provided earlier than is the standard; and
- (ii) radiotherapy with an increased radiation dose; and
- (iii) an adjuvant therapy, such as cytotoxic chemotherapy, immunotherapy and/or hormone therapy; and
- (iv) surgery; and
- (v) an alternative therapy that is not surgery.
-
In a preferred embodiment the method according to the invention comprises that a therapy is recommended based on the prediction, preferably the prediction on the outcome, wherein:
- if the prediction is non-favourable, the recommended therapy, preferably after surgery, comprises one or more of:
- (i) radiotherapy provided earlier than is the standard; and
- (ii) radiotherapy with an increased radiation dose; and
- (iii) an adjuvant therapy, such as cytotoxic chemotherapy, immunotherapy and/or hormone therapy; and
- (iv) surgery; and
- (v) an alternative therapy that is not surgery.
-
A favourable risk of an outcome is contemplated to impact the recommended therapy of said breast cancer subject associated with the favourable risk. In a case wherein a favourable risk is predicted by the method of the invention it is contemplated that the recommended therapy comprises one or more of:
- (vi) radical radiotherapy; and
- (vii) salvage radiotherapy; and
- (viii) salvage radiotherapy at de-escalated dose levels; and
- (ix) watchful waiting.
-
Thus, another preferred embodiment of the method according to the invention comprises that a therapy is recommended based on the prediction, wherein:
- if the prediction is favourable, the recommended therapy, preferably after surgery, comprises one or more of:
- (vi) radical radiotherapy; and
- (vii) salvage radiotherapy; and
- (viii) salvage radiotherapy at de-escalated dose levels; and
- (ix) watchful waiting.
-
In one embodiment of the invention the favourable risk or non-favourable risk of an outcome is predicted for a breast cancer subject that has undergone surgery, preferably surgery on the breast such as, but not limited to, lumpectomy, quadrantectomy, partial mastectomy, segmental mastectomy or complete mastectomy.
-
In another aspect of the invention is provided a method in accordance with the invention comprising that secondary treatment is recommended for a certain patient, preferably for a patient having a low or a high risk of suffering an outcome selected from breast-cancer specific death or overall death, wherein the recommendation is based on the prediction of the outcome of a breast cancer patient, wherein:
- if the prediction is favourable no secondary treatment is recommended; and/or
- if the prediction is non-favourable secondary treatment is recommended.
-
It is provided herein that by means of the method in accordance with the invention the effectiveness of secondary treatment can be predicted post-surgery for patients having a low- or high-risk profile. Preferably, the secondary treatment comprises one or more, more preferably all, of chemotherapy, hormone therapy and radiation therapy.
-
The method as provided herein is based on the expression levels, e.g. expression profiles, of at least one gene selected from immune defense response genes selected from the group consisting of: AIM2, APOBEC3A, CIAO1, DDX58, DHX9, IFI16, IFIH1, IFIT1, IFIT3, LRRFIP1, MYD88, OAS1, TLR8, and ZBP1, and/or T-Cell receptor signalling genes selected from the group consisting of: CD2, CD247, CD28, CD3E, CD3G, CD4, CSK, EZR, FYN, LAT, LCK, PAG1, PDE4D, PRKACA, PRKACB, PTPRC, and ZAP70, and/or PDE4D7 correlated genes selected from the group consisting of: ABCC5, CUX2, KIAA1549, PDE4D, RAP1GAP2, SLC39A11, TDRD1, and VWA2. It is appreciated that the method may be performed on an input relating to the expression levels of the one or more genes, or that determining the expression levels may be part of the method.
-
It is further envisioned that the method is performed by a processor. Therefore, in an embodiment the invention relates to a computer implemented method of predicting an outcome of a breast cancer subject.
-
It is preferred that the method for predicting the outcome of a breast cancer subject comprises determining the gene expression profile(s) of one or more, for example, 1, 2, 3, 4, 5, 6, 7, 8, 9, 10, 11, 12, 13 or all, immune defense response genes selected from the group consisting of: AIM2, APOBEC3A, CIAO1, DDX58, DHX9, IFI16, IFIH1, IFIT1, IFIT3, LRRFIP1, MYD88, OAS1, TLR8, and ZBP1, and/or of one or more, for example, 1, 2, 3, 4, 5, 6, 7, 8, 9, 10, 11, 12, 13, 14, 15, 16 or all, T-Cell receptor signalling genes selected from the group consisting of: CD2, CD247, CD28, CD3E, CD3G, CD4, CSK, EZR, FYN, LAT, LCK, PAG1, PDE4D, PRKACA, PRKACB, PTPRC, and ZAP70, and/or of one or more, for example, 1, 2, 3, 4, 5, 6, 7 or all, PDE4D7 correlated genes selected from the group consisting of: ABCC5, CUX2, KIAA1549, PDE4D, RAP1GAP2, SLC39A11, TDRD1, and VWA2.
-
In a further embodiment the method for predicting the outcome of a breast cancer subject comprises determining the gene expression profile(s) of two or more, for example, 1, 2, 3, 4, 5, 6, 7, 8, 9, 10, 11, 12, 13 or all, immune defense response genes selected from the group consisting of: AIM2, APOBEC3A, CIAO1, DDX58, DHX9, IFI16, IFIH1, IFIT1, IFIT3, LRRFIP1, MYD88, OAS1, TLR8, and ZBP1, and/or of two or more, for example, 1, 2, 3, 4, 5, 6, 7, 8, 9, 10, 11, 12, 13, 14, 15, 16 or all, T-Cell receptor signalling genes selected from the group consisting of: CD2, CD247, CD28, CD3E, CD3G, CD4, CSK, EZR, FYN, LAT, LCK, PAG1, PDE4D, PRKACA, PRKACB, PTPRC, and ZAP70, and/or of two or more, for example, 1, 2, 3, 4, 5, 6, 7 or all, PDE4D7 correlated genes selected from the group consisting of: ABCC5, CUX2, KIAA1549, PDE4D, RAP1GAP2, SLC39A11, TDRD1, and VWA2.
-
In one preferred embodiment the method according to the invention comprises that
- the one or more immune defense response genes comprise three or more, preferably, six or more, more preferably, nine or more, most preferably, all of the immune defense genes, and/or
- the one or more T-Cell receptor signalling genes comprise three or more, preferably, six or more, more preferably, nine or more, most preferably, all of the T-Cell receptor signalling genes, and/or
- the one or more PDE4D7 correlated genes comprise three or more, preferably, six or more, most preferably, all of the PDE4D7 correlated genes.
-
Thus, it is preferred that the determining the first, second and/or third gene expression profile(s) according to the method of the invention comprises the determining or receiving the result of a determination of
- three or more, preferably six or more, more preferably, nine or more, most preferably, all of the genes selected from immune defense response genes selected from the group consisting of: AIM2, APOBEC3A, CIAO1, DDX58, DHX9, IFI16, IFIH1, IFIT1, IFIT3, LRRFIP1, MYD88, OAS1, TLR8, and ZBP1,
- three or more, preferably six or more, more preferably, nine or more, most preferably, all of the genes selected from the group and/or T-Cell receptor signalling genes selected from the group consisting of: CD2, CD247, CD28, CD3E, CD3G, CD4, CSK, EZR, FYN, LAT, LCK, PAG1, PDE4D, PRKACA, PRKACB, PTPRC, and ZAP70, and/or
- three or more, preferably six or more, more preferably, nine or more, most preferably, all of the genes PDE4D7 correlated genes selected from the group consisting of: ABCC5, CUX2, KIAA1549, PDE4D, RAP1GAP2, SLC39A11, TDRD1, and VWA2.
-
In a further embodiment the method according to the invention comprises that the determining the prediction of the outcome is based on one or more immune defense response gene, one or more T-Cell receptor signalling gene and one or more PDE4D7 correlated gene. In a further embodiment the method according to the invention comprises that the determining the prediction of the outcome is based on two or more immune defense response genes, two or more T-Cell receptor signalling genes and two or more PDE4D7 correlated genes. In a further embodiment the method according to the invention comprises that the determining the prediction of the outcome is based on three or more immune defense response genes, three or more T-Cell receptor signalling genes and three or more PDE4D7 correlated genes.
-
As a first reference example, a (first) gene expression profile as embodied herein can comprise at least one, at least two, at least three immune defense response genes selected from the group consisting of: AIM2, APOBEC3A, CIAO1, DDX58, DHX9, IFI16, IFIH1, IFIT1, IFIT3, LRRFIP1, MYD88, OAS1, TLR8, and ZBP1. In one non-limiting example, the gene expression profile as embodied herein comprises the expression profiles of the genes DDX58, DHX9 and IFI16.
-
As a further reference example, a (second) gene expression profile as embodied herein can comprise at least one, at least two, at least three T-Cell receptor signalling genes selected from the group consisting of: CD2, CD247, CD28, CD3E, CD3G, CD4, CSK, EZR, FYN, LAT, LCK, PAG1, PDE4D, PRKACA, PRKACB, PTPRC, and ZAP70. In one non-limiting example, the gene expression profile as embodied herein comprises the expression profiles of the genes PRKACA, PRKACB and PTPRC.
-
As a further reference example, a (third) gene expression profile as embodied herein can comprise at least one, at least two, at least three PDE4D7 correlated genes selected from the group consisting of: ABCC5, CUX2, KIAA1549, PDE4D, RAP1GAP2, SLC39A11, TDRD1, and VWA2. In one non-limiting example, the gene expression profile as embodied herein comprises the expression profiles of the genes KIAA1549, PDE4D and RAP1GAP2.
-
As a further non-limiting reference example, a gene expression profile as provided herein may comprise a first, second and third gene expression profile, wherein the first gene expression profile comprises at least one, at least two, at least three immune defense response genes selected from the group consisting of: AIM2, APOBEC3A, CIAO1, DDX58, DHX9, IFI16, IFIH1, IFIT1, IFIT3, LRRFIP1, MYD88, OAS1, TLR8, and ZBP1, the second gene expression profile comprises at least one, at least two, at least three T-Cell receptor signalling genes selected from the group consisting of: CD2, CD247, CD28, CD3E, CD3G, CD4, CSK, EZR, FYN, LAT, LCK, PAG1, PDE4D, PRKACA, PRKACB, PTPRC, and ZAP70 and the third gene expression profile comprises at least one, at least two, at least three PDE4D7 correlated genes selected from the group consisting of: ABCC5, CUX2, KIAA1549, PDE4D, RAP1GAP2, SLC39A11, TDRD1, and VWA2.
-
In a further non-limiting reference example, a gene expression profile for the prediction of an outcome of a breast cancer can consist of the gene expression profiles of TLR8 (an IDR gene), CD2 (a TCR gene) and PDE4D (a PDE4D7 correlated gene). In another example, the gene expression profile can consist of the gene expression profiles of OAS1 and TLR8 (IDR genes), CD2 (a TCR gene) and PDE4D (a PDE4D7 correlated gene), or of the gene expression profiles of TLR8 (an IDR gene), CD2 and PTPRC (TCR genes) and PDE4D (a PDE4D7 correlated gene), or of the gene expression profiles of TLR8 (an IDR gene), CD2 (a TCR genes) and CUX2 and PDE4D (PDE4D7 correlated genes).
-
Cox proportional-hazards regression allows analysing the effect of several risk factors on time to a tested event like survival. Thereby, the risk factors maybe dichotomous or discrete variables like a risk score or a clinical stage but may also be a continuous variable like a biomarker measurement or gene expression values. The probability of the endpoint (e.g. death or disease recurrence) is called the hazard. Next to the information on whether or not the tested endpoint was reached by e.g. subject in a patient cohort (e.g. patient did die or not) also the time to the endpoint is considered in the regression analysis. The hazard is modelled as: H(t) = H0(t) · exp(w1·V1 + w2·V2 + w3·V3 + ...), where V1, V2, V3 ... are predictor variables and Ho(t) is the baseline hazard while H(t) is the hazard at any time t. The hazard ratio (HR) (or the risk to reach the event) is represented by Ln[H(t)/ H0(t)] = w1·V1 + w2·V2 + w3·V3 + ..., where the coefficients or weights w1, w2, w3 ... are estimated by the Cox regression analysis and can be interpreted in a similar manner as for logistic regression analysis.
-
Therefore in one preferred embodiment the method according to the invention comprises that the determining of the prediction of the outcome comprises combining the combination of the first gene expression profile, the combination of the second gene expression profiles and the combination of the third gene expression profiles with a regression function that has been derived from a population of breast cancer subjects.
-
In another preferred embodiment the method according to the invention comprises that the determining of the prediction of the outcome comprises:
- combining the first gene expression profiles for two or more, for example, 2, 3, 4, 5, 6, 7, 8, 9, 10, 11, 12, 13 or all, of the immune defense response genes with a regression function that has been derived from a population of breast cancer subjects, and/or
- combining the second gene expression profiles for two or more, for example, 2, 3, 4, 5, 6, 7, 8, 9, 10, 11, 12, 13, 14, 15, 16 or all, of the T-Cell receptor signalling genes with a regression function that has been derived from a population of breast cancer subjects, and/or
- combining the third gene expression profiles for two or more, for example, 2, 3, 4, 5, 6, 7 or all, of the PDE4D7 correlated genes with a regression function that has been derived from a population of breast cancer subjects.
-
In one particular realization, the prediction of the outcome is determined as follows:
where w
1 to w
14 are weights and AIM2, APOBEC3A, CIAO1, DDX58, DHX9, IFI16, IFIH1, IFIT1, IFIT3, LRRFIP1, MYD88, OAS1, TLR8, and ZBP1 are the expression levels of genes.
-
In another particular realization, the prediction of the outcome is determined as follows:
where w
15 to w
31 are weights and CD2, CD247, CD28, CD3E, CD3G, CD4, CSK, EZR, FYN, LAT, LCK, PAG1, PDE4D, PRKACA, PRKACB, PTPRC, and ZAP70 are the expression levels of genes.
-
In another particular realization, the prediction of the outcome is determined as follows:
where w
32 to w
39 are weights and ABCC5, CUX2, KIAA1549, PDE4D, RAP1GAP2, SLC39A11, TDRD1, and VWA2 are the expression levels of genes.
-
In another particular realization, the prediction of the outcome is determined as follows:
-
In another realization, the prediction of the outcome is determined as follows:
wherein w
1 to w
39 are weights and AIM2, APOBEC3A, CIAO1, DDX58, DHX9, IFI16, IFIH1, IFIT1, IFIT3, LRRFIP1, MYD88, OAS1, TLR8, ZBP1, CD2, CD247, CD28, CD3E, CD3G, CD4, CSK, EZR, FYN, LAT, LCK, PAG1, PDE4D, PRKACA, PRKACB, PTPRC, ZAP70, ABCC5, CUX2, KIAA1549, PDE4D, RAP1GAP2, SLC39A11, TDRD1, and VWA2 are the expression levels of genes.
-
The prediction of outcome may also be classified or categorized into one of at least two risk groups, based on the value of the prediction of the outcome. For example, there may be two risk groups, or three risk groups, or four risk groups, or more than four predefined risk groups.
-
Each risk group covers a respective range of (non-overlapping) values of the prediction of the outcome. For example, a risk group may indicate a probability of occurrence of a specific clinical event from 0 to <0.1 or from 0.1 to <0.25 or from 0.25 to <0.5 or from 0.5 to 1.0 or the like.
-
In a preferred embodiment the method according to the invention comprises that the determining of the prediction of the outcome is based on one or more clinical parameters obtained from the subject. As mentioned above, various measures based on one or more clinical parameters have been investigated. By predicating the prediction of the outcome upon such clinical parameter(s), it can be possible to further improve the prediction.
-
In a preferred embodiment the one or more clinical parameters at least comprises the number of tumour positive lymph nodes. More preferably the clinical parameter is the number of tumour positive lymph nodes
-
In an embodiment the determining of the prediction of the therapy response comprises combining the gene expression levels for one or more IDR genes, one or more TCR signalling genes and/or one or more PDE4D7 correlated genes with a regression function that has been derived from a population of breast cancer subjects.
-
It is further preferred that the gene expression profiles for the one or more IDR genes, one or more TCR signalling genes and/or one or more PDE4D7 correlated genes and the one or more clinical parameters obtained from the subject are combined with a regression function that had been derived from a population of breast cancer subjects.
-
It is also preferred that the one or more clinical parameters are combined with one or more of the first, second and third gene expression(s) with a regression function that is derived from a breast cancer subject population in other to provide for a method for predicting an outcome of a breast cancer subject.
-
As such, in a preferred embodiment of the method according to the invention that the determining of the outcome comprises combining one or more of:
- (i) the first gene expression profile(s) for the one or more immune defense response genes;
- (ii) the second gene expression profile(s) for the one or more T-Cell receptor signalling genes;
- (iii) the third gene expression profile(s) for the one or more PDE4D7 correlated genes, and;
- (iv) the combination of the first gene expression profiles, second gene expression profiles, the third gene expression profiles, and the one or more clinical parameters obtained from the subject with a regression function that has been derived from a population of breast cancer subjects.
-
In another particular realization, the prediction of the outcome is determined as follows:
where w
43 and w
44 are weights, BRCAI_model is the above described regression model based on the expression profiles of one or more IDR genes, one or more TCR signalling genes and/or one or more PDE4D7 correlated genes, and LN_positive represents the number of tumour positive lymph nodes.
Multi-variate Cox regression was used to create the clinical model combining the BRCAI with clinical data (number of lymph node positive).
-
An example of a suitable clinical parameter, as has been used and exemplified herein, is "LN_positive" representing the number of tumour positive lymph nodes after post-surgical pathology. A LN positive breast tumour is a tumour of the breast wherein tumour cells have spread, i.e. metastasized, to nearby lymph nodes. It is contemplated that LN positive tumours are a harbinger for subclinical metastasis of the cancer.
-
The method according to the invention may be implemented in a computer program product that may be executed on a computer. The computer program product may comprise a non-transitory computer-readable recording medium on which a control program is recorded (stored), such as a disk, hard drive, or the like. Common forms of non-transitory computer-readable media include, for example, floppy disks, flexible disks, hard disks, magnetic tape, or any other magnetic storage medium, CD-ROM, DVD, or any other optical medium, a RAM, a PROM, an EPROM, a FLASH-EPROM, or other memory chip or cartridge, or any other non-transitory medium from which a computer can read and use.
-
In a preferred embodiment the invention therefore also provides for a computer program product comprising instructions which, when the program is executed by a computer, cause the computer to carry out a method comprising:
- receiving data indicative of a first gene expression profile for each of one or more, for example, 1, 2, 3, 4, 5, 6, 7, 8, 9, 10, 11, 12, 13 or all, immune defense response genes selected from the group consisting of: AIM2, APOBEC3A, CIAO1, DDX58, DHX9, IFI16, IFIH1, IFIT1, IFIT3, LRRFIP1, MYD88, OAS1, TLR8, and ZBP1, said first gene expression profile(s) being determined in a biological sample obtained from a breast cancer subject, and/or of a second gene expression profile for each of one or more, for example, 1, 2, 3, 4, 5, 6, 7, 8, 9, 10, 11, 12, 13, 14, 15, 16 or all, T-Cell receptor signalling genes selected from the group consisting of: CD2, CD247, CD28, CD3E, CD3G, CD4, CSK, EZR, FYN, LAT, LCK, PAG1, PDE4D, PRKACA, PRKACB, PTPRC, and ZAP70, said second gene expression profile(s) being determined in a biological sample obtained from a breast cancer subject, and/or of a third gene expression profile for each of one or more, for example, 1, 2, 3, 4, 5, 6, 7 or all, PDE4D7 correlated genes selected from the group consisting of: ABCC5, CUX2, KIAA1549, PDE4D, RAP1GAP2, SLC39A11, TDRD1, and VWA2, said third gene expression profile(s) being determined in a biological sample obtained from a breast cancer subject,
- determining a prediction of an outcome of the subject based on the first gene expression profile(s), or on the second gene expression profile(s), or on the third gene expression profile(s), or on the first, second, and third gene expression profile(s), wherein said prediction is a favourable risk or a non-favourable risk of breast-cancer related death, loco-regional recurrence and/or distant recurrence.
-
Alternatively, the one or more steps of the method may be implemented in transitory media, such as a transmittable carrier wave in which the control program is embodied as a data signal using transmission media, such as acoustic or light waves, such as those generated during radio wave and infrared data communications, and the like.
-
The exemplary method may be implemented on one or more general purpose computers, special purpose computer(s), a programmed microprocessor or microcontroller and peripheral integrated circuit elements, an ASIC or other integrated circuit, a digital signal processor, a hardwired electronic or logic circuit such as a discrete element circuit, a programmable logic device such as a PLD, PLA, FPGA, Graphical card CPU (GPU), or PAL, or the like. In general, any device, capable of implementing a finite state machine that is in turn capable of implementing the steps described herein can be used to implement one or more steps of the method of risk stratification for therapy selection in a patient with breast cancer is illustrated. As will be appreciated, while the steps of the method may all be computer implemented, in some embodiments one or more of the steps may be at least partially performed manually.
-
It is preferred herein that the computer program product according to the invention can be implemented on an apparatus for predicting an outcome of a breast cancer subject, wherein the apparatus comprises an input adapted to receive data indicative of gene expression profile(s) of immune defense response genes and/or T-Cell receptor signalling genes and/or PDE4D7 correlated genes, and wherein said apparatus further comprises a processor adapted to determine the prediction of an outcome based on said one or more gene expression profile(s), and - optionally, a providing unit adapted to provide the prediction or provide a therapy recommendation based on the selection to a medical caregiver or to the subject.
-
In a further aspect of the present invention is provided for an apparatus for predicting an outcome of a breast cancer subject, comprising:
- an input adapted to receive data indicative of a gene expression profile for:
- each of one or more, for example, 1, 2, 3, 4, 5, 6, 7, 8, 9, 10, 11, 12, 13 or all, immune defense response genes selected from the group consisting of: AIM2, APOBEC3A, CIAO1, DDX58, DHX9, IFI16, IFIH1, IFIT1, IFIT3, LRRFIP1, MYD88, OAS1, TLR8, and ZBP1,
- each of one or more, for example, 1, 2, 3, 4, 5, 6, 7, 8, 9, 10, 11, 12, 13, 14, 15, 16 or all, T-Cell receptor signalling genes selected from the group consisting of: CD2, CD247, CD28, CD3E, CD3G, CD4, CSK, EZR, FYN, LAT, LCK, PAG1, PDE4D, PRKACA, PRKACB, PTPRC, and ZAP70, and/or
- each of one or more, for example, 1, 2, 3, 4, 5, 6, 7 or all, PDE4D7 correlated genes selected from the group consisting of: ABCC5, CUX2, KIAA1549, PDE4D, RAP1GAP2, SLC39A11, TDRD1, and VWA2;
said gene expression profiles being determined in a biological sample obtained from the subject, - a processor adapted to determine the prediction of the radiotherapy response based on the gene expression profile(s) for the three or more genes, and
- optionally, a providing unit adapted to provide the prediction or a therapy recommendation based on the prediction to a medical caregiver or the subject.
-
The computer program instructions may also be loaded onto a computer, other programmable data processing apparatus, or other devices to cause a series of operational steps to be performed on the computer, other programmable apparatus or other devices to produce a computer implemented process such that the instructions which execute on the computer or other programmable apparatus provide processes for implementing the functions/acts specified herein.
-
In a preferred embodiment the invention therefore also provides for a diagnostic kit, comprising at least one polymerase chain reaction primer, and optionally at least one probes, for determining the gene expression profile(s) in a biological sample obtained from a breast cancer subject and/or in a sample.
-
It is preferred that said diagnostic kit as provided herein comprises at least one polymerase chain reaction primer, and optionally at least one probes, for determining the gene expression profile(s) for:
- each of one or more, for example, 1, 2, 3, 4, 5, 6, 7, 8, 9, 10, 11, 12, 13 or all, immune defense response genes selected from the group consisting of: AIM2, APOBEC3A, CIAO1, DDX58, DHX9, IFI16, IFIH1, IFIT1, IFIT3, LRRFIP1, MYD88, OAS1, TLR8, and ZBP1,
- each of one or more, for example, 1, 2, 3, 4, 5, 6, 7, 8, 9, 10, 11, 12, 13, 14, 15, 16 or all, T-Cell receptor signalling genes selected from the group consisting of: CD2, CD247, CD28, CD3E, CD3G, CD4, CSK, EZR, FYN, LAT, LCK, PAG1, PDE4D, PRKACA, PRKACB, PTPRC, and ZAP70, and/or
- each of one or more, for example, 1, 2, 3, 4, 5, 6, 7 or all, PDE4D7 correlated genes selected from the group consisting of: ABCC5, CUX2, KIAA1549, PDE4D, RAP1GAP2, SLC39A11, TDRD1, and VWA2.
-
In another preferred embodiment the invention provides for the use of a diagnostic kit as broadly embodied herein in a method of predicting an outcome of a breast cancer subject, preferably for use in the method for predicting the outcome of a breast cancer subject as broadly embodied herein.
-
In another preferred embodiment the invention provides for a method, comprising:
- receiving a biological sample obtained from a breast cancer subject,
- using the diagnostic kit, as broadly embodied herein, to determine the gene expression profile(s) for:
- each of one or more, for example, 1, 2, 3, 4, 5, 6, 7, 8, 9, 10, 11, 12, 13 or all, immune defense response genes selected from the group consisting of: AIM2, APOBEC3A, CIAO1, DDX58, DHX9, IFI16, IFIH1, IFIT1, IFIT3, LRRFIP1, MYD88, OAS1, TLR8, and ZBP1,
- each of one or more, for example, 1, 2, 3, 4, 5, 6, 7, 8, 9, 10, 11, 12, 13, 14, 15, 16 or all, T-Cell receptor signalling genes selected from the group consisting of: CD2, CD247, CD28, CD3E, CD3G, CD4, CSK, EZR, FYN, LAT, LCK, PAG1, PDE4D, PRKACA, PRKACB, PTPRC, and ZAP70, and/or
- each of one or more, for example, 1, 2, 3, 4, 5, 6, 7 or all, PDE4D7 correlated genes selected from the group consisting of: ABCC5, CUX2, KIAA1549, PDE4D, RAP1GAP2, SLC39A11, TDRD1, and VWA2, in a biological sample obtained from a breast cancer subject and/or in a sample.
-
All references cited herein, including journal articles or abstracts, published or corresponding patent applications, patents, or any other references, are entirely incorporated by reference herein, including all data, tables, figures, and text presented in the cited references. Additionally, the entire contents of the references cited within the references cited herein are also entirely incorporated by references.
-
Reference to known method steps, conventional methods steps, known methods or conventional methods is not in any way an admission that any aspect, description or embodiment of the present invention is disclosed, taught or suggested in the relevant art.
-
It is to be understood that the phraseology or terminology herein is for the purpose of description and not of limitation, such that the terminology or phraseology of the present specification is to be interpreted by the skilled artisan in light of the teachings and guidance presented herein, in combination with the knowledge of one of ordinary skill in the art.
-
It will be understood that all details, embodiments and preferences discussed with respect to one aspect of embodiment of the invention is likewise applicable to any other aspect or embodiment of the invention and that there is therefore not need to detail all such details, embodiments and preferences for all aspect separately.
-
Having now generally described the invention, the same will be more readily understood through reference to the following examples which is provided by way of illustration and is not intended to be limiting of the present invention. Further aspects and embodiments will be apparent to those skilled in the art.
-
Other variations to the disclosed realizations can be understood and effected by those skilled in the art in practicing the claimed invention, from a study of the drawings, the disclosure, and the appended claims.
-
Any reference signs in the claims should not be construed as limiting the scope.
EXAMPLES
Example 1: Predicting the outcome for breast cancer subjects
-
Two data sets were used for the analysis of the three gene signatures. The METABRIC data set as used herein contains information for 3.240 patients. The tumours of these patients represent different histological types. The TCGA data set as used herein contains information for 1.086 patients. The tumours of these patients represent different histological types.
-
The TCGA (The Genome Cancer Atlas) created gene expression data together with clinical and survival data was downloaded from the database TCGA Breast Invasive Carcinoma, Firehose legacy, accessed March 6, 2020. The METABRIC gene expression data was downloaded from the European Genome-Phenome Archive. The clinical and survival data was downloaded from the supplementary information (
Curtis et al; Nature, 2012). For both data sets the gene expression values were presented as log2 data. For both data sets (TCGA, METABRIC) the log2_expression values for each gene were transformed into z-scores by calculating:
-
Where log2_gene is the log2 gene expression value per gene; mean_samples is the mathematical mean of log2_gene values across all samples and stdev_samples is the standard deviation of the log2_gene values across all samples.
-
This process distributes the transformed log2_gene values around the mean 0 with a standard deviation of 1. For the multivariate analysis of the genes of interest the log2_gene transformed z-score value of each gene as input as used. The reference genes as shown in Tables 1 ― 3 were selected.
Cox Regression Analysis
-
Provided herein is a test to assess whether the combination of the 14 immune defense response genes, the combination of the 17 T-Cell receptor signalling genes, the combination of the 8 PDE4D7 correlated genes, and a combination thereof will exhibit a prognostic value for breast cancer. By using Cox regression, the expression levels of the 14 immune defense response genes, of the 17 T-Cell receptor signalling genes, and of the eight PDE4D7 correlated genes, respectively, were modelled to overall survival.
-
For the modelling a METABRIC (Study ID: EGAS00000000083) cohort of 3.240 breast cancer subjects and a TCGA cohort was selected of 1.086 breast cancer subjects. Subjects of the METABRIC cohort were divided based on the histological breast cancer type (See Table 4). Subjects of the TCGA cohort (The Cancer Genome Atlas) were divided based on the histological breast cancer type (see Table 5).
Table 4: METABRIC cohort | Histological cancer type | #Subjects | % |
| Invasive Ductal Carcinoma (IDC) | 2578 | 79,6 |
| IDC + Invasive Lobular Carcinoma | 119 | 3,7 |
| IDC + Medullary Carcinoma | 60 | 1,9 |
| IDC + Mucinous Carcinoma | 68 | 2,1 |
| IDC + Tubular Carcinoma | 82 | 2,5 |
| Invasive Lobular Carcinoma | 267 | 8,2 |
| Others | 66 | 2,0 |
| Total | 3.240 | 100 |
Table 5: TCGA cohort | Histological cancer type | #Subjects | % |
| Infiltrating Ductal Carcinoma | 775 | 74,1 |
| Infiltrating Lobular Carcinoma | 203 | 18,7 |
| Medullary Carcinoma | 6 | 0,6 |
| Metaplastic Carcinoma | 9 | 0,8 |
| Mucinous Carcinoma | 17 | 1,6 |
| Mixed Histology | 29 | 2,7 |
| Others | 47 | 4,3 |
| Total | 1.086 | 100 |
-
Next, based on additional features the METABRIC subjects and TCGA subjects were analysed. Only samples with complete available data on Histology (grade, lymph nodes), TNM (pathology T, lymph node, metastases), NPI (Nottingham Prognostic Index), Molecular (ER, PR, Her2, PAM50) and Survival (disease- and non-cause specific) were included.
-
From this subset a total number of 1.950 METABRIC subjects was included, based on complete available data for PAM50, survival, and clinical annotations, and gene expression, and a total number of 1.086 TCGA subjects was included.
-
The 1.950 METABRIC subjects were split into two sub-cohorts with complete data for a training cohort (997 patients) and a testing cohort (953 patients)
-
The 1.086 TCGA subjects were analysed on complete PAM50 & survival data and were subsequently split into two groups based on the presence of clinical annotation data. Two sub-cohorts with complete data for the validation of the BRCAI model (Group 1), and the validation of the BRCAI_clinical model (Group 2) were created. Group 1 contains 673 subjects, group 2 (clinical annotation group) contains 563 subjects. The two models (BRCAI, and BRCAI clinical) as developed on the METABRIC discovery cohort were tested with Kaplan Meier analysis on the TCGA cohort using the same cut-offs as for the analysis of the METABRIC data.
-
The Cox regression functions were derived as follows:
The details for the weights w
1 to w
39 are shown in the following Table 6.
Table 6: Variables and weights for the three individual Cox regression models, i.e. the immune defense response model (IDR_model), the T-Cell receptor signalling model (TCR SIGNALING model), and the PDE4D7 correlation model (PDE4D7_CORR_model) for breast cancer; N/A - not available. | Variable | | Weights |
| Model | | IDR_model | TCR_ SIGNALING_ model | PDE4D7_ CORR_model |
| AIM2 | w1 | 0,231 | N/A | N/A |
| APOBEC3A | w2 | 0,03163 | N/A | N/A |
| CIAO1 | w3 | -0,08348 | N/A | N/A |
| DDX58 | w4 | -0,2224 | N/A | N/A |
| DHX9 | w5 | 0,03571 | N/A | N/A |
| IFI16 | w6 | 0,2619 | N/A | N/A |
| IFIH1 | w7 | 0,01382 | N/A | N/A |
| IFIT1 | w8 | -0,2982 | N/A | N/A |
| IFIT3 | w9 | 0,1602 | N/A | N/A |
| LRRFIP1 | w10 | -0,0496 | N/A | N/A |
| MYD88 | w11 | 0,07103 | N/A | N/A |
| OAS1 | w12 | 0,2112 | N/A | N/A |
| TLR8 | w13 | -0,2463 | N/A | N/A |
| ZBP1 | w14 | -0,2744 | N/A | N/A |
| CD2 | w15 | N/A | -0,03956 | N/A |
| CD247 | w16 | N/A | 0,2675 | N/A |
| CD28 | w17 | N/A | -0,02792 | N/A |
| CD3E | w18 | N/A | -0,06229 | N/A |
| CD3G | w19 | N/A | 0,08333 | N/A |
| CD4 | w20 | N/A | -0,00325 | N/A |
| CSK | W21 | N/A | 0,2273 | N/A |
| EZR | W22 | N/A | 0,2301 | N/A |
| FYN | W23 | N/A | 0,01201 | N/A |
| LAT | W24 | N/A | -0,1592 | N/A |
| LCK | W25 | N/A | -0,1238 | N/A |
| PAG1 | W26 | N/A | -0,02231 | N/A |
| PDE4D | W27 | N/A | 0,03062 | N/A |
| PRKACA | W28 | N/A | 0,02417 | N/A |
| PRKACB | W29 | N/A | -0,05933 | N/A |
| PTPRC | w30 | N/A | 0,0785 | N/A |
| ZAP70 | W31 | N/A | -0,125 | N/A |
| ABCC5 | W32 | N/A | N/A | 0,09069 |
| CUX2 | W33 | N/A | N/A | 0,04181 |
| KIAA1549 | W34 | N/A | N/A | 0,0896 |
| PDE4D | W35 | N/A | N/A | 0,03037 |
| RAP1GAP2 | W36 | N/A | N/A | 0,07512 |
| SLC39A11 | W37 | N/A | N/A | 0,051 |
| TDRD1 | W38 | N/A | N/A | 0,04359 |
| VWA2 | w39 | N/A | N/A | -0,1281 |
-
The log2 expression data for the genes of the PDE4D7_CORR_model, the IDR_14_model, and the TCR_17_model were transformed into z-scores for the discovery and the validation sets. The z-scores for each gene signature were combined for the training set with multi-variate Cox regression analysis using disease specific death as a clinical endpoint to build a PDE4D7_CORR model, an IDR_14 model, and a TCR_17 model. The Breast Cancer ImmunoScore (BRCAI) was built by modelling breast cancer overall death with the three gene models. The BRCAI Score was built on the METABRIC (MB) discovery cohort and tested on the METABRIC validation cohort and on the TCGA validation cohort. The clinical endpoint tested in Multivariate Cox regression was overall death. As input for the Multivariate Cox regression analysis the IDR, TCR, and PDE4D7_CORR signature scores as derived from the individual Cox regression models were used. This results in the final BRCAI risk score.
-
The Cox regression functions were derived as follows:
-
The BRCAI _Clinical Score was built on the METABRIC (MB) discovery cohort and tested on the METABRIC validation cohort and on the TCGA validation cohort. The clinical endpoint tested in MV Cox regression was overall death. As input for the MV Cox regression analysis the IDR, TCR, and PDE4D7_CORR signature scores as derived from the individual Cox regression models were used, as well as the number of tumour positive lymph nodes (LN_positive) as determined in post-surgical pathology. This results in the final BRCAI_Clinical Score.
The details for the weights w
40 to w
44 are shown in the following table 7. BRCAI_Clinical_model is herein also referred to as BRCAI&Clinical_model.
Table 7: Variables and weights for two combination Cox regression models, i.e. breast cancer AI model (BRCAI_model) and the breast & clinical model (BRCAI&Clinical_model); N/A - not available. | Variable | Weights |
| Model | | BRCAI_model | BRCAI&Clinical_model |
| IDR_14_model | w |
| 40 | 0,4665 | N/A |
| TCR_17_model | w |
| 41 | 0,6397 | N/A |
| PDE47_CORR_model | w |
| 42 | 0,5022 | N/A |
| BRCAI model | w43 | N/A | 0,8914 |
| LN_positive | w44 | N/A | 0,07914 |
Kaplan-Meier Survival Analysis
-
The three individual Cox regression models (IDR_14_model, TCR_17_model, PDE4D7_CORR_model) and two combination models in Kaplan-Meier survival analysis were tested. Different clinical endpoints were tested (breast cancer specific death; overall death; loco-regional relapse, distant metastases). The two models (BRCAI, and BRCAI&Clinical) as developed on the METABRIC discovery cohort were tested with Kaplan Meier analysis on the TCGA cohort.
-
For Kaplan-Meier survival curve analysis, the Cox functions of the risk models (IDR_14_model, TCR_17_model, PDE4D7_CORR_model, BRCAI_model, BCAI&Clinical_model) were categorized into two sub-cohorts based on a cut-off. The threshold for group separation into low and high risk was based on the risk to experience the clinical endpoint (outcome) as predicted by the respective Cox regression model.
-
Figures 1 ― 18 display the Kaplan-Meier survival curve analyses of the METABRIC training cohort.
-
Figures 19 - 33 display the Kaplan-Meier survival curve analyses of the METABRIC validation cohort.
-
Figures 34 - 40 display the Kaplan-Meier survival curve analyses of the TCGA validation cohort.
-
In the METABRIC training cohort the patient classes represent a low risk or a high risk of a subject to experience the tested clinical endpoints of breast cancer specific death after surgery (Figs. 1 -5), death (Death) after surgery (Figs. 6 - 7), loco-regional relapse (Figs. 8 - 9) and distant relapse (Figs. 10 - 11) for the created risk models (IDR_14_model, TCR_17 model, PDE4D7_CORR_model, BRCAI model, BCAI&Clinical_model).
-
In the METABRIC validation cohort the patient classes represent a low risk or a high risk of a subject to experience the tested clinical endpoints of breast cancer specific death after surgery (Figs. 19 - 20), death (Death) after surgery (Figs. 21 - 22), loco-regional relapse (Figs. 23 - 24) or distant relapse (Figs. 25 - 26) for the created risk models (BRCAI model, BCAI&Clinical_model).
-
In the TCGA validation cohort the patient classes represent a low risk or a high risk of a subject to experience the tested clinical endpoints of overall death (Death) after surgery (Figs. 34 - 35 ) for the created risk models (BRCAI model, BCAI&Clinical_model).
-
The Kaplan-Meier analyses as shown in the one or more Figs. 1 ― 5, Figs. 6 - 11, Figs. 19 - 26 and Fig. 34 - 35 demonstrate that an outcome, e.g. selected from breast cancer specific death; overall death; loco-regional relapse and distant metastases, of a breast cancer subject can be predicted. By using risk models, that are based on a randomly selected combinations of genes as provided herein, is provided for an improved prediction of the outcome of a breast cancer subject. The prediction of the outcome improves therapy selection and potentially survival. By using the herein developed risk model, it can be expected to improve the prediction of the effectiveness of therapy options post-surgery in said subject. Further, this would reduce suffering for those patients who would be spared ineffective therapy and would reduce cost spent on ineffective therapies. Overall, based on the models comprising the variables and weights of genes as presented herein, an outcome of a breast cancer subject can be methodologically, for example through distinguishing the risk of a particular outcome in different patient risk groups by means of stratification and statistical methodology, predicted.
Example 2: Predicting an outcome in PAM50 breast cancer subtypes.
Cox regression models
-
Provided herein is a test whether the BRCAI_Clinical_model exhibits a prognostic method for determining the outcome of various PAM50 subtypes. Different clinical endpoints were tested: breast cancer specific death in PAM50 subtypes and overall death in PAM50 subtypes.
Table 8: Variables and weights for a combination Cox regression model, i.e. the breast cancer & clinical model (BRCAI&Clinical_model). | Variable | Weights |
| Model | | BRCAI&Clinical_model |
| BRCAI model | W | 43 | 0,8914 |
| LN_positive | W | 44 | 0,07914 |
Kaplan-Meier Survival Analysis
-
For Kaplan-Meier survival curve analysis in a first experiment the PAM50 subtypes were plotted for the outcome breast-cancer specific death and overall death. The training cohort of 997 subjects (METABRIC), the validation cohort of 975 subjects (METABRIC) and the validation cohort of 563 subjects (TCGA) were categorized in five sub-cohorts based on the respective PAM50 subtypes, i.e. Basal (basal-like), Her2 (Her2-enriched), LumA (Luminal A), LumB (Luminal B), Normal (normal breast cancer subtype).
-
Survival based on the outcome of breast cancer specific death (Figure 12 and Figure 27) or overall death (Figure 13 (METABRIC), Figure 28 (METABRIC) and Figure 36 (TCGA) was plotted for the separate subjects comprising the respective subtypes.
-
Further, each PAM50 subtype was separately selected as a sub-cohort. The Cox function of the risk model BRCAI_Clinical_model was categorized into two sub-cohorts, i.e. into sub-cohorts displaying a low risk of the respective outcome or a high risk of the respective outcome, based on a cut-off. Figures 14 - 18 show Kaplan-Meier survival curve analyses for the training cohort based on the outcome: breast-cancer specific death for each sub-cohort of a PAM50 subtype. Figures 29 - 33 show Kaplan-Meier survival curve analyses for the validation cohort based on the outcome: breast-cancer specific death for each sub-cohort of a PAM50 subtype. Figures 37 - 40 show Kaplan-Meier survival curve analyses for the validation cohort based on the outcome: overall death for each sub-cohort of a PAM50 subtype.
-
It is herein demonstrated that an outcome, for example breast cancer specific death and/or overall death, of a subject having a breast cancer that is identified as a PAM50 subtype can be predicted by using risk models that are based on randomly selected combinations of genes as provided herein in combination with one or more clinical parameters, e.g. LN positive.
-
An improved prediction of the outcome of a subject will improve therapy selection and potentially survival having a breast cancer that is identified as a certain PAM50 subtype. By using the herein developed risk model, it can be expected to improve the prediction of the effectiveness of therapy options post-surgery in said subject. Further, this would reduce suffering for those patients who would be spared ineffective therapy and would reduce cost spent on ineffective therapies.
Example 3: Predicting the outcome for breast cancer subjects after secondary Chemo- Hormone-, and Radiation-therap
Cox regression analysis
-
Provided herein is provided a propensity-matched analysis to test and quantify the risk of an outcome of secondary treatment consisting of chemo-, hormone-, and radiation-therapy after surgery in breast cancer subjects. A sub cohort of 186 breast cancer subjects was selected from the METABRIC cohort. The sub cohort was split into two groups based on a stratification into subjects having a low risk (#60) or high risk (#125). Different clinical endpoints were tested: breast cancer specific death in; overall death. Variables and weights of the Cox regression model are shown in Table 9.
Table 9: Variables and weights for a combination Cox regression model, i.e. the breast cancer & clinical model (BRCAI&Clinical_model). | Variable | Weights |
| Model | | BRCAI&Clinical_model |
| BRCAI model | W | 43 | 0,8914 |
| LN_positive | W | 44 | 0,07914 |
Kaplan Meier curve analysis
-
Kaplan Meier survival curve analysis provided a segregation of subjects into two separate groups. Per Kaplan Meier analysis provided is for one group having received no secondary treatment and one group having received the secondary treatment. Results are shown in the Figs. 41 - 44. Survival is shown in the respective figures.
-
Figures 41 - 42 display the Kaplan-Meier survival curve analyses of the METABRIC low risk and high risk cohorts having the endpoint of breast cancer-specific death.
-
Figures 43 - 44 display the Kaplan-Meier survival curve analyses of the METABRIC low risk and high risk cohorts having the endpoint of overall death.
-
It is herein demonstrated that an outcome of a low risk and/or a high risk subject having a breast cancer after administering all secondary treatments or no secondary treatments can be predicted by using the method of the invention. Said secondary treatments comprise the administration of chemotherapy, hormone therapy and radiotherapy to the subject.
-
An improved prediction of the outcome of a subject will improve secondary treatment selection and potentially improve survival of subjects having a breast cancer. By using the herein developed risk model, it can be expected to improve the prediction of the effectiveness of secondary treatment options post-surgery in a subject. Further, this model also will reduce suffering for those patients who would be spared ineffective secondary treatment and would reduce cost spent on ineffective secondary treatments.
The attached Sequence Listing, entitled 2021PF00566 SEQ LIST_ST25.txt, is incorporated herein by reference, in its entirety.
-