EP4176814A1 - Method and device for monitoring a flow of a fluid in a vessel - Google Patents
Method and device for monitoring a flow of a fluid in a vessel Download PDFInfo
- Publication number
- EP4176814A1 EP4176814A1 EP22205610.3A EP22205610A EP4176814A1 EP 4176814 A1 EP4176814 A1 EP 4176814A1 EP 22205610 A EP22205610 A EP 22205610A EP 4176814 A1 EP4176814 A1 EP 4176814A1
- Authority
- EP
- European Patent Office
- Prior art keywords
- vessel
- image
- image data
- data set
- subset
- Prior art date
- Legal status (The legal status is an assumption and is not a legal conclusion. Google has not performed a legal analysis and makes no representation as to the accuracy of the status listed.)
- Pending
Links
- 238000000034 method Methods 0.000 title claims abstract description 37
- 239000012530 fluid Substances 0.000 title claims abstract description 32
- 238000012544 monitoring process Methods 0.000 title claims abstract description 13
- 239000011800 void material Substances 0.000 claims abstract description 5
- 241000124008 Mammalia Species 0.000 claims description 3
- 238000013528 artificial neural network Methods 0.000 claims description 3
- 210000004351 coronary vessel Anatomy 0.000 description 61
- 239000000994 contrast dye Substances 0.000 description 21
- 230000002526 effect on cardiovascular system Effects 0.000 description 4
- 239000008280 blood Substances 0.000 description 3
- 210000004369 blood Anatomy 0.000 description 3
- 230000002093 peripheral effect Effects 0.000 description 3
- 238000004458 analytical method Methods 0.000 description 2
- 210000000709 aorta Anatomy 0.000 description 2
- 210000001367 artery Anatomy 0.000 description 2
- 238000003384 imaging method Methods 0.000 description 2
- 238000013186 photoplethysmography Methods 0.000 description 2
- 230000002966 stenotic effect Effects 0.000 description 2
- 210000003484 anatomy Anatomy 0.000 description 1
- 238000013473 artificial intelligence Methods 0.000 description 1
- 238000009530 blood pressure measurement Methods 0.000 description 1
- 210000004204 blood vessel Anatomy 0.000 description 1
- 210000001124 body fluid Anatomy 0.000 description 1
- 239000010839 body fluid Substances 0.000 description 1
- 230000000747 cardiac effect Effects 0.000 description 1
- 210000000748 cardiovascular system Anatomy 0.000 description 1
- 238000002591 computed tomography Methods 0.000 description 1
- 238000011010 flushing procedure Methods 0.000 description 1
- 230000006870 function Effects 0.000 description 1
- 239000007788 liquid Substances 0.000 description 1
- 230000002107 myocardial effect Effects 0.000 description 1
- 230000003287 optical effect Effects 0.000 description 1
- 230000010412 perfusion Effects 0.000 description 1
- 230000000737 periodic effect Effects 0.000 description 1
- 230000002792 vascular Effects 0.000 description 1
Images
Classifications
-
- A—HUMAN NECESSITIES
- A61—MEDICAL OR VETERINARY SCIENCE; HYGIENE
- A61B—DIAGNOSIS; SURGERY; IDENTIFICATION
- A61B6/00—Apparatus or devices for radiation diagnosis; Apparatus or devices for radiation diagnosis combined with radiation therapy equipment
- A61B6/50—Apparatus or devices for radiation diagnosis; Apparatus or devices for radiation diagnosis combined with radiation therapy equipment specially adapted for specific body parts; specially adapted for specific clinical applications
- A61B6/504—Apparatus or devices for radiation diagnosis; Apparatus or devices for radiation diagnosis combined with radiation therapy equipment specially adapted for specific body parts; specially adapted for specific clinical applications for diagnosis of blood vessels, e.g. by angiography
-
- A—HUMAN NECESSITIES
- A61—MEDICAL OR VETERINARY SCIENCE; HYGIENE
- A61B—DIAGNOSIS; SURGERY; IDENTIFICATION
- A61B6/00—Apparatus or devices for radiation diagnosis; Apparatus or devices for radiation diagnosis combined with radiation therapy equipment
- A61B6/48—Diagnostic techniques
- A61B6/481—Diagnostic techniques involving the use of contrast agents
-
- A—HUMAN NECESSITIES
- A61—MEDICAL OR VETERINARY SCIENCE; HYGIENE
- A61B—DIAGNOSIS; SURGERY; IDENTIFICATION
- A61B6/00—Apparatus or devices for radiation diagnosis; Apparatus or devices for radiation diagnosis combined with radiation therapy equipment
- A61B6/48—Diagnostic techniques
- A61B6/486—Diagnostic techniques involving generating temporal series of image data
-
- A—HUMAN NECESSITIES
- A61—MEDICAL OR VETERINARY SCIENCE; HYGIENE
- A61B—DIAGNOSIS; SURGERY; IDENTIFICATION
- A61B6/00—Apparatus or devices for radiation diagnosis; Apparatus or devices for radiation diagnosis combined with radiation therapy equipment
- A61B6/52—Devices using data or image processing specially adapted for radiation diagnosis
- A61B6/5211—Devices using data or image processing specially adapted for radiation diagnosis involving processing of medical diagnostic data
- A61B6/5217—Devices using data or image processing specially adapted for radiation diagnosis involving processing of medical diagnostic data extracting a diagnostic or physiological parameter from medical diagnostic data
-
- A—HUMAN NECESSITIES
- A61—MEDICAL OR VETERINARY SCIENCE; HYGIENE
- A61B—DIAGNOSIS; SURGERY; IDENTIFICATION
- A61B6/00—Apparatus or devices for radiation diagnosis; Apparatus or devices for radiation diagnosis combined with radiation therapy equipment
- A61B6/52—Devices using data or image processing specially adapted for radiation diagnosis
- A61B6/5211—Devices using data or image processing specially adapted for radiation diagnosis involving processing of medical diagnostic data
- A61B6/5229—Devices using data or image processing specially adapted for radiation diagnosis involving processing of medical diagnostic data combining image data of a patient, e.g. combining a functional image with an anatomical image
- A61B6/5235—Devices using data or image processing specially adapted for radiation diagnosis involving processing of medical diagnostic data combining image data of a patient, e.g. combining a functional image with an anatomical image combining images from the same or different ionising radiation imaging techniques, e.g. PET and CT
-
- G—PHYSICS
- G06—COMPUTING; CALCULATING OR COUNTING
- G06T—IMAGE DATA PROCESSING OR GENERATION, IN GENERAL
- G06T2207/00—Indexing scheme for image analysis or image enhancement
- G06T2207/30—Subject of image; Context of image processing
- G06T2207/30004—Biomedical image processing
- G06T2207/30101—Blood vessel; Artery; Vein; Vascular
Definitions
- the various aspects and variations thereof relate to tracking of flow of a fluid through a vessel of a living being.
- flow velocity of blood in a coronary vessel may be required.
- the flow velocity may be determined as described in " TIMI Frame Count" by C. Michael Gibson e.a. as published in Circulation 1996; 93: 879-888 .
- a method of monitoring a flow of a fluid in a vessel of a body of a living being comprises obtaining a first image data set representing the vessel filled with a first fluid, the first image data set comprising at least one first image frame and the first fluid contrasting with matter surrounding the vessel and obtaining a second image data set representing the vessel substantially void of the first fluid, the second image data set comprising at least one second image frame. Based on the first image data set and the second image set, an estimated location of the vessel in the second image set is estimated ; and monitoring presence in the second data set of contrasting image data at the estimated location of the vessel is monitored.
- a vessel filled with contrast dye is well visible using imaging technology like computer tomography and x-ray imaging.
- image data of the vessel acquired while the vessel is filled provides data on geometry and location of the vessel.
- an estimate of at least one of geometry and location of the vessel in the second image data set may be provided.
- tracking progress of contrast dye in the second image data set by detecting image pixels with contrasting image data for one or more image may only, firstly or primarily be done at and, optionally, around, the estimated location and geometry of one or more images of the second image data set. This means that not all pixel of images in the second image data set may have to be analysed for tracking progress of the contrast dye through the vessel.
- the first data set comprises a multitude of first image frames, the first image frames having been acquired consecutively in time; and the second data set comprises a multitude of second image frames, the second image frames having been acquired consecutively in time.
- the method further comprises tracking, in the first data set, the vessel over time and estimating, based on the tracking, over time, a location of the vessel in the second frames of the second data set.
- the estimation of at least one of the geometry and location of the vessel may be done statically and this variation relates to tracking of at least one of the geometry and location over time.
- a coronary vessel moves and changes in shape over the course of a heartbeat, for which reason it may be preferred to track the vessel over time and estimate geometry and/or location over time.
- the first data set is acquired over a first time interval relative to a heartbeat sequence
- the second data set is acquired over a second time interval relative to the heartbeat sequence and the first time interval and the second time interval cover at least one equivalent part of the heartbeat sequence.
- both the image data sets may be aligned over time, such that at least one of location and geometry of the vessel may for example be estimated in an image of the second set, based on an image in the first in set at an equivalent moment in a heartbeat sequence, at which moment it is probable that at least one of geometry and location of the vessel is substantially the same in the second set as it is depicted in the first set.
- the first timer interval and the second timer interval cover at least one heartbeat sequence.
- Another variation comprises aligning the first image data set and the second image data set based on heartbeat sequence data associated with the first image data set and the second image data set, associating frames in the first image data set and the second image data set with a particular phase in the heartbeat sequence and estimating, over time, estimated locations of the vessel in the second frames of the second image data set based on locations of the vessel in the first frames of the first image data set having substantially the same phase in the heartbeat sequence associated therewith as with the second frames.
- This variation is a practical implementation of the previous ones, reducing complexity and increasing accuracy of the estimation.
- the first image data set and the second image data set have electrocardiogram data as heartbeat sequence data associated therewith.
- heartbeat sequence data is derived from image frame data in at least one of the first image data set and the second image data set.
- a phase in a heartbeat sequence may be estimated, as such shape varies in a periodic way over the sequence of a heartbeat.
- the moment in the sequence may be obtained by (directly) comparing the obtained image to one or more reference images.
- the applicable image may be provided to a trained neural network or other artificial intelligence capable of at least one of image recognition and image classification.
- the tracking of the vessel over time comprises identifying a multitude of points of interest distributed on a representation of the vessel in the first image frames and tracking locations of the points of interest in the applicable image over time.
- a further variation comprises reconstructing the vessel geometry over time. Whereas this variation may consume a considerable amount of memory and processing power, it may provide more accuracy.
- the reconstructing comprises determining a centreline of the vessel in the image data.
- a centreline By representing the vessel by means of a centreline only, an efficient representation may be provided.
- the centreline may be used as a basis for a more advanced or more sophisticated representation of the vessel.
- Another variation further comprises reconstructing a vessel geometry based on the first image data set and estimating a location of the vessel in the second image set based on the first image data set and the reconstructed vessel geometry.
- the first image set comprises a first image subset comprising at least a first image acquired under a first angle relative to the living being; and a second image subset comprising at least a second image acquired under a second angle relative to the living being; in this variation, the reconstructed vessel geometry is a three-dimensional geometry. With a three-dimensional representation, more accuracy may be provided.
- the second image set comprises a first image subset comprises at least a first image acquired under the first angle relative to the living being; and a second image subset comprises at least a second image acquired under the second angle relative to the living being; in this variation, the estimated location of the vessel in the second image set is a three-dimensional location. With a three-dimensional representation of the location, more accuracy may be provided.
- a further variation further comprises determining a first length of the vessel as depicted by the first image subset, determining a second length of the vessel as depicted by the second image subset, determining a natural length of the reconstructed vessel, selecting the first image subset if the first length is closer to the natural length or selecting the second image subset if the second length is closer to the natural length, estimating the location of the vessel in the second image data set based on the subset of the first dataset of which the length is closest to the natural length.
- a longer length enables analysis with a higher resolution.
- the location in the second image data set is determined based on the image subset corresponding to the image subset of the first image data set depicting a length closest to the natural length. This may also provide an improved resolution.
- the vessel is filling with the first fluid while the second dataset is acquired.
- This variation allows for determining transit time of a front of a bolus with contrast dye.
- transit velocity of a body fluid through the vessel for example blood, may be determined.
- this transit velocity or flow rate may be used for determining fractional flow reserve of a vessel, or a related or derivative value of the fractional flow reserve.
- the second image data set is acquired prior in time relative to the acquiring the first image data set.
- This variation requires contrast dye as an example of the first fluid or first liquid to be inserted in the vessel only once for the analysis in accordance with the first aspect.
- the first aspect may be employed in a method of determining vessel fluid flow velocity of a fluid in a vessel segment of a body of a human or another mammal.
- the method comprises obtaining a natural length model of the vessel representing a length of the length of the vessel in accordance with the method according to any variation of the first aspect, obtaining a two-dimensional model of the vessel segment based on the first image dataset, dividing the two-dimensional model in vessel sections, receiving the second dataset comprising a multitude of second image frames, the second image frames having been acquired consecutively in time, based on the images of the second dataset, assigning, for each image of the set, at least one intensity value to each vessel section, identifying, in a first image related to a first moment in time, a first vessel section, based on an intensity criterion, identifying, in a second image related to a second moment in time, a second vessel section, based on the intensity criterion, the second moment in time being later than the first moment in time and
- a second aspect provides a computer programme product comprising computer executable code that cause a computer, when the instructions are loaded in a memory connected to a processing unit comprised by the computer, cause the computer to execute the method according to the first aspect or any of the variations discussed above and below.
- a third aspect provides a non-transitional medium having stored thereon the computer programme product according to the second aspect.
- a fourth aspect provides a device for monitoring a flow of a fluid in a vessel of a body of a living being.
- the device comprises an input module arranged to obtain a first image data set representing the vessel filled with a first fluid, the first image data set comprising at least one first image frame and the first fluid contrasting with matter surrounding the vessel; and obtain a second image data set representing the vessel substantially void of the first fluid, the second image data set comprising at least one second image frame; and a processing unit arranged to: estimate, based on the first image data set and the second image set, an estimated location of the vessel in the second image set; and monitor presence in the second image data set of contrasting image data at the estimated location of the vessel.
- the fourth aspect also relates to a device for executing the method according to the first aspect or any variation thereof.
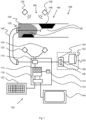
- FIG. 1 shows an electronic medical data acquisition and processing system 100 as an example of the second aspect.
- the system 100 or parts thereof may be found in a cardiac catheterisation laboratory of a clinic or a hospital.
- the system 100 comprises an X-ray image acquisition module comprising a first X-ray source 126 and a second X-ray source 128, a first X-ray detector 122 arranged to receive X-ray data from the first X-ray source 126 and a second X-ray sensor 124 arranged to receive X-ray data from the second X-ray source 128.
- the first X-ray source 126, the second X-ray sensor 124, the first X-ray detector 122 and the second X-ray sensor 124 are arranged to obtain images of a cardiovascular structure 180 under an angle relative to one another.
- the angle is preferably between 25° and 45°, more preferably between 30° and 40°.
- the first X-ray detector 122 and the second X-ray detector 124 are connected to data acquisition module 116 of an electronic computing device 110.
- the electronic computing device further comprises a processing unit 112, a storage module 114 and a peripherals I/O controller 118.
- the processing unit 112 which may be implemented as a microprocessor, microcontroller or other electronic data processing device, is arranged to control the various part of the electronic computing device 110 and the system 100 and arranged to execute the method according to the first aspect and implementations thereof.
- the storage module 114 is arranged for storing data thereon, for example acquired by the computing device 110 from the various other parts of the system 100, either directly or after processing by the processing unit 112.
- the storage unit 114 as at least partially implemented as a non-transitional storage medium, is further arranged for storing computer executable code which allow the processing unit 112 to execute the method according to the first aspect and implementations thereof.
- the system 100 further comprises, in this implementation as an option, a heartbeat data acquisition module 130 comprising an ECG acquisition contact pad 132, a control unit 134 comprising a pulse sensor 136 and a clock unit 138.
- the heartbeat data acquisition module 130 is arranged to obtain data related to heartbeat and heartbeat phase data in particular as a function of time.
- the pulse sensor 136 may be a photoplethysmography unit or another sensor arranged to determine pulse of a person.
- the control unit 134 is arranged to relate the data acquired by means of the ECG acquisition contact pad 132 and the pulse sensor 136 to time, for example by adding a timestamp.
- the system 100 comprises a pressure tip 148 as another blood pressure measurement module, which corresponds to the intracoronary distal pressure.
- the pressure tip 148 which is connected to a coronary wire, transmits the pressure to the data acquisition module 116, from a coronary artery 182 of the cardiovascular structure 180 as an example of a coronary vessel or blood vessel in general via a catheter 146 inserted in a body of a mammal, like a human being.
- the tip of the coronary catheter 146 placed into the ostium of the coronary artery under scrutiny 182, senses the proximal pressure into the vessel, which corresponds to the aortic pressure.
- the catheter 146 may be used to insert contrast dye 150 in the coronary artery 182 or another vessel of a body.
- the peripherals I/O controller 118 is arranged to connect the computing device 110 and the various components thereof to input device like a keyboard 142 or a touch screen for receiving data like user input.
- the peripherals I/O controller 118 is arranged to connect the computing device 110 and the various components thereof to output devices like an electronic display 144 and other output devices arranged to provide a user with data on processed or unprocessed data received by the computing device 110.
- the catheter 146 and the pressure wire 148 are inserted in the coronary artery 182.
- narrowings 190 are present in the coronary artery 182, which, in turn results in pressure drops at the various stenotic areas. Subsequently, the pressure drops result in reduced perfusion of myocardial tissues, which leads to reduced physical condition of the person under scrutiny.
- the cardiovascular structure 180 shown by Figure 1 may be a hypothetical structure and is not necessarily a representation of an actual anatomical structure.
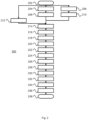
- the further functionality of the system 100 and parts thereof discussed above will be further elucidated in conjunction with a flowchart 200 depicted by Figure 2 .
- the procedure depicted by the flowchart 200 is executed by the system 100 and the electronic computing device 110 in particular, controlled by the processing unit 112.
- the processing unit 112 may be programmed by means of a computer programme product comprising computer executable code.
- the computer programme product may be stored on the storage unit 114 as an electronic memory, which may be a non-transitory memory.
- the various parts of the flowchart 200 are briefly summarised below.
- the procedure starts in a terminator 202 and continues to step 204 in which a first subset of a second image data set is acquired.
- a second subset of image of the second image data set is acquired.
- the second image data set is acquired while the contrast dye 150 is provided to the coronary artery 182.
- the second image data set is acquired while the contrast dye 150 is gradually filling up the coronary artery 182.
- the first subset of the second image data set is acquired by means of the first X-ray source 126 and the first X-ray sensor 122 and the second subset of the second image data set is acquired by means of the second X-ray source 128 and the second X-ray sensor 124.
- the first subset and the second subset of the second image data set preferably comprise a multitude of X-ray image frames, acquired at regular intervals in time, as the contrast dye 150 progresses in the coronary artery 182.
- the first X-ray sensor 122 and the second X-ray sensor 124 acquire data at the same moment, for example by acquiring images at substantially the same moment in time.
- the first subset and the second subset of the second dataset may be streams of image frames.
- step 208 a first subset of a first image dataset is acquired and in step 210, a second subset of the first image dataset is acquired.
- the first image data set is acquired while the contrast dye 150 is present through the full length of the coronary artery 182.
- the second image data set may be acquired prior to the first image data set, allowing second data to be acquired while the coronary artery 182 gradually fills with the contrast dye and to subsequently allow first data, for the first image data set, to be acquired while the coronary artery 182 is substantially full with the contrast dye 150.
- Working the other way around is possible as well, but would require the coronary artery 182 to be flushed after acquiring the first image data set to get the contrast dye 150 out of the coronary artery 182. The flushing would be required to allow acquisition of the second image data set while the contrast dye 150 is gradually filling the coronary artery 182.
- the first subset of the first image data set is acquired by means of the first X-ray source 126 and the first X-ray sensor 122 and the second subset of the first image data set is acquired by means of the second X-ray source 128 and the second X-ray sensor 124.
- the first subset and the second subset of the first image data set preferably comprise a multitude of X-ray image frames, acquired at regular intervals in time, as the contrast dye 150 progresses in the coronary artery 182.
- the first X-ray sensor 122 and the second X-ray sensor 124 acquire data at the same moment, for example by acquiring images at substantially the same moment in time.
- the first subset and the second subset of the first dataset may be streams of image frames.
- no two X-ray sources and no two X-ray sensors are present.
- the first subsets and the second subsets are acquired at different intervals in time.
- heartbeat data of the person under scrutiny is acquired, in this example in parallel to acquisition of the image data.
- the heartbeat data is acquired by means of the heartbeat data acquisition module 130.
- the heartbeat data thus acquired is lined up to the image data in step 214.
- the linking of data may be established in various ways. One option is to assign a momentary ECG value to an image frame acquired at the same moment. Another options is to provide ECG data in a metafile, provided with time data and to provide the image frames of the image data sets with time data such that it matches time data of the ECG data. Additionally or alternatively to ECG data, also photoplethysmography data may be used.
- the coronary artery 182 is identified in the first subset of the first image data set.
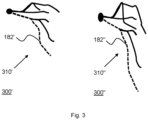
- Figure 3 shows a first image frame 300' and a second image frame 300".
- the first image frame 300' is part of the first subset of the first image data set and the second image frame 300" is part of the second subset of the second image data set.
- the coronary artery 182 is in the first image frame 300' visible as artery image 182' and in the second image frame 300" visible as artery image 182".
- the coronary artery 182 is identified in the first subset of the first image data set and in the second subset of the first image data set, in step 218.
- the coronary artery 182 may be defined in one frame of the first subset, but also from frame to frame, thus tracking the coronary artery 182 from frame to frame to obtain the geometry and location of the coronary artery 182 over time. With such tracking, the full geometry of the coronary artery 182 may be followed from image to image. In another implementation, specific points of the coronary artery 182 or locations on a centreline may be followed from frame to frame. The data acquired by following movements of the points of interest from frame to frame may subsequently be used to reconstruct the coronary artery geometry in one or more frames.
- step 220 the data acquisition angle between the first X-ray detector 122 and the second X-ray sensor 124 is obtained.
- the processing unit 112 uses the image data of the coronary artery 182 and the data acquisition angle to reconstruct a three-dimensional vessel geometry of the coronary artery 182.
- the centreline of the coronary artery 182 is reconstructed in an electronic data file. Additionally or alternatively, a full three-dimensional structure of the coronary artery 182 is reconstructed.
- the length of the thus reconstructed coronary artery 182 is determined. In one example, the length is determined from the aorta to the final point of the vessel. In step 226, the length of the vessel as depicted by first subset of the first image dataset is determined, for example as depicted by the first image frame 300'. And in step 228, the length of the vessel as depicted by second subset of the first image dataset is determined, for example as depicted by the second image frame 300".
- the length of the three-dimensional reconstruction is generally the longest, as the natural vessel length.
- the vessel geometry is linked to timing data.
- a series of three-dimensional reconstructions may be provided. And with timing data as discussed above, each reconstruction may be linked to a moment in time and/or a specific part of a heartbeat cycle. Additionally or alternatively, geometry characteristics like centreline of the vessel identified in the first subset and the second subset of the first set of image data may be linked to timing data.
- step 232 the vessel geometry thus reconstructed - once or multiple times over time - is linked to locations in the image frames of the first subset and the second subset of the first set of image data.
- the location of the centreline is associated with the image frames; additionally or alternatively, the full three-dimensional geometry is linked to the image frames.
- frames of the second set of image data are linked to frames of the first set of image data.
- the linking is preferably done based on timing data.
- frames of the second set of image data are linked to frames of the first set of image data using data related to a phase of a heartbeat. Determining a phase of the heartbeat may be based on the momentary ECG value and, optionally, on analysing the ECG value over time.
- the P-wave, Q-wave, R-wave and other characteristic points of the ECG data in timing data specifically acquired with the first set of image data and the characteristic ECG data point acquired with the second set of image data may be used to associate particular frames with particular moment or phases in a heartbeat cycle.
- an image frame of the first set of image data may be linked to an image from the second set of image data. More in particular, an image frame of the first subset of the first set of image data may be linked to an image from of the first subset of the second set of image data and an image frame of the second subset of the first set of image data may be linked to an image from of the second subset of the second set of image data.
- this matching of frames it is useful that both the first set of image data and the second set of image data are acquired during the same phases of a heartbeat or overlapping parts of the sequence. It may be even more useful if the acquisition periods for both sets cover at least one heartbeat sequence or more.
- the heartbeat phase data may be acquired in other ways.
- pulse data may be obtained using an optical pulse meter.
- the heartbeat phase data may be obtained by analysing image data of the second set of image data.
- the shape of the location of the coronary artery 182, filled with contrast dye, varies of time during the heartbeat sequence.
- a phase in the heartbeat sequence may be determined. This determination may be executed by means of a model, by comparing image data acquired to stored image data, by means of a trained neural network, other, or a combination thereof.
- geometry and location of the coronary artery 281 may be reconstructed in frames of the second set of image data, based on known data.
- the geometry and location of the coronary artery 182 may be reconstructed in the first subset and the second subset of the second set of image data or in only one of them.
- the geometry and location of the coronary artery 182 is reconstructed only in the first subset or second subset of the second set of image data.
- step 224, step 226 and step 228, lengths of various images of the coronary artery 182 have been determined.
- the geometry and location of the coronary artery 182 is reconstructed only in the set that depicts the coronary artery 182 with a length closest to that of the lengths of the three-dimensional reconstruction of the coronary artery 182. In one example, this may be the subset that depicts the coronary artery having the longest length.
- the lengths used for this may be lengths of single - corresponding - frames from the first subset and the second subset.
- a mean or median value of the lengths may be used for this step.
- the coronary artery 281 As the coronary artery 281 is in the frames of the second set of image data not filled with contrast dye 150 or at least not fully filled, the coronary artery is not visible in the frames of the second set of image data and the reconstruction yields a ghost image of the coronary artery 281. It is noted that the location of the coronary artery 182 thus reconstructed in the frames of the second set of image data may not necessarily be the actual location of the coronary artery 182, but is rather an estimation of the location.
- step 238 image data at and optionally near the estimated geometry and location of the coronary artery is monitored for change of intensity.
- change of contrast may be evaluated at a pre-determined distance from a centreline of the reconstructed vessel. If the full vessel is reconstructed or a volumetric, three dimensional representation of the vessel is reconstructed or a two-dimensional reconstruction with a surface in a two dimensional space is provided, an area, volume, vessel width or other entity is monitored at a monitoring distance from the vessel, which monitoring distance is based on the volume or surface of the vessel at a particular location.
- the relation between the monitoring distance and the area, width or volume of the reconstructed vessel may for example be linear.
- the contrast of the image data changes along the estimated centreline of the coronary artery 182 in the frames of the second set of image data.
- only frames of the first subset are monitored, alternatively or additionally, frames of the second subset of the second set of image data are monitored.
- the subset is monitored in which frames depicted the coronary artery with the longest length and/or the length closest to the natural length of the coronary artery 182.
Landscapes
- Health & Medical Sciences (AREA)
- Life Sciences & Earth Sciences (AREA)
- Engineering & Computer Science (AREA)
- Medical Informatics (AREA)
- Radiology & Medical Imaging (AREA)
- Molecular Biology (AREA)
- Biophysics (AREA)
- High Energy & Nuclear Physics (AREA)
- Veterinary Medicine (AREA)
- Nuclear Medicine, Radiotherapy & Molecular Imaging (AREA)
- Optics & Photonics (AREA)
- Pathology (AREA)
- Public Health (AREA)
- Biomedical Technology (AREA)
- Heart & Thoracic Surgery (AREA)
- Physics & Mathematics (AREA)
- Surgery (AREA)
- Animal Behavior & Ethology (AREA)
- General Health & Medical Sciences (AREA)
- Vascular Medicine (AREA)
- Dentistry (AREA)
- Oral & Maxillofacial Surgery (AREA)
- Computer Vision & Pattern Recognition (AREA)
- Physiology (AREA)
- Apparatus For Radiation Diagnosis (AREA)
Abstract
Description
- The various aspects and variations thereof relate to tracking of flow of a fluid through a vessel of a living being.
- For determining various parameters of a cardiovascular system, like fractional flow reserve, flow velocity of blood in a coronary vessel may be required. The flow velocity may be determined as described in "TIMI Frame Count" by C. Michael Gibson e.a. as published in Circulation 1996; 93: 879-888.
- It is preferred to provide an efficient basis for tracking of a bolus of contrast dye in a vessel in a body and in a coronary vessel in particular. To this end, in a first aspect, a method of monitoring a flow of a fluid in a vessel of a body of a living being is provided. The method comprises obtaining a first image data set representing the vessel filled with a first fluid, the first image data set comprising at least one first image frame and the first fluid contrasting with matter surrounding the vessel and obtaining a second image data set representing the vessel substantially void of the first fluid, the second image data set comprising at least one second image frame. Based on the first image data set and the second image set, an estimated location of the vessel in the second image set is estimated ; and monitoring presence in the second data set of contrasting image data at the estimated location of the vessel is monitored.
- A vessel filled with contrast dye is well visible using imaging technology like computer tomography and x-ray imaging. With image data of the vessel acquired while the vessel is filled provides data on geometry and location of the vessel. Based thereon, an estimate of at least one of geometry and location of the vessel in the second image data set may be provided. Subsequently, while tracking progress of contrast dye in the second image data set by detecting image pixels with contrasting image data for one or more image may only, firstly or primarily be done at and, optionally, around, the estimated location and geometry of one or more images of the second image data set. This means that not all pixel of images in the second image data set may have to be analysed for tracking progress of the contrast dye through the vessel.
- In a variation, the first data set comprises a multitude of first image frames, the first image frames having been acquired consecutively in time; and the second data set comprises a multitude of second image frames, the second image frames having been acquired consecutively in time. In this variation, the method further comprises tracking, in the first data set, the vessel over time and estimating, based on the tracking, over time, a location of the vessel in the second frames of the second data set. The estimation of at least one of the geometry and location of the vessel may be done statically and this variation relates to tracking of at least one of the geometry and location over time. In particular a coronary vessel moves and changes in shape over the course of a heartbeat, for which reason it may be preferred to track the vessel over time and estimate geometry and/or location over time.
- In another variation, the first data set is acquired over a first time interval relative to a heartbeat sequence, the second data set is acquired over a second time interval relative to the heartbeat sequence and the first time interval and the second time interval cover at least one equivalent part of the heartbeat sequence. With both the first image data set and the second image data set comprising equivalent parts or equivalent phases of a hearts, both the image data sets may be aligned over time, such that at least one of location and geometry of the vessel may for example be estimated in an image of the second set, based on an image in the first in set at an equivalent moment in a heartbeat sequence, at which moment it is probable that at least one of geometry and location of the vessel is substantially the same in the second set as it is depicted in the first set.
- In a further variation, the first timer interval and the second timer interval cover at least one heartbeat sequence. An advantage thereof is that the image sets cover a full sequence, providing generally all possible shapes and locations of the vessel, as possibly modified by the heartbeat.
- Again another variation comprises aligning the first image data set and the second image data set based on heartbeat sequence data associated with the first image data set and the second image data set, associating frames in the first image data set and the second image data set with a particular phase in the heartbeat sequence and estimating, over time, estimated locations of the vessel in the second frames of the second image data set based on locations of the vessel in the first frames of the first image data set having substantially the same phase in the heartbeat sequence associated therewith as with the second frames. This variation is a practical implementation of the previous ones, reducing complexity and increasing accuracy of the estimation.
- In a further variation, the first image data set and the second image data set have electrocardiogram data as heartbeat sequence data associated therewith. An advantage is that an ECG provides easy to process and well-known data on phases in a heartbeat sequence.
- In yet a further variation, heartbeat sequence data is derived from image frame data in at least one of the first image data set and the second image data set. For example, from a shape of a coronary vessel, a phase in a heartbeat sequence may be estimated, as such shape varies in a periodic way over the sequence of a heartbeat. The moment in the sequence may be obtained by (directly) comparing the obtained image to one or more reference images. Additionally or alternatively, the applicable image may be provided to a trained neural network or other artificial intelligence capable of at least one of image recognition and image classification.
- In yet another variation, the tracking of the vessel over time comprises identifying a multitude of points of interest distributed on a representation of the vessel in the first image frames and tracking locations of the points of interest in the applicable image over time.
- Again a further variation comprises reconstructing the vessel geometry over time. Whereas this variation may consume a considerable amount of memory and processing power, it may provide more accuracy.
- In yet again a further variation, the reconstructing comprises determining a centreline of the vessel in the image data. By representing the vessel by means of a centreline only, an efficient representation may be provided. Alternatively, the centreline may be used as a basis for a more advanced or more sophisticated representation of the vessel.
- Another variation further comprises reconstructing a vessel geometry based on the first image data set and estimating a location of the vessel in the second image set based on the first image data set and the reconstructed vessel geometry. With a vessel geometry available, estimation of the vessel location and locations of multiple points of the vessel geometry in particular, only a few points of the vessel location in the second image data set need to be identified, for example estimated, upon which the vessel geometry may be fit to those locations. As a result, the full location of the full geometry is efficiently estimated.
- In yet another variation, the first image set comprises a first image subset comprising at least a first image acquired under a first angle relative to the living being; and a second image subset comprising at least a second image acquired under a second angle relative to the living being; in this variation, the reconstructed vessel geometry is a three-dimensional geometry. With a three-dimensional representation, more accuracy may be provided.
- In yet again another variation, the second image set comprises a first image subset comprises at least a first image acquired under the first angle relative to the living being; and a second image subset comprises at least a second image acquired under the second angle relative to the living being; in this variation, the estimated location of the vessel in the second image set is a three-dimensional location. With a three-dimensional representation of the location, more accuracy may be provided.
- A further variation further comprises determining a first length of the vessel as depicted by the first image subset, determining a second length of the vessel as depicted by the second image subset, determining a natural length of the reconstructed vessel, selecting the first image subset if the first length is closer to the natural length or selecting the second image subset if the second length is closer to the natural length, estimating the location of the vessel in the second image data set based on the subset of the first dataset of which the length is closest to the natural length. A longer length enables analysis with a higher resolution.
- In another variation, the location in the second image data set is determined based on the image subset corresponding to the image subset of the first image data set depicting a length closest to the natural length. This may also provide an improved resolution.
- In yet a further implementation, the vessel is filling with the first fluid while the second dataset is acquired. This variation allows for determining transit time of a front of a bolus with contrast dye. With this data, transit velocity of a body fluid through the vessel, for example blood, may be determined. In a coronary vessel, this transit velocity or flow rate may be used for determining fractional flow reserve of a vessel, or a related or derivative value of the fractional flow reserve.
- In again another variation, the second image data set is acquired prior in time relative to the acquiring the first image data set. This variation requires contrast dye as an example of the first fluid or first liquid to be inserted in the vessel only once for the analysis in accordance with the first aspect.
- The first aspect, with all its variations indicated above and below, may be employed in a method of determining vessel fluid flow velocity of a fluid in a vessel segment of a body of a human or another mammal. The method comprises obtaining a natural length model of the vessel representing a length of the length of the vessel in accordance with the method according to any variation of the first aspect, obtaining a two-dimensional model of the vessel segment based on the first image dataset, dividing the two-dimensional model in vessel sections, receiving the second dataset comprising a multitude of second image frames, the second image frames having been acquired consecutively in time, based on the images of the second dataset, assigning, for each image of the set, at least one intensity value to each vessel section, identifying, in a first image related to a first moment in time, a first vessel section, based on an intensity criterion, identifying, in a second image related to a second moment in time, a second vessel section, based on the intensity criterion, the second moment in time being later than the first moment in time and the second vessel section being distal to the first vessel section, obtaining a propagation length by relating the first vessel section and the second vessel section to the natural length and determining a vessel fluid flow velocity based on the propagation length, and a difference between the first moment in time and the second moment in time.
- A second aspect provides a computer programme product comprising computer executable code that cause a computer, when the instructions are loaded in a memory connected to a processing unit comprised by the computer, cause the computer to execute the method according to the first aspect or any of the variations discussed above and below.
- A third aspect provides a non-transitional medium having stored thereon the computer programme product according to the second aspect.
- A fourth aspect provides a device for monitoring a flow of a fluid in a vessel of a body of a living being. The device comprises an input module arranged to obtain a first image data set representing the vessel filled with a first fluid, the first image data set comprising at least one first image frame and the first fluid contrasting with matter surrounding the vessel; and obtain a second image data set representing the vessel substantially void of the first fluid, the second image data set comprising at least one second image frame; and a processing unit arranged to: estimate, based on the first image data set and the second image set, an estimated location of the vessel in the second image set; and monitor presence in the second image data set of contrasting image data at the estimated location of the vessel. As such, the fourth aspect also relates to a device for executing the method according to the first aspect or any variation thereof.
- The various aspects and implementations thereof will now be discussed in further detail in conjunction with drawings. In the drawings:
-
Figure 1 : shows a system for image acquisition and processing; -
Figure 2 : shows a flowchart; and -
Figure 3 : shows two images of a cardiovascular structure. -
Figure 1 shows an electronic medical data acquisition andprocessing system 100 as an example of the second aspect. Thesystem 100 or parts thereof may be found in a cardiac catheterisation laboratory of a clinic or a hospital. Thesystem 100 comprises an X-ray image acquisition module comprising afirst X-ray source 126 and asecond X-ray source 128, afirst X-ray detector 122 arranged to receive X-ray data from thefirst X-ray source 126 and asecond X-ray sensor 124 arranged to receive X-ray data from thesecond X-ray source 128. Thefirst X-ray source 126, thesecond X-ray sensor 124, thefirst X-ray detector 122 and thesecond X-ray sensor 124 are arranged to obtain images of acardiovascular structure 180 under an angle relative to one another. The angle is preferably between 25° and 45°, more preferably between 30° and 40°. - The
first X-ray detector 122 and thesecond X-ray detector 124 are connected todata acquisition module 116 of anelectronic computing device 110. The electronic computing device further comprises aprocessing unit 112, astorage module 114 and a peripherals I/O controller 118. Theprocessing unit 112, which may be implemented as a microprocessor, microcontroller or other electronic data processing device, is arranged to control the various part of theelectronic computing device 110 and thesystem 100 and arranged to execute the method according to the first aspect and implementations thereof. - The
storage module 114 is arranged for storing data thereon, for example acquired by thecomputing device 110 from the various other parts of thesystem 100, either directly or after processing by theprocessing unit 112. Thestorage unit 114, as at least partially implemented as a non-transitional storage medium, is further arranged for storing computer executable code which allow theprocessing unit 112 to execute the method according to the first aspect and implementations thereof. - The
system 100 further comprises, in this implementation as an option, a heartbeatdata acquisition module 130 comprising an ECGacquisition contact pad 132, acontrol unit 134 comprising apulse sensor 136 and aclock unit 138. The heartbeatdata acquisition module 130 is arranged to obtain data related to heartbeat and heartbeat phase data in particular as a function of time. Thepulse sensor 136 may be a photoplethysmography unit or another sensor arranged to determine pulse of a person. Thecontrol unit 134 is arranged to relate the data acquired by means of the ECGacquisition contact pad 132 and thepulse sensor 136 to time, for example by adding a timestamp. - The
system 100 comprises apressure tip 148 as another blood pressure measurement module, which corresponds to the intracoronary distal pressure. Thepressure tip 148, which is connected to a coronary wire, transmits the pressure to thedata acquisition module 116, from acoronary artery 182 of thecardiovascular structure 180 as an example of a coronary vessel or blood vessel in general via acatheter 146 inserted in a body of a mammal, like a human being. Additionally, the tip of thecoronary catheter 146, placed into the ostium of the coronary artery underscrutiny 182, senses the proximal pressure into the vessel, which corresponds to the aortic pressure. Furthermore, thecatheter 146 may be used to insertcontrast dye 150 in thecoronary artery 182 or another vessel of a body. - The peripherals I/
O controller 118 is arranged to connect thecomputing device 110 and the various components thereof to input device like akeyboard 142 or a touch screen for receiving data like user input. The peripherals I/O controller 118 is arranged to connect thecomputing device 110 and the various components thereof to output devices like anelectronic display 144 and other output devices arranged to provide a user with data on processed or unprocessed data received by thecomputing device 110. - As shown in
Figure 1 , thecatheter 146 and thepressure wire 148 are inserted in thecoronary artery 182. In thecoronary artery 182,narrowings 190 are present. The stenotic areas result in narrowing in the various vessels of the coronaryvascular structure 180, which, in turn results in pressure drops at the various stenotic areas. Subsequently, the pressure drops result in reduced perfusion of myocardial tissues, which leads to reduced physical condition of the person under scrutiny. Thecardiovascular structure 180 shown byFigure 1 may be a hypothetical structure and is not necessarily a representation of an actual anatomical structure. - The further functionality of the
system 100 and parts thereof discussed above will be further elucidated in conjunction with aflowchart 200 depicted byFigure 2 . The procedure depicted by theflowchart 200 is executed by thesystem 100 and theelectronic computing device 110 in particular, controlled by theprocessing unit 112. To provide this functionality, theprocessing unit 112 may be programmed by means of a computer programme product comprising computer executable code. The computer programme product may be stored on thestorage unit 114 as an electronic memory, which may be a non-transitory memory. The various parts of theflowchart 200 are briefly summarised below. - 202 start of the procedure
- 204 acquire first subset of second image data set
- 206 acquire second subset of second image data set
- 208 acquire first subset of first image data set
- 210 acquire second subset of first image data set
- 212 obtain heartbeat phase data
- 214 link image data to heartbeat phase data
- 216 identify vessel in first subset of first image data set
- 218 identify vessel in second subset of first image data set
- 220 obtain sensor difference angle between first and second subsets
- 222 reconstruct three-dimensional vessel geometry
- 224 determine three-dimensional vessel length
- 226 determine two-dimensional vessel length first subset
- 228 determine two-dimensional vessel length second subset
- 230 link vessel geometry to time
- 232 link vessel geometry to a location in an image frame in the first data set
- 234 associate frames of the second data set to frame of the first data set (based on HB)
- 236 link reconstructed vessel geometry and location to image data of the second image data set
- 238 monitor image data in the second data set
- 238 end procedure
- The procedure starts in a
terminator 202 and continues to step 204 in which a first subset of a second image data set is acquired. Instep 204, a second subset of image of the second image data set is acquired. The second image data set is acquired while thecontrast dye 150 is provided to thecoronary artery 182. As such, the second image data set is acquired while thecontrast dye 150 is gradually filling up thecoronary artery 182. The first subset of the second image data set is acquired by means of thefirst X-ray source 126 and thefirst X-ray sensor 122 and the second subset of the second image data set is acquired by means of thesecond X-ray source 128 and thesecond X-ray sensor 124. The first subset and the second subset of the second image data set preferably comprise a multitude of X-ray image frames, acquired at regular intervals in time, as thecontrast dye 150 progresses in thecoronary artery 182. - In one embodiment, the
first X-ray sensor 122 and thesecond X-ray sensor 124 acquire data at the same moment, for example by acquiring images at substantially the same moment in time. As such, the first subset and the second subset of the second dataset may be streams of image frames. - In
step 208, a first subset of a first image dataset is acquired and instep 210, a second subset of the first image dataset is acquired. - The first image data set is acquired while the
contrast dye 150 is present through the full length of thecoronary artery 182. The second image data set may be acquired prior to the first image data set, allowing second data to be acquired while thecoronary artery 182 gradually fills with the contrast dye and to subsequently allow first data, for the first image data set, to be acquired while thecoronary artery 182 is substantially full with thecontrast dye 150. Working the other way around is possible as well, but would require thecoronary artery 182 to be flushed after acquiring the first image data set to get thecontrast dye 150 out of thecoronary artery 182. The flushing would be required to allow acquisition of the second image data set while thecontrast dye 150 is gradually filling thecoronary artery 182. - The first subset of the first image data set is acquired by means of the
first X-ray source 126 and thefirst X-ray sensor 122 and the second subset of the first image data set is acquired by means of thesecond X-ray source 128 and thesecond X-ray sensor 124. The first subset and the second subset of the first image data set preferably comprise a multitude of X-ray image frames, acquired at regular intervals in time, as thecontrast dye 150 progresses in thecoronary artery 182. - In one embodiment, the
first X-ray sensor 122 and thesecond X-ray sensor 124 acquire data at the same moment, for example by acquiring images at substantially the same moment in time. As such, the first subset and the second subset of the first dataset may be streams of image frames. - In certain embodiment, no two X-ray sources and no two X-ray sensors are present. In such case, the first subsets and the second subsets are acquired at different intervals in time.
- In
step 212, heartbeat data of the person under scrutiny is acquired, in this example in parallel to acquisition of the image data. The heartbeat data is acquired by means of the heartbeatdata acquisition module 130. The heartbeat data thus acquired is lined up to the image data instep 214. The linking of data may be established in various ways. One option is to assign a momentary ECG value to an image frame acquired at the same moment. Another options is to provide ECG data in a metafile, provided with time data and to provide the image frames of the image data sets with time data such that it matches time data of the ECG data. Additionally or alternatively to ECG data, also photoplethysmography data may be used. - In
step 216, thecoronary artery 182 is identified in the first subset of the first image data set.Figure 3 shows a first image frame 300' and asecond image frame 300". The first image frame 300' is part of the first subset of the first image data set and thesecond image frame 300" is part of the second subset of the second image data set. Thecoronary artery 182 is in the first image frame 300' visible as artery image 182' and in thesecond image frame 300" visible asartery image 182". As such, thecoronary artery 182 is identified in the first subset of the first image data set and in the second subset of the first image data set, instep 218. - The
coronary artery 182 may be defined in one frame of the first subset, but also from frame to frame, thus tracking thecoronary artery 182 from frame to frame to obtain the geometry and location of thecoronary artery 182 over time. With such tracking, the full geometry of thecoronary artery 182 may be followed from image to image. In another implementation, specific points of thecoronary artery 182 or locations on a centreline may be followed from frame to frame. The data acquired by following movements of the points of interest from frame to frame may subsequently be used to reconstruct the coronary artery geometry in one or more frames. - In
step 220, the data acquisition angle between thefirst X-ray detector 122 and thesecond X-ray sensor 124 is obtained. Using the image data of thecoronary artery 182 and the data acquisition angle, theprocessing unit 112 reconstructs a three-dimensional vessel geometry of thecoronary artery 182. In one example, the centreline of thecoronary artery 182 is reconstructed in an electronic data file. Additionally or alternatively, a full three-dimensional structure of thecoronary artery 182 is reconstructed. - In
step 224, the length of the thus reconstructedcoronary artery 182 is determined. In one example, the length is determined from the aorta to the final point of the vessel. Instep 226, the length of the vessel as depicted by first subset of the first image dataset is determined, for example as depicted by the first image frame 300'. And instep 228, the length of the vessel as depicted by second subset of the first image dataset is determined, for example as depicted by thesecond image frame 300". The length of the three-dimensional reconstruction is generally the longest, as the natural vessel length. - In
step 230, the vessel geometry is linked to timing data. With series of two images acquired at the same moment, from different angles, over a period, a series of three-dimensional reconstructions may be provided. And with timing data as discussed above, each reconstruction may be linked to a moment in time and/or a specific part of a heartbeat cycle. Additionally or alternatively, geometry characteristics like centreline of the vessel identified in the first subset and the second subset of the first set of image data may be linked to timing data. - In
step 232, the vessel geometry thus reconstructed - once or multiple times over time - is linked to locations in the image frames of the first subset and the second subset of the first set of image data. In one example, the location of the centreline is associated with the image frames; additionally or alternatively, the full three-dimensional geometry is linked to the image frames. - In
step 234, frames of the second set of image data are linked to frames of the first set of image data. The linking is preferably done based on timing data. In particular, frames of the second set of image data are linked to frames of the first set of image data using data related to a phase of a heartbeat. Determining a phase of the heartbeat may be based on the momentary ECG value and, optionally, on analysing the ECG value over time. As such, the P-wave, Q-wave, R-wave and other characteristic points of the ECG data in timing data specifically acquired with the first set of image data and the characteristic ECG data point acquired with the second set of image data may be used to associate particular frames with particular moment or phases in a heartbeat cycle. - Based on the ECG data characteristics, an image frame of the first set of image data may be linked to an image from the second set of image data. More in particular, an image frame of the first subset of the first set of image data may be linked to an image from of the first subset of the second set of image data and an image frame of the second subset of the first set of image data may be linked to an image from of the second subset of the second set of image data. For this matching of frames, it is useful that both the first set of image data and the second set of image data are acquired during the same phases of a heartbeat or overlapping parts of the sequence. It may be even more useful if the acquisition periods for both sets cover at least one heartbeat sequence or more.
- Whereas ECG data may be conveniently acquired using relatively common equipment, the heartbeat phase data may be acquired in other ways. In one example, pulse data may be obtained using an optical pulse meter. In another example, the heartbeat phase data may be obtained by analysing image data of the second set of image data. The shape of the location of the
coronary artery 182, filled with contrast dye, varies of time during the heartbeat sequence. Hence, from at least one of the shape and location of thecoronary artery 182 in frames of the second set of image data, a phase in the heartbeat sequence may be determined. This determination may be executed by means of a model, by comparing image data acquired to stored image data, by means of a trained neural network, other, or a combination thereof. - Subsequently, with the geometry of the coronary artery 281 for frames of the first set of image data known and location of the coronary artery 281 in the frames of the first set of image data known and frames of the first set of image data associated with frames of the second set of image data, geometry and location of the coronary artery 281 may be reconstructed in frames of the second set of image data, based on known data. The geometry and location of the
coronary artery 182 may be reconstructed in the first subset and the second subset of the second set of image data or in only one of them. - To make efficient use of processing power, the geometry and location of the
coronary artery 182 is reconstructed only in the first subset or second subset of the second set of image data. Instep 224,step 226 and step 228, lengths of various images of thecoronary artery 182 have been determined. In one implementation, the geometry and location of thecoronary artery 182 is reconstructed only in the set that depicts thecoronary artery 182 with a length closest to that of the lengths of the three-dimensional reconstruction of thecoronary artery 182. In one example, this may be the subset that depicts the coronary artery having the longest length. The lengths used for this may be lengths of single - corresponding - frames from the first subset and the second subset. Alternatively, as the length of thecoronary artery 182 may vary during a heartbeat, a mean or median value of the lengths may be used for this step. - As the coronary artery 281 is in the frames of the second set of image data not filled with
contrast dye 150 or at least not fully filled, the coronary artery is not visible in the frames of the second set of image data and the reconstruction yields a ghost image of the coronary artery 281. It is noted that the location of thecoronary artery 182 thus reconstructed in the frames of the second set of image data may not necessarily be the actual location of thecoronary artery 182, but is rather an estimation of the location. - With the geometry and location of the coronary artery estimated in at least one of the first subset and second subset of the second set of image data available, the procedure proceeds to step 238, in which image data at and optionally near the estimated geometry and location of the coronary artery is monitored for change of intensity. For example, change of contrast may be evaluated at a pre-determined distance from a centreline of the reconstructed vessel. If the full vessel is reconstructed or a volumetric, three dimensional representation of the vessel is reconstructed or a two-dimensional reconstruction with a surface in a two dimensional space is provided, an area, volume, vessel width or other entity is monitored at a monitoring distance from the vessel, which monitoring distance is based on the volume or surface of the vessel at a particular location. The relation between the monitoring distance and the area, width or volume of the reconstructed vessel may for example be linear.
- As contrast dye proceeds from a proximal point of the coronary artery 182 - generally the aorta - to a distal point of the coronary artery 182 - generally the endpoint -, the contrast of the image data changes along the estimated centreline of the
coronary artery 182 in the frames of the second set of image data. In one example, only frames of the first subset are monitored, alternatively or additionally, frames of the second subset of the second set of image data are monitored. In one example, the subset is monitored in which frames depicted the coronary artery with the longest length and/or the length closest to the natural length of thecoronary artery 182. - With the monitoring of change of intensity from frame to frame, over time, progress of the contrast dye in the
coronary vessel 182 may be monitored. Subsequently, the velocity of fluid - contrast dye as well as blood - may be determined. This may, for example, be executed as discussed in patent applicationPCT/NL2021/050635
Claims (15)
- Method of monitoring a flow of a fluid in a vessel of a body of a living being, the method comprising:obtaining a first image data set representing the vessel filled with a first fluid, the first image data set comprising at least one first image frame and the first fluid contrasting with matter surrounding the vessel;obtaining a second image data set representing the vessel substantially void of the first fluid, the second image data set comprising at least one second image frame;based on the first image data set and the second image set, estimating an estimated location of the vessel in the second image set; andmonitoring presence in the second image data set of contrasting image data at the estimated location of the vessel.
- Method according to claim 1, wherein:the first image data set comprises a multitude of first image frames, the first image frames having been acquired consecutively in time; andthe second image data set comprises a multitude of second image frames, the second image frames having been acquired consecutively in time;the method further comprising:tracking, in the first image data set, the vessel over time;estimating, based on the tracking, over time, a location of the vessel in the second frames of the second image data set.
- The method according to claim 2, wherein:the first image data set is acquired over a first time interval relative to a heartbeat sequence;the second image data set is acquired over a second time interval relative to the heartbeat sequence; andthe first time interval and the second time interval cover at least one equivalent part of the heartbeat sequence.
- The method according to claim 3, further comprising:aligning the first image data set and the second image data set based on heartbeat sequence data associated with the first image data set and the second image data set;associating frames in the first image data set and the second image data set with a particular phase in the heartbeat sequence;estimating, over time, estimated locations of the vessel in the second frames of the second image data set based on locations of the vessel in the first frames of the first image data set having substantially the same phase in the heartbeat sequence associated therewith as with the second frames.
- The method according to any one of claim 2 to claim 4, wherein the tracking of the vessel over time comprises:identifying a multitude of points of interest distributed on a representation of the vessel in the first image frames; andtracking locations of the points of interest in the applicable image over time.
- The method according to any one of claim 1 to 5, further comprising:reconstructing a vessel geometry based on the first image data set;estimating a location of the vessel in the second image set based on the first image data set and the reconstructed vessel geometry.
- The method according to claim 6, wherein the first image data set comprises:a first image subset comprises at least a first image acquired under a first angle relative to the living being; anda second image subset comprises at least a second image acquired under a second angle relative to the living being;wherein the reconstructed vessel geometry is a three-dimensional geometry.
- The method according to claim 7, further comprising:determining a first length of the vessel as depicted by the first image subset;determining a second length of the vessel as depicted by the second image subset;determining a natural length of the reconstructed vessel;selecting the first image subset if the first length is closer to the natural length or selecting the second image subset if the second length is closer to the natural length;estimating the location of the vessel in the second image data set based on the subset of the first dataset of which the length is closest to the natural length.
- The method according to claim 8, wherein:the second image data set comprises:a first image subset comprises at least a first image acquired under the first angle relative to the living being; anda second image subset comprises at least a second image acquired under the second angle relative to the living being;the estimated location of the vessel in the second image set is a three-dimensional location; andthe location in the second image data set is determined based on the image subset corresponding to the image subset of the first image data set depicting a length closest to the natural length.
- The method according to any one of claim 1 to 9 wherein the vessel is filling with the first fluid while the second dataset is acquired.
- The method according to any one of claim 1 to 10, further comprising estimating the location of the vessel in the second image data set by providing the first image data set to a trained neural network.
- The method according to any of the preceding claims, wherein the second image data set is acquired prior in time relative to the acquiring the first image data set.
- Method of determining vessel fluid flow velocity of a fluid in a vessel segment of a body of a human or another mammal, the method comprising:obtaining a natural length model of the vessel representing a length of the vessel in accordance with the method according to any one of claim 7 to 9;obtaining a two-dimensional model of the vessel segment based on the first image dataset;dividing the two-dimensional model in vessel sections;receiving the second dataset comprising a multitude of second image frames, the second image frames having been acquired consecutively in time;based on the images of the second dataset, assigning, for each image of the set, at least one intensity value to each vessel section;identifying, in a first image related to a first moment in time, a first vessel section, based on an intensity criterion;identifying, in a second image related to a second moment in time, a second vessel section, based on the intensity criterion, the second moment in time being later than the first moment in time and the second vessel section being distal to the first vessel section;obtaining a propagation length by relating the first vessel section and the second vessel section to the natural length; anddetermining a vessel fluid flow velocity based on the propagation length, and a difference between the first moment in time and the second moment in time.
- A computer programme product comprising computer executable code that cause a computer, when the instructions are loaded in a memory connected to a processing unit comprised by the computer, cause the computer to execute the method according to any one of the preceding claims.
- Device for monitoring a flow of a fluid in a vessel of a body of a living being, the device comprising:an input module arranged to:obtain a first image data set representing the vessel filled with a first fluid, the first image data set comprising at least one first image frame and the first fluid contrasting with matter surrounding the vessel; andobtain a second image data set representing the vessel substantially void of the first fluid, the second image data set comprising at least one second image frame; anda processing unit arranged to:estimate, based on the first image data set and the second image set, an estimated location of the vessel in the second image set; andmonitor presence in the second image data set of contrasting image data at the estimated location of the vessel..
Applications Claiming Priority (1)
| Application Number | Priority Date | Filing Date | Title |
|---|---|---|---|
| NL2029633A NL2029633B1 (en) | 2021-11-04 | 2021-11-04 | Method and device for monitoring a flow of a fluid in a vessel |
Publications (1)
| Publication Number | Publication Date |
|---|---|
| EP4176814A1 true EP4176814A1 (en) | 2023-05-10 |
Family
ID=78829773
Family Applications (1)
| Application Number | Title | Priority Date | Filing Date |
|---|---|---|---|
| EP22205610.3A Pending EP4176814A1 (en) | 2021-11-04 | 2022-11-04 | Method and device for monitoring a flow of a fluid in a vessel |
Country Status (3)
| Country | Link |
|---|---|
| US (1) | US20230135309A1 (en) |
| EP (1) | EP4176814A1 (en) |
| NL (1) | NL2029633B1 (en) |
Citations (3)
| Publication number | Priority date | Publication date | Assignee | Title |
|---|---|---|---|---|
| US20190029624A1 (en) * | 2017-07-26 | 2019-01-31 | Canon U.S.A., Inc. | Method for co-registering and displaying multiple imaging modalities |
| US10687774B2 (en) * | 2014-03-14 | 2020-06-23 | Siemens Aktiengesellschaft | Method and apparatus for visualizing a blood vessel |
| US20200222018A1 (en) * | 2019-01-11 | 2020-07-16 | Pie Medical Imaging B.V. | Methods and Systems for Dynamic Coronary Roadmapping |
-
2021
- 2021-11-04 NL NL2029633A patent/NL2029633B1/en active
-
2022
- 2022-11-03 US US17/980,108 patent/US20230135309A1/en active Pending
- 2022-11-04 EP EP22205610.3A patent/EP4176814A1/en active Pending
Patent Citations (3)
| Publication number | Priority date | Publication date | Assignee | Title |
|---|---|---|---|---|
| US10687774B2 (en) * | 2014-03-14 | 2020-06-23 | Siemens Aktiengesellschaft | Method and apparatus for visualizing a blood vessel |
| US20190029624A1 (en) * | 2017-07-26 | 2019-01-31 | Canon U.S.A., Inc. | Method for co-registering and displaying multiple imaging modalities |
| US20200222018A1 (en) * | 2019-01-11 | 2020-07-16 | Pie Medical Imaging B.V. | Methods and Systems for Dynamic Coronary Roadmapping |
Non-Patent Citations (1)
| Title |
|---|
| C. MICHAEL GIBSON: "TIMI Frame Count", CIRCULATION, vol. 93, 1996, pages 879 - 888 |
Also Published As
| Publication number | Publication date |
|---|---|
| US20230135309A1 (en) | 2023-05-04 |
| NL2029633B1 (en) | 2023-06-02 |
Similar Documents
| Publication | Publication Date | Title |
|---|---|---|
| JP7133346B2 (en) | Method of operation and imaging device for quantitative flow analysis of fluid flowing through a conduit from a sequence of successive image frames of said conduit | |
| US10580526B2 (en) | System and method for calculating vessel flow parameters based on angiography | |
| CN105380598B (en) | Method and system for the automatic treatment planning for arteriarctia | |
| EP2775922B1 (en) | Method and system for detecting and analyzing heart mechanics | |
| US10299862B2 (en) | Three-dimensional quantitative heart hemodynamics in medical imaging | |
| US7454043B2 (en) | Image processing unit and method of associating stored images with current images | |
| US10674986B2 (en) | Methods for personalizing blood flow models | |
| US10111635B2 (en) | Image processing apparatus, image processing method, and storage medium | |
| US20170235915A1 (en) | Personalized model with regular integration of data | |
| CN106659400A (en) | Apparatus for determining a fractional flow reserve value | |
| US20170325770A1 (en) | Methods for personalizing blood flow models | |
| CN111134651A (en) | Method, device and system for calculating fractional flow reserve based on intracavity images and computer storage medium | |
| EP2776960A1 (en) | Method and system for multi-scale anatomical and functional modeling of coronary circulation | |
| US20130253319A1 (en) | Method and system for acquiring and analyzing multiple image data loops | |
| JP2021528137A (en) | Methods and equipment for quantitative hemodynamic flow analysis | |
| JP2006516440A (en) | 3D object reconstruction method | |
| US20190076196A1 (en) | Vessel geometry and additional boundary conditions for hemodynamic ffr/ifr simulations from intravascular imaging | |
| EP3786972A1 (en) | Improving performance of machine learning models for automatic quantification of coronary artery disease | |
| JP2015526150A (en) | Image data processing method | |
| EP4176814A1 (en) | Method and device for monitoring a flow of a fluid in a vessel | |
| CN113116385B (en) | Arterial intracavity ultrasonic imaging method, device, equipment and system | |
| CN112446499A (en) | Improving performance of machine learning models for automated quantification of coronary artery disease | |
| US20220015730A1 (en) | Most relevant x-ray image selection for hemodynamic simulation | |
| Zheng et al. | Analysis of coronary arterial dynamics from x-ray angiographic sequences | |
| CN117809852A (en) | Method, device, equipment and medium for determining coronary blood flow reserve fraction |
Legal Events
| Date | Code | Title | Description |
|---|---|---|---|
| PUAI | Public reference made under article 153(3) epc to a published international application that has entered the european phase |
Free format text: ORIGINAL CODE: 0009012 |
|
| STAA | Information on the status of an ep patent application or granted ep patent |
Free format text: STATUS: THE APPLICATION HAS BEEN PUBLISHED |
|
| AK | Designated contracting states |
Kind code of ref document: A1 Designated state(s): AL AT BE BG CH CY CZ DE DK EE ES FI FR GB GR HR HU IE IS IT LI LT LU LV MC ME MK MT NL NO PL PT RO RS SE SI SK SM TR |
|
| STAA | Information on the status of an ep patent application or granted ep patent |
Free format text: STATUS: REQUEST FOR EXAMINATION WAS MADE |
|
| 17P | Request for examination filed |
Effective date: 20231110 |
|
| RBV | Designated contracting states (corrected) |
Designated state(s): AL AT BE BG CH CY CZ DE DK EE ES FI FR GB GR HR HU IE IS IT LI LT LU LV MC ME MK MT NL NO PL PT RO RS SE SI SK SM TR |
|
| GRAP | Despatch of communication of intention to grant a patent |
Free format text: ORIGINAL CODE: EPIDOSNIGR1 |
|
| STAA | Information on the status of an ep patent application or granted ep patent |
Free format text: STATUS: GRANT OF PATENT IS INTENDED |
|
| INTG | Intention to grant announced |
Effective date: 20240125 |