EP4119972A1 - Radio wave emission source visualizing device, and bandwidth expansion method - Google Patents
Radio wave emission source visualizing device, and bandwidth expansion method Download PDFInfo
- Publication number
- EP4119972A1 EP4119972A1 EP21767292.2A EP21767292A EP4119972A1 EP 4119972 A1 EP4119972 A1 EP 4119972A1 EP 21767292 A EP21767292 A EP 21767292A EP 4119972 A1 EP4119972 A1 EP 4119972A1
- Authority
- EP
- European Patent Office
- Prior art keywords
- antenna
- incoming
- emission source
- radio wave
- visualization apparatus
- Prior art date
- Legal status (The legal status is an assumption and is not a legal conclusion. Google has not performed a legal analysis and makes no representation as to the accuracy of the status listed.)
- Pending
Links
Images


Classifications
-
- G—PHYSICS
- G01—MEASURING; TESTING
- G01S—RADIO DIRECTION-FINDING; RADIO NAVIGATION; DETERMINING DISTANCE OR VELOCITY BY USE OF RADIO WAVES; LOCATING OR PRESENCE-DETECTING BY USE OF THE REFLECTION OR RERADIATION OF RADIO WAVES; ANALOGOUS ARRANGEMENTS USING OTHER WAVES
- G01S3/00—Direction-finders for determining the direction from which infrasonic, sonic, ultrasonic or electromagnetic waves, or particle emission, not having a directional significance, are being received
- G01S3/02—Direction-finders for determining the direction from which infrasonic, sonic, ultrasonic or electromagnetic waves, or particle emission, not having a directional significance, are being received using radio waves
- G01S3/04—Details
- G01S3/043—Receivers
-
- H—ELECTRICITY
- H04—ELECTRIC COMMUNICATION TECHNIQUE
- H04W—WIRELESS COMMUNICATION NETWORKS
- H04W16/00—Network planning, e.g. coverage or traffic planning tools; Network deployment, e.g. resource partitioning or cells structures
- H04W16/22—Traffic simulation tools or models
-
- G—PHYSICS
- G01—MEASURING; TESTING
- G01S—RADIO DIRECTION-FINDING; RADIO NAVIGATION; DETERMINING DISTANCE OR VELOCITY BY USE OF RADIO WAVES; LOCATING OR PRESENCE-DETECTING BY USE OF THE REFLECTION OR RERADIATION OF RADIO WAVES; ANALOGOUS ARRANGEMENTS USING OTHER WAVES
- G01S3/00—Direction-finders for determining the direction from which infrasonic, sonic, ultrasonic or electromagnetic waves, or particle emission, not having a directional significance, are being received
- G01S3/02—Direction-finders for determining the direction from which infrasonic, sonic, ultrasonic or electromagnetic waves, or particle emission, not having a directional significance, are being received using radio waves
- G01S3/04—Details
- G01S3/046—Displays or indicators
-
- G—PHYSICS
- G01—MEASURING; TESTING
- G01S—RADIO DIRECTION-FINDING; RADIO NAVIGATION; DETERMINING DISTANCE OR VELOCITY BY USE OF RADIO WAVES; LOCATING OR PRESENCE-DETECTING BY USE OF THE REFLECTION OR RERADIATION OF RADIO WAVES; ANALOGOUS ARRANGEMENTS USING OTHER WAVES
- G01S3/00—Direction-finders for determining the direction from which infrasonic, sonic, ultrasonic or electromagnetic waves, or particle emission, not having a directional significance, are being received
- G01S3/02—Direction-finders for determining the direction from which infrasonic, sonic, ultrasonic or electromagnetic waves, or particle emission, not having a directional significance, are being received using radio waves
- G01S3/14—Systems for determining direction or deviation from predetermined direction
- G01S3/46—Systems for determining direction or deviation from predetermined direction using antennas spaced apart and measuring phase or time difference between signals therefrom, i.e. path-difference systems
- G01S3/48—Systems for determining direction or deviation from predetermined direction using antennas spaced apart and measuring phase or time difference between signals therefrom, i.e. path-difference systems the waves arriving at the antennas being continuous or intermittent and the phase difference of signals derived therefrom being measured
-
- H—ELECTRICITY
- H01—ELECTRIC ELEMENTS
- H01Q—ANTENNAS, i.e. RADIO AERIALS
- H01Q21/00—Antenna arrays or systems
- H01Q21/06—Arrays of individually energised antenna units similarly polarised and spaced apart
- H01Q21/061—Two dimensional planar arrays
-
- H—ELECTRICITY
- H01—ELECTRIC ELEMENTS
- H01Q—ANTENNAS, i.e. RADIO AERIALS
- H01Q3/00—Arrangements for changing or varying the orientation or the shape of the directional pattern of the waves radiated from an antenna or antenna system
- H01Q3/24—Arrangements for changing or varying the orientation or the shape of the directional pattern of the waves radiated from an antenna or antenna system varying the orientation by switching energy from one active radiating element to another, e.g. for beam switching
-
- H—ELECTRICITY
- H01—ELECTRIC ELEMENTS
- H01Q—ANTENNAS, i.e. RADIO AERIALS
- H01Q5/00—Arrangements for simultaneous operation of antennas on two or more different wavebands, e.g. dual-band or multi-band arrangements
- H01Q5/40—Imbricated or interleaved structures; Combined or electromagnetically coupled arrangements, e.g. comprising two or more non-connected fed radiating elements
- H01Q5/42—Imbricated or interleaved structures; Combined or electromagnetically coupled arrangements, e.g. comprising two or more non-connected fed radiating elements using two or more imbricated arrays
-
- H—ELECTRICITY
- H04—ELECTRIC COMMUNICATION TECHNIQUE
- H04B—TRANSMISSION
- H04B17/00—Monitoring; Testing
- H04B17/20—Monitoring; Testing of receivers
- H04B17/23—Indication means, e.g. displays, alarms, audible means
-
- H—ELECTRICITY
- H04—ELECTRIC COMMUNICATION TECHNIQUE
- H04B—TRANSMISSION
- H04B7/00—Radio transmission systems, i.e. using radiation field
- H04B7/02—Diversity systems; Multi-antenna system, i.e. transmission or reception using multiple antennas
- H04B7/04—Diversity systems; Multi-antenna system, i.e. transmission or reception using multiple antennas using two or more spaced independent antennas
- H04B7/06—Diversity systems; Multi-antenna system, i.e. transmission or reception using multiple antennas using two or more spaced independent antennas at the transmitting station
- H04B7/0602—Diversity systems; Multi-antenna system, i.e. transmission or reception using multiple antennas using two or more spaced independent antennas at the transmitting station using antenna switching
-
- H—ELECTRICITY
- H04—ELECTRIC COMMUNICATION TECHNIQUE
- H04B—TRANSMISSION
- H04B7/00—Radio transmission systems, i.e. using radiation field
- H04B7/02—Diversity systems; Multi-antenna system, i.e. transmission or reception using multiple antennas
- H04B7/04—Diversity systems; Multi-antenna system, i.e. transmission or reception using multiple antennas using two or more spaced independent antennas
- H04B7/06—Diversity systems; Multi-antenna system, i.e. transmission or reception using multiple antennas using two or more spaced independent antennas at the transmitting station
- H04B7/0686—Hybrid systems, i.e. switching and simultaneous transmission
- H04B7/0691—Hybrid systems, i.e. switching and simultaneous transmission using subgroups of transmit antennas
-
- H—ELECTRICITY
- H01—ELECTRIC ELEMENTS
- H01Q—ANTENNAS, i.e. RADIO AERIALS
- H01Q3/00—Arrangements for changing or varying the orientation or the shape of the directional pattern of the waves radiated from an antenna or antenna system
- H01Q3/24—Arrangements for changing or varying the orientation or the shape of the directional pattern of the waves radiated from an antenna or antenna system varying the orientation by switching energy from one active radiating element to another, e.g. for beam switching
- H01Q3/247—Arrangements for changing or varying the orientation or the shape of the directional pattern of the waves radiated from an antenna or antenna system varying the orientation by switching energy from one active radiating element to another, e.g. for beam switching by switching different parts of a primary active element
Definitions
- Embodiments described herein relate generally to a radio wave emission source visualization apparatus and a band expansion method.
- a radio wave emission source visualization apparatus can specify a radiation position of a radio wave in a desired band and display it so as to be superimposed on a camera image. For example, since it can pinpoint illegal radio waves and their position can be displayed, it is operated in public service agencies, etc. Since the illegal radio waves are transmitted at various frequencies, it is required to expand a frequency band that can be captured.
- an object of the present invention is to provide a radio wave emission source visualization apparatus and a band expansion method for achieving a wider band.
- a radio wave emission source visualization apparatus includes an antenna unit, a selection unit, an estimation unit, an imaging unit and a creation unit.
- the antenna unit includes N (N is a natural number of 2 or more) antenna elements arranged in an array and captures an incoming wave.
- the selection unit selects an antenna element group including M (M is a natural number of N or less) antenna elements from the N antenna elements according to a band of the incoming wave.
- the estimation unit estimates an incoming direction of the incoming wave from an element signal of each of the antenna elements included in the selected antenna element group.
- the imaging unit acquires image data by imaging an orientation direction of an aperture of the antenna unit.
- the creation unit creates a visualized image by visually synthesizing the estimated incoming direction with the image data.
- FIG. 1 is a functional block diagram showing an example of a radio wave emission source visualization apparatus according to an embodiment.
- the radio wave emission source visualization apparatus of FIG. 1 includes an array antenna 2, an antenna switcher 3, a reference antenna 4, a frequency converter 5, an A/D (analog/digital) converter 6, an incoming direction estimation processor 7, a camera unit 8, an image mixer 9, a GPS receiver 10, a direction sensor 11, a map displaying processor 12, a display 13, and a memory 14.
- the array antenna 2 includes N (N is a natural number of 2 or more) antenna elements 1-1 to 1-n arranged in an array, and captures radio waves (incoming waves) from a radio wave emission source.
- the antenna switcher 3 is, for example, a switching element such as a diode switch, and selectively switches the antenna elements 1-1 to 1-n according to a band of an incoming wave to be captured. That is, the antenna switcher 3 selects an antenna element group including M (M is a natural number of N or less) antenna elements from the antenna elements 1-1 to 1-n according to the band of the incoming wave.
- the antenna elements 1-1 to 1-n and the reference antenna 4 all capture incoming waves in the same band and output element signals.
- the shape and type of the array antenna 2, the total number of antenna elements, intervals between the antenna elements 1-1 to 1-n, etc. are optimized according to a measurement target, a measurement purpose, etc.
- any one of the antenna elements 1-1 to 1-n is used as the reference antenna 4, a structure for separately attaching the reference antenna 4 can be omitted, which can contribute to reduction in size and weight.
- the frequency converter 5 amplifies each element signal from the reference antenna 4 and the array antenna 2, and performs frequency conversion to an intermediate frequency band in which sampling is possible.
- the A/D converter 6 converts an analog signal frequency-converted by the frequency converter 5 into a digital signal.
- the incoming direction estimation processor 7 estimates an incoming direction of an incoming wave captured by the array antenna 2. Specifically, the incoming direction estimation processor 7 detects a phase difference between an element signal of the reference antenna 4 and an element signal of each antenna element included in a selected antenna element group, and estimates the incoming direction of the incoming wave by, for example, a radio holography method. The incoming direction of the incoming wave estimated by the incoming direction estimation processor 7 indicates relative azimuth angle and elevation angle with respect to the direction of the array antenna 2.
- the camera unit 8 is installed in the vicinity of the array antenna 2, and acquires image data by photographing an orientation direction of the aperture of the array antenna 2. If a mounting position of the camera unit 8 is away from a phase center of the array antenna 2, an accurate visualized image can be acquired by correcting a parallax.
- the image mixer 9 generates a visualized image by visually synthesizing the incoming direction of the incoming wave estimated by the incoming direction estimation processor 7 with the image data acquired by the camera unit 8. That is, the image mixer 9 creates a visualized image by synthesizing an electric field intensity distribution on a two-dimensional plane of the incoming wave with the image data.
- the GPS receiver 10 acquires position information of the array antenna 2. Specifically, the GPS receiver 10 receives a positioning signal from a GPS (Global Positioning System) satellite, and acquires position information such as latitude and longitude of the array antenna 2.
- the direction sensor 11 is, for example, a magnetic direction sensor, and acquires direction information of the array antenna 2 using geomagnetism.
- the map displaying processor 12 acquires map information around the array antenna 2 based on the position information acquired by the GPS receiver 10.
- the map information can be acquired from map data 14a stored in advance in the memory 14.
- the map information may be acquired from a network such as the Internet.
- the display 13 is, for example, a liquid crystal display (LCD), and displays a map indicating the incoming direction of the incoming wave received by the array antenna 2 and the position of the array antenna 2 based on the map information output by the map displaying processor 12. Further, the display 13 displays the visualized image generated by the image mixer 9.
- LCD liquid crystal display
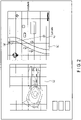
- FIG. 2 is a diagram showing an example of display on the display 13 in FIG. 1 .
- the display 13 displays, for example, a camera window (a) and a map window (b).
- the camera window (a) displays a superimposed image in which distribution of electric field intensity of an incoming wave on a two-dimensional plane is synthesized with an image captured by the camera unit 8.
- the electric field intensity of the estimated incoming wave is drawn approximately on contour lines around an incoming direction estimated by the incoming direction estimation processor 7.
- An image (color map) created with different display colors according to the electric field intensity may be displayed.
- a position (c) of the radio wave emission source visualization apparatus acquired by the GPS receiver 10 is displayed by being superimposed on the peripheral map acquired from the map data 14a. Further, in the map window (b), an arrow is drawn from the position (c) of the radio wave emission source visualization apparatus to a position (d) of a radio wave emission source. According to the map window (b), this arrow indicates that the radio wave emission source is located slightly to the left of a person searching. This also corresponds to the visualization screen (a).
- FIG. 3 is a diagram showing an example of the array antenna 2 viewed from the aperture face.
- the array antenna may have, for example, 25 antenna elements of 5 rows by 5 columns.
- a broadband antenna that covers the frequency bands (1) and (2) is used, and an antenna array is selected from a plurality of antenna arrays according to the reception frequency so that the element interval can be optimized.
- the intervals between the antenna elements can be adaptively set.
- two array antennas are integrated into one array antenna, and it is possible to observe an incoming broadband wave extending from 700 MHz to 2700 MHz, for example, using the common array antenna.
- an array arrangement at intervals of ⁇ /2 with respect to a reception wavelength ( ⁇ ) is ideal. If the element interval is ⁇ /2 or less, a peak of a visualization processing output becomes broad and it becomes difficult to specify a radiation position. Further, if ⁇ becomes close to the element interval, the peak of the visualization processing output becomes sharp, but a virtual image is also displayed.
- an upper limit of a reception frequency range is a frequency twice that of a lower limit frequency, and the antenna elements are arranged in an array at intervals of ⁇ /2 with respect to a wavelength at a center frequency. For this reason, the receivable band is naturally limited.
- the antenna switcher 3 selects an antenna element group including antenna elements arranged at about half-wave intervals with respect to the wavelength of the incoming wave, so that the incoming wave can be captured by the antenna elements arranged in an array at the intervals of ⁇ /2 with respect to the reception wavelength ⁇ .
- the display 13 can be realized by a screen of a notebook personal computer separate from the radio wave emission source visualization apparatus. Alternatively, it may be a screen of a tablet. Further, the camera window (a) and the map window (b) do not need to be displayed together on the same screen, and the screen may be switched in response to a user's operation or the like.
- the display method by the display 13 is not limited to the above-described method, and various modifications can be made.
- the display 13 may display the incoming radio wave direction in the camera window (a) with a number, a symbol, a mark, or the like other than the color corresponding to the electric field intensity.
- the display 13 may use a map in which various pieces of information other than buildings are described in the map window (b).
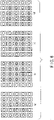
- FIG. 6 is a diagram for explaining that a plurality of antenna element groups can be formed.
- the 4 ⁇ 4 array antenna element group can be switched in four ways.
- the antenna switcher 3 selectively switches these plurality of antenna element groups, and switches and outputs the element signals from the antenna element groups.
- the incoming direction estimation processor 7 averages the element signals from the antenna element groups to estimate an incoming direction of an incoming wave. In this way, it is possible to average and cancel an influence of multipath propagation generated in each antenna element group. As a result, it is possible to enhance resistance to an environment in which multipath propagation is likely to occur, such as an urban area.
Landscapes
- Engineering & Computer Science (AREA)
- Physics & Mathematics (AREA)
- Computer Networks & Wireless Communication (AREA)
- Signal Processing (AREA)
- General Physics & Mathematics (AREA)
- Radar, Positioning & Navigation (AREA)
- Remote Sensing (AREA)
- Electromagnetism (AREA)
- Variable-Direction Aerials And Aerial Arrays (AREA)
Abstract
Description
- Embodiments described herein relate generally to a radio wave emission source visualization apparatus and a band expansion method.
- A radio wave emission source visualization apparatus can specify a radiation position of a radio wave in a desired band and display it so as to be superimposed on a camera image. For example, since it can pinpoint illegal radio waves and their position can be displayed, it is operated in public service agencies, etc. Since the illegal radio waves are transmitted at various frequencies, it is required to expand a frequency band that can be captured.
-
- Patent Literature 1:
Japanese Patent Application KOKAI Publication No. 2005-322972 - Patent Literature 2:
Japanese Patent Application KOKAI Publication No. 2009-232213 - Patent Literature 3:
Japanese Patent Application KOKAI Publication No. 2012-78163 - In this type of apparatus, it is considered sufficient to cover at most 700 MHz to 1500 MHz; however, in recent years, in addition to this, the apparatus is required to be able to cover a band of 1400 MHz to 2700 MHz. That is, while a band of one octave has been sufficient conventionally, an apparatus capable of covering a band of two octaves at once is required.
- However, as is well known, in an
array antenna 2, an arrangement at intervals of λ/2 with respect to a reception wavelength (λ) is ideal, and if an element interval is λ/2 or less, a peak of a visualization processing output becomes broad, and it becomes difficult to specify a radiation position. If λ becomes close to the element interval, the peak of the visualization processing output becomes sharp, but a virtual image also appears. As described above, in a target band of the radio wave emission source visualization apparatus, conditions related to an antenna design are strict, and it is difficult to widen the band. - Accordingly, an object of the present invention is to provide a radio wave emission source visualization apparatus and a band expansion method for achieving a wider band.
- In general, according to one embodiment, a radio wave emission source visualization apparatus includes an antenna unit, a selection unit, an estimation unit, an imaging unit and a creation unit. The antenna unit includes N (N is a natural number of 2 or more) antenna elements arranged in an array and captures an incoming wave. The selection unit selects an antenna element group including M (M is a natural number of N or less) antenna elements from the N antenna elements according to a band of the incoming wave. The estimation unit estimates an incoming direction of the incoming wave from an element signal of each of the antenna elements included in the selected antenna element group. The imaging unit acquires image data by imaging an orientation direction of an aperture of the antenna unit. The creation unit creates a visualized image by visually synthesizing the estimated incoming direction with the image data.
-
-
FIG. 1 is a functional block diagram showing an example of a radio wave emission source visualization apparatus according to an embodiment. -
FIG. 2 is a diagram showing an example of display in adisplay 13 inFIG. 1 . -
FIG. 3 is a diagram showing an example of anarray antenna 2 viewed from an aperture face. -
FIG. 4 is a diagram showing an example of antenna elements selected when capturing a band on a low frequency side. -
FIG. 5 is a diagram showing an example of antenna elements selected when capturing a band on a high frequency side. -
FIG. 6 is a diagram for explaining that a plurality of antenna element groups can be formed. -
FIG. 1 is a functional block diagram showing an example of a radio wave emission source visualization apparatus according to an embodiment. The radio wave emission source visualization apparatus ofFIG. 1 includes anarray antenna 2, anantenna switcher 3, a reference antenna 4, afrequency converter 5, an A/D (analog/digital)converter 6, an incoming direction estimation processor 7, acamera unit 8, animage mixer 9, aGPS receiver 10, adirection sensor 11, amap displaying processor 12, adisplay 13, and amemory 14. - The
array antenna 2 includes N (N is a natural number of 2 or more) antenna elements 1-1 to 1-n arranged in an array, and captures radio waves (incoming waves) from a radio wave emission source. Theantenna switcher 3 is, for example, a switching element such as a diode switch, and selectively switches the antenna elements 1-1 to 1-n according to a band of an incoming wave to be captured. That is, theantenna switcher 3 selects an antenna element group including M (M is a natural number of N or less) antenna elements from the antenna elements 1-1 to 1-n according to the band of the incoming wave. - The antenna elements 1-1 to 1-n and the reference antenna 4 all capture incoming waves in the same band and output element signals. The shape and type of the
array antenna 2, the total number of antenna elements, intervals between the antenna elements 1-1 to 1-n, etc. are optimized according to a measurement target, a measurement purpose, etc. - If any one of the antenna elements 1-1 to 1-n is used as the reference antenna 4, a structure for separately attaching the reference antenna 4 can be omitted, which can contribute to reduction in size and weight.
- The
frequency converter 5 amplifies each element signal from the reference antenna 4 and thearray antenna 2, and performs frequency conversion to an intermediate frequency band in which sampling is possible. The A/D converter 6 converts an analog signal frequency-converted by thefrequency converter 5 into a digital signal. - The incoming direction estimation processor 7 estimates an incoming direction of an incoming wave captured by the
array antenna 2. Specifically, the incoming direction estimation processor 7 detects a phase difference between an element signal of the reference antenna 4 and an element signal of each antenna element included in a selected antenna element group, and estimates the incoming direction of the incoming wave by, for example, a radio holography method. The incoming direction of the incoming wave estimated by the incoming direction estimation processor 7 indicates relative azimuth angle and elevation angle with respect to the direction of thearray antenna 2. - The
camera unit 8 is installed in the vicinity of thearray antenna 2, and acquires image data by photographing an orientation direction of the aperture of thearray antenna 2. If a mounting position of thecamera unit 8 is away from a phase center of thearray antenna 2, an accurate visualized image can be acquired by correcting a parallax. - The
image mixer 9 generates a visualized image by visually synthesizing the incoming direction of the incoming wave estimated by the incoming direction estimation processor 7 with the image data acquired by thecamera unit 8. That is, theimage mixer 9 creates a visualized image by synthesizing an electric field intensity distribution on a two-dimensional plane of the incoming wave with the image data. - The
GPS receiver 10 acquires position information of thearray antenna 2. Specifically, theGPS receiver 10 receives a positioning signal from a GPS (Global Positioning System) satellite, and acquires position information such as latitude and longitude of thearray antenna 2. Thedirection sensor 11 is, for example, a magnetic direction sensor, and acquires direction information of thearray antenna 2 using geomagnetism. - The
map displaying processor 12 acquires map information around thearray antenna 2 based on the position information acquired by theGPS receiver 10. The map information can be acquired frommap data 14a stored in advance in thememory 14. Alternatively, the map information may be acquired from a network such as the Internet. - The
display 13 is, for example, a liquid crystal display (LCD), and displays a map indicating the incoming direction of the incoming wave received by thearray antenna 2 and the position of thearray antenna 2 based on the map information output by themap displaying processor 12. Further, thedisplay 13 displays the visualized image generated by theimage mixer 9. - Various controls for the
array antenna 2,antenna switcher 3, reference antenna 4,frequency converter 5, A/D (analog/digital)converter 6, incoming direction estimation processor 7,camera unit 8,image mixer 9,GPS receiver 10,direction sensor 11,map displaying processor 12, anddisplay 13, or arithmetic processing by software is realized by aprogram 14b stored in thememory 14. -
FIG. 2 is a diagram showing an example of display on thedisplay 13 inFIG. 1 . Thedisplay 13 displays, for example, a camera window (a) and a map window (b). - The camera window (a) displays a superimposed image in which distribution of electric field intensity of an incoming wave on a two-dimensional plane is synthesized with an image captured by the
camera unit 8. In the camera window (a), the electric field intensity of the estimated incoming wave is drawn approximately on contour lines around an incoming direction estimated by the incoming direction estimation processor 7. An image (color map) created with different display colors according to the electric field intensity may be displayed. - In the map window (b), a position (c) of the radio wave emission source visualization apparatus acquired by the
GPS receiver 10 is displayed by being superimposed on the peripheral map acquired from themap data 14a. Further, in the map window (b), an arrow is drawn from the position (c) of the radio wave emission source visualization apparatus to a position (d) of a radio wave emission source. According to the map window (b), this arrow indicates that the radio wave emission source is located slightly to the left of a person searching. This also corresponds to the visualization screen (a). -
FIG. 3 is a diagram showing an example of thearray antenna 2 viewed from the aperture face. The array antenna may have, for example, 25 antenna elements of 5 rows by 5 columns. - Here, consider capturing an incoming wave in a band ranging from 700 MHz to 2700 MHz, for example. In the existing technology, for example, it is necessary to divide the band as shown in the following (1) and (2) and to provide a dedicated array antenna for each band.
- (1) 700 MHz to 1500 MHz
- (2) 1400 MHz to 2700 MHz
- Therefore, in the embodiment, a broadband antenna that covers the frequency bands (1) and (2) is used, and an antenna array is selected from a plurality of antenna arrays according to the reception frequency so that the element interval can be optimized.
- As shown in
FIG. 4 , when the band (1) is captured, a 3 × 3 array of antenna elements indicated by hatching (hatched lines) in the figure is selected, and an incoming radio wave direction is calculated from an element signal from each antenna element of this antenna element group. On the other hand, when the band (2) is captured, a 4 × 4 array of antenna elements indicated by hatching (hatched lines) inFIG. 5 is selected, and an incoming radio wave direction is calculated from an element signal from each antenna element of this antenna element group. - In this way, by selecting the antenna elements according to the band of the incoming wave to be captured and switching the antenna array, the intervals between the antenna elements can be adaptively set. As a result, two array antennas are integrated into one array antenna, and it is possible to observe an incoming broadband wave extending from 700 MHz to 2700 MHz, for example, using the common array antenna.
- In the array antenna, an array arrangement at intervals of λ/2 with respect to a reception wavelength (λ) is ideal. If the element interval is λ/2 or less, a peak of a visualization processing output becomes broad and it becomes difficult to specify a radiation position. Further, if λ becomes close to the element interval, the peak of the visualization processing output becomes sharp, but a virtual image is also displayed. Thus, in the existing technology, an upper limit of a reception frequency range is a frequency twice that of a lower limit frequency, and the antenna elements are arranged in an array at intervals of λ/2 with respect to a wavelength at a center frequency. For this reason, the receivable band is naturally limited.
- In contrast, in the embodiment, the
antenna switcher 3 selects an antenna element group including antenna elements arranged at about half-wave intervals with respect to the wavelength of the incoming wave, so that the incoming wave can be captured by the antenna elements arranged in an array at the intervals of λ/2 with respect to the reception wavelength λ. For these reasons, according to the embodiment, it is possible to provide a radio wave emission source visualization apparatus and a band expansion method that achieve a wider band. - Note that the present invention is not limited to the embodiment described above. For example, the
display 13 can be realized by a screen of a notebook personal computer separate from the radio wave emission source visualization apparatus. Alternatively, it may be a screen of a tablet. Further, the camera window (a) and the map window (b) do not need to be displayed together on the same screen, and the screen may be switched in response to a user's operation or the like. - The display method by the
display 13 is not limited to the above-described method, and various modifications can be made. For example, thedisplay 13 may display the incoming radio wave direction in the camera window (a) with a number, a symbol, a mark, or the like other than the color corresponding to the electric field intensity. Further, thedisplay 13 may use a map in which various pieces of information other than buildings are described in the map window (b). - Further, it is also possible to take measures against multipath propagation.
-
FIG. 6 is a diagram for explaining that a plurality of antenna element groups can be formed. In the 5 × 5 array antenna, as shown inFIGS. 6 (a), 6 (b), 6 (c), and 6 (d) , the 4 × 4 array antenna element group can be switched in four ways. Theantenna switcher 3 selectively switches these plurality of antenna element groups, and switches and outputs the element signals from the antenna element groups. Then, the incoming direction estimation processor 7 averages the element signals from the antenna element groups to estimate an incoming direction of an incoming wave. In this way, it is possible to average and cancel an influence of multipath propagation generated in each antenna element group. As a result, it is possible to enhance resistance to an environment in which multipath propagation is likely to occur, such as an urban area. - While certain embodiments have been described, these embodiments have been presented by way of example only, and are not intended to limit the scope of the inventions. Indeed, the novel embodiments described herein may be embodied in a variety of other forms; furthermore, various omissions, substitutions and changes in the form of the embodiments described herein may be made without departing from the spirit of the inventions. The accompanying claims and their equivalents are intended to cover such forms or modifications as would fall within the scope and spirit of the inventions.
Claims (10)
- A radio wave emission source visualization apparatus comprising:an antenna unit(2) including N (N is a natural number of 2 or more) antenna elements(1-1 to 1-n) arranged in an array and configured to capture an incoming wave;a selection unit(3) configured to select an antenna element group including M (M is a natural number of N or less) antenna elements from the N antenna elements according to a band of the incoming wave;an estimation unit(7) configured to estimate an incoming direction of the incoming wave from an element signal of each of the antenna elements included in the selected antenna element group;an imaging unit(8) configured to acquire image data by imaging an orientation direction of an aperture of the antenna unit(2); anda creation unit(9) configured to create a visualized image by visually synthesizing the estimated incoming direction with the image data.
- The radio wave emission source visualization apparatus according to claim 1, wherein the selection unit(3) is configured to select an antenna element group including antenna elements arranged at about half-wave intervals with respect to a wavelength of the incoming wave.
- The radio wave emission source visualization apparatus according to claim 1, wherein the creation unit(9) is configured to create the visualized image by synthesizing an electric field intensity distribution of the incoming wave on a two-dimensional plane with the image data.
- The radio wave emission source visualization apparatus according to claim 1, whereinthe selection unit(3) is configured to switch and output element signals from a plurality of different antenna element groups, andthe estimation unit(7) is configured to estimate the incoming direction by averaging the element signals from the antenna element groups.
- The radio wave emission source visualization apparatus according to any one of claims 1 to 4, further comprising a display(13) configured to display the visualized image.
- A method for expanding a band of a radio wave emission source visualization apparatus comprising an antenna unit(2) including N (N is a natural number of 2 or more) antenna elements(1-1 to 1-n) arranged in an array and configured to capture an incoming wave, the method comprising:selecting, by the radio wave emission source visualization apparatus, an antenna element group including M (M is a natural number of N or less) antenna elements from the N antenna elements according to a band of the incoming wave;estimating, by the radio wave emission source visualization apparatus, an incoming direction of the incoming wave from an element signal of each of the antenna elements included in the selected antenna element group;acquiring, by the radio wave emission source visualization apparatus, image data by imaging an orientation direction of an aperture of the antenna unit(2) by an imaging unit(8); andcreating, by the radio wave emission source visualization apparatus, a visualized image by visually synthesizing the estimated incoming direction with the image data.
- The band expansion method according to claim 6, wherein the radio wave emission source visualization apparatus is configured to select an antenna element group including antenna elements arranged at about half-wave intervals with respect to a wavelength of the incoming wave.
- The band expansion method according to claim 6,
wherein the radio wave emission source visualization apparatus creates the visualized image by synthesizing an electric field intensity distribution of the incoming wave on a two-dimensional plane with the image data. - The band expansion method according to claim 6, comprising:switching and outputting, by the radio wave emission source visualization apparatus, element signals from a plurality of different antenna element groups; andestimating, by the radio wave emission source visualization apparatus, the incoming direction by averaging the element signals from the antenna element groups.
- The band expansion method according to any one of claims 6 to 9, further comprising displaying the visualized image on a display(13).
Applications Claiming Priority (2)
| Application Number | Priority Date | Filing Date | Title |
|---|---|---|---|
| JP2020040595A JP7362521B2 (en) | 2020-03-10 | 2020-03-10 | Radio wave emission source visualization device and band expansion method |
| PCT/JP2021/008795 WO2021182347A1 (en) | 2020-03-10 | 2021-03-05 | Radio wave emission source visualizing device, and bandwidth expansion method |
Publications (2)
| Publication Number | Publication Date |
|---|---|
| EP4119972A1 true EP4119972A1 (en) | 2023-01-18 |
| EP4119972A4 EP4119972A4 (en) | 2024-03-20 |
Family
ID=77671660
Family Applications (1)
| Application Number | Title | Priority Date | Filing Date |
|---|---|---|---|
| EP21767292.2A Pending EP4119972A4 (en) | 2020-03-10 | 2021-03-05 | DEVICE FOR VISUALIZING RADIO WAVE EMISSION SOURCES AND BANDWIDTH EXPANSION METHOD |
Country Status (4)
| Country | Link |
|---|---|
| US (1) | US12375939B2 (en) |
| EP (1) | EP4119972A4 (en) |
| JP (1) | JP7362521B2 (en) |
| WO (1) | WO2021182347A1 (en) |
Families Citing this family (1)
| Publication number | Priority date | Publication date | Assignee | Title |
|---|---|---|---|---|
| JP7815711B2 (en) * | 2021-11-26 | 2026-02-18 | 日本電気株式会社 | Radio wave feature calculation device, radio wave source identification device, and methods and programs thereof |
Family Cites Families (21)
| Publication number | Priority date | Publication date | Assignee | Title |
|---|---|---|---|---|
| ES2205898T3 (en) * | 1999-10-26 | 2004-05-01 | Fractus, S.A. | MULTIBAND CLUSTERS OF INTERRELATED ANTENNAS. |
| JP3477132B2 (en) | 1999-12-27 | 2003-12-10 | 株式会社東芝 | Arrival azimuth measuring device for incoming wave |
| JP4309110B2 (en) * | 2002-09-27 | 2009-08-05 | パナソニック株式会社 | Adaptive antenna wireless communication device |
| JP4155226B2 (en) | 2004-05-06 | 2008-09-24 | 株式会社リコー | Antenna module, radio module, radio system, and control method thereof |
| JP4967384B2 (en) | 2006-03-10 | 2012-07-04 | 株式会社村田製作所 | Radar equipment |
| SE529885C2 (en) * | 2006-05-22 | 2007-12-18 | Powerwave Technologies Sweden | Dual band antenna arrangement |
| JP2009232213A (en) | 2008-03-24 | 2009-10-08 | Nec Corp | Multiband array antenna |
| US8681218B1 (en) * | 2008-07-03 | 2014-03-25 | Rockwell Collins, Inc. | System for providing spatial awareness of transmissions of energy in an environment |
| JP2012047473A (en) | 2010-08-24 | 2012-03-08 | Toshiba Corp | Radio wave emission source estimation direction display apparatus and radio wave emission source estimation direction display method |
| JP2012078163A (en) | 2010-09-30 | 2012-04-19 | Toshiba Corp | Composite guidance system and composite guidance method |
| US9291695B2 (en) * | 2012-08-06 | 2016-03-22 | Fluke Corporation | Real-time RF signal visualization device |
| KR101477909B1 (en) | 2013-06-03 | 2014-12-30 | 주식회사 만도 | Radar apparatus and antenna apparatus |
| US9923283B2 (en) * | 2013-06-19 | 2018-03-20 | Lg Electronics Inc. | Method and apparatus for forming beam in antenna array |
| DE102013212079A1 (en) | 2013-06-25 | 2015-01-08 | Robert Bosch Gmbh | Angle-resolving radar sensor |
| KR20150029411A (en) | 2013-09-10 | 2015-03-18 | 한국전자통신연구원 | Radio measurement apparatus using channel multiplex from multiple array antenna and method thereof |
| KR101616377B1 (en) * | 2014-04-24 | 2016-05-11 | 국방과학연구소 | Electronic support measures phase interferometer direction finding system for the direction accuracy improvement |
| WO2017006415A1 (en) | 2015-07-06 | 2017-01-12 | 三菱電機株式会社 | Direction finder |
| FR3045166B1 (en) * | 2015-12-09 | 2018-02-16 | Thales | MODULAR ACTIVE BI-BAND ANTENNA |
| JP2018054386A (en) | 2016-09-27 | 2018-04-05 | 富士通株式会社 | Radio wave arrival direction estimation device and radio wave arrival direction estimation method |
| US11668838B2 (en) | 2017-08-04 | 2023-06-06 | Sony Corporation | Communication apparatus, information processing apparatus, and information processing method |
| CN112055918B (en) * | 2018-04-26 | 2024-03-26 | 株式会社村田制作所 | Antenna module |
-
2020
- 2020-03-10 JP JP2020040595A patent/JP7362521B2/en active Active
-
2021
- 2021-03-05 WO PCT/JP2021/008795 patent/WO2021182347A1/en not_active Ceased
- 2021-03-05 EP EP21767292.2A patent/EP4119972A4/en active Pending
-
2022
- 2022-08-31 US US17/823,934 patent/US12375939B2/en active Active
Also Published As
| Publication number | Publication date |
|---|---|
| JP2021143837A (en) | 2021-09-24 |
| WO2021182347A1 (en) | 2021-09-16 |
| EP4119972A4 (en) | 2024-03-20 |
| US20220417766A1 (en) | 2022-12-29 |
| US12375939B2 (en) | 2025-07-29 |
| JP7362521B2 (en) | 2023-10-17 |
Similar Documents
| Publication | Publication Date | Title |
|---|---|---|
| CN103576124B (en) | Real-time RF signal visualization device | |
| EP3809162B1 (en) | Gnss receiving device and gnss receiving method | |
| US12375939B2 (en) | Radio wave emission source visualization apparatus and band expansion method | |
| JP2012047473A (en) | Radio wave emission source estimation direction display apparatus and radio wave emission source estimation direction display method | |
| JP2014173942A (en) | Radio wave emission source detector and radio wave emission source detection method | |
| JP2011208974A (en) | Radar image processing device | |
| JP4805610B2 (en) | Radio wave source visualization apparatus and radio wave source visualization method | |
| JP4982275B2 (en) | Radio wave source visualization apparatus and radio wave source visualization method | |
| Mietzner et al. | Compact 3D MIMO radar—Antenna array design and experimental results | |
| JP4660300B2 (en) | Radio wave emission source detection device | |
| JP5888153B2 (en) | Image radar apparatus and signal processing apparatus | |
| JP4723916B2 (en) | Radio wave source visualization apparatus and radio wave source visualization method | |
| KR101028071B1 (en) | Imaging sonar optimized array structure of receiving acoustic transducer considering beam pattern of sensor | |
| KR100613491B1 (en) | Antenna Array Structure and Radiometer Image Acquisition System and Method | |
| JP4907910B2 (en) | Radio wave emission source detection device | |
| JP2009236884A (en) | Device for visualizing electric-wave emission source, and its method | |
| JP2007212229A (en) | Radio wave emission source visualization device and method | |
| JP2022504405A (en) | Corrective radio antenna installation on the radome of the GNSS receiver | |
| CN111683403B (en) | Base station registration method, device, electronic equipment and storage medium | |
| JP2007212228A (en) | Radio wave emission source visualization device and method | |
| KR100958471B1 (en) | Positioning method using ghost cancellation reference TV signal, apparatus, computer-readable medium | |
| KR101945116B1 (en) | Mobile terminal | |
| JP2007212241A (en) | Radio wave emission source visualization device and method | |
| JP2007017272A (en) | Camera image offset correction display device | |
| JP2015155851A (en) | Radio emission source visualization device |
Legal Events
| Date | Code | Title | Description |
|---|---|---|---|
| STAA | Information on the status of an ep patent application or granted ep patent |
Free format text: STATUS: THE INTERNATIONAL PUBLICATION HAS BEEN MADE |
|
| PUAI | Public reference made under article 153(3) epc to a published international application that has entered the european phase |
Free format text: ORIGINAL CODE: 0009012 |
|
| STAA | Information on the status of an ep patent application or granted ep patent |
Free format text: STATUS: REQUEST FOR EXAMINATION WAS MADE |
|
| 17P | Request for examination filed |
Effective date: 20220829 |
|
| AK | Designated contracting states |
Kind code of ref document: A1 Designated state(s): AL AT BE BG CH CY CZ DE DK EE ES FI FR GB GR HR HU IE IS IT LI LT LU LV MC MK MT NL NO PL PT RO RS SE SI SK SM TR |
|
| DAV | Request for validation of the european patent (deleted) | ||
| DAX | Request for extension of the european patent (deleted) | ||
| REG | Reference to a national code |
Ref country code: DE Ref legal event code: R079 Free format text: PREVIOUS MAIN CLASS: G01S0003480000 Ipc: G01S0003040000 |
|
| A4 | Supplementary search report drawn up and despatched |
Effective date: 20240221 |
|
| RIC1 | Information provided on ipc code assigned before grant |
Ipc: H04B 17/29 20150101ALI20240215BHEP Ipc: H04B 17/23 20150101ALI20240215BHEP Ipc: H04B 7/06 20060101ALI20240215BHEP Ipc: H01Q 21/06 20060101ALI20240215BHEP Ipc: H01Q 5/42 20150101ALI20240215BHEP Ipc: H01Q 3/24 20060101ALI20240215BHEP Ipc: G01S 3/48 20060101ALI20240215BHEP Ipc: G01S 3/04 20060101AFI20240215BHEP |
|
| RAP1 | Party data changed (applicant data changed or rights of an application transferred) |
Owner name: KABUSHIKI KAISHA TOSHIBA |
|
| GRAP | Despatch of communication of intention to grant a patent |
Free format text: ORIGINAL CODE: EPIDOSNIGR1 |
|
| STAA | Information on the status of an ep patent application or granted ep patent |
Free format text: STATUS: GRANT OF PATENT IS INTENDED |