EP4094676A1 - Compositions and methods for treatment of lung function - Google Patents
Compositions and methods for treatment of lung function Download PDFInfo
- Publication number
- EP4094676A1 EP4094676A1 EP21180569.2A EP21180569A EP4094676A1 EP 4094676 A1 EP4094676 A1 EP 4094676A1 EP 21180569 A EP21180569 A EP 21180569A EP 4094676 A1 EP4094676 A1 EP 4094676A1
- Authority
- EP
- European Patent Office
- Prior art keywords
- lung
- individual
- protein
- fev
- decline
- Prior art date
- Legal status (The legal status is an assumption and is not a legal conclusion. Google has not performed a legal analysis and makes no representation as to the accuracy of the status listed.)
- Withdrawn
Links
- 238000000034 method Methods 0.000 title claims abstract description 122
- 230000004199 lung function Effects 0.000 title claims description 129
- 238000011282 treatment Methods 0.000 title description 18
- 239000000203 mixture Substances 0.000 title description 6
- 201000003883 Cystic fibrosis Diseases 0.000 claims abstract description 168
- 108090000623 proteins and genes Proteins 0.000 claims abstract description 88
- 102000004169 proteins and genes Human genes 0.000 claims abstract description 82
- 230000007423 decrease Effects 0.000 claims description 145
- 239000000090 biomarker Substances 0.000 claims description 70
- 208000037265 diseases, disorders, signs and symptoms Diseases 0.000 claims description 58
- 210000004072 lung Anatomy 0.000 claims description 55
- 201000010099 disease Diseases 0.000 claims description 48
- 230000006735 deficit Effects 0.000 claims description 38
- 238000009423 ventilation Methods 0.000 claims description 30
- 238000003384 imaging method Methods 0.000 claims description 28
- 239000003550 marker Substances 0.000 claims description 27
- 238000005259 measurement Methods 0.000 claims description 25
- 238000012544 monitoring process Methods 0.000 claims description 23
- 230000002685 pulmonary effect Effects 0.000 claims description 21
- 238000002595 magnetic resonance imaging Methods 0.000 claims description 20
- 201000009267 bronchiectasis Diseases 0.000 claims description 16
- 230000005713 exacerbation Effects 0.000 claims description 16
- 238000002591 computed tomography Methods 0.000 claims description 15
- 238000007634 remodeling Methods 0.000 claims description 15
- 208000015181 infectious disease Diseases 0.000 claims description 12
- 230000007547 defect Effects 0.000 claims description 10
- 230000008859 change Effects 0.000 claims description 8
- 230000036961 partial effect Effects 0.000 claims description 8
- 238000011861 anti-inflammatory therapy Methods 0.000 claims description 6
- 238000013125 spirometry Methods 0.000 claims description 6
- 239000012472 biological sample Substances 0.000 claims description 4
- 238000012512 characterization method Methods 0.000 claims description 4
- 206010012601 diabetes mellitus Diseases 0.000 claims description 4
- 206010059487 Lung hyperinflation Diseases 0.000 claims description 3
- 206010041925 Staphylococcal infections Diseases 0.000 claims description 3
- 230000002159 abnormal effect Effects 0.000 claims description 3
- 230000003115 biocidal effect Effects 0.000 claims description 3
- 208000015688 methicillin-resistant staphylococcus aureus infectious disease Diseases 0.000 claims description 3
- 238000012896 Statistical algorithm Methods 0.000 claims description 2
- 102000001708 Protein Isoforms Human genes 0.000 description 123
- 108010029485 Protein Isoforms Proteins 0.000 description 123
- 238000004458 analytical method Methods 0.000 description 66
- 238000013459 approach Methods 0.000 description 30
- 230000005750 disease progression Effects 0.000 description 30
- 208000019693 Lung disease Diseases 0.000 description 27
- 210000002966 serum Anatomy 0.000 description 27
- 206010061818 Disease progression Diseases 0.000 description 25
- 238000004422 calculation algorithm Methods 0.000 description 23
- 108010079245 Cystic Fibrosis Transmembrane Conductance Regulator Proteins 0.000 description 22
- 102000012605 Cystic Fibrosis Transmembrane Conductance Regulator Human genes 0.000 description 21
- 230000008569 process Effects 0.000 description 21
- 238000002560 therapeutic procedure Methods 0.000 description 20
- 210000004369 blood Anatomy 0.000 description 16
- 239000008280 blood Substances 0.000 description 16
- 239000000523 sample Substances 0.000 description 16
- 230000006872 improvement Effects 0.000 description 15
- 230000006870 function Effects 0.000 description 13
- 239000003814 drug Substances 0.000 description 12
- 230000001976 improved effect Effects 0.000 description 12
- 230000000875 corresponding effect Effects 0.000 description 10
- 239000013598 vector Substances 0.000 description 10
- 230000000694 effects Effects 0.000 description 9
- 230000003993 interaction Effects 0.000 description 9
- 238000000575 proteomic method Methods 0.000 description 9
- 102100033338 LIM and calponin homology domains-containing protein 1 Human genes 0.000 description 8
- 102100034938 Terminal nucleotidyltransferase 4B Human genes 0.000 description 8
- 230000008901 benefit Effects 0.000 description 8
- 229940079593 drug Drugs 0.000 description 8
- 239000002243 precursor Substances 0.000 description 8
- 230000002829 reductive effect Effects 0.000 description 8
- 230000004044 response Effects 0.000 description 8
- 238000012360 testing method Methods 0.000 description 8
- 102100031087 Coiled-coil domain-containing protein 18 Human genes 0.000 description 7
- 108060003951 Immunoglobulin Proteins 0.000 description 7
- 102000018358 immunoglobulin Human genes 0.000 description 7
- 239000011159 matrix material Substances 0.000 description 7
- 238000004885 tandem mass spectrometry Methods 0.000 description 7
- 108010044843 Peptide Initiation Factors Proteins 0.000 description 6
- 102000005877 Peptide Initiation Factors Human genes 0.000 description 6
- 102100037866 Pleckstrin homology domain-containing family A member 5 Human genes 0.000 description 6
- 108700038060 Terminal nucleotidyltransferase 4B Proteins 0.000 description 6
- 238000001514 detection method Methods 0.000 description 6
- 238000011161 development Methods 0.000 description 6
- 238000009826 distribution Methods 0.000 description 6
- 238000004949 mass spectrometry Methods 0.000 description 6
- 230000035772 mutation Effects 0.000 description 6
- 102100022460 Alpha-1-acid glycoprotein 2 Human genes 0.000 description 5
- 230000005653 Brownian motion process Effects 0.000 description 5
- 238000002965 ELISA Methods 0.000 description 5
- 102100027619 Histidine-rich glycoprotein Human genes 0.000 description 5
- 206010061218 Inflammation Diseases 0.000 description 5
- 238000001360 collision-induced dissociation Methods 0.000 description 5
- 238000005516 engineering process Methods 0.000 description 5
- 239000012634 fragment Substances 0.000 description 5
- 108010044853 histidine-rich proteins Proteins 0.000 description 5
- 230000004054 inflammatory process Effects 0.000 description 5
- 230000004048 modification Effects 0.000 description 5
- 238000012986 modification Methods 0.000 description 5
- 230000007170 pathology Effects 0.000 description 5
- 238000011160 research Methods 0.000 description 5
- BXLICFUSUZPSHT-UHFFFAOYSA-N 1-(4-chlorophenyl)-3-fluoropropan-2-amine Chemical compound FCC(N)CC1=CC=C(Cl)C=C1 BXLICFUSUZPSHT-UHFFFAOYSA-N 0.000 description 4
- CSCPPACGZOOCGX-UHFFFAOYSA-N Acetone Chemical compound CC(C)=O CSCPPACGZOOCGX-UHFFFAOYSA-N 0.000 description 4
- 101710186699 Alpha-1-acid glycoprotein 2 Proteins 0.000 description 4
- 102000004506 Blood Proteins Human genes 0.000 description 4
- 108010017384 Blood Proteins Proteins 0.000 description 4
- 101150029409 CFTR gene Proteins 0.000 description 4
- 102100029395 CLIP-associating protein 2 Human genes 0.000 description 4
- 102100038220 Chromodomain-helicase-DNA-binding protein 6 Human genes 0.000 description 4
- 102100031191 Cilia- and flagella-associated protein 91 Human genes 0.000 description 4
- 102100035396 Cingulin-like protein 1 Human genes 0.000 description 4
- 101710149361 Coiled-coil domain-containing protein 18 Proteins 0.000 description 4
- 102100032348 Coiled-coil domain-containing protein 93 Human genes 0.000 description 4
- 102100037285 Collagen alpha-1(XXIV) chain Human genes 0.000 description 4
- 108010053085 Complement Factor H Proteins 0.000 description 4
- 102100035432 Complement factor H Human genes 0.000 description 4
- 102100040453 Connector enhancer of kinase suppressor of ras 2 Human genes 0.000 description 4
- 102100030214 Diacylglycerol kinase iota Human genes 0.000 description 4
- 102100031682 DnaJ homolog subfamily C member 4 Human genes 0.000 description 4
- 102100027847 Endonuclease ZRANB3 Human genes 0.000 description 4
- 102100035441 FRAS1-related extracellular matrix protein 2 Human genes 0.000 description 4
- 101710168206 FRAS1-related extracellular matrix protein 2 Proteins 0.000 description 4
- 102100023639 FYVE, RhoGEF and PH domain-containing protein 5 Human genes 0.000 description 4
- 102100031752 Fibrinogen alpha chain Human genes 0.000 description 4
- 102100026560 Filamin-C Human genes 0.000 description 4
- 101710091745 Filamin-C Proteins 0.000 description 4
- 102100039770 Glutamate receptor-interacting protein 1 Human genes 0.000 description 4
- 101000776592 Homo sapiens Cilia- and flagella-associated protein 91 Proteins 0.000 description 4
- 101000737619 Homo sapiens Cingulin-like protein 1 Proteins 0.000 description 4
- 101000952969 Homo sapiens Collagen alpha-1(XXIV) chain Proteins 0.000 description 4
- 101000845897 Homo sapiens DnaJ homolog subfamily C member 4 Proteins 0.000 description 4
- 101001134676 Homo sapiens LIM and calponin homology domains-containing protein 1 Proteins 0.000 description 4
- 101000713323 Homo sapiens Putative spermatogenesis-associated protein 31C1 Proteins 0.000 description 4
- 101000637415 Homo sapiens Rho guanine nucleotide exchange factor TIAM1 Proteins 0.000 description 4
- 101001095381 Homo sapiens Serine/threonine-protein phosphatase 6 regulatory subunit 2 Proteins 0.000 description 4
- 101000782089 Homo sapiens Zinc finger protein ZFAT Proteins 0.000 description 4
- 102100023956 Junction-mediating and -regulatory protein Human genes 0.000 description 4
- 102100037688 Kinesin-like protein KIF21A Human genes 0.000 description 4
- 108050006100 LIM and calponin homology domains-containing protein 1 Proteins 0.000 description 4
- 102100020859 La-related protein 1 Human genes 0.000 description 4
- 102100040584 Lysine-specific demethylase 2B Human genes 0.000 description 4
- 102100022621 MAX gene-associated protein Human genes 0.000 description 4
- 102100031803 MYCBP-associated protein Human genes 0.000 description 4
- 102100037134 Partitioning defective 3 homolog B Human genes 0.000 description 4
- 102100035156 Pleckstrin homology-like domain family B member 2 Human genes 0.000 description 4
- 101710174343 Pleckstrin homology-like domain family B member 2 Proteins 0.000 description 4
- 102100034747 Probable E3 ubiquitin-protein ligase HERC1 Human genes 0.000 description 4
- 101710179941 Probable E3 ubiquitin-protein ligase HERC1 Proteins 0.000 description 4
- 102100026126 Proline-tRNA ligase Human genes 0.000 description 4
- 102100032859 Protein AMBP Human genes 0.000 description 4
- 102100020876 Protein SCAF11 Human genes 0.000 description 4
- 102100034603 Protein arginine N-methyltransferase 3 Human genes 0.000 description 4
- 102100036903 Putative spermatogenesis-associated protein 31C1 Human genes 0.000 description 4
- 102100038041 RNA-binding motif protein, Y chromosome, family 1 member B Human genes 0.000 description 4
- 102100038202 Ral GTPase-activating protein subunit alpha-1 Human genes 0.000 description 4
- 102100037422 Receptor-type tyrosine-protein phosphatase C Human genes 0.000 description 4
- 102100037415 Regulator of G-protein signaling 3 Human genes 0.000 description 4
- 101710140411 Regulator of G-protein signaling 3 Proteins 0.000 description 4
- 102100035753 Rho GTPase-activating protein 21 Human genes 0.000 description 4
- 102100032200 Rho guanine nucleotide exchange factor TIAM1 Human genes 0.000 description 4
- 102100032735 SH3 and multiple ankyrin repeat domains protein 1 Human genes 0.000 description 4
- 101710101742 SH3 and multiple ankyrin repeat domains protein 1 Proteins 0.000 description 4
- 102100037763 Serine/threonine-protein phosphatase 6 regulatory subunit 2 Human genes 0.000 description 4
- 102100036346 Sperm-associated antigen 17 Human genes 0.000 description 4
- 102100035007 Synaptotagmin-like protein 2 Human genes 0.000 description 4
- 102100034913 Tetratricopeptide repeat protein 21A Human genes 0.000 description 4
- 108010046722 Thrombospondin 1 Proteins 0.000 description 4
- 102100036034 Thrombospondin-1 Human genes 0.000 description 4
- 102100031284 Ubiquitin carboxyl-terminal hydrolase 40 Human genes 0.000 description 4
- 108010075653 Utrophin Proteins 0.000 description 4
- 102100029092 Utrophin Human genes 0.000 description 4
- 102100020703 WD repeat-containing protein 64 Human genes 0.000 description 4
- 102100039968 Zinc finger homeobox protein 4 Human genes 0.000 description 4
- 101710180302 Zinc finger homeobox protein 4 Proteins 0.000 description 4
- 102100036606 Zinc finger protein ZFAT Human genes 0.000 description 4
- 238000005537 brownian motion Methods 0.000 description 4
- 230000021164 cell adhesion Effects 0.000 description 4
- 230000002354 daily effect Effects 0.000 description 4
- 230000034994 death Effects 0.000 description 4
- 230000007717 exclusion Effects 0.000 description 4
- 230000002757 inflammatory effect Effects 0.000 description 4
- 150000002500 ions Chemical class 0.000 description 4
- 230000037361 pathway Effects 0.000 description 4
- 238000000513 principal component analysis Methods 0.000 description 4
- 108090000765 processed proteins & peptides Proteins 0.000 description 4
- 238000009613 pulmonary function test Methods 0.000 description 4
- 230000035945 sensitivity Effects 0.000 description 4
- 102100036780 Actin filament-associated protein 1 Human genes 0.000 description 3
- 108700028369 Alleles Proteins 0.000 description 3
- RYTZFBLERBKCRL-XQAUMGQKSA-N CC(C)(C)C1=CC(=C(O)C=C1NC(=O)C1=CNC2=CC=CC=C2C1=O)C(C)(C)C.CC(C)(CO)C1=CC2=CC(NC(=O)C3(CC3)C3=CC4=C(OC(F)(F)O4)C=C3)=C(F)C=C2N1C[C@@H](O)CO.CC(C)(CO)C1=CC2=CC(NC(=O)C3(CC3)C3=CC4=C(OC(F)(F)O4)C=C3)=C(F)C=C2N1C[C@@H](O)CO Chemical compound CC(C)(C)C1=CC(=C(O)C=C1NC(=O)C1=CNC2=CC=CC=C2C1=O)C(C)(C)C.CC(C)(CO)C1=CC2=CC(NC(=O)C3(CC3)C3=CC4=C(OC(F)(F)O4)C=C3)=C(F)C=C2N1C[C@@H](O)CO.CC(C)(CO)C1=CC2=CC(NC(=O)C3(CC3)C3=CC4=C(OC(F)(F)O4)C=C3)=C(F)C=C2N1C[C@@H](O)CO RYTZFBLERBKCRL-XQAUMGQKSA-N 0.000 description 3
- 102000008186 Collagen Human genes 0.000 description 3
- 108010035532 Collagen Proteins 0.000 description 3
- 102000004878 Gelsolin Human genes 0.000 description 3
- 108090001064 Gelsolin Proteins 0.000 description 3
- 101001055315 Homo sapiens Immunoglobulin heavy constant alpha 1 Proteins 0.000 description 3
- 101001096178 Homo sapiens Pleckstrin homology domain-containing family A member 5 Proteins 0.000 description 3
- 102100026217 Immunoglobulin heavy constant alpha 1 Human genes 0.000 description 3
- 102100029567 Immunoglobulin kappa light chain Human genes 0.000 description 3
- 101710189008 Immunoglobulin kappa light chain Proteins 0.000 description 3
- 206010028980 Neoplasm Diseases 0.000 description 3
- 101710176407 Pleckstrin homology domain-containing family A member 5 Proteins 0.000 description 3
- 102100032347 Poly(ADP-ribose) glycohydrolase Human genes 0.000 description 3
- 108010071690 Prealbumin Proteins 0.000 description 3
- 108010026552 Proteome Proteins 0.000 description 3
- 102000009190 Transthyretin Human genes 0.000 description 3
- 239000003242 anti bacterial agent Substances 0.000 description 3
- 230000009286 beneficial effect Effects 0.000 description 3
- 201000011510 cancer Diseases 0.000 description 3
- 229920001436 collagen Polymers 0.000 description 3
- 238000004440 column chromatography Methods 0.000 description 3
- 230000002596 correlated effect Effects 0.000 description 3
- 230000001419 dependent effect Effects 0.000 description 3
- 238000009795 derivation Methods 0.000 description 3
- 208000035475 disorder Diseases 0.000 description 3
- 238000005194 fractionation Methods 0.000 description 3
- 238000005227 gel permeation chromatography Methods 0.000 description 3
- 238000001415 gene therapy Methods 0.000 description 3
- 230000036541 health Effects 0.000 description 3
- PURKAOJPTOLRMP-UHFFFAOYSA-N ivacaftor Chemical compound C1=C(O)C(C(C)(C)C)=CC(C(C)(C)C)=C1NC(=O)C1=CNC2=CC=CC=C2C1=O PURKAOJPTOLRMP-UHFFFAOYSA-N 0.000 description 3
- 238000004811 liquid chromatography Methods 0.000 description 3
- 238000001294 liquid chromatography-tandem mass spectrometry Methods 0.000 description 3
- 239000000463 material Substances 0.000 description 3
- 108010078356 poly ADP-ribose glycohydrolase Proteins 0.000 description 3
- 102000004196 processed proteins & peptides Human genes 0.000 description 3
- 238000000926 separation method Methods 0.000 description 3
- 230000011664 signaling Effects 0.000 description 3
- 238000004088 simulation Methods 0.000 description 3
- 238000001179 sorption measurement Methods 0.000 description 3
- 238000000528 statistical test Methods 0.000 description 3
- 238000005309 stochastic process Methods 0.000 description 3
- 230000004083 survival effect Effects 0.000 description 3
- 230000009885 systemic effect Effects 0.000 description 3
- 230000001225 therapeutic effect Effects 0.000 description 3
- 210000001519 tissue Anatomy 0.000 description 3
- 238000010200 validation analysis Methods 0.000 description 3
- 108010088751 Albumins Proteins 0.000 description 2
- 102000009027 Albumins Human genes 0.000 description 2
- 102100032360 Alstrom syndrome protein 1 Human genes 0.000 description 2
- 102300044767 Alstrom syndrome protein 1 isoform 1 Human genes 0.000 description 2
- 102000000041 Aminopeptidase O Human genes 0.000 description 2
- 102100040141 Aminopeptidase O Human genes 0.000 description 2
- 108050008333 Aminopeptidase O Proteins 0.000 description 2
- 102000006996 Aryldialkylphosphatase Human genes 0.000 description 2
- 108010008184 Aryldialkylphosphatase Proteins 0.000 description 2
- 102000014812 CACNA1F Human genes 0.000 description 2
- 101710114888 CLIP-associating protein 2 Proteins 0.000 description 2
- 102100035351 Cadherin-related family member 2 Human genes 0.000 description 2
- 108010078853 Choline-Phosphate Cytidylyltransferase Proteins 0.000 description 2
- 101710170306 Chromodomain-helicase-DNA-binding protein 6 Proteins 0.000 description 2
- 208000006545 Chronic Obstructive Pulmonary Disease Diseases 0.000 description 2
- 102300042474 Cilia- and flagella-associated protein 91 isoform 3 Human genes 0.000 description 2
- 101710149171 Coiled-coil domain-containing protein 93 Proteins 0.000 description 2
- 102100024339 Complement component C6 Human genes 0.000 description 2
- 101710203188 Complement component C6 Proteins 0.000 description 2
- 101710192670 Connector enhancer of kinase suppressor of ras 2 Proteins 0.000 description 2
- 102100038114 Cyclin-dependent kinase 13 Human genes 0.000 description 2
- 101710099555 Diacylglycerol kinase iota Proteins 0.000 description 2
- 102100032299 Dynein axonemal heavy chain 10 Human genes 0.000 description 2
- 102100022199 E3 ubiquitin-protein ligase MIB2 Human genes 0.000 description 2
- 101710104336 E3 ubiquitin-protein ligase MIB2 Proteins 0.000 description 2
- 101710082519 Endonuclease ZRANB3 Proteins 0.000 description 2
- 101710177190 FYVE, RhoGEF and PH domain-containing protein 5 Proteins 0.000 description 2
- 101710137044 Fibrinogen alpha chain Proteins 0.000 description 2
- 102100028953 Gelsolin Human genes 0.000 description 2
- 108091009426 Glutamate receptor-interacting protein 1 Proteins 0.000 description 2
- 102100033070 Histone acetyltransferase KAT6B Human genes 0.000 description 2
- 102000003893 Histone acetyltransferases Human genes 0.000 description 2
- 108090000246 Histone acetyltransferases Proteins 0.000 description 2
- 241000282412 Homo Species 0.000 description 2
- 101000928226 Homo sapiens Actin filament-associated protein 1 Proteins 0.000 description 2
- 101000797795 Homo sapiens Alstrom syndrome protein 1 Proteins 0.000 description 2
- 101000889627 Homo sapiens Aminopeptidase O Proteins 0.000 description 2
- 101000884348 Homo sapiens Cyclin-dependent kinase 13 Proteins 0.000 description 2
- 101001016205 Homo sapiens Dynein axonemal heavy chain 10 Proteins 0.000 description 2
- 101000723417 Homo sapiens Endonuclease ZRANB3 Proteins 0.000 description 2
- 101000827825 Homo sapiens FYVE, RhoGEF and PH domain-containing protein 5 Proteins 0.000 description 2
- 101100019690 Homo sapiens KAT6B gene Proteins 0.000 description 2
- 101001050577 Homo sapiens Kinesin-like protein KIF2A Proteins 0.000 description 2
- 101001138022 Homo sapiens La-related protein 1 Proteins 0.000 description 2
- 101000614013 Homo sapiens Lysine-specific demethylase 2B Proteins 0.000 description 2
- 101000972918 Homo sapiens MAX gene-associated protein Proteins 0.000 description 2
- 101000588302 Homo sapiens Nuclear factor erythroid 2-related factor 2 Proteins 0.000 description 2
- 101000797623 Homo sapiens Protein AMBP Proteins 0.000 description 2
- 101000716750 Homo sapiens Protein SCAF11 Proteins 0.000 description 2
- 101000742838 Homo sapiens RNA-binding motif protein, Y chromosome, family 1 member B Proteins 0.000 description 2
- 101000738771 Homo sapiens Receptor-type tyrosine-protein phosphatase C Proteins 0.000 description 2
- 101000581153 Homo sapiens Rho GTPase-activating protein 10 Proteins 0.000 description 2
- 101001092004 Homo sapiens Rho GTPase-activating protein 21 Proteins 0.000 description 2
- 101000735429 Homo sapiens Terminal nucleotidyltransferase 4B Proteins 0.000 description 2
- 101000777206 Homo sapiens Ubiquitin carboxyl-terminal hydrolase 40 Proteins 0.000 description 2
- 101000867848 Homo sapiens Voltage-dependent L-type calcium channel subunit alpha-1F Proteins 0.000 description 2
- 101710201289 Interferon regulatory factor 2-binding protein 2-B Proteins 0.000 description 2
- 101710172842 Junction-mediating and -regulatory protein Proteins 0.000 description 2
- 102100033421 Keratin, type I cytoskeletal 18 Human genes 0.000 description 2
- 108010066327 Keratin-18 Proteins 0.000 description 2
- 101710133646 Kinesin-like protein KIF21A Proteins 0.000 description 2
- 102000019293 Kinesin-like proteins Human genes 0.000 description 2
- 108050006659 Kinesin-like proteins Proteins 0.000 description 2
- 101710198283 La-related protein 1 Proteins 0.000 description 2
- 241000258952 Lingula Species 0.000 description 2
- 101710105679 Lysine-specific demethylase 2B Proteins 0.000 description 2
- 108050002980 MAX gene-associated proteins Proteins 0.000 description 2
- 101710161840 MYCBP-associated protein Proteins 0.000 description 2
- 102100028803 Nebulin-related-anchoring protein Human genes 0.000 description 2
- 101710187057 Nebulin-related-anchoring protein Proteins 0.000 description 2
- 102100031701 Nuclear factor erythroid 2-related factor 2 Human genes 0.000 description 2
- 101100532722 Ovis aries SCNN1B gene Proteins 0.000 description 2
- 101710183220 Partitioning defective 3 homolog B Proteins 0.000 description 2
- 102100031248 Patatin-like phospholipase domain-containing protein 2 Human genes 0.000 description 2
- 102100032595 Pleckstrin homology domain-containing family G member 1 Human genes 0.000 description 2
- 102100035922 Polyamine-modulated factor 1 Human genes 0.000 description 2
- 101710192873 Polyamine-modulated factor 1 Proteins 0.000 description 2
- 108010049395 Prokaryotic Initiation Factor-2 Proteins 0.000 description 2
- 101710115782 Proline-tRNA ligase Proteins 0.000 description 2
- 108050003874 Protein AMBP Proteins 0.000 description 2
- 101710141618 Protein SCAF11 Proteins 0.000 description 2
- 101710084424 Protein arginine N-methyltransferase 3 Proteins 0.000 description 2
- 101710196699 Protein sidekick-2 Proteins 0.000 description 2
- 102100021005 Protein sidekick-2 Human genes 0.000 description 2
- 101710199897 RNA-binding motif protein, Y chromosome, family 1 member B Proteins 0.000 description 2
- 101710107534 Ral GTPase-activating protein subunit alpha-1 Proteins 0.000 description 2
- 101710138747 Receptor-type tyrosine-protein phosphatase C Proteins 0.000 description 2
- 101710110392 Rho GTPase-activating protein 10 Proteins 0.000 description 2
- 101710110421 Rho GTPase-activating protein 21 Proteins 0.000 description 2
- 101710102928 Sacsin Proteins 0.000 description 2
- 102100034272 Sacsin Human genes 0.000 description 2
- 102100020824 Serine-protein kinase ATM Human genes 0.000 description 2
- 101710128348 Serine-protein kinase ATM Proteins 0.000 description 2
- 102300057814 Serine/threonine-protein phosphatase 4 regulatory subunit 3A isoform 1 Human genes 0.000 description 2
- 102100029937 Smoothelin Human genes 0.000 description 2
- FAPWRFPIFSIZLT-UHFFFAOYSA-M Sodium chloride Chemical compound [Na+].[Cl-] FAPWRFPIFSIZLT-UHFFFAOYSA-M 0.000 description 2
- 101710129519 Sperm-associated antigen 17 Proteins 0.000 description 2
- 101710156026 Synaptotagmin-like protein 2 Proteins 0.000 description 2
- 101710163901 Tetratricopeptide repeat protein 21A Proteins 0.000 description 2
- 108010002321 Tight Junction Proteins Proteins 0.000 description 2
- 102000000591 Tight Junction Proteins Human genes 0.000 description 2
- 108700019146 Transgenes Proteins 0.000 description 2
- 102100028569 Transport and Golgi organization protein 1 homolog Human genes 0.000 description 2
- 102100032268 Triadin Human genes 0.000 description 2
- 101710091191 Ubiquitin carboxyl-terminal hydrolase 40 Proteins 0.000 description 2
- 102100029155 Uridine-cytidine kinase-like 1 Human genes 0.000 description 2
- 102100025342 Voltage-dependent N-type calcium channel subunit alpha-1B Human genes 0.000 description 2
- 101710088658 Voltage-dependent N-type calcium channel subunit alpha-1B Proteins 0.000 description 2
- 101710093146 WD repeat-containing protein 64 Proteins 0.000 description 2
- 102100039966 Zinc finger homeobox protein 3 Human genes 0.000 description 2
- 101710180292 Zinc finger homeobox protein 3 Proteins 0.000 description 2
- 230000005856 abnormality Effects 0.000 description 2
- 239000004480 active ingredient Substances 0.000 description 2
- 229940088710 antibiotic agent Drugs 0.000 description 2
- 208000006673 asthma Diseases 0.000 description 2
- 244000052616 bacterial pathogen Species 0.000 description 2
- 230000006399 behavior Effects 0.000 description 2
- 230000033228 biological regulation Effects 0.000 description 2
- 238000013276 bronchoscopy Methods 0.000 description 2
- 238000004364 calculation method Methods 0.000 description 2
- 230000020411 cell activation Effects 0.000 description 2
- 230000032823 cell division Effects 0.000 description 2
- 230000000295 complement effect Effects 0.000 description 2
- 230000003436 cytoskeletal effect Effects 0.000 description 2
- 238000007405 data analysis Methods 0.000 description 2
- 230000003247 decreasing effect Effects 0.000 description 2
- 230000006866 deterioration Effects 0.000 description 2
- 238000012774 diagnostic algorithm Methods 0.000 description 2
- 230000029087 digestion Effects 0.000 description 2
- 230000004064 dysfunction Effects 0.000 description 2
- 230000002526 effect on cardiovascular system Effects 0.000 description 2
- 229940007078 entamoeba histolytica Drugs 0.000 description 2
- 238000011156 evaluation Methods 0.000 description 2
- 230000001747 exhibiting effect Effects 0.000 description 2
- 239000012530 fluid Substances 0.000 description 2
- 230000009760 functional impairment Effects 0.000 description 2
- 230000012010 growth Effects 0.000 description 2
- 230000001771 impaired effect Effects 0.000 description 2
- 210000004969 inflammatory cell Anatomy 0.000 description 2
- 230000002401 inhibitory effect Effects 0.000 description 2
- 230000002452 interceptive effect Effects 0.000 description 2
- 229940005405 kalydeco Drugs 0.000 description 2
- 230000000670 limiting effect Effects 0.000 description 2
- 238000007477 logistic regression Methods 0.000 description 2
- 230000005980 lung dysfunction Effects 0.000 description 2
- 239000006166 lysate Substances 0.000 description 2
- 210000003097 mucus Anatomy 0.000 description 2
- YQCGOSZYHRVOFW-UHFFFAOYSA-N n-(2,4-ditert-butyl-5-hydroxyphenyl)-4-oxo-1h-quinoline-3-carboxamide;3-[6-[[1-(2,2-difluoro-1,3-benzodioxol-5-yl)cyclopropanecarbonyl]amino]-3-methylpyridin-2-yl]benzoic acid Chemical compound C1=C(O)C(C(C)(C)C)=CC(C(C)(C)C)=C1NC(=O)C1=CNC2=CC=CC=C2C1=O.N1=C(C=2C=C(C=CC=2)C(O)=O)C(C)=CC=C1NC(=O)C1(C=2C=C3OC(F)(F)OC3=CC=2)CC1 YQCGOSZYHRVOFW-UHFFFAOYSA-N 0.000 description 2
- 239000000101 novel biomarker Substances 0.000 description 2
- 210000000056 organ Anatomy 0.000 description 2
- 229940080152 orkambi Drugs 0.000 description 2
- 210000002381 plasma Anatomy 0.000 description 2
- 230000008741 proinflammatory signaling process Effects 0.000 description 2
- 230000008707 rearrangement Effects 0.000 description 2
- 101150082646 scnn1a gene Proteins 0.000 description 2
- 238000012216 screening Methods 0.000 description 2
- 239000011780 sodium chloride Substances 0.000 description 2
- 230000003068 static effect Effects 0.000 description 2
- 238000007619 statistical method Methods 0.000 description 2
- 238000013179 statistical model Methods 0.000 description 2
- 108010074903 sulfone oxidase Proteins 0.000 description 2
- 230000008719 thickening Effects 0.000 description 2
- 238000012549 training Methods 0.000 description 2
- 230000014621 translational initiation Effects 0.000 description 2
- 238000013520 translational research Methods 0.000 description 2
- 238000011269 treatment regimen Methods 0.000 description 2
- 108010072310 triadin Proteins 0.000 description 2
- 210000002700 urine Anatomy 0.000 description 2
- 108091023044 voltage-gated calcium channel activity Proteins 0.000 description 2
- 102000038650 voltage-gated calcium channel activity Human genes 0.000 description 2
- MZOFCQQQCNRIBI-VMXHOPILSA-N (3s)-4-[[(2s)-1-[[(2s)-1-[[(1s)-1-carboxy-2-hydroxyethyl]amino]-4-methyl-1-oxopentan-2-yl]amino]-5-(diaminomethylideneamino)-1-oxopentan-2-yl]amino]-3-[[2-[[(2s)-2,6-diaminohexanoyl]amino]acetyl]amino]-4-oxobutanoic acid Chemical compound OC[C@@H](C(O)=O)NC(=O)[C@H](CC(C)C)NC(=O)[C@H](CCCN=C(N)N)NC(=O)[C@H](CC(O)=O)NC(=O)CNC(=O)[C@@H](N)CCCCN MZOFCQQQCNRIBI-VMXHOPILSA-N 0.000 description 1
- IGRCWJPBLWGNPX-UHFFFAOYSA-N 3-(2-chlorophenyl)-n-(4-chlorophenyl)-n,5-dimethyl-1,2-oxazole-4-carboxamide Chemical compound C=1C=C(Cl)C=CC=1N(C)C(=O)C1=C(C)ON=C1C1=CC=CC=C1Cl IGRCWJPBLWGNPX-UHFFFAOYSA-N 0.000 description 1
- UMCMPZBLKLEWAF-BCTGSCMUSA-N 3-[(3-cholamidopropyl)dimethylammonio]propane-1-sulfonate Chemical compound C([C@H]1C[C@H]2O)[C@H](O)CC[C@]1(C)[C@@H]1[C@@H]2[C@@H]2CC[C@H]([C@@H](CCC(=O)NCCC[N+](C)(C)CCCS([O-])(=O)=O)C)[C@@]2(C)[C@@H](O)C1 UMCMPZBLKLEWAF-BCTGSCMUSA-N 0.000 description 1
- 102100031910 A-kinase anchor protein 3 Human genes 0.000 description 1
- 101710109893 A-kinase anchor protein 3 Proteins 0.000 description 1
- 102300048987 AT-rich interactive domain-containing protein 4A isoform I Human genes 0.000 description 1
- 108050005883 Actin filament-associated protein 1 Proteins 0.000 description 1
- 102100030374 Actin, cytoplasmic 2 Human genes 0.000 description 1
- 102100033312 Alpha-2-macroglobulin Human genes 0.000 description 1
- 208000024827 Alzheimer disease Diseases 0.000 description 1
- 102300042771 Ankyrin-3 isoform 3 Human genes 0.000 description 1
- WZPBZJONDBGPKJ-UHFFFAOYSA-N Antibiotic SQ 26917 Natural products O=C1N(S(O)(=O)=O)C(C)C1NC(=O)C(=NOC(C)(C)C(O)=O)C1=CSC(N)=N1 WZPBZJONDBGPKJ-UHFFFAOYSA-N 0.000 description 1
- 108091023037 Aptamer Proteins 0.000 description 1
- 208000035143 Bacterial infection Diseases 0.000 description 1
- 102100027991 Beta/gamma crystallin domain-containing protein 1 Human genes 0.000 description 1
- 102100029892 Bromodomain and WD repeat-containing protein 1 Human genes 0.000 description 1
- 108010074051 C-Reactive Protein Proteins 0.000 description 1
- 102100032752 C-reactive protein Human genes 0.000 description 1
- 108010040163 CREB-Binding Protein Proteins 0.000 description 1
- 102100021975 CREB-binding protein Human genes 0.000 description 1
- 101710148671 Cadherin-related family member 2 Proteins 0.000 description 1
- 101100180402 Caenorhabditis elegans jun-1 gene Proteins 0.000 description 1
- 108091006146 Channels Proteins 0.000 description 1
- 102100030501 Coiled-coil domain-containing protein 180 Human genes 0.000 description 1
- 101710155329 Coiled-coil domain-containing protein 180 Proteins 0.000 description 1
- 102000004266 Collagen Type IV Human genes 0.000 description 1
- 108010042086 Collagen Type IV Proteins 0.000 description 1
- 102100031501 Collagen alpha-3(V) chain Human genes 0.000 description 1
- 101710181291 Connector enhancer of kinase suppressor of ras Proteins 0.000 description 1
- 108020004414 DNA Proteins 0.000 description 1
- 102100035925 DNA methyltransferase 1-associated protein 1 Human genes 0.000 description 1
- 101710098651 DNA methyltransferase 1-associated protein 1 Proteins 0.000 description 1
- 102100033072 DNA replication ATP-dependent helicase DNA2 Human genes 0.000 description 1
- 102100021160 Dual specificity protein phosphatase 9 Human genes 0.000 description 1
- 102100032294 Dynein axonemal heavy chain 12 Human genes 0.000 description 1
- 102000004190 Enzymes Human genes 0.000 description 1
- 108090000790 Enzymes Proteins 0.000 description 1
- 102000003837 Epithelial Sodium Channels Human genes 0.000 description 1
- 108090000140 Epithelial Sodium Channels Proteins 0.000 description 1
- 102100040683 Fermitin family homolog 1 Human genes 0.000 description 1
- YCKRFDGAMUMZLT-UHFFFAOYSA-N Fluorine atom Chemical compound [F] YCKRFDGAMUMZLT-UHFFFAOYSA-N 0.000 description 1
- 102000006395 Globulins Human genes 0.000 description 1
- 108010044091 Globulins Proteins 0.000 description 1
- 102300042867 Glutamate receptor 2 isoform 4 Human genes 0.000 description 1
- 102100040408 Heat shock 70 kDa protein 1-like Human genes 0.000 description 1
- 101000773237 Homo sapiens Actin, cytoplasmic 2 Proteins 0.000 description 1
- 101000678191 Homo sapiens Alpha-1-acid glycoprotein 2 Proteins 0.000 description 1
- 101000859448 Homo sapiens Beta/gamma crystallin domain-containing protein 1 Proteins 0.000 description 1
- 101000794040 Homo sapiens Bromodomain and WD repeat-containing protein 1 Proteins 0.000 description 1
- 101000737811 Homo sapiens Cadherin-related family member 2 Proteins 0.000 description 1
- 101000941596 Homo sapiens Collagen alpha-3(V) chain Proteins 0.000 description 1
- 101000927313 Homo sapiens DNA replication ATP-dependent helicase DNA2 Proteins 0.000 description 1
- 101000968556 Homo sapiens Dual specificity protein phosphatase 9 Proteins 0.000 description 1
- 101001016209 Homo sapiens Dynein axonemal heavy chain 12 Proteins 0.000 description 1
- 101000892670 Homo sapiens Fermitin family homolog 1 Proteins 0.000 description 1
- 101001037977 Homo sapiens Heat shock 70 kDa protein 1-like Proteins 0.000 description 1
- 101000840257 Homo sapiens Immunoglobulin kappa constant Proteins 0.000 description 1
- 101000840271 Homo sapiens Immunoglobulin lambda constant 2 Proteins 0.000 description 1
- 101000840272 Homo sapiens Immunoglobulin lambda constant 3 Proteins 0.000 description 1
- 101000609396 Homo sapiens Inter-alpha-trypsin inhibitor heavy chain H2 Proteins 0.000 description 1
- 101000601423 Homo sapiens N-terminal EF-hand calcium-binding protein 2 Proteins 0.000 description 1
- 101001129187 Homo sapiens Patatin-like phospholipase domain-containing protein 2 Proteins 0.000 description 1
- 101000583189 Homo sapiens Plakophilin-4 Proteins 0.000 description 1
- 101000730607 Homo sapiens Pleckstrin homology domain-containing family G member 1 Proteins 0.000 description 1
- 101000824299 Homo sapiens Protocadherin Fat 2 Proteins 0.000 description 1
- 101000665882 Homo sapiens Retinol-binding protein 4 Proteins 0.000 description 1
- 101000829211 Homo sapiens Serine/arginine repetitive matrix protein 1 Proteins 0.000 description 1
- 101001095320 Homo sapiens Serine/threonine-protein phosphatase PP1-beta catalytic subunit Proteins 0.000 description 1
- 101000836849 Homo sapiens Signal-induced proliferation-associated 1-like protein 3 Proteins 0.000 description 1
- 101000785517 Homo sapiens Tight junction protein ZO-3 Proteins 0.000 description 1
- 101000837854 Homo sapiens Transport and Golgi organization protein 1 homolog Proteins 0.000 description 1
- 101000906693 Homo sapiens Uncharacterized protein C12orf42 Proteins 0.000 description 1
- 101000818575 Homo sapiens Zinc finger and BTB domain-containing protein 21 Proteins 0.000 description 1
- 102000001706 Immunoglobulin Fab Fragments Human genes 0.000 description 1
- 108010054477 Immunoglobulin Fab Fragments Proteins 0.000 description 1
- 102100029572 Immunoglobulin kappa constant Human genes 0.000 description 1
- 108010090227 Immunoglobulin kappa-Chains Proteins 0.000 description 1
- 102000012960 Immunoglobulin kappa-Chains Human genes 0.000 description 1
- 102100029620 Immunoglobulin lambda constant 2 Human genes 0.000 description 1
- 102100029619 Immunoglobulin lambda constant 3 Human genes 0.000 description 1
- 108010004020 Immunoglobulin lambda-Chains Proteins 0.000 description 1
- 102100039440 Inter-alpha-trypsin inhibitor heavy chain H2 Human genes 0.000 description 1
- 238000003657 Likelihood-ratio test Methods 0.000 description 1
- 241000124008 Mammalia Species 0.000 description 1
- 238000007476 Maximum Likelihood Methods 0.000 description 1
- 238000001347 McNemar's test Methods 0.000 description 1
- 241001465754 Metazoa Species 0.000 description 1
- 208000037942 Methicillin-resistant Staphylococcus aureus infection Diseases 0.000 description 1
- 102100036470 Microtubule organization protein AKNA Human genes 0.000 description 1
- 101710107240 Microtubule organization protein AKNA Proteins 0.000 description 1
- 102100037704 N-terminal EF-hand calcium-binding protein 2 Human genes 0.000 description 1
- 108010057466 NF-kappa B Proteins 0.000 description 1
- 102000003945 NF-kappa B Human genes 0.000 description 1
- 108050009145 Patatin-like phospholipase domain-containing protein 2 Proteins 0.000 description 1
- 102100030365 Plakophilin-4 Human genes 0.000 description 1
- 108010010336 Platelet Membrane Glycoproteins Proteins 0.000 description 1
- 102000015795 Platelet Membrane Glycoproteins Human genes 0.000 description 1
- 102100034173 Platelet glycoprotein Ib alpha chain Human genes 0.000 description 1
- 101710107770 Platelet glycoprotein Ib alpha chain Proteins 0.000 description 1
- 102100030264 Pleckstrin Human genes 0.000 description 1
- 101710103298 Pleckstrin homology domain-containing family G member 1 Proteins 0.000 description 1
- 108091026813 Poly(ADPribose) Proteins 0.000 description 1
- 102100034569 Pregnancy zone protein Human genes 0.000 description 1
- 101710195143 Pregnancy zone protein Proteins 0.000 description 1
- 108010015078 Pregnancy-Associated alpha 2-Macroglobulins Proteins 0.000 description 1
- 206010036790 Productive cough Diseases 0.000 description 1
- 108010059000 Protein Phosphatase 1 Proteins 0.000 description 1
- 102000005569 Protein Phosphatase 1 Human genes 0.000 description 1
- 102100022093 Protocadherin Fat 2 Human genes 0.000 description 1
- 241000589516 Pseudomonas Species 0.000 description 1
- 208000032536 Pseudomonas Infections Diseases 0.000 description 1
- 208000035977 Rare disease Diseases 0.000 description 1
- 102100030706 Ras-related protein Rap-1A Human genes 0.000 description 1
- 102100038246 Retinol-binding protein 4 Human genes 0.000 description 1
- 206010039897 Sedation Diseases 0.000 description 1
- 102100023664 Serine/arginine repetitive matrix protein 1 Human genes 0.000 description 1
- 102100037764 Serine/threonine-protein phosphatase PP1-beta catalytic subunit Human genes 0.000 description 1
- 102100027099 Signal-induced proliferation-associated 1-like protein 3 Human genes 0.000 description 1
- 238000003646 Spearman's rank correlation coefficient Methods 0.000 description 1
- 241000122973 Stenotrophomonas maltophilia Species 0.000 description 1
- 238000000692 Student's t-test Methods 0.000 description 1
- 102100026640 Tight junction protein ZO-3 Human genes 0.000 description 1
- 101710191185 Transport and Golgi organization protein 1 homolog Proteins 0.000 description 1
- 108060008682 Tumor Necrosis Factor Proteins 0.000 description 1
- 102000000852 Tumor Necrosis Factor-alpha Human genes 0.000 description 1
- 102100023455 Uncharacterized protein C12orf42 Human genes 0.000 description 1
- 102100038932 Unconventional myosin-XVIIIa Human genes 0.000 description 1
- 101710193504 Unconventional myosin-XVIIIa Proteins 0.000 description 1
- XSQUKJJJFZCRTK-UHFFFAOYSA-N Urea Chemical compound NC(N)=O XSQUKJJJFZCRTK-UHFFFAOYSA-N 0.000 description 1
- 102000016520 Uridine-cytidine kinase-like 1 Human genes 0.000 description 1
- 108050006013 Uridine-cytidine kinase-like 1 Proteins 0.000 description 1
- 102300040183 Uridine-cytidine kinase-like 1 isoform 2 Human genes 0.000 description 1
- 102100021130 Zinc finger and BTB domain-containing protein 21 Human genes 0.000 description 1
- 238000010521 absorption reaction Methods 0.000 description 1
- 235000011054 acetic acid Nutrition 0.000 description 1
- 150000001243 acetic acids Chemical class 0.000 description 1
- 239000002253 acid Substances 0.000 description 1
- 230000009798 acute exacerbation Effects 0.000 description 1
- 230000003044 adaptive effect Effects 0.000 description 1
- 210000001552 airway epithelial cell Anatomy 0.000 description 1
- 238000003556 assay Methods 0.000 description 1
- 230000003190 augmentative effect Effects 0.000 description 1
- 229960004099 azithromycin Drugs 0.000 description 1
- MQTOSJVFKKJCRP-BICOPXKESA-N azithromycin Chemical compound O([C@@H]1[C@@H](C)C(=O)O[C@@H]([C@@]([C@H](O)[C@@H](C)N(C)C[C@H](C)C[C@@](C)(O)[C@H](O[C@H]2[C@@H]([C@H](C[C@@H](C)O2)N(C)C)O)[C@H]1C)(C)O)CC)[C@H]1C[C@@](C)(OC)[C@@H](O)[C@H](C)O1 MQTOSJVFKKJCRP-BICOPXKESA-N 0.000 description 1
- WZPBZJONDBGPKJ-VEHQQRBSSA-N aztreonam Chemical compound O=C1N(S([O-])(=O)=O)[C@@H](C)[C@@H]1NC(=O)C(=N/OC(C)(C)C(O)=O)\C1=CSC([NH3+])=N1 WZPBZJONDBGPKJ-VEHQQRBSSA-N 0.000 description 1
- 229960003644 aztreonam Drugs 0.000 description 1
- 208000022362 bacterial infectious disease Diseases 0.000 description 1
- 239000013060 biological fluid Substances 0.000 description 1
- 230000031018 biological processes and functions Effects 0.000 description 1
- 239000000091 biomarker candidate Substances 0.000 description 1
- 238000001574 biopsy Methods 0.000 description 1
- 230000001680 brushing effect Effects 0.000 description 1
- 239000004202 carbamide Substances 0.000 description 1
- 210000004027 cell Anatomy 0.000 description 1
- 230000033077 cellular process Effects 0.000 description 1
- 210000000349 chromosome Anatomy 0.000 description 1
- 230000001684 chronic effect Effects 0.000 description 1
- 208000037976 chronic inflammation Diseases 0.000 description 1
- 230000006020 chronic inflammation Effects 0.000 description 1
- 108010044759 collagen type XXIV Proteins 0.000 description 1
- 239000002131 composite material Substances 0.000 description 1
- 239000000470 constituent Substances 0.000 description 1
- 230000008878 coupling Effects 0.000 description 1
- 238000010168 coupling process Methods 0.000 description 1
- 238000005859 coupling reaction Methods 0.000 description 1
- 238000002790 cross-validation Methods 0.000 description 1
- 230000016396 cytokine production Effects 0.000 description 1
- 238000013480 data collection Methods 0.000 description 1
- 238000013499 data model Methods 0.000 description 1
- 238000000354 decomposition reaction Methods 0.000 description 1
- 238000013135 deep learning Methods 0.000 description 1
- 230000002950 deficient Effects 0.000 description 1
- 230000002939 deleterious effect Effects 0.000 description 1
- 238000013461 design Methods 0.000 description 1
- 108010067396 dornase alfa Proteins 0.000 description 1
- 102000013035 dynein heavy chain Human genes 0.000 description 1
- 108060002430 dynein heavy chain Proteins 0.000 description 1
- 230000007613 environmental effect Effects 0.000 description 1
- 229940088598 enzyme Drugs 0.000 description 1
- 210000002919 epithelial cell Anatomy 0.000 description 1
- 238000011067 equilibration Methods 0.000 description 1
- 230000003203 everyday effect Effects 0.000 description 1
- 238000002474 experimental method Methods 0.000 description 1
- 239000000284 extract Substances 0.000 description 1
- 239000011737 fluorine Substances 0.000 description 1
- 229910052731 fluorine Inorganic materials 0.000 description 1
- 235000019253 formic acid Nutrition 0.000 description 1
- 150000004674 formic acids Chemical class 0.000 description 1
- 238000009472 formulation Methods 0.000 description 1
- 238000013467 fragmentation Methods 0.000 description 1
- 238000006062 fragmentation reaction Methods 0.000 description 1
- 238000002599 functional magnetic resonance imaging Methods 0.000 description 1
- 108010079934 gamma-Crystallins Proteins 0.000 description 1
- 102000013069 gamma-Crystallins Human genes 0.000 description 1
- 238000001476 gene delivery Methods 0.000 description 1
- 239000005337 ground glass Substances 0.000 description 1
- 238000004128 high performance liquid chromatography Methods 0.000 description 1
- 238000010191 image analysis Methods 0.000 description 1
- 239000004615 ingredient Substances 0.000 description 1
- 239000003112 inhibitor Substances 0.000 description 1
- 230000010354 integration Effects 0.000 description 1
- 230000003834 intracellular effect Effects 0.000 description 1
- 230000005865 ionizing radiation Effects 0.000 description 1
- 230000001788 irregular Effects 0.000 description 1
- 230000002427 irreversible effect Effects 0.000 description 1
- 229960004508 ivacaftor Drugs 0.000 description 1
- 238000001679 laser desorption electrospray ionisation Methods 0.000 description 1
- 238000004895 liquid chromatography mass spectrometry Methods 0.000 description 1
- 230000033001 locomotion Effects 0.000 description 1
- 230000007774 longterm Effects 0.000 description 1
- 210000005265 lung cell Anatomy 0.000 description 1
- 231100000516 lung damage Toxicity 0.000 description 1
- 238000000816 matrix-assisted laser desorption--ionisation Methods 0.000 description 1
- 230000007246 mechanism Effects 0.000 description 1
- 230000004879 molecular function Effects 0.000 description 1
- 230000003534 oscillatory effect Effects 0.000 description 1
- 244000052769 pathogen Species 0.000 description 1
- 231100000915 pathological change Toxicity 0.000 description 1
- 230000036285 pathological change Effects 0.000 description 1
- 230000001991 pathophysiological effect Effects 0.000 description 1
- 230000007310 pathophysiology Effects 0.000 description 1
- 239000013610 patient sample Substances 0.000 description 1
- 210000003819 peripheral blood mononuclear cell Anatomy 0.000 description 1
- 238000000711 polarimetry Methods 0.000 description 1
- 230000010287 polarization Effects 0.000 description 1
- 230000008092 positive effect Effects 0.000 description 1
- 239000000843 powder Substances 0.000 description 1
- 238000002360 preparation method Methods 0.000 description 1
- 238000003825 pressing Methods 0.000 description 1
- 239000000092 prognostic biomarker Substances 0.000 description 1
- 230000000069 prophylactic effect Effects 0.000 description 1
- 238000000734 protein sequencing Methods 0.000 description 1
- 230000009325 pulmonary function Effects 0.000 description 1
- 238000003908 quality control method Methods 0.000 description 1
- 230000005855 radiation Effects 0.000 description 1
- 238000007637 random forest analysis Methods 0.000 description 1
- 230000009467 reduction Effects 0.000 description 1
- 230000001105 regulatory effect Effects 0.000 description 1
- 238000005316 response function Methods 0.000 description 1
- 238000004366 reverse phase liquid chromatography Methods 0.000 description 1
- 238000005096 rolling process Methods 0.000 description 1
- 238000005070 sampling Methods 0.000 description 1
- 238000005204 segregation Methods 0.000 description 1
- 238000012163 sequencing technique Methods 0.000 description 1
- 208000019116 sleep disease Diseases 0.000 description 1
- 238000002415 sodium dodecyl sulfate polyacrylamide gel electrophoresis Methods 0.000 description 1
- 239000007787 solid Substances 0.000 description 1
- 238000001228 spectrum Methods 0.000 description 1
- 210000003802 sputum Anatomy 0.000 description 1
- 208000024794 sputum Diseases 0.000 description 1
- 238000006467 substitution reaction Methods 0.000 description 1
- 239000013589 supplement Substances 0.000 description 1
- 230000008093 supporting effect Effects 0.000 description 1
- 230000002459 sustained effect Effects 0.000 description 1
- 208000024891 symptom Diseases 0.000 description 1
- 230000002123 temporal effect Effects 0.000 description 1
- 229960000707 tobramycin Drugs 0.000 description 1
- NLVFBUXFDBBNBW-PBSUHMDJSA-N tobramycin Chemical compound N[C@@H]1C[C@H](O)[C@@H](CN)O[C@@H]1O[C@H]1[C@H](O)[C@@H](O[C@@H]2[C@@H]([C@@H](N)[C@H](O)[C@@H](CO)O2)O)[C@H](N)C[C@@H]1N NLVFBUXFDBBNBW-PBSUHMDJSA-N 0.000 description 1
- 238000013519 translation Methods 0.000 description 1
- 239000011800 void material Substances 0.000 description 1
- XLYOFNOQVPJJNP-UHFFFAOYSA-N water Substances O XLYOFNOQVPJJNP-UHFFFAOYSA-N 0.000 description 1
Images






Classifications
-
- A—HUMAN NECESSITIES
- A61—MEDICAL OR VETERINARY SCIENCE; HYGIENE
- A61B—DIAGNOSIS; SURGERY; IDENTIFICATION
- A61B5/00—Measuring for diagnostic purposes; Identification of persons
- A61B5/72—Signal processing specially adapted for physiological signals or for diagnostic purposes
- A61B5/7271—Specific aspects of physiological measurement analysis
- A61B5/7275—Determining trends in physiological measurement data; Predicting development of a medical condition based on physiological measurements, e.g. determining a risk factor
-
- A—HUMAN NECESSITIES
- A61—MEDICAL OR VETERINARY SCIENCE; HYGIENE
- A61B—DIAGNOSIS; SURGERY; IDENTIFICATION
- A61B5/00—Measuring for diagnostic purposes; Identification of persons
- A61B5/08—Measuring devices for evaluating the respiratory organs
-
- G—PHYSICS
- G16—INFORMATION AND COMMUNICATION TECHNOLOGY [ICT] SPECIALLY ADAPTED FOR SPECIFIC APPLICATION FIELDS
- G16H—HEALTHCARE INFORMATICS, i.e. INFORMATION AND COMMUNICATION TECHNOLOGY [ICT] SPECIALLY ADAPTED FOR THE HANDLING OR PROCESSING OF MEDICAL OR HEALTHCARE DATA
- G16H20/00—ICT specially adapted for therapies or health-improving plans, e.g. for handling prescriptions, for steering therapy or for monitoring patient compliance
- G16H20/10—ICT specially adapted for therapies or health-improving plans, e.g. for handling prescriptions, for steering therapy or for monitoring patient compliance relating to drugs or medications, e.g. for ensuring correct administration to patients
-
- G—PHYSICS
- G16—INFORMATION AND COMMUNICATION TECHNOLOGY [ICT] SPECIALLY ADAPTED FOR SPECIFIC APPLICATION FIELDS
- G16H—HEALTHCARE INFORMATICS, i.e. INFORMATION AND COMMUNICATION TECHNOLOGY [ICT] SPECIALLY ADAPTED FOR THE HANDLING OR PROCESSING OF MEDICAL OR HEALTHCARE DATA
- G16H50/00—ICT specially adapted for medical diagnosis, medical simulation or medical data mining; ICT specially adapted for detecting, monitoring or modelling epidemics or pandemics
- G16H50/30—ICT specially adapted for medical diagnosis, medical simulation or medical data mining; ICT specially adapted for detecting, monitoring or modelling epidemics or pandemics for calculating health indices; for individual health risk assessment
-
- A—HUMAN NECESSITIES
- A61—MEDICAL OR VETERINARY SCIENCE; HYGIENE
- A61B—DIAGNOSIS; SURGERY; IDENTIFICATION
- A61B5/00—Measuring for diagnostic purposes; Identification of persons
- A61B5/0033—Features or image-related aspects of imaging apparatus, e.g. for MRI, optical tomography or impedance tomography apparatus; Arrangements of imaging apparatus in a room
- A61B5/0035—Features or image-related aspects of imaging apparatus, e.g. for MRI, optical tomography or impedance tomography apparatus; Arrangements of imaging apparatus in a room adapted for acquisition of images from more than one imaging mode, e.g. combining MRI and optical tomography
-
- G—PHYSICS
- G01—MEASURING; TESTING
- G01N—INVESTIGATING OR ANALYSING MATERIALS BY DETERMINING THEIR CHEMICAL OR PHYSICAL PROPERTIES
- G01N2800/00—Detection or diagnosis of diseases
- G01N2800/38—Pediatrics
- G01N2800/382—Cystic fibrosis
Definitions
- Cystic fibrosis is an autosomal recessive disorder that affects approximately 30,000 individuals in the United States.
- the primary defect results from mutations of the cystic fibrosis transmembrane conductance regulator gene, which codes for the CFTR chloride channel.
- the protein is expressed predominantly on the apical surface of epithelial cells throughout the body (although low level expression has been detected in other tissues).
- Over 2,000 disease causing mutations have been identified in the CFTR gene, with the majority of patients (-90%) exhibiting at least one allele with the F508del mutation.
- CFF Cystic Fibrosis Foundation
- CFF-PR Patient Registry
- the conduct of clinical trials to advance CF outcomes and interventions can no longer rely on standard outcome measures such as forced expiratory volume in 1 sec (FEV 1 ), as excessively large and/or long clinical trials are needed to demonstrate improvements in crude measurements such as lung function.
- FEV 1 forced expiratory volume in 1 sec
- the disclosed methods may be used to address these gaps, seeking to produce vertical advancement in disease monitoring and prediction through the use of advanced biostatistical modeling of lung function, which may be further enhanced via coupling with novel molecular biomarkers and/or imaging.
- the disclosed methods may be used to identify those patients most likely to benefit from various interventions, and allow clinicians to monitor responses to precise and personal interventions.
- the methods include the steps of a) determining one or more covariates associated with lung function in said individual, said covariate being selected from one or more of a clinical measure, a biomarker or an imaging marker; and b) calculating a risk probability score based on said determining of one or more covariate, said risk probability score being used to characterize an individual as having no predicted lung impairment, mild predicted lung impairment, moderate predicted lung impairment, or severe predicted lung impairment;
- the methods in certain aspects, further include c) treating said individual characterized as having mild predicted lung impairment, moderate predicted lung impairment, or severe predicted lung impairment with one or more of increased frequency of disease monitoring, increased frequency of infection monitoring, an anti-inflammatory therapy, or combinations thereof.
- the term “about” or “approximately” means within an acceptable error range for the particular value as determined by one of ordinary skill in the art, which will depend in part on how the value is measured or determined, e.g., the limitations of the measurement system. For example, “about” can mean within 1 or more than 1 standard deviation, per the practice in the art. Alternatively, “about” can mean a range of up to 20%, or up to 10%, or up to 5%, or up to 1% of a given value. Alternatively, particularly with respect to biological systems or processes, the term can mean within an order of magnitude, preferably within 5-fold, and more preferably within 2-fold, of a value. Where particular values are described in the application and claims, unless otherwise stated the term "about” meaning within an acceptable error range for the particular value should be assumed.
- the term "effective amount” means the amount of one or more active components that is sufficient to show a desired effect. This includes both therapeutic and prophylactic effects. When applied to an individual active ingredient, administered alone, the term refers to that ingredient alone. When applied to a combination, the term refers to combined amounts of the active ingredients that result in the therapeutic effect, whether administered in combination, serially or simultaneously.
- the terms "individual,” “host,” “subject,” and “patient” are used interchangeably to refer to an animal that is the object of treatment, observation and/or experiment. Generally, the term refers to a human patient, but the methods and compositions may be equally applicable to non-human subjects such as other mammals. In some embodiments, the terms refer to humans. In further embodiments, the terms may refer to children.
- CF cystic fibrosis
- PE pulmonary exacerbations
- FEV 1 forced expiratory volume in one second
- FEV 1 percentile standardized to CF
- FEV 1 percent predicted standardized to general population
- Applicant has developed a dynamic prediction model to produce a novel diagnostic algorithm that identifies individuals at risk of lung function decline.
- Applicant has developed dynamic prediction modeling to identify CF patients who develop rapid pulmonary decline during adolescence.
- Disclosed herein are methods and assays which may be used in combination with an algorithm for prediction of CF lung disease progression that is superior to current practice.
- the disclosed methods may employ the use of novel biomarkers of disease severity that may enhance the ability of FD analysis to predict FEV 1 decline.
- FEV 1 Three important measures are used in monitoring CF disease progression and response to therapy; FEV 1 , PE frequency, and BMI.
- FEV 1 , PE, and BMI are trailing indicators of disease progression, they are phenotypic culminations of molecular changes that persist and continue to influence the course of disease.
- these clinical measures reflect a molecular basis of disease that may be detectable in biological specimens such as blood.
- Serum and/or plasma markers may be used to predict disease progression and may allow better estimation of future disease trajectory, which would inform therapy and facilitate development of patient-specific treatment regimens.
- Applicant has identified systemic changes reflected in the blood that culminate in measurable pulmonary decline as children enter adolescence, including serum and/or plasma markers that may be used to better estimate future disease trajectory, which may then be used to inform therapy and facilitate development of patient-specific treatment regimens.
- CF cystic fibrosis
- a method of predicting lung function, more particularly, the likelihood of a decline in lung function, in an individual is disclosed.
- the methods may include detecting expression of a one or more biomarkers selected from Table 1.
- Table 1. Protein Isoform Name and Gene Name (Abbreviation) Protein isoform name Gene name Immunoglobulin alpha-1 heavv chain constant region IGHA1 kappa 1 immunoglobulin constant IGKC Immunoglobulin kappa light chain VLJ region IGK immunoglobulin lambda IGL Immunoglobulin lambda constant 2 IGLC2 Immunoglobulin lambda constant 3 IGLC3 Tight junction protein 3 TJP3 Alpha-1-acid glycoprotein 2 precursor ORM2 Signal-induced proliferation-associated 1-like protein 3 SIPA1L3 Plakophilin 4 PKP4 Inter-alpha (globulin) inhibitor H2 ITIH2 Absent in melanoma 1 protein AIM1 Actin filament-associated protein 1 isoform X2
- predicting lung function in an individual diagnosed with cystic fibrosis is disclosed.
- the methods may include detecting expression of a one or more biomarkers selected from Table 2.
- Panel of protein biomarker covariates for algorithm that improve algorithm performance in FEV 1 predictions over a period from 3 weeks to 4 months after biomarker collection.
- Protein name (gene name) 1.
- Alstrom syndrome protein 1 isoform 1 2.
- aminopeptidase O isoform X9 (C9orf3) 3. ankvrin-3 isoform 3
- ARAP2 protein ARAP2
- EPRS Bifunctional glutamate/proline--tRNA ligase
- CECR2 protein CECR2
- CECR2 cingulin-like 1 (CGNL1) 9.
- coiled-coil domain-containing protein 93 isoform X3 (CCDC93) 10. complement component C2 (C2) 11. complement component C6 isoform X7 (C6) 12. complement factor H (CFH) 13. connector enhancer of kinase suppressor of ras 2 isoform X2 (CNKSR2) 14.
- CTP phosphocholine cytidylyltransferase 15. DNA annealing helicase and endonuclease ZRANB3 (ZRANB3) 16.
- EPRSN1 17. fibrinogen alpha chain preproprotein, isoform alpha (FGA) 18. filamin 2 (FLN2) 19. Fras1-related extracellular matrix protein 2 (FREM2) 20.
- Platelet glycoprotein Ib alpha chain 32.
- PMFBP1 protein 32.
- PRO2841 34.
- protein arginine N-methyltransferase 3 isoform X1 (PRMT3) 35.
- Protein SCAF11 SCAF11
- ral GTPase-activating protein subunit alpha-1 isoform X12 (RALGAPA1) 37.
- PPRC Receptor-type tyrosine-protein phosphatase C
- Rho-GTPase activating protein 10 ARHGAP10) 40.
- RNA-binding motif protein, Y chromosome, family 1 member B isoform X1 (RBMY1B) 41. protein-methionine sulfoxide oxidase MICAL3 isoform X10 (MICAL3) 42. Protein sidekick-2 (SDK2) 43. sacsin isoform X3 (SACS) 44. SAPS domain family, member 2 (SAPS2) 45. serum aryldialkylphosphatase precursor 46. spermatogenesis-associated protein 31C1 isoform X1 (SPATA31C1) 47. synaptotagmin-like protein 2 isoform X10 (SYTL2) 48. translation initiation factor (IF2) 49. triadin isoform X17 (TRDN) 50.
- RBMY1B protein-methionine sulfoxide oxidase MICAL3 isoform X10
- SDK2 Protein sidekick-2
- SAPS domain family, member 2 (SAPS2) 45. serum aryldialkylphosphat
- uridine-cytidine kinase-like 1 isoform X7 ULK1
- utrophin isoform X4 UTRN
- WDR64 WD repeat-containing protein 64 isoform X2
- ZFAT zinc finger and AT hook domain containing
- predicting lung function in an individual diagnosed with cystic fibrosis is disclosed.
- the methods may include detecting expression of a one or more biomarkers selected from Table 3. Table 3. Panel of protein biomarker covariates for algorithm that improve algorithm performance in FEV 1 predictions over a period 4 months or more after biomarker collection.
- Protein name (gene name) 1. alpha 1 tvpe XXIV collagen precursor 2. alpha-fetoprotein enhancer binding protein 3. cell division cvcle 2-like 5 (cholinesterase-related cell division controller) (CDC2L5) 4.
- chromodomain-helicase-DNA-binding protein 6 isoform X3 (CHD6) 5.
- CHD6 chromosome 3 open reading frame 15 (C3orf15) 6.
- cilia- and flagella-associated protein 91 isoform 3 7.
- CLIP-associating protein 2 isoform X24 (CLASP2)
- coiled-coil domain-containing protein 18 isoform X2 (CCDC18)
- collagen triple helix repeat-containing RP11-45B20.2 10. collagen, type XXIV, alpha 1 (COL24A1) 11. death inducer-obliterator-3 (DIDO3) 12. diacylglycerol kinase iota isoform X4 (DGKI) 13. DNA methyltransferase 1-associated protein 1 14. DNAH10 variant protein 15. E3 ubiquitin-protein ligase MIB2 isoform X5 (MIB2) 16.
- IF2 protein IF2 protein
- IGL immunoglobulin lambda light chain VLJ region
- KIF2A kinesin-like protein
- KIF21A kinesin-like protein
- LAMA2 laminin subunit alha-2 isoform X3
- LIM and calponin homology domains-containing protein 1 isoform X20 LIMCH1
- LIM and calponin homology domains-containing protein 1 isoform X22 LIMCH1 26.
- lysine-specific demethylase 2B isoform X7 (KDM2B) 27. multiple endocrine neoplasia type 1 candidate protein number 18 (HSPF2) 28. MYCBP-associated protein isoform X1 (MYCBPAP) 29. nebulin-related anchoring protein, isoform CRA_b 30.
- PAP associated domain containing protein 5 variant 32. partitioning-defective 3-like protein splice variant c (PAR3L) 33.
- PF6 34 Pleckstrin homology-like domain family B member 2 (PHLDB2) 35.
- PARG poly (ADP-ribose) glycohydrolase
- SSTRIP somatostatin receptor interacting protein splice variant a
- SSTRIP sperm-associated antigen 17 isoform X3
- TIAM1 T-cell lymphoma invasion and metastasis 1
- TIAM1 terminal nucleotidyltransferase 4B isoform b
- tetratricopeptide repeat protein 21A isoform X6 (TTC21A)
- THBS1 thrombospondin 1
- ubiquitin carboxyl-terminal hydrolase 40 isoform X1 (USP40) 51.
- the method may comprise the step of determining an expression level of one or more, or two or more, or three or more, or four or more, or five or more, or six or more, or seven or more, or 8 or more, or 9 or more, or 10 or more, or 11 or more, or 12 or more, or 13 or more, or 14 or more, or 15 or more or 16 or more, or 17 or more, or 18 or more, or 19 or more, or 20 or more, or 21, or more, or 22 or more, or 23 or more, or 24 or more, or 25 or more, or 26 or more, or 27 or more, or 28 or more, or 29 or more, or 30 or more, or 31 or more, or 32 or more, or 33 or more, or 34 or more, or 35 or more, or 36 or more, or 37 or more, or 38 or more, or 39 or more, or 40 or more, or 41 or more, or 42 or more, or 43 or more, or 44 or more, or 45 or more, or 46 or more, or 47 or more, or 48 or more,
- the method may comprise the step of comparing said expression level to a control value to obtain a combined score and/or a risk probability score.
- a principle component or similar analysis that combines all the data from more than one or all of the markers may be used as well to generate a score.
- the combined score may be used to assess strength of association between the expression level of one or more of the aforementioned proteins, and the clinical parameter of interest.
- the clinical parameter may be lung function decline.
- the risk probability score may be used to predict the degree of risk that an individual will have or develop lung function changes or other clinical events that are of interest during the progression of cystic fibrosis.
- the one or more clinical parameters may be selected from FEV 1 , BMI, PE, number of hospitalizations, antibiotic status, infection status, and/or other clinical feature of the disease. These parameters may be selected using statistical methods described herein.
- the clinical parameter is lung function decline, wherein an individual classified as being high risk for rapid lung function decline is treated via more aggressive anti-inflammatory therapy and increased monitoring. It is well known that increased disease monitoring is associated with improved pulmonary status. Thus, those identified to be at risk for rapid decline would warrant more frequent clinical encounters to ensure that stability is maintained. In addition, those at risk of decline may have become colonized with new pathogenic bacteria. Identification of subjects at risk of pulmonary decline would trigger aggressive testing for new pathogens and treatment to stem pulmonary decline, for example, by administration of anti-bacterial agents that address the specific pathogenic bacteria in an individual.
- the sample may be blood, serum, urine, plasma, PBMCs, BALF, nasal and/or lower airway brushings, sputum, GI biopsies, lung explants, and combinations thereof.
- the sample may be obtained using routine methods known in the art. Multiple samples may be obtained over a period of time, for example, once every day, once every other day, once a week, once every two weeks, once every three weeks, once monthly, or once every two months, or once every three months, etc.
- the detection step is carried out using mass spectrometry.
- mass spectrometry For example, electrospray/matrix-assisted laser desorption ionization mass spectrometry may be used, as described herein.
- the methods described herein may be carried out via the use of a computerized device.
- one or more of the combined score or risk probability score may be calculated using a computer.
- the combined score and risk probability score may be used to create a predictive model within a web browser, the computer having a graphical user interface (GUI) in which an end user can interactively explore the predictive model within a web browser.
- GUI graphical user interface
- the end user may be, for example, a physician, patient, or patient guardian.
- the end user may use the interface to interactively explore the predictive model within a web browser.
- the GUI may be called the Cystic Fibrosis Point of Personalized Detection (CFPOPD).
- Predictions may be generated on an individual basis, utilizing data from CF cohorts, such as the Cystic Fibrosis Foundation Patient Registry, and the user may select which patient for which the prediction model is graphically illustrated.
- Inputs include, but are not limited to, clinical and demographic characteristics, such as those from electronic health records, and large-scale data from proteomics.
- Measured and predicted lung function may be portrayed using three interactive graphs linked by a common timeline.
- FEV 1 , the FEV 1 derivative, and the risk of rapid decline may all be displayed with corresponding shaded confidence bands.
- the GUI may include patient-level and ecological descriptive variables as well as proteomic data that can be used to subset the pool of individual patients to select from, and the GUI may be expanded to include additional inputs. This may be used to facilitate, for example, the comparison of individually forecasted rapid lung function decline among individuals that are identical with respect to all model covariates expect for their sex. Both static and temporal covariates are displayed using graphical and text-based panels.
- An exemplary GUI prototype is currently available for public use at http://cfpopd.amazon-shiny.duckdns.org/ and a screenshot is contained in FIG 13 .
- the methods may be used in conjunction with evaluation of a drug or treatment for cystic fibrosis.
- a potential treatment may be administered to an individual in need thereof, and the disclosed methods may be carried out following administration of such drug or treatment.
- the methods disclosed herein are used to assist a physician in the monitoring or treatment of lung function decline in an individual at risk for non-linear lung function decline.
- the method may comprise: determining a risk probability score based on one or more covariate associated with lung function in said individual, said covariate being selected from one or more of a clinical measure, a biomarker or an imaging marker that has been determined in said individual, according to the present disclosure.
- the risk probability score is used by the physician to characterize the individual as having no predicted lung impairment, mild predicted lung impairment, moderate predicted lung impairment, or severe predicted lung impairment and adapt the monitoring or treatment of the individual based on said characterization.
- a method for predicting evolution of a clinical parameter in an individual diagnosed with cystic fibrosis may comprise the steps of calculating a risk probability score from expression levels of a biomarker set comprising one or more biomarkers of Table 1; and classifying said individual into a high risk or low risk group based on the risk probability score; forecasting lung function trajectory based on said risk probability score.
- the step may be performed on a computer.
- the clinical parameter may be lung function decline.
- the combined score may be based on at least two clinical measurements, or at least three clinical measurements, or at least four clinical measurements.
- the biomarker expression may be detected using methods known in the art, or using methods as set forth herein.
- a method for segregating severe and disease in an individual diagnosed with cystic fibrosis may comprise the steps of detecting and quantifying a biomarker set comprising one or more proteins of Table 1, wherein said detecting step is carried out by assaying a biological sample from said individual and a clinical parameter obtained from said individual; and classifying the individual into a high or low risk group based on the combined score.
- the steps may be performed on a computer.
- the clinical parameter may be forced expiratory volume (FEV 1 ), and the method may be used to predict the risk of a rapid decline in FEV 1 in a said individual.
- FEV 1 forced expiratory volume
- a marginal score may be used to classify an individual as a high risk or low risk individual for rapid lung function decline and the combined score may be used to perform feature selection wherein proteins are selected that correspond to said individual's risk of rapid lung function decline.
- time refers to age (in years), but may be defined using other measures, including but not limited to: time since first pulmonary function measurement, in years; time since first serum collection, in years.
- Y ij is observed over one or more occasions, creating a random vector for each patient, represented as Y i . In observation, these data may be sparsely or irregularly collected for various reasons, at the discretion of the user.
- X i ( T ij ) may be the longitudinal process of FEV 1 for patient i at random time T i j , which is measured with error ⁇ ij .
- ⁇ ij residual error with mean zero and some variance ⁇ 2
- X i ( ⁇ ) which is the function depicting the smooth, continuous longitudinal FEV 1 profile for patient i, can be characterized, for example, using a cubic b-spline basis with knot locations as described by Szczesniak and others (2013).
- the 1 st protein of the k th patient may be represented as P li, and P l may be the vector combining measurements of this protein across all patients.
- the functional principal component scores (said marginal scores) for the k th component across all patients may be the vector ⁇ k .
- ⁇ kl may be the correlation coefficient representing the bivariate association between ⁇ k and P k .
- Methods to estimate ⁇ kl include, but are not limited to, Spearman's rank correlation coefficient and Pearson's correlation coefficient, such application being readily understood by one of ordinary skill in the art.
- Said coefficient ⁇ kl with estimated value denoted as ⁇ kl , represents said combined score from this two-stage process for a given protein with the FEV 1 trajectory.
- Implementation of the approach can proceed using R (R Foundation for Statistical Computing, Vienna, Austria).
- Obtaining said combined score may further include inputting data for one or more clinical parameters of the individual.
- the marginal and combined scores, further including the step of inputting data on one or more clinical parameters can be derived from a two-stage process.
- One or more covariates may be time-varying.
- Equation (1) is expanded as Equation (2) above, where estimation can proceed as they describe based on Equation (2) above with stated changes to covariance accommodating Zit .
- ⁇ ikc be the functional principal component scores, where c denotes that these scores are covariate adjusted.
- Stage II As described in Stage II, ⁇ kcl is estimated for bivariate association of resulting covariate-adjusted functional principal component scores, in which bivariate association is estimated between vectors ⁇ kc and Pl.
- Resulting estimate ⁇ kcl represents combined score for a given protein with the FEV 1 trajectory, which further includes inputting data on one or more clinical parameters.
- Obtaining a risk probability score may further include the step of inputting data for one or more clinical parameters of an individual.
- Y i may be realizations of a longitudinal patient-specific process other than FEV 1 , such as body mass index percentile.
- this substitution yields principal component scores ⁇ i 1 o , . . ., ⁇ iKo , where o indicates the given outcome process being analyzed as Y i .
- ⁇ klo may be the correlation coefficient representing the bivariate association between ⁇ ko and P k .
- coefficient ⁇ klo with estimated value denoted as ⁇ klo , represents said combined score from this two-stage process for a given protein with the outcome process noted as o.
- Additional clinical parameters as inputs If using additional clinical inputs as described above (paragraph 0035) and letting Y i ( t ) be realizations of a longitudinal patient-specific process over time t other than FEV 1 , such as body mass index percentile, yields covariate-adjusted combined scores for a different clinical endpoint.
- Resulting estimate ⁇ klco represents combined score for a given protein with the outcome process noted as o, which further includes inputting data on one or more clinical parameters as covariates.
- Y ij FEV 1 for a given patient and time point. Assume that the longitudinal FEV 1 process follows the Gaussian linear mixed model with non-stationary covariance as defined by Diggle, Sousa and Asar (2015).
- f i ( t ij ) is the mean response function for the patient's longitudinal lung function process
- U i is a patient-specific random intercept term, allowing patient profiles to deviate randomly from one another
- W i ( t ij ) is a stochastic process characterizing the change in an individual's lung function process that cannot be explained by f i ( t ij ) alone
- ⁇ ij is residual error from the model.
- g ( t ij ) is a nonparametric function representing a smooth, continuous-time process for lung function, which may be estimated using cubic b-splines;
- P ij is the covariate information on a single protein or set of proteins, corresponding to a vector or matrix, where T implies taking the transpose;
- ⁇ is the vector of parameter coefficients corresponding to associations between lung function and protein expression level(s).
- ⁇ i certain threshold for the rate of decline, which may be patient specific (hence i subscript) or uniform for all patients
- f i ⁇ t is the first derivative of the process from the model structure in Equation (3)
- H i ( t ) is all protein expression covariate history before a given time on the i th patient. Protein expression levels may either be observed cross-sectionally or longitudinally.
- Pointwise confidence intervals for the patient-specific risk probability score defined in Equation (5) can be derived as follows. Without loss of generality, assume this derivation is for a 95% pointwise confidence interval.
- ⁇ B it and ⁇ ni denote the mean and variance for B i ( t ij ) given H i ( t ) .
- the mean ⁇ B it satisfies: n i ⁇ ⁇ B i ⁇ ⁇ B i ⁇ D N n i 0 ⁇ n i
- ⁇ B i denotes the vector ⁇ B i 1 , ... , ⁇ B in i , ⁇ B i . is the estimate of ⁇ B i
- n i is the sample size for i th patient.
- the risk probability score may be calculated using an algorithm which further includes the step of inputting data from one or more clinical parameters of an individual.
- Z ij additional inputting data on clinical parameters, such as observed body mass index percentile, are represented as Z ij .
- ⁇ Z is the parameter vector representing associations between each clinical input variable and the longitudinal lung function process.
- Boot-strapped estimates for covariate- adjusted risk probability scores can be computed as in Equation (5).
- the risk probability score may be performed for another clinical outcome.
- Equation (3) the patient-specific risk probability score
- P r B io t ij P r B io t ij ⁇ ⁇ io ⁇ f io ⁇ t
- elements correspond to the terms defined in Equation (4) but for a different outcome o than FEV 1 .
- Boot-strapped estimates for risk probability scores based on outcome o can be computed as in Equation (6).
- Equation (8) and approaches herein can be adapted using the procedure set forth above to acquire covariate-adjusted estimates of risk probability for clinical outcome o.
- a method for predicting and monitoring or treating an individual at risk for non-linear lung function decline may comprise a) determining one or more covariates associated with lung function in said individual, said covariate being selected from one or more of a clinical measure, a biomarker or an imaging marker; and b) calculating a risk probability score based on said determining of one or more covariate, said risk probability score being used to characterize an individual as having no predicted lung impairment, mild predicted lung impairment, moderate predicted lung impairment, or severe predicted lung impairment.
- the method may further comprise c) treating said individual characterized as having mild predicted lung impairment, moderate predicted lung impairment, or severe predicted lung impairment with one or more of increased frequency of disease monitoring, increased frequency of infection monitoring, anti-inflammatory therapy, or combinations thereof.
- the risk probability score may comprise a risk probability of a clinical outcome selected from a decrease in forced expiratory volume in one second (FEV 1 ), pulmonary exacerbation (PE) frequency, FEV1- indicated exacerbation signal (FIES), ventilation defect percent (VDP), abnormal lung heterogeneity in lung as measured via imaging, lung hyperinflation, and combinations thereof.
- FEV 1 forced expiratory volume in one second
- PE pulmonary exacerbation
- FIES FEV1- indicated exacerbation signal
- VDP ventilation defect percent
- abnormal lung heterogeneity in lung as measured via imaging, lung hyperinflation, and combinations thereof.
- the covariate may be a clinical measure selected from forced expiratory volume in one second (FEV 1 ), body mass index percentile (BMI), pulmonary exacerbation (PE) frequency, historic lung function, ventilation defect percent (VDP), partial ventilation data, ventilation heterogeneity data, hyper-intensity data, FEV1- indicated exacerbation signal (FIES), and combinations thereof.
- FEV 1 forced expiratory volume in one second
- BMI body mass index percentile
- PE pulmonary exacerbation
- VDP ventilation defect percent
- FIES FEV1- indicated exacerbation signal
- the covariate may be a biomarker described in Table 1, Table 2, Table 3, or Table 4, said determining comprising determining an expression level of a protein described in Table 1, Table 2, Table 3, or Table 4.
- the covariate may be an imaging marker, said imaging marker including but not limited to VDP, lung heterogeneity, lung hyperinflation, CT, or the like.
- the imaging marker may be a functional lung measurement, a structural lung measurement, or combinations thereof.
- the imaging marker may be obtained by an imaging method.
- the image technique may be selected from hyperpolarized (HP) 129Xe, Ultra-short Echo-time (UTE) Magnetic resonance imaging (MRI), computed tomography (CT), and combinations thereof.
- HP hyperpolarized
- UTE Ultra-short Echo-time
- MRI Magnetic resonance imaging
- CT computed tomography
- the imaging marker may be structural remodeling of the lung.
- the imaging marker may be bronchiectasis.
- the predicted lung impairment may be non-linear decline in one or more parameters selected from Ventilation Defect Percentage (VDP), FEV 1 , partial ventilation, ventilation heterogeneity, ventilation hyper-intensity or a combination thereof.
- VDP Ventilation Defect Percentage
- FEV 1 partial ventilation, ventilation heterogeneity, ventilation hyper-intensity or a combination thereof.
- the individual may have normal FEV 1 at the time of said determining and said calculating.
- the risk probability score may predict the probability of lung function decline over a period selected from three weeks to four months, or six months, or twelve months.
- rapid (non-linear) lung function decline may be defined as a rate of change in longitudinal FEV 1 that falls below 1.5% predicted/year.
- non-linear lung function decline may be defined by the FEV1-indicated exacerbation signal (FIES) score.
- FIES FEV1-indicated exacerbation signal
- the one or more covariates may comprise a time-varying covariate.
- the time-varying covariate may comprise infections with Pa, MRSA, CF-related diabetes and use of state insurance as a marker of socioeconomic status.
- the biomarker may be one or more biomarkers selected from Table 1.
- the biomarker may be one or more biomarkers selected from Table 2.
- the biomarker may be one or more biomarkers selected from Table 3.
- the biomarker may be one or more biomarkers selected from Table 4.
- the individual may be diagnosed with cystic fibrosis (CF).
- CF cystic fibrosis
- the individual may be diagnosed with cystic fibrosis (CF) and has a normal forced expiratory volume in one second (FEV 1 ) as measured by spirometry.
- CF cystic fibrosis
- FEV 1 forced expiratory volume in one second
- the individual may be a pediatric patient having cystic fibrosis (CF).
- CF cystic fibrosis
- the individual may be a patient under the age of 13 years of age and having cystic fibrosis (CF).
- CF cystic fibrosis
- the method may forecast lung function trajectory for a period of about three weeks to about six months, or about six months to about twelve months.
- the method may further comprise applying a statistical algorithm to estimate correlation between a covariate value and predicted lung function.
- the method may be carried out via a computer system, and wherein said method comprises capturing and displaying information related to said characterization of said individual using a graphical user interface (GUI).
- GUI graphical user interface
- the method may further comprise assessing a variable selected from one or more of sex, body mass index (BMI), pulmonary exacerbation (PE), number of hospitalizations, antibiotic status, infection status, and combinations thereof, in said individual.
- a variable selected from one or more of sex, body mass index (BMI), pulmonary exacerbation (PE), number of hospitalizations, antibiotic status, infection status, and combinations thereof, in said individual.
- the lung function decline may be defined by one or more of absolute change in FEV 1 , rate of decline, risk of rapid decline, FIES.
- Serum protein was purified via gel separation and liquid chromatography. Protein isoforms were identified using a cut off of at least 100 mass signatures per protein, coverage ranging from between about 15 and 100%. A combination of gel-based and MS-based label free quantitation was used to quantify the proteins. Pathways including the dataset members were analyzed.
- Applicant has identified and validated serum proteome changes in banked samples collected from patients with stable and declining FEV 1 , developed a dynamic prediction model by integrating analyses of validated proteomic data with Functional Data (FD) analysis of longitudinal FEV 1 data to produce a novel diagnostic algorithm that identifies individuals at risk of lung function decline, and has evaluated the capacity of dynamic prediction modeling to identify CF patients who develop rapid pulmonary decline during adolescence in banked patient samples, testing the performance of the markers in banked samples from the EPIC study.
- Applicant's studies have the potential to fundamentally shift the nature of CF care from an evidence-based model of care decisions to individual patient-based care decisions informed through a predictive molecular and lung function disease platform and/or other clinical parameters.
- the disclosed algorithms of predictive biomarkers may be used to inform therapy choices and significantly improve CF care.
- Proteomic studies may be conducted with LC MS/MS tandem mass spectrometric examination of patient serum. Each sample may be split into 3 fractions which can be analyzed by MS for 15 hours (including 3 technical replicates, 3 quality controls, and 2 wash runs preventing carry over). This allows deep screens to be conducted that capture information on approximately 7,000-10,000 protein isoforms and modification per sample with high confidence and accuracy and allows capture of low-level proteins where differences are more often found when comparing disease severity cohorts. These analyses are far more rigorous than the usual "service center” analysis, generating approximately 7-10 times more data. This increased data collection also increases the time for analysis (-10 fold) but provides rigor for detection of useful biomarkers and decreases false discovery rates, markedly increasing chances of success.
- FD Functional Data
- FPC Functional Principle Component
- FEV 1 lung function
- PE frequency a measure of lung function
- BMI a measure of lung function
- FIG. 3 a rapid deterioration of lung function persists, especially during adolescence.
- FIG. 3 See also https://cff.org/Research/Researcher-Resources/Patient-Registry/2019-Patient-Registry-Annual-Data-Report.pdf . While there are several potential interpretations for this observation, without intending to be limited by theory, it is believed that systemic changes reflected in the blood culminate in measurable pulmonary decline during this period (10-19 years of age).
- the approach may be applied to the analysis of any biological sample, for example, plasma, urine, cells, and other tissues.
- the methodology involves novel modifications of previously described approaches ( Ziady AG, Sokolow A, Shank S, Corey D, Myers R, Plafker S, Kelley TJ. Interaction with CREB binding protein modulates the activities of Nrf2 and NF-kappaB in cystic fibrosis airway epithelial cells. Am.J.Physiol Lung Cell Mol.Physiol 2012 Jun 1;302(11):L1221-L1231.
- PMCID:PMC3379036 Chen J, Kinter M, Shank S, Cotton C, Kelley TJ, Ziady AG. Dysfunction of Nrf-2 in CF epithelia leads to excess intracellular H2O2 and inflammatory cytokine production.
- Biological fluid or tissue lysate can be adsorbed for albumin or other highly expressed proteins using absorption columns.
- Protein may be precipitated from eluate or lysate with acetone (equilibrated to 90% acetone), dried, and rehydrated at a concentration of 5 mg/ml in 8 M urea, 2% CHAPS, 50 mM DTT in water. Greater than 45 ug of protein for a sample is generally subjected to SDS-PAGE, excised gel fragments containing all the protein from the sample are reduced and alkylated (to achieve more fractionation more gel fragments are cut), and subjected to in-gel tryptic digestion (20 ug/ml), and protein peptides are extracted for LC MS-MS. Extracts were acidified by equilibration in 0.1%-1% acid (e.g.
- acetic or formic acids loaded onto a fractionation column (e.g. Thermo Fisher Scientific Acclaim PepMap C 18 column) at a flowrate of 0.15-0.5 ul / min, and subjected to nanospray tandem mass spectrometry with a mass spectrometer (e.g. Thermo Fisher Scientific LTQ Velos Pro spectrometer).
- a mass spectrometer e.g. Thermo Fisher Scientific LTQ Velos Pro spectrometer.
- CID collision induced dissociation
- mass tolerance of 0.1-2.0 Da is used for parent ions and 0.01-0.7 Da for fragment ions to enhance the ability to quantitate low level proteins.
- the EPIC Observational study includes >1,000 patients with annual blood samples for >10 years linked to the CFF-PR. 44 mild (FEV 1 >85th percentile among CF patients) and 44 severe ( ⁇ 45th percentile) patient cohorts were matched based on age, gender, genotype, and P. aeruginosa infection status, then randomized and blinded before proteomic analysis. Applicant identified a total of 61,942 protein isoforms expressed across both cohorts, with 4751 proteins identified in at least half the subjects of each cohort. Data were normalized to a relative abundance (RA) measure (0 to 1) for each sample.
- RA relative abundance
- RA was summarized (mean RA, number with RA > 0, ratio of RA mild/severe) and, to reduce the data, a battery of paired statistical tests was performed on the matched samples: McNemar's, Wilcoxon Signed-Rank, paired Student's t test, and permutation of the difference.
- biomarkers such as C-reactive protein, which are only useful during acute exacerbation (20-24).
- the initial twenty biomarkers identified exhibited areas under the curve (AUC) of 0.69 or higher. These AUC values indicate that the biomarkers are superior to presently available markers of disease (21-24).
- Many of the biomarkers have either physiological or biological connections to CF ( Fig. 4 ).
- tight junction protein (TJP) 3 contains a PDZ motif and is a member of a family of proteins that interact with CFTR (25). Increases in serum IgG Kappa light chain levels are associated with chronic inflammation (26).
- Alpha-1-acid glycoprotein 2 is one of 4 biomarkers used to predict inflammation and mortality beyond CF (27), and transthyretin has been shown to be significantly decreased in CF patients compared to non-CF (28). Excessive inflammatory signaling in CF and an increase in patients with severe disease would be expected and is suggested by nonbiased biomarker identification.
- CF lung disease demonstrates a steady decline that typically manifests during adolescence and young adulthood (29); however, rapid decline, characterized by accelerated loss of lung function relative to center-specific and/or population norms, is a ubiquitous event in the lives of patients ( FIG. 1 ). Identifying when patients are at highest risk for rapid lung function decline is a significant gap in CF research, and offers the opportunity to intervene prior to irreversible lung damage. A key contributor to this gap has been the paucity of individualized predictive data on the specific timing and severity of lung function decline, and this is sustained by continued reliance on linear statistical approaches to fit nonlinear lung function decline (30). Moreover, phenotypes of patients at risk for rapid decline have not been well defined due to the analytically complex progression of CF (31).
- Applicant's biostatistical research on CF lung disease progression has been based on nonlinear longitudinal data analysis methodology and implementation in CF clinical/translational research.
- Applicant's approach fuses longitudinal data analysis together with FD analysis (32), a branch of statistics that offers tools to characterize nonlinear phenomena.
- FD analysis sheds light on complex pathophysiological relationships in different disease states, such as sleep disorders (33) and Alzheimer's disease (34).
- Applicant has used the CFF-PR to demonstrate that FD analysis predicts CF lung-function decline with improved accuracy compared to traditional linear approaches (35) and can be used to identify phenotypes of rapid decline.
- CF registries such as the CFF-PR
- the disclosed dynamic prediction models using FD analysis have leveraged this rich longitudinal data to develop more accurate tools that predict disease course and in turn help prioritize interventions for the individual patient ( FIG.5 ).
- the disclosed methods meaningfully contribute to CF precision medicine, an area that has been noticeably understudied (37).
- Applicant has further identified FEV 1 phenotypes corresponding to early, middle and late rapid decline in patients 6-21 years of age.
- modes of variation in FEV 1 progression are characterized as functional principal components (39).
- the majority of variation (first functional principal component: 94%) among patient profiles are characterized by differences in mean longitudinal FEV 1 trajectories.
- Average degree of rapid decline was similar among phenotypes (roughly -3% predicted/year); however, average timing differed, with early, middle and late phenotypes experiencing rapid decline at 12.9, 16.3 and 18.5 years of age, respectively.
- Individuals with the late phenotype had the highest initial FEV 1 but experienced the greatest loss of lung function.
- FEV 1 variation coupled with nonlinear progression over age produces an uneven, "saw-tooth" shape for each individual's trajectory (see FIG. 1 ), making it difficult to model the time-course of a patient's underlying lung function and utilize it for earlier detection and intervention.
- Applicant utilized FD analysis to develop a dynamic prediction model of CF progression that accounts for the variation in FEV 1 .
- a dynamic prediction model recently proposed by Diggle et al (40) was expanded to accommodate the jagged, nonlinear shape of FEV 1 trajectories using CFF-PR data on 27,296 patients > 6 years who each had 1 to 89 FEV 1 measurements.
- Covariates in the model were birth cohort, copies of delF508, baseline FEV 1 , and male gender.
- Applicant evaluated predictive ability of the proposed stochastic model using a preliminary sample size of 36 subjects with available data on proteomic markers. These subjects contributed a total of 1975 FEV 1 longitudinal observations. The subjects were randomly split, with 80% contributing measurements to the training dataset for model building, and 20% providing data for the validation step. Using the training dataset, a model that included terms to model nonlinear progression of FEV 1 over age (cubic b-splines), a severity indicator established by the EPIC study (binary variable) was used; also included were terms for the markers and their interaction with age. Severe classification met statistical significance (P ⁇ 0.05).
- Predictive accuracy measured using Akaike information criterion (AIC) was superior in this model compared to a model that excluded the proteomic marker terms.
- Validation metrics that were assessed in the test cohort included mean absolute deviation (MAD), root mean-square error (RMSE), mean absolute percentage error (MAPE) and correlation between predicted values and observed values. Based on the FEV 1 scale, validation metrics showed relatively small prediction error.
- MAPE which measures forecast accuracy as percent difference between actual FEV 1 and predicted FEV 1 , shows that there is relatively small error between projected and actual FEV 1 values. Correlation between observed and predicted values is excellent (above 0.80) and is significantly higher than presently available measures (range from 0.54-.0.71).
- Applicant also assessed the predictive value of proteomic markers using FD and dynamic prediction as described above.
- a number of the biomarkers were included as covariates and their interaction with age in the Reduced Model.
- Other covariates included in the model were age-specific components to fit the FEV 1 trajectory, as shown in the FD analysis in previous studies, and the Mild/Severe designation from Applicant's original study.
- Serum proteome changes in banked samples collected from patients with stable and declining FEV 1 can be validated as follows. Preliminary studies generated serum biomarkers that segregate CF disease severity during periods of disease stability. Conduct of longitudinal analyses to validate the predictive power of biomarkers in samples from the EPIC CF cohort may provide the confidence for future modeling. Proteomic discovery studies in 88 cross sectional samples identified 20 biomarker changes that segregated CF patient lung disease severity in adolescence. Data collected from proteomic screens can benefit statistical models of lung function decline. To determine the utility of the molecular markers, top 20 molecular biomarkers were examined for their ability to enhance lung function decline modeling. Initial studies are cross sectional and conducted in discovery mode. Multiple (>10) simulations of functional principle component (FPCA) analyses of FEV 1 including data for each of the top 20 markers showed significant correlations between the behavior of novel markers and FEV 1 decline ( FIG. 6 ).
- FPCA functional principle component
- the discovery cross sectional data was collected by high throughput discovery mode MS analysis. Data from both targeted MS and ELISA may be integrated with FD analysis, either in combination or separately. Biomarkers discovered in preliminary cross-sectional studies for prediction of future FEV 1 decline, may be validated using targeted proteomics and ELISA analyses of banked serum samples from the EPIC Observational study.
- Samples. Analysis of samples from EPIC can be used to evaluate the predictive capacity of the biomarkers 1-5 years in advance of cohort segregation by FEV 1 . These can be compared with additional candidate biomarkers, and secondary analyses can be used to examine relationships to established predictors of disease severity, including PEs, BMI, and microbiology.
- the choice of the EPIC samples may be based on the availability of longitudinal samples for patients that cover the age range where significant lung-function decline is observed (e.g., early teen years).
- the longitudinal proteomic profiles can be categorized for subjects already profiled at 'baseline' or time zero. This will determine if the baseline protein markers are able to predict subsequent disease progression.
- the remaining patients (29 of the original 88) may be used to supplement the 'extreme phenotype' data and provide information on proteomic profiles across the continuum of clinical presentation.
- Mass spectrometry Applicant has developed useful mass spectrometry-based approaches for the identification/quantitation of thousands of proteins in serum samples. Protein is prepared from serum using albumin adsorption columns and gel and column chromatography, followed by tryptic digestion. Following preparation of whole-serum protein, serum-protein peptides are extracted and subjected to data-dependent sequencing and mass spectrometry analysis, as previously described (33-33;35;37-41;42). Briefly, the samples are loaded in a HPLC system autosampler and eluted by reverse-phase chromatography into a mass spectrometer fitted with a nanospray ion source for analysis.
- Collision-induced dissociation CID is used to fragment peptides, and CID spectra are searched against a human fasta database using Proteome Discoverer TM software.
- a decoy database is used to control for false discovery.
- a threshold filter of >2.0 for peptide XCorr score is used for sequence identification. For preliminary studies, this produced a range of coverage for identified proteins of 5.15% - 79.91% and an average of 10.03 % for all proteins identified.
- This high stringency filter of data provides more reliable quantitation, and aids the reduction of data in follow-up statistical analyses.
- proteomic markers were found between proteomic markers and the first functional principal component for FEV 1 (lower values of this component correspond to milder disease); several markers including glutamate receptor 2 isoform 4, alpha-1-acid glycoprotein 2 precursor, immunoglobulin alpha-1 heavy chain constant region, anti-Entamoeba histolytica immunoglobulin kappa light chain, anti-HBsAg immunoglobulin Fab kappa chain, AT-rich interactive domain-containing protein 4A isoform I, and uridine-cytidine kinase-like 1 isoform 2 were positively associated (range of r: 0.37 to 0.69); additional markers including unconventional myosin-XVIIIa isoform X1, chromosome 12 OPR 42, isoform CRA c, and Keratin 18 were negatively associated (range of r: -0.73 to -0.54).
- the disclosed dynamic prediction model uses patient-specific information from the EPIC cohort while incorporating parameter estimates from Applicant's recent large-scale CFF-PR study to predict the onset of rapid decline.
- the model takes into account observed lung function for the patient at each time point, the mean FEV 1 evolution for each patient, and encompasses covariates with corresponding association parameters. Normal distribution of the data provides patient-specific heterogeneity between FEV 1 trajectories. Furthermore, a stochastic process is used to reflect the "saw tooth" variation over time for individual patients (see FIG. 1 ); integrated Brownian motion is used to depict this process. Normally distributed measurement error from the PFT is accounted for. Finally, data for the level of markers is added to the model.
- the covariance functions and estimation algorithm have been described previously (40).
- the model for the CFF-PR is implemented using the lmenssp package (48) in R (R Foundation for Statistical Computing, Vienna, Austria).
- the covariates that considered from the CFF-PR may be expanded to include additional factors available from the EPIC study.
- Candidate molecular markers can be directly added as covariates, and the association parameters can be denoted to fit the model on smaller data. If marker data were available from all CFF-PR subjects, this new model could be called the "Full Model”. A so-called "Reduced Model” can be fit using detailed data from the EPIC cohort.
- a novel semiparametric "big data” calibration approach (49) may be adapted to examine predictive value of the markers.
- the approach can be geometrically described ( FIG. 8 ).
- the algorithm may be programmed using R.
- constrained maximum likelihood estimation may be implemented to fit the Reduced Model described above while accounting for the parameter estimates found from the External Model on the CFF-PR. This estimation, as shown by Chatterjee, produces unbiased estimates with lower standard errors for the Full Model, compared to fitting the Reduced Model alone.
- the calibrated estimates may be used to determine whether the addition of molecular markers and other EPIC covariates improve prediction of rapid decline.
- Improved prediction may be assessed by 1) examining the interaction of a given biomarker with age in the Reduced Model; 2) using model diagnostics; 3) fit statistics (e.g., AIC, BIC); 4) the likelihood ratio test to model; an example of the risk function for a patient is in FIG 9 .
- fit statistics e.g., AIC, BIC
- analysis with 20% of the EPIC cohort removed from the modeling may be performed. This subset of the cohort will have covariate data added to the model to check predictive accuracy; metrics here may include mean absolute deviation (MAD) and mean square error (MSE), which have been previously used by Applicant with good success (35).
- MAD mean absolute deviation
- MSE mean square error
- proteomic markers The predictive value of a subset of proteomic markers is assessed based on the Reduced Model using FD and dynamic prediction as described above. Applicant included the protein similar to dual specificity phosphatase 9, partial as a covariate and its interaction with age in the Reduced Model. Other covariates included in the model were age-specific components to fit the FEV 1 trajectory, as shown in the FD analysis in previous studies, and the mild/severe designation from the original study. The proteomic marker was available on 36 EPIC subjects (23 Mild, 13 Severe); these subjects were 6.3 (6.6-7.7) years of age with FEV 1 of 95.5 (61-138) %predicted.
- the median (range) number of PFTs per subject was 54 (20-93); per-subject follow-up was 11.5 (9.4-12) years.
- Covariate selection may also be performed using Bayesian Ensemble Trees (BET) (50).
- BET Bayesian Ensemble Trees
- This approach utilizes the ensemble of classification and regression trees (CART).
- CART classification and regression trees
- Each constituent tree is estimated with a subset of similar data, and can be used for covariate selection and imputation of missing data (51).
- the form of each marker covariate will be modified to examine potential lagged effects on FEV 1 decline.
- associations with FEV 1 decline can be simultaneously examined using joint models for high-dimensional data (52).
- PCA may be used to develop composite score(s); the score data may then be included in the model as covariate(s).
- BET may be used to create step functions representing rapid decline. The step functions can be subsequently smoothed to represent rate of FEV 1 decline and construct individual probabilities of rapid decline similar to the dynamic prediction model or risk scores for rapid decline.
- the ⁇ k 's are the coefficients of the proteomic biomarkers that we want to shrink towards zero to induce simultaneous variable selection and X ik is the covariate matrix for the proteomic biomarkers.
- U i U i ⁇ N ( 0, ⁇ 2 ).
- W i ( t ij ) denotes realizations from the zero-mean, continuous-time integrated Brownian motion process, and Z ij ⁇ N ( 0, ⁇ 2 ) represents iid measurement error.
- the following priors are assigned to complete model specification;
- Bayesian Least Absolute Shrinkage Selection Operator (lasso): Preferable when the goal is obtaining a sparse set of potential predictive proteomic biomarkers.
- ⁇ is the penalty parameter which controls the amount of penalty being applied to the coefficients of predictors (proteomic biomarkers) to force them near zero.
- the following prior distributions are assumed: ⁇
- ⁇ 2 , a 2 1 , .. a 2 p ⁇ MVN 0 , ⁇ 2 D L D L diag a 2 1 , .. a 2 p a 2 j
- Bayesian Adaptive Lasso Similar to the Bayesian Lasso described above but assigns different amount of penalty to different coefficients based on their importance. a 2 j
- Bayesian Ridge Regression Bayesian ridge regression is more preferable when the predictors are highly correlated. When there exists multicollinearity between predictors, the ridge regression deals with collinearity and applies continuous shrinkage and improves prediction performance through a bias-variance trade-off. ⁇
- ⁇ 2 , ⁇ ⁇ MVN 0 , ⁇ 2 D R D R diag ⁇ 2
- Bayesian Elastic-Net This method merges the features of both the lasso and the ridge and takes into account both sparsity and correlation structure of the data. Hence, the elastic net simultaneously induces variable selection by forcing the coefficients of redundant variables toward zero and selection of groups of correlated covariates and handles with multicollinear predictors. ⁇
- non-informative uniform prior for ⁇ 0 and ⁇ 1 flat uniform priors for ⁇ 1 and ⁇ 2
- non-informative scale invariant prior 1 ⁇ 2 for ⁇ 2 under all four models mentioned above.
- the posterior distributions of all unknown parameters are obtained by using Bayes' theorem. Unknown parameters and hyper-parameters of each model are estimated by sampling from their conditional posterior distributions through MCMC algorithm. Each MCMC algorithm is creating code in R software.
- interventional therapies are used to stave off lung function decline in patients with cystic fibrosis, including antibiotics, anti-inflammatory therapies, hypertonic saline to increase clearance, and others.
- the largest challenge in CF care is projecting lung function performance and intervening accordingly.
- intervention occurs when clear declines in lung function as measured by FEV 1 and other lagging indicators are observed.
- the approach of intervening once lung function has already declined rarely restores lost lung function; therefore, intervening before lung function decline occurs can be beneficial by preventing decline.
- An example that captures the range of the performance of some of the markers in Table 1 at improving the prediction of lung function is shown in FIG 11 .
- Tandem mass spectrometry or ELISA may be used to measure the levels of Ig lambda and Ig kappa chains in collections of blood from a CF patient during their regular hospital visits. The levels of these proteins would be inserted into the algorithm described herein along with the measurements of FEV 1 for the patient over a number of hospital visits. The markers can be used individually or in combination.
- the algorithm will return a score that reflects the risk of lung function decline in the next 18 months. Based on the score returned a physician may choose to be more aggressive with conventional anti-inflammatory therapy to reduce or prevent impeding lung function decline or follow the usual regiment of care if the score does not indicate a high risk of future lung function decline.
- Example 2 Measurement of CFTR to assess the success of the delivery of CFTR gene therapy
- FIG 12 shows difference measured in the levels of CFTR between patients homozygous for the F508del mutation compared with the levels measured in the serum of patients heterozygous for F508del and various mutations that express minimal levels of protein.
- the difference observed by the technology claimed here of 1.65-fold reflects the expected higher levels of CFTR expression in the homozygous group.
- An example of using this technology would be in the context of a CFTR gene therapy trial. In such a trial, measuring the expression of the delivered transgene CFTR would be necessary.
- the technology described herein may be used to measure level of full length or a portion of CFTR in the serum, plasma, and/or bronchoalveolar lavage to assess the efficiency of gene delivery.
- Rigorous individual monitoring can reduce treatment costs, improve clinical outcomes, and decrease disease progression rate in CF patients.
- the disclosed methods may be used to predict or identify individuals most likely to benefit from various interventions allowing for a proactive (vs. the current reactive) approach in managing pulmonary exacerbations for patients with CF.
- Spirometry is the primary tool used to assess lung function in diseases, including asthma, chronic obstructive pulmonary disease, and CF. It has been central to defining the natural history of these disorders and in developing algorithms to predict their trajectories.
- Spirometric measures e.g., FEV 1
- FEV 1 Spirometric measures
- CT computed tomography
- BAL bronchoalveolar lavage
- BAL fluid is obtained via bronchoscopy, which is invasive and often requires sedation-particularly in pediatric subjects. As such, it cannot be used for intensive monitoring.
- exposure to the ionizing radiation of CT is associated with increased risk of cancer in pediatric subjects, because children are more susceptible to radiation and have longer remaining lifespans than adults 12), making CT also ill-suited for frequent prospective monitoring in CF.
- the disclosed methods may be used to fill this void by combining structural and functional lung measurements that may be used to detect, monitor, or predict lung pathophysiologies.
- Exemplary methods useful for determining a structural or functional lung measurement include, but are not limited to, MRI, CT, or other imaging methods known in the art, which may be combined with FD analysis, and methods for protein biomarker measurement including, not limited to, LC-MS/MS (Liquid Chromatography incorporated with tandem Mass Spectrometry) and ELISA.
- LC-MS/MS Liquid Chromatography incorporated with tandem Mass Spectrometry
- ELISA ELISA
- bronchiectasis markers 29-30 examined in a biased fashion, focused only on targeted proteins in blood using epitope-based analyses with aptamers, which are prone to false positives and negatives. These factors contributed to only modest correlations (r -0.45) and did not further the understanding of CF bronchiectasis from what was known from other lung diseases. In contrast, Applicant has identified markers that correlate with disease severity (mean r -0.72) during stable disease, improving the ability to forecast lung function decline ( Fig. 4 ).
- LC-MS/MS discovery of systemic disease biomarkers and FD analysis Based on cancer and cardiovascular research, where conventional "shotgun" proteomics identify 500-1000 proteins per sample but failed to distinguish disease severity cohorts, Applicant reasoned that deeper proteomic screening would be necessary for CF studies. Thus, Applicant developed a pipeline using multidimensional protein separation by abundant protein-adsorption columns and gel and column chromatography. This more rigorous approach generated multiple fractions from each sample for subsequent MS analysis (7-17). Cohorts of 44 mild (FEV 1 >85%) and 44 severe ( ⁇ 45 th percentile) CF patient were matched based on age, gender, genotype, and infection status, then randomized and blinded before proteomic analysis.
- PCA Principal Component Analysis
- LASSO Least Absolute Shrinkage and Selection Operator
- LASSO random forests
- Wilcoxon Rank Sum 44
- McNemar's tests 45
- PCA of the top 744 isoforms with respect to FEV 1 indicated that these markers segregated mild from severe disease and are good discriminators of lung function in this cross-sectional group.
- FIG. 14 shows the forecasting performance of the top 3, (voltage gated calcium channel alpha 1F subunit CACNA1F [9606], pleckstrin homology domain-containing family A member 5 isoform X1 PLEKHA5 [9606], and pleckstrin homology domain-containing family A member 5 isoform X9 PLEKHA5 [9606]).
- FEV 1 may be used with biostatistical modeling as a point-of-care tool (14).
- the predictive power may be improved when data from Liquid Chromatography is incorporated with tandem Mass Spectrometry (LC-MS/MS), which can yield proteomic biomarkers sensitive at the molecular level to changes in CF lung disease ( Fig. 4 , 5 ).
- these biostatical and proteomic tools may be combined with one or more biomarkers as disclosed herein, (See Table 4, Panel of protein biomarker covariates for algorithm).
- Functional information may be used to determine regional lung dysfunction longitudinally and ultra-short echo-time (UTE), and may further be used to detect structural remodeling over time.
- Panel of protein biomarker covariates Protein name (gene name) 1. alpha 1 type XXIV collagen precursor 2. alpha-2-macroglobulin 3. alpha-fetoprotein enhancer binding protein 4.
- Alstrom syndrome protein 1 isoform 1 5. aminopeptidase O isoform X9 (C9orf3) 6. ankyrin-3 isoform 3 7. anti-HBsAg immunoglobulin Fab kappa chain, partial 8.
- ARAP2 protein (ARAP2) 10. Bifunctional glutamate/proline--tRNA ligase (EPRS) 11. C10ORF6 12. CECR2 protein (CECR2) 13. cell division cvcle 2-like 5 (cholinesterase-related cell division controller) (CDC2L5) 14. chromodomain-helicase-DNA-binding protein 6 isoform X3 (CHD6) 15. chromosome 3 open reading frame 15 (C3orf15) 16. cilia- and flagella-associated protein 91 isoform 3 17. cingulin-like 1 (CGNL1) 18. CLIP-associating protein 2 isoform X24 (CLASP2) 19.
- Coiled-coil domain-containing protein 18 20. coiled-coil domain-containing protein 18 isoform X2 (CCDC18) 21. coiled-coil domain-containing protein 93 isoform X3 (CCDC93) 22. collagen triple helix repeat-containing RP11-45B20.2 23. collagen, type XXIV, alpha 1 (COL24A1) 24. complement component C2 (C2) 25. complement component C6 isoform X7 (C6) 26. complement factor H (CFH) 27.
- CTP phosphocholine cytidylyltransferase 30. death inducer-obliterator-3 (DIDO3) 31. diacylglycerol kinase iota isoform X4 (DGKI) 32. DNA annealing helicase and endonuclease ZRANB3 (ZRANB3) 33. DNA methvltransferase 1-associated protein 1 34. DNAH10 variant protein 35. E3 ubiquitin-protein ligase MIB2 isoform X5 (MIB2) 36. EPRSN1 37. fibrinogen alpha chain preproprotein, isoform alpha (FGA) 38. filamin 2 (FLN2) 39.
- DIDO3 diacylglycerol kinase iota isoform X4
- ZRANB3 ZRANB3
- DNA methvltransferase 1-associated protein 1 34. DNAH10 variant protein
- Fras1-related extracellular matrix protein 2 (FREM2) 40. FYVE, RhoGEF and PH domain-containing protein 5 isoform X2 (FGD5) 41.
- interferon regulatory factor-2 binding protein 2B 53. junction-mediating and -regulatory protein isoform X2 (JMY) 54. KIAA0328 protein KIAA0328 55. kinesin-like protein (KIF2) 56. kinesin-like protein KIF21A isoform X7 (KIF21A) 57. laminin subunit alha-2 isoform X3 (LAMA2) 58. la-related protein 1 isoform X5 LARP1 59. LIM and calponin homology domains-containing protein 1 isoform X20 (LIMCH1) 60. LIM and calponin homology domains-containing protein 1 isoform X22 (LIMCH1) 61.
- lysine-specific demethylase 2B isoform X7 KDM2B isoform X7 (KDM2B) 62.
- MAX gene-associated protein isoform X11 MMA
- multiple endocrine neoplasia type 1 candidate protein number 18 HSPF2
- MYCBP-associated protein isoform X1 MYCBPAP
- nebulin-related anchoring protein isoform CRA_b
- Non-canonical poly(A) RNA polymerase PAPD5 (PAPD5) 67.
- PAP associated domain containing protein 5 variant 68.
- partitioning-defective 3-like protein splice variant c PAR3L
- Protein SCAF11 SCAF11
- ral GTPase-activating protein subunit alpha-1 isoform X12 (RALGAPA1) 83.
- Receptor-type tyrosine-protein phosphatase C PPRC
- RGS3 isoform C2PA-RGS3 (RGS3)
- Rho-GTPase activating protein 10 ARHGAP10
- RNA-binding motif protein, Y chromosome, family 1 member B isoform X1 (RBMY1B)
- RUNDC1 protein RUNDC1 protein
- RUNDC1 protein-methionine sulfoxide oxidase MICAL3 isoform X10 (MICAL3) 89.
- Protein phosphatase 1 regulatory subunit PPP1R12B 90. Protein sidekick-2 (SDK2) 91. sacsin isoform X3 (SACS) 92. SAPS domain family, member 2 (SAPS2) 93. serine/threonine-protein phosphatase 4 regulatory subunit 3A isoform 1 94. serine-protein kinase ATM isoform X5 (ATM) 95. serum aryldialkylphosphatase precursor 96. SHMT2 protein (SHMT2) 97. smoothelin-B3 (SMTN) 98. somatostatin receptor interacting protein splice variant a (SSTRIP) 99.
- SDK2 Protein sidekick-2
- SACS sacsin isoform X3
- SAPS domain family, member 2 SAPS2
- serine/threonine-protein phosphatase 4 regulatory subunit 3A isoform 1 94. serine-protein kinase ATM isoform X5 (A
- sperm-associated antigen 17 isoform X3 100.
- spermatogenesis-associated protein 31C1 isoform X1 101.
- synaptotagmin-like protein 2 isoform X10 (SYTL2)
- T-cell lymphoma invasion and metastasis 1 TIAM1
- TIAM1 T-cell lymphoma invasion and metastasis 1
- IF2 translation initiation factor
- transthyretin precursor 105.
- terminal nucleotidyltransferase 4B isoform b
- tetratricopeptide repeat protein 21A isoform X6 (TTC21A) 107.
- thrombospondin 1 THBS1)
- TRDN triadin isoform X17
- ubiquitin carboxyl-terminal hydrolase 40 isoform X1 (USP40) 110.
- uridine-cvtidine kinase-like 1 isoform 2 111.
- uridine-cvtidine kinase-like 1 isoform X7 UKL1
- utrophin isoform X4 UTRN
- Voltage-dependent N-type calcium channel subunit alpha-1B CACNA1B
- WDR64 zinc finger and AT hook domain containing
- ZFAT Zinc finger homeobox protein 4
- ZFHX4 Zinc finger homeobox protein 4
- the primary outcome-lung function- may be defined by the ventilation defect percent (VDP) or other regional measures (partial ventilation, ventilation heterogeneity, hyper-intensity, etc.).
- the FD model (46) may be used to analyze longitudinal VDP as a function of time (indexed as age at the time of functional assessment, via MRI scan, CT, or the like, and blood draw) and degree of proteomic expression with adjustment for select clinical/demographic characteristics as covariates, including lung clearance index (LCI). Applicant has built a prediction model using patient-specific information to predict the onset of rapid decline.
- the function ⁇ i ( t ij ) is mean VDP evolution for the i th patient, which includes spline formulation f ( t ij ) to characterize overall VDP progression as FD and encompasses covariates X i 1 ,...
- the degree of bronchiectasis can be defined be expert reader scoring or using automated software (e.g ., deep learning algorithms), may use scores from FPCA to estimate correlation between proteomic expression and degree of bronchiectasis (49).
- Sensitivity of MRI/CT to early CF lung disease The disclosed modeling may be applied to advanced lung imaging data, which can be performed in children too young to perform spirometry (50) and detect pathology prior to spirometric changes ( Fig. 18 ). Any acquisition strategy can be used. For example, in one approach an efficient 3D spiral, FLORET (51-55) sequence to depict ventilation at 3-mm resolution may be used -the highest 129 Xe resolution achieved in humans. "Keyhole" reconstruction pipeline may be used to mitigate regional 129 Xe signal decay and improve image accuracy (56). Biomarkers of structural remodeling using a 1 H FLORET acquisition may be optimized to visualize airway abnormities.
- Airway-optimized 1 H FLORET may be used to guide clinical bronchoscopies to obtain bronchoalveolar lavage (BAL) fluid from specific lung pathologies, including bronchiectasis.
- BAL bronchoalveolar lavage
- molecular changes may be used to forecast functional and structural disease in individual CF patients.
- These methods may combine innovations in proteomics, imaging and modeling to 1) enable translational research that continues to advance CF patient care and 2) define the post-CFTR-modulator "new normal" for the natural history of CF. While the markers identified in this work may be specific to CF, combining non-invasive HP 129 Xe and UTE MRI with blood and BAL proteomics may be applicable to a wide range of lung diseases.
- FD Functional Data
- FPC Functional Principal Component
- Hyperpolarized (HP) 129 Xe MRI Images from 50 CF patients (24 male, 26 female) were acquired. HP 129 Xe polarization ( ⁇ 20-40%) was measured before MRI with a polarimetry station. Images were acquired with 129 Xe coils to provide comparable performance across the range of subject sizes (15). Single-breath HP 129 Xe images were acquired using a multi-slice gradient-echo sequence, linear phase encoding, and optimized flip angle (16). Impaired ventilation was assessed using the Ventilation Defect Percentage (VPD), defined by employing automated software to identify lung voxels with signal intensities below a threshold that maximized contrast between age-matched, healthy control subjects and CF patients (17).
- VPD Ventilation Defect Percentage
- UTE MRI Historically, lung MRI has been challenging, because magnetic inhomogeneities are created by air-tissue interfaces (i.e., alveoli) and cause the MR signal to decay with a rate constant (T2*) of -0.8 ms at 3 T (18). Rapid decay was mitigated using an ultra-short echo-time (UTE) sequence to sample the MR signal before significant decay (echo-times of ⁇ 200 ⁇ s), retaining -80% of parenchymal signal. Data were collected at end expiration, where T2* and motion are minimized (19).
- T2* ultra-short echo-time
- Structural pathology (wall thickening, bronchiectasis, etc.) was identified and scored by two board-certified, pediatric radiologists using an MRI-variant of the well-established "Brody” scoring system (20) ( Fig. 15 ).
Landscapes
- Health & Medical Sciences (AREA)
- Engineering & Computer Science (AREA)
- Life Sciences & Earth Sciences (AREA)
- Public Health (AREA)
- Medical Informatics (AREA)
- General Health & Medical Sciences (AREA)
- Biomedical Technology (AREA)
- Pathology (AREA)
- Biophysics (AREA)
- Molecular Biology (AREA)
- Physiology (AREA)
- Veterinary Medicine (AREA)
- Physics & Mathematics (AREA)
- Epidemiology (AREA)
- Primary Health Care (AREA)
- Animal Behavior & Ethology (AREA)
- Surgery (AREA)
- Heart & Thoracic Surgery (AREA)
- Medicinal Chemistry (AREA)
- Chemical & Material Sciences (AREA)
- Bioinformatics & Cheminformatics (AREA)
- Pulmonology (AREA)
- Artificial Intelligence (AREA)
- Computer Vision & Pattern Recognition (AREA)
- Psychiatry (AREA)
- Signal Processing (AREA)
- Data Mining & Analysis (AREA)
- Databases & Information Systems (AREA)
- Investigating Or Analysing Biological Materials (AREA)
- Measuring Or Testing Involving Enzymes Or Micro-Organisms (AREA)
Abstract
Disclosed herein are methods for detecting protein expression in an individual diagnosed with cystic fibrosis. The methods, in certain aspects, include the steps of obtaining a sample from said individual and detecting expression in said sample of each protein of a protein set. The method may further include the step of determining expression level of one or more proteins of the protein set. The disclosed methods may be used to predict one or more clinical parameters in an individual having cystic fibrosis.
Description
- This invention was made with government support under HL142210, HL154105, HL116226 and HL125954 awarded by the National Institutes of Health. The government has certain rights in this invention.
- Cystic fibrosis (CF) is an autosomal recessive disorder that affects approximately 30,000 individuals in the United States. The primary defect results from mutations of the cystic fibrosis transmembrane conductance regulator gene, which codes for the CFTR chloride channel. The protein is expressed predominantly on the apical surface of epithelial cells throughout the body (although low level expression has been detected in other tissues). Over 2,000 disease causing mutations have been identified in the CFTR gene, with the majority of patients (-90%) exhibiting at least one allele with the F508del mutation. Disease causing mutations fall into 5 classifications that result in abnormal CFTR protein that is either truncated, misprocessed/mislocalized, lacking channel gating function, or malformed due to improper gene splicing. With advances in new-born and other screenings, CF is usually diagnosed at birth. Although the determinants of disease are well characterized, forecasting disease progression has been extremely difficult and as of yet unsuccessful.
- Care for CF patients has advanced rapidly over the past two decades, with an increase in patient longevity and quality of life that is unprecedented. The reasons for these improvements include a number of factors. First, the Cystic Fibrosis Foundation (CFF) has been tracking outcomes for nearly 50 years through their robust Patient Registry (CFF-PR), which includes patient data from nearly all CF patients in the US (individuals receiving care at accredited US CF centers), allowing assessment of outcomes and treatment responses. Next, there have been dramatic advances in new CF therapeutics (e.g. the development of recombinant human DNase, inhaled antibiotics including dissolved and dry powder tobramycin, aztreonam, hypertonic saline, low dose azithromycin to control inflammation, FDA approval of standardized pancreatic enzyme replacement, and most recently genotype-specific CFTR modulators such as KALYDECO® (4) and ORKAMBI® (5), and more recently TRIKAFTA® (6). In tandem with these new treatments, there has been a focus on the development of CF care guidelines and standardization of care across accredited CF care centers. This has helped to 'raise all boats' in the CF care community, accompanied by center-specific data to drive local quality improvement. Finally, understanding of disease severity predictors has advanced significantly, including the importance of weight in predicting pulmonary stability, the contribution of chronic Pseudomonas and MRSA infection to pulmonary decline and mortality, and the relationship between poorly controlled diabetes and disease progression. Indeed, these advancements have increased the median survival of CF patients to 41 years (CFF-PR - 2014), and nearly 50% of CF patients alive today are adults. However, despite this impressive progress in CF care, lung function decline continues even in patients being treated with the best modulators of CFTR currently available. (See, e.g., Nataliya Volkova et al., Disease progression in patients with cystic fibrosis treated with ivacaftor: Data from national US and UK registries. JCF. DOI: 10.1016/j.jcf.2019.05.015.)
- Accompanying the improvements in CF outcomes are a number of challenges that urgently require attention. There have been dramatic global improvements in the CF disease trajectory, but many patients have not fully benefited from the advancements described above. (
FIG 3 .) Indeed, the average age of death of CF patients in a given year has remained remarkably static, with most patients dying of CF lung disease during their third decade of life (CFF-PR 2014 statistics). The burden of care also remains a significant challenge, as most adolescents and young adults need to spend approximately two hours daily dedicated to therapies that maintain health. Adherence to complex care regimens is often untenable, and this has led to the need to 'personalize' care such that patients commit to daily therapies that are most likely to benefit them individually. These commitments increase during periods of instability, and treatment of PE remains highly interruptive to daily care and negatively impacts quality of life. They also are sentinel markers of disease progression, as 25% of CF patients fail to recover lung functions following PEs. The benefits of care improvements have also challenged the capacity to monitor CF lung disease and CF manifestations in other organs. Assessing the relative benefit of new therapies in the context of relatively normal lung function (as measured by routine spirometry) is particularly challenging for CF providers. This requires the development of more sensitive tools to identify subjects most likely to benefit from various interventions and to monitor the impact of new therapies added to care plans. Finally, the conduct of clinical trials to advance CF outcomes and interventions can no longer rely on standard outcome measures such as forced expiratory volume in 1 sec (FEV1), as excessively large and/or long clinical trials are needed to demonstrate improvements in crude measurements such as lung function. Thus, the CF field stands at a crossroads, where the benefits of the past limit the capacity to advance therapies and personalize care when relying upon standard measures of disease status. The disclosed methods, in certain aspect, may be used to address these gaps, seeking to produce vertical advancement in disease monitoring and prediction through the use of advanced biostatistical modeling of lung function, which may be further enhanced via coupling with novel molecular biomarkers and/or imaging. The disclosed methods may be used to identify those patients most likely to benefit from various interventions, and allow clinicians to monitor responses to precise and personal interventions. - The natural history of the disease is well studied; but disease progression is not well understood. Pulmonary decline typically begins in adolescence, but current measures tend to follow rather than predict outcomes. For example, if a marker predicted disease instability and erratic swings in lung function, established or novel interventions to prevent decline could be implemented. Several clinical measures track disease progression, including FEV1, body mass index (BMI) and pulmonary exacerbations (PE). Presently, intervention is driven by lagging indications of lung function decline, which is far less beneficial than intervening in at risk subpopulations before decline is manifest. Therefore, methods that can be used to predict CF disease progression are highly desirable, as they would preemptively identify those at risk of future disease progression, allowing caregivers to tailor treatments and select intervention to prevent pulmonary decline. Personalizing therapy is a critical need in CF, as broad application of all available therapies leads to a high daily treatment burden and poor adherence. These measures are lagging indicators of disease progression that result from molecular changes directly or indirectly related to CFTR dysfunction. Furthermore, current monitoring of lung function data is inadequate, and fails to utilize novel biostatistical tools to identify patients at risk for future decline. The disclosed methods address one or more of aforementioned needs in the art.
- Disclosed herein are methods for predicting, monitoring, and/or treating an individual at risk for non-linear lung function decline. The methods, in certain aspects, include the steps of a) determining one or more covariates associated with lung function in said individual, said covariate being selected from one or more of a clinical measure, a biomarker or an imaging marker; and b) calculating a risk probability score based on said determining of one or more covariate, said risk probability score being used to characterize an individual as having no predicted lung impairment, mild predicted lung impairment, moderate predicted lung impairment, or severe predicted lung impairment; The methods, in certain aspects, further include c) treating said individual characterized as having mild predicted lung impairment, moderate predicted lung impairment, or severe predicted lung impairment with one or more of increased frequency of disease monitoring, increased frequency of infection monitoring, an anti-inflammatory therapy, or combinations thereof.
- Those of skill in the art will understand that the drawings, described below, are for illustrative purposes only. The drawings are not intended to limit the scope of the present teachings in any way.
-
FIG 1 . Lung function in a typical CF patient. Lung function is separated into stages, with a stable period (light grey), an erratic period with large swings in FEV1 (dark grey), and a decline stage (black). -
FIG 2 . Disease progression in CF. In depth serum proteomic analysis can capture molecular changes in serum that give rise to downstream organ pathology. -
FIG 3 . Lung function decline with age. Comparison from data compiled from 1990-2014. Despite improvement in lunch function at early age, the rate of decline is unaffected by modern therapies. Source: CF Foundation Patient Registry data. -
FIG 4 . Box plots of CF disease severity serum biomarkers. Example of differential expression identified serum biomarkers of lung disease severity. Forty-four candidates whose quantities differ by 0.35-5.4-fold between mild and severe disease have been identified. -
FIG 5 . Functional Data (FD) analysis model is superior to presently available models of lung function decline. CFF PR analyses with point estimates from FD analysis (solid line), cubic (dashed line), quadratic (dotted line) and conventional linear (dot-dash line) mixed models of decline (A) and rate of decline (B); stratified by birth cohorts born before 1981 (solid line), 1981-1988 (dashed line), 1989-1994 (dot-dash line), and after 1994 (dotted line) (C); stratified by survival (solid line) and death (dashed line) for patients less than 19 years of age (D). The FD model in (A) reflected the dynamic status of lung function during young adolescence/early adulthood; traditional models found no changes and even indicated gains in lung function (e.g. cubic). The arrow at the "dip" in (B) shows 1) Patients attained most rapid decline at median age (IQR) 16.3 (13.5, 21.0) years; 2) Degree of maximal FEV1 % loss was variable (mean: 1.98% pred/yr, 95% CI: 1.86, 2.10). Longitudinal FEV1 % measures shared correlation for up to 9 years, highlighting the potential of short-term clinical interventions to impact long-term lung function. Further subgroup analysis revealed that FEV1 % curves vary according to survivorship and birth cohort (C-D), highlighting left- and right-truncation biases, respectively. -
FIG 6 . Biomarker correlation with functional principle component (FPCA) analysis of lung function. Examples shown for 4 of 18 biomarkers discovered in preliminary cross-sectional proteomic analyses that significantly correlate with FPCA analysis of FEV1. The first principle component score (FPC1, y-axis); the thick dashed black line is the fit to the data using a scatterplot smoother; positive association (r) indicates that higher values of these markers may lead to worsening FEV1 trajectory, while negative associates (-4) indicates that higher values of these markers correspond to improvements in the FEV1 trajectory. Although these studies were conducted in discovery mode to capture the maximal number of biomarkers, data on individual markers may be improved under targeted MS and ELISA analyses. -
FIG 7 . On the left, smoothed FEV1 observed over age (in years) for the EPIC cohort. On the right, the corresponding rate of change in FEV1 (expressed as % predicted/year) over age. -
FIG 8 . Schematic of biomarker integrated dynamic modelling of FEV1. On the left, the full model space for all CF patients and possible covariates; the large circle is the space for the full dynamic prediction model, and the star denotes the true associates between each CFFPR/EPIC covariate and rapid (non-linear) decline. On the bottom right, the bottom circle is the space for the external data model that is fit to the CFFPR; the bottom star marks the parameters Θ* that would minimize the mathematical distance between the full model with all covariates and the model with only the CFFPR covariates. On the upper right, the circle shows a star being mapped to the same space as the external model, in order to perform model calibration and obtain more efficient, unbiased estimates. -
FIG 9 . Dynamic prediction modeling. Dynamic predictions for female (left column) and male (right column) CF patients. In the left column, the female patient had data on 111 encounters in the CFFPR; her age at entry (follow-up time: 0 years on the axis) was 6.1 years. Her decline in FEV1 was highly variable over time (A) with probability of rapid decline on the y-axis in (B); periods of increased risk of rapid (non-linear) decline shown at 16-18 years of age (follow-up time: 10-12 years on the x-axis). By contrast, the male patient (right column) had steadier decline and less availability (C). He had data on 35 encounters in the CFFPR; his age at entry was 14.5 years. He had decreased risk of rapid (non-linear) decline (D), compared to the female patient. Rapid decline was defined as a rate of change in longitudinal FEV1 that fell below 1.5% predicted/year. Threshold was determined as previous reported (53). -
FIG 10 . FEV1 and clinical event forecasting performance. Left panel: the FEV1 forecasting performance for a representative subject from the CFF-PR. Observed FEV1 data (black dots) is fitted with the model (black line) over age; the model was used to predict his subsequent FEV1 data shown after the vertical bar in the plot. To the right of the vertical bar, the solid line and dashed lines are the predicted FEV1 and corresponding 95% confidence bands. The dotted line is the smooth, population-level trajectory for FEV1. Right Panel: the ROC curves for the model fit to PE data. The upper curve is the proposed model, which has the highest AUC (0.74), followed by a model with no subject-level effect and logistic regression (0.68 and 0.61, respectively). -
FIG 11 . Marker improvement of FEV1 prediction. Protein markers in serum improve the ability to predict future lung function decline, reducing the error in prediction of absolute FEV1 by up to greater than 10 percentile points. -
FIG 12 . Quantitation of CFTR by tandem mass spectrometry. Fractionated serum is analyzed for levels of CFTR in homozygote F507del patients versus those with 1 F508del allele with the other allele producing minimal protein. Solid line is median. Dashed line is average. DF/DF average ± SEM = 12.34±1.44 vs DF/min average ±SEV = 7.5±1.09.* connotes significant difference, p=0.0092. -
FIG 13 . GUI Prototype. The GUI (graphical user interface) was composed using the R statistical programming language, specifically using the flexdashboard, shiny, and plotly packages. See R Core Team (2017). R: A language and environment for statistical computing. R Foundation for Statistical Computing, Vienna, Austria. URL https://www.R-project.org; Barbara Borges and JJ Allaire (2017). flexdashboard: R Markdown Format for Flexible Dashboards. R package version 0.5.1. https://CRAN.R-project.org/package=flexdashboard; Winston Chang, Joe Cheng, JJ Allaire, Yihui Xie and Jonathan McPherson (2017). shiny: Web Application Framework for R. R package version 1.0.5. https://CRAN.R-project.org/package=shiny; Carson Sievert, Chris Parmer, Toby Hocking, Scott Chamberlain, Karthik Ram, Marianne Corvellec and Pedro Despouy (2017). plotly: Create Interactive Web Graphics via 'plotly.js'. R package version 4.7.1. https://CRAN.R-project.org/package=plotly. -
FIG 14 . Lung function prediction with biomarkers. FEV1 trajectory is predicted for three CF patients with proteomic biomarker data from 87 subjects. Clinical data is shown in (black), while the algorithm's prediction is shown without (dashed) or with (solid) or 3 of the top 20 markers (coded to maintain blind during ongoing studies to develop the algorithm for clinical translation). Arrows demonstrate increased accuracy for predicting lung function, especially for upward or downward deflections from the smoothed trajectory. Adding markers to the model significantly improved personalized prediction of lung function trajectories, demonstrating compelling evidence that the disclosed approach can translate into a superior tool for CF. -
FIG 15 . CF pathologies (rd circles) on CT (A) and ultra-short echo-time (UTE) magnetic resonance imaging (MRI) (B) in 1-yr old patients: (1) bronchiectasis, (2) ground glass opacity, (3) wall thickening, and (4) mucus plugging. (C) "Brody" scoring for both modalities. -
FIG 16 . Ventilation vs. proteomics. Top) CF patients with FEV1>100% and no, mild, and moderate ventilation impairment via 129Xe MRI. Bottom) Proteomic differences in CF patient plasma collected on the day of MRI. Cohort Comparisons are indicted in the legend (center). Vertical line: p=0.05. -
FIG 17 . Structural UTE MRI vs. proteomics. Left) CF patients with mild (top) and moderate (bottom) remodeling via UTE. Right) Proteomic differences between patients with mild and moderate remodeling. Vertical line: p=0.05. -
FIG 18 . 129Xe MRI of lung dysfunction. A) 129Xe VDP vs FEV1 in CF patients. Mean VPD of controls is shown (blue line). While FEV1 and VDP correlate (red line, p=<0.001), scatter is seen in CF patients with normal FEV1. B-D) Ventilation images of CF patients with FEV1 >100%. These patients display different regional ventilation, ranging from normal (D, VDP<4%) to impaired (B, VDP=28%), indicating the higher sensitivity of 129Xe MRI. - Unless otherwise noted, terms are to be understood according to conventional usage by those of ordinary skill in the relevant art. In case of conflict, the present document, including definitions, will control. Preferred methods and materials are described below, although methods and materials similar or equivalent to those described herein can be used in practice or testing of the present invention. All publications, patent applications, patents and other references mentioned herein are incorporated by reference in their entirety. The materials, methods, and examples disclosed herein are illustrative only and not intended to be limiting.
- As used herein and in the appended claims, the singular forms "a," "and," and "the" include plural referents unless the context clearly dictates otherwise. Thus, for example, reference to "a method" includes a plurality of such methods and reference to "a dose" includes reference to one or more doses and equivalents thereof known to those skilled in the art, and so forth.
- The term "about" or "approximately" means within an acceptable error range for the particular value as determined by one of ordinary skill in the art, which will depend in part on how the value is measured or determined, e.g., the limitations of the measurement system. For example, "about" can mean within 1 or more than 1 standard deviation, per the practice in the art. Alternatively, "about" can mean a range of up to 20%, or up to 10%, or up to 5%, or up to 1% of a given value. Alternatively, particularly with respect to biological systems or processes, the term can mean within an order of magnitude, preferably within 5-fold, and more preferably within 2-fold, of a value. Where particular values are described in the application and claims, unless otherwise stated the term "about" meaning within an acceptable error range for the particular value should be assumed.
- As used herein, the term "effective amount" means the amount of one or more active components that is sufficient to show a desired effect. This includes both therapeutic and prophylactic effects. When applied to an individual active ingredient, administered alone, the term refers to that ingredient alone. When applied to a combination, the term refers to combined amounts of the active ingredients that result in the therapeutic effect, whether administered in combination, serially or simultaneously.
- The terms "individual," "host," "subject," and "patient" are used interchangeably to refer to an animal that is the object of treatment, observation and/or experiment. Generally, the term refers to a human patient, but the methods and compositions may be equally applicable to non-human subjects such as other mammals. In some embodiments, the terms refer to humans. In further embodiments, the terms may refer to children.
- The standard of care for patients with cystic fibrosis (CF) has advanced rapidly but CF patients still suffer routinely from pulmonary exacerbations (PE) and these are under reported. Current treatment methods are reactive to drops in lung function. A prognostic test that may be used to predict lung function decline in CF patients based on the combination of clinical data with molecular and imaging markers may be used to proactively treat CF patients. Variables such as historic lung function measures, biomarkers in blood, and regional lung structural and functional information obtained by imaging may be combined into a functional data algorithm that may be used to forecast the projection of lung function trajectory for a time period, for example, about 6 to about 12 months. Spirometric measures of lung function, namely the forced expiratory volume in one second (FEV1), remain the most commonly used clinical measure of disease progression. It may be noted that FEV1 percentile (standardized to CF) is not equivalent to FEV1 percent predicted (standardized to general population). As used herein, reference to FEV1 refer to FEV1 percentile or FEV1 percent predicted.
- However, these measures provide only whole-lung metrics of lung function, making them insensitive to early disease. As a result of this inherent insensitivity and improved clinical care, the majority of pediatric CF patients now have normal FEV1, making it increasingly difficult to detect early lung disease, when intervention would be most beneficial. As clinicians move toward maintaining higher lung function for longer periods of time, it will become increasingly important to develop more sensitive measures of CF lung disease and/or more specific biomarkers. Further, combining these non-invasive testing modalities to predict exacerbations and lung function decline may be advantageous. The limitations of FEV1 and the pressing need for higher sensitivity for forecasting lung disease progression are relevant to a number of disorders, including COPD, severe asthma, and non-CF bronchiectasis. Here, methods employing an algorithm to predict structural remodeling in, and function of, the CF lung are disclosed. Such methods may be used with or without the use of one or more of the disclosed biomarkers, or sets of biomarkers disclosed herein.
- In one aspect, Applicant has developed a dynamic prediction model to produce a novel diagnostic algorithm that identifies individuals at risk of lung function decline. In another aspect, Applicant has developed dynamic prediction modeling to identify CF patients who develop rapid pulmonary decline during adolescence. Disclosed herein are methods and assays which may be used in combination with an algorithm for prediction of CF lung disease progression that is superior to current practice. In one aspect, the disclosed methods may employ the use of novel biomarkers of disease severity that may enhance the ability of FD analysis to predict FEV1 decline.
- Three important measures are used in monitoring CF disease progression and response to therapy; FEV1, PE frequency, and BMI. A rapid deterioration of lung function persists in CF patients, especially during adolescence. (
FIG 3 .). Although FEV1, PE, and BMI are trailing indicators of disease progression, they are phenotypic culminations of molecular changes that persist and continue to influence the course of disease. In addition to the deleterious effects of CF disease progression (such as mucus plugging, bacterial infection, and inflammation), these clinical measures reflect a molecular basis of disease that may be detectable in biological specimens such as blood. Serum and/or plasma markers may be used to predict disease progression and may allow better estimation of future disease trajectory, which would inform therapy and facilitate development of patient-specific treatment regimens. Applicant has identified systemic changes reflected in the blood that culminate in measurable pulmonary decline as children enter adolescence, including serum and/or plasma markers that may be used to better estimate future disease trajectory, which may then be used to inform therapy and facilitate development of patient-specific treatment regimens. - In one aspect, described herein are novel methods for the prediction of lung function decline and/or treatment of individuals having or predicted to have lung function decline, such as individuals diagnosed with cystic fibrosis (CF).
- In one aspect, a method of predicting lung function, more particularly, the likelihood of a decline in lung function, in an individual is disclosed. In certain aspects, the methods may include detecting expression of a one or more biomarkers selected from Table 1.
Table 1. Protein Isoform Name and Gene Name (Abbreviation) Protein isoform name Gene name Immunoglobulin alpha-1 heavv chain constant region IGHA1 kappa 1 immunoglobulin constant IGKC Immunoglobulin kappa light chain VLJ region IGK immunoglobulin lambda IGL Immunoglobulin lambda constant 2 IGLC2 Immunoglobulin lambda constant 3 IGLC3 Tight junction protein 3 TJP3 Alpha-1-acid glycoprotein 2 precursor ORM2 Signal-induced proliferation-associated 1-like protein 3 SIPA1L3 Plakophilin 4 PKP4 Inter-alpha (globulin) inhibitor H2 ITIH2 Absent in melanoma 1 protein AIM1 Actin filament-associated protein 1 isoform X2 AFAP1 Serine/threonine-protein phosphatase PP1-beta catalytic subunit PPP1CB Retinol-binding protein 4 RBP4 Fermitin family homolog 1 FERMT1 Actin, cytoplasmic 2 ACTG1 Transthyretin TTR Melanoma inhibitory activity protein 3 isoform X2 MIA3 Pleckstrin homology domain-containing family G member 1 isoform X3 PLEKHG1 Pleckstrin homology domain-containing family A member 5 isoforms X1-X9 PLEKHA5 Pleckstrin PLEK Zinc finger protein 295 Zbtb21 Protocadherin Fat 2 FAT2 Cadherin-related family member 2 isoform X1 CDHR2 Voltage gated calcium channel alpha 1F subunit CACNA1F Actin filament associated protein AFAP Heat shock 70 kDa protein 1-like HSPA1L EF-hand calcium binding protein 2 EFCBP2 Polyamine modulated factor-1 (PMF1) protein PMF1 Keratin 16 KRT16A Keratin 18 KRT18 DNA replication ATP-dependent helicase/nuclease DNA2 isoform X4 DNA2 Non-lens beta gamma-crystallin like protein CRYBG1 Bromodomain and WD repeat-containing protein 1 isoform X1 BRWD1 Collagen type V alpha 3 chain COL5A3 Collagen type IV alpha COL4A Dynein heavv chain 12, axonemal isoform X5 DNAH12 Serine/arginine repetitive matrix protein 1 SRRM1 Ras-related protein Rap-1A RAP1A AT-hook-containing transcription factor isoform 1 AKNA1 Coiled-coil domain-containing protein 18 isoforms X1-X7 CCDC18 Coiled-coil domain-containing protein 180 CCDC 180 Patatin-like phospholipase domain-containing protein 2 isoform X1 PNPLA2 - In one aspect, predicting lung function in an individual diagnosed with cystic fibrosis is disclosed. In certain aspects, the methods may include detecting expression of a one or more biomarkers selected from Table 2.
Table 2. Panel of protein biomarker covariates for algorithm that improve algorithm performance in FEV1 predictions over a period from 3 weeks to 4 months after biomarker collection. Protein name (gene name) 1. Alstrom syndrome protein 1isoform 12. aminopeptidase O isoform X9 (C9orf3) 3. ankvrin-3 isoform 34. ARAP2 protein (ARAP2) 5. Bifunctional glutamate/proline--tRNA ligase (EPRS) 6. C10ORF6 7. CECR2 protein (CECR2) 8. cingulin-like 1 (CGNL1) 9. coiled-coil domain-containing protein 93 isoform X3 (CCDC93) 10. complement component C2 (C2) 11. complement component C6 isoform X7 (C6) 12. complement factor H (CFH) 13. connector enhancer of kinase suppressor of ras 2 isoform X2 (CNKSR2)14. CTP:phosphocholine cytidylyltransferase 15. DNA annealing helicase and endonuclease ZRANB3 (ZRANB3) 16. EPRSN1 17. fibrinogen alpha chain preproprotein, isoform alpha (FGA) 18. filamin 2 (FLN2) 19. Fras1-related extracellular matrix protein 2 (FREM2) 20. FYVE, RhoGEF and PH domain-containing protein 5 isoform X2 (FGD5)21. gelsolin isoform X3 (GSN) 22. glutamate receptor-interacting protein 1 isoform X7 (GRIP1)23. hCG1656772 24. histidine-rich glycoprotein isoform X1 (HRG) 25. interferon regulatory factor-2 binding protein 2B 26. junction-mediating and -regulatory protein isoform X2 (JMY) 27. KIAA0328 protein KIAA0328 28. la-related protein 1isoform X5 LARP1 29. MAX gene-associated protein isoform X11 (MGA) 30. paraoxanase-3 31. Platelet glycoprotein Ib alpha chain (GP1BA) 32. PMFBP1 protein (PMFBP1) 33. PRO2841 34. protein arginine N- methyltransferase 3 isoform X1 (PRMT3)35. Protein SCAF11 (SCAF11) 36. ral GTPase-activating protein subunit alpha-1 isoform X12 (RALGAPA1) 37. Receptor-type tyrosine-protein phosphatase C (PTPRC) 38. RGS3 isoform C2PA-RGS3 (RGS3) 39. Rho-GTPase activating protein 10 (ARHGAP10) 40. RNA-binding motif protein, Y chromosome, family 1 member B isoform X1 (RBMY1B)41. protein-methionine sulfoxide oxidase MICAL3 isoform X10 (MICAL3) 42. Protein sidekick-2 (SDK2) 43. sacsin isoform X3 (SACS) 44. SAPS domain family, member 2 (SAPS2) 45. serum aryldialkylphosphatase precursor 46. spermatogenesis-associated protein 31C1 isoform X1 (SPATA31C1) 47. synaptotagmin- like protein 2 isoform X10 (SYTL2)48. translation initiation factor (IF2) 49. triadin isoform X17 (TRDN) 50. uridine-cytidine kinase-like 1 isoform X7 (UCKL1) 51. utrophin isoform X4 (UTRN) 52. WD repeat-containing protein 64 isoform X2 (WDR64) 53. zinc finger and AT hook domain containing (ZFAT) - In one aspect, predicting lung function in an individual diagnosed with cystic fibrosis is disclosed. In certain aspects, the methods may include detecting expression of a one or more biomarkers selected from Table 3.
Table 3. Panel of protein biomarker covariates for algorithm that improve algorithm performance in FEV1 predictions over a period 4 months or more after biomarker collection.Protein name (gene name) 1. alpha 1 tvpeXXIV collagen precursor 2. alpha-fetoprotein enhancer binding protein 3. cell division cvcle 2-like 5 (cholinesterase-related cell division controller) (CDC2L5) 4. chromodomain-helicase-DNA-binding protein 6 isoform X3 (CHD6)5. chromosome 3 open reading frame 15 (C3orf15)6. cilia- and flagella-associated protein 91 isoform 37. CLIP-associating protein 2 isoform X24 (CLASP2)8. coiled-coil domain-containing protein 18 isoform X2 (CCDC18)9. collagen triple helix repeat-containing RP11-45B20.2 10. collagen, type XXIV, alpha 1 (COL24A1) 11. death inducer-obliterator-3 (DIDO3) 12. diacylglycerol kinase iota isoform X4 (DGKI) 13. DNA methyltransferase 1-associated protein 114. DNAH10 variant protein 15. E3 ubiquitin-protein ligase MIB2 isoform X5 (MIB2) 16. growth-inhibiting protein 24 (GIG24) 17. hemicentin 18. histone acetyltransferase MORF alpha 19. IF2 protein (IF2) 20. immunoglobulin lambda light chain VLJ region (IGL) 21. kinesin-like protein (KIF2) 22. kinesin-like protein KIF21A isoform X7 (KIF21A) 23. laminin subunit alha-2 isoform X3 (LAMA2) 24. LIM and calponin homology domains-containing protein 1 isoform X20 (LIMCH1)25. LIM and calponin homology domains-containing protein 1 isoform X22 (LIMCH1)26. lysine-specific demethylase 2B isoform X7 (KDM2B) 27. multiple endocrine neoplasia type 1 candidate protein number 18 (HSPF2)28. MYCBP-associated protein isoform X1 (MYCBPAP) 29. nebulin-related anchoring protein, isoform CRA_b 30. Non-canonical poly(A) RNA polymerase PAPD5 (PAPD5) 31. PAP associated domain containing protein 5 variant32. partitioning-defective 3-like protein splice variant c (PAR3L) 33. PF6 34. Pleckstrin homology-like domain family B member 2 (PHLDB2) 35. poly (ADP-ribose) glycohydrolase (PARG) 36. probable E3 ubiquitin-protein ligase HERC1 isoform X1 (HERC1) 37. probable E3 ubiquitin-protein ligase HERC1 isoform X11 (HERC1) 38. Protein AMBP (AMBP) 39. RUNDC1 protein (RUNDC1) 40. serine/threonine- protein phosphatase 4 regulatorysubunit 3A isoform 141. serine-protein kinase ATM isoform X5 (ATM) 42. SHMT2 protein (SHMT2) 43. smoothelin-B3 (SMTN) 44. somatostatin receptor interacting protein splice variant a (SSTRIP) 45. sperm-associated antigen 17 isoform X3 (SPAG17)46. T-cell lymphoma invasion and metastasis 1 (TIAM1) 47. terminal nucleotidyltransferase 4B isoform b 48. tetratricopeptide repeat protein 21A isoform X6 (TTC21A) 49. thrombospondin 1 (THBS1) 50. ubiquitin carboxyl- terminal hydrolase 40 isoform X1 (USP40)51. Voltage-dependent N-type calcium channel subunit alpha-1B (CACNA1B) 52. Zinc finger homeobox protein 4 (ZFHX4) - In one aspect, the method may comprise the step of determining an expression level of one or more, or two or more, or three or more, or four or more, or five or more, or six or more, or seven or more, or 8 or more, or 9 or more, or 10 or more, or 11 or more, or 12 or more, or 13 or more, or 14 or more, or 15 or more or 16 or more, or 17 or more, or 18 or more, or 19 or more, or 20 or more, or 21, or more, or 22 or more, or 23 or more, or 24 or more, or 25 or more, or 26 or more, or 27 or more, or 28 or more, or 29 or more, or 30 or more, or 31 or more, or 32 or more, or 33 or more, or 34 or more, or 35 or more, or 36 or more, or 37 or more, or 38 or more, or 39 or more, or 40 or more, or 41 or more, or 42 or more, or 43 or more, or 44 or more, or 45 or more, or 46 or more, or 47 or more, or 48 or more, or 49 or more, or 50 or more, or each protein (or corresponding expression of each protein) in the protein set, wherein said method is predictive of one or more clinical parameters in said individual. It is intended that detection of a protein or protein expression level may be carried out using any method known in the art or hereafter developed which allows a determination or estimation of the relative expression or amount of a given protein.
- In one aspect, the method may comprise the step of comparing said expression level to a control value to obtain a combined score and/or a risk probability score. A principle component or similar analysis that combines all the data from more than one or all of the markers may be used as well to generate a score. The combined score may be used to assess strength of association between the expression level of one or more of the aforementioned proteins, and the clinical parameter of interest. In one aspect, the clinical parameter may be lung function decline. The risk probability score may be used to predict the degree of risk that an individual will have or develop lung function changes or other clinical events that are of interest during the progression of cystic fibrosis.
- In one aspect, the one or more clinical parameters may be selected from FEV1, BMI, PE, number of hospitalizations, antibiotic status, infection status, and/or other clinical feature of the disease. These parameters may be selected using statistical methods described herein.
- In one aspect, the clinical parameter is lung function decline, wherein an individual classified as being high risk for rapid lung function decline is treated via more aggressive anti-inflammatory therapy and increased monitoring. It is well known that increased disease monitoring is associated with improved pulmonary status. Thus, those identified to be at risk for rapid decline would warrant more frequent clinical encounters to ensure that stability is maintained. In addition, those at risk of decline may have become colonized with new pathogenic bacteria. Identification of subjects at risk of pulmonary decline would trigger aggressive testing for new pathogens and treatment to stem pulmonary decline, for example, by administration of anti-bacterial agents that address the specific pathogenic bacteria in an individual.
- In one aspect, the sample may be blood, serum, urine, plasma, PBMCs, BALF, nasal and/or lower airway brushings, sputum, GI biopsies, lung explants, and combinations thereof. The sample may be obtained using routine methods known in the art. Multiple samples may be obtained over a period of time, for example, once every day, once every other day, once a week, once every two weeks, once every three weeks, once monthly, or once every two months, or once every three months, etc.
- In one aspect, the detection step is carried out using mass spectrometry. For example, electrospray/matrix-assisted laser desorption ionization mass spectrometry may be used, as described herein.
- In one aspect, the methods described herein may be carried out via the use of a computerized device. For example, one or more of the combined score or risk probability score may be calculated using a computer.
- In one aspect, the combined score and risk probability score may be used to create a predictive model within a web browser, the computer having a graphical user interface (GUI) in which an end user can interactively explore the predictive model within a web browser. In one aspect, the end user may be, for example, a physician, patient, or patient guardian. The end user may use the interface to interactively explore the predictive model within a web browser. In one aspect, the GUI may be called the Cystic Fibrosis Point of Personalized Detection (CFPOPD). Predictions may be generated on an individual basis, utilizing data from CF cohorts, such as the Cystic Fibrosis Foundation Patient Registry, and the user may select which patient for which the prediction model is graphically illustrated. Inputs include, but are not limited to, clinical and demographic characteristics, such as those from electronic health records, and large-scale data from proteomics.
- Measured and predicted lung function may be portrayed using three interactive graphs linked by a common timeline. FEV1, the FEV1 derivative, and the risk of rapid decline may all be displayed with corresponding shaded confidence bands. Additionally, the GUI may include patient-level and ecological descriptive variables as well as proteomic data that can be used to subset the pool of individual patients to select from, and the GUI may be expanded to include additional inputs. This may be used to facilitate, for example, the comparison of individually forecasted rapid lung function decline among individuals that are identical with respect to all model covariates expect for their sex. Both static and temporal covariates are displayed using graphical and text-based panels. An exemplary GUI prototype is currently available for public use at http://cfpopd.amazon-shiny.duckdns.org/ and a screenshot is contained in
FIG 13 . - In certain aspects, the methods may be used in conjunction with evaluation of a drug or treatment for cystic fibrosis. For example, a potential treatment may be administered to an individual in need thereof, and the disclosed methods may be carried out following administration of such drug or treatment.
- In certain aspects, the methods disclosed herein are used to assist a physician in the monitoring or treatment of lung function decline in an individual at risk for non-linear lung function decline. In this aspect, the method may comprise: determining a risk probability score based on one or more covariate associated with lung function in said individual, said covariate being selected from one or more of a clinical measure, a biomarker or an imaging marker that has been determined in said individual, according to the present disclosure. The risk probability score is used by the physician to characterize the individual as having no predicted lung impairment, mild predicted lung impairment, moderate predicted lung impairment, or severe predicted lung impairment and adapt the monitoring or treatment of the individual based on said characterization.
- In one aspect, a method for predicting evolution of a clinical parameter in an individual diagnosed with cystic fibrosis is disclosed. In this aspect, the method may comprise the steps of calculating a risk probability score from expression levels of a biomarker set comprising one or more biomarkers of Table 1; and classifying said individual into a high risk or low risk group based on the risk probability score; forecasting lung function trajectory based on said risk probability score. In certain aspects, the step may be performed on a computer. In one aspect, the clinical parameter may be lung function decline. In one aspect, the combined score may be based on at least two clinical measurements, or at least three clinical measurements, or at least four clinical measurements. The biomarker expression may be detected using methods known in the art, or using methods as set forth herein.
- In one aspect, a method for segregating severe and disease in an individual diagnosed with cystic fibrosis is disclosed. The method may comprise the steps of detecting and quantifying a biomarker set comprising one or more proteins of Table 1, wherein said detecting step is carried out by assaying a biological sample from said individual and a clinical parameter obtained from said individual; and classifying the individual into a high or low risk group based on the combined score. The steps may be performed on a computer. In one aspect, the clinical parameter may be forced expiratory volume (FEV1), and the method may be used to predict the risk of a rapid decline in FEV1 in a said individual.
- A marginal score may be used to classify an individual as a high risk or low risk individual for rapid lung function decline and the combined score may be used to perform feature selection wherein proteins are selected that correspond to said individual's risk of rapid lung function decline.
- Marginal Score (Risk of Rapid Decline as High or Low). In the first stage, Yij may be a random variable representing lung function for patient i at time tij ; i = 1 ... N; j = 1 ... ni . For illustration, time refers to age (in years), but may be defined using other measures, including but not limited to: time since first pulmonary function measurement, in years; time since first serum collection, in years. In applying the calculation, it may be assumed Yij is observed over one or more occasions, creating a random vector for each patient, represented as Yi. In observation, these data may be sparsely or irregularly collected for various reasons, at the discretion of the user. Using Equation 1 (from Yao, Muller and Wang (2005)), the collection of lung function trajectories across patients observed at different time points can be expressed as follows. In one aspect, Xi (Tij ) may be the longitudinal process of FEV1 for patient i at random time T ij, which is measured with error εij . This corresponds to the decomposition of longitudinal FEV1 of Equation (1):

where εij is residual error with mean zero and some variance σ 2; Xi (·), which is the function depicting the smooth, continuous longitudinal FEV1 profile for patient i, can be characterized, for example, using a cubic b-spline basis with knot locations as described by Szczesniak and others (2013). Applying the PACE approach (principal components analysis through conditional expectation) as described by Yao, Muller and Wang (2005) to the longitudinal FEV1 data outlined herein can be decomposed into functional principal component scores ξ i1, ..., ξiK , where each score is a univariate quantity representing the kth harmonic depicting the ith patient's continuous longitudinal FEV1 profile. These quantities correspond to said marginal scores and have been calculated previously for FEV1 data from the Cystic Fibrosis Foundation Patient Registry, and the resulting scores can be used to classify said individual as high risk or low risk for rapid decline (Szczesniak et al. 2017). Techniques for choosing the number of harmonics, K, include, but are not limited to: cross validation. - Combined Score (Feature Selection According to Expression Level of Protein and Risk of Rapid Decline). In one aspect, the 1st protein of the kth patient may be represented as Pli, and Pl may be the vector combining measurements of this protein across all patients. Similarly, the functional principal component scores (said marginal scores) for the kth component across all patients may be the vector ξk . ρkl may be the correlation coefficient representing the bivariate association between ξk and Pk . Methods to estimate ρkl include, but are not limited to, Spearman's rank correlation coefficient and Pearson's correlation coefficient, such application being readily understood by one of ordinary skill in the art. Said coefficient ρkl, with estimated value denoted as ρ̂kl, represents said combined score from this two-stage process for a given protein with the FEV1 trajectory. Implementation of the approach can proceed using R (R Foundation for Statistical Computing, Vienna, Austria).
- In one aspect, a risk probability score may be obtained using the following Equation (2):

- Obtaining said combined score may further include inputting data for one or more clinical parameters of the individual. The marginal and combined scores, further including the step of inputting data on one or more clinical parameters, can be derived from a two-stage process. Stage I. Let variables be defined as in
Stage 1. Additionally, let input data from one or more clinical parameters, such as observed body mass index percentile, be represented as Zij. The input will take the form of a vector if inputting data from one clinical parameter, and will take the form of a matrix with dimension N × C if there are c = 1,..., C clinical parameters. One or more covariates may be time-varying. Using technique and assumptions for mean-adjusted functional principal components analysis described by Jang and Wang, Equation (1) is expanded as Equation (2) above, where estimation can proceed as they describe based on Equation (2) above with stated changes to covariance accommodating Zit. Let ξikc be the functional principal component scores, where c denotes that these scores are covariate adjusted. Stage II. As described in Stage II, ρkcl is estimated for bivariate association of resulting covariate-adjusted functional principal component scores, in which bivariate association is estimated between vectors ξkc and Pl. Resulting estimate ρ̂kcl represents combined score for a given protein with the FEV1 trajectory, which further includes inputting data on one or more clinical parameters. - Obtaining a risk probability score may further include the step of inputting data for one or more clinical parameters of an individual.
- Modifying notation from Stage I, Yi may be realizations of a longitudinal patient-specific process other than FEV1, such as body mass index percentile. By Equation (1) and aforementioned approaches, this substitution yields principal component scores ξ i1o , . . ., ξiKo, where o indicates the given outcome process being analyzed as Yi. Stage II. Modifying notation from Stage II, ρklo may be the correlation coefficient representing the bivariate association between ξ ko and Pk . Using the method described in Stage II, coefficient ρklo, with estimated value denoted as ρ̂klo , represents said combined score from this two-stage process for a given protein with the outcome process noted as o.
- Additional clinical parameters as inputs. If using additional clinical inputs as described above (paragraph 0035) and letting Yi (t) be realizations of a longitudinal patient-specific process over time t other than FEV1, such as body mass index percentile, yields covariate-adjusted combined scores for a different clinical endpoint. Resulting estimate ρ̂klco represents combined score for a given protein with the outcome process noted as o, which further includes inputting data on one or more clinical parameters as covariates.
- Derivation of Risk Probability Score. Let Yij represent FEV1 for a given patient and time point. Assume that the longitudinal FEV1 process follows the Gaussian linear mixed model with non-stationary covariance as defined by Diggle, Sousa and Asar (2015). The prediction algorithm to obtain a risk probability score can be defined through the following sequence of equations:

- where fi (tij ) is the mean response function for the patient's longitudinal lung function process; Ui is a patient-specific random intercept term, allowing patient profiles to deviate randomly from one another; Wi (tij ) is a stochastic process characterizing the change in an individual's lung function process that cannot be explained by fi (tij ) alone; εij is residual error from the model. In the second part of the equation, g(tij ) is a nonparametric function representing a smooth, continuous-time process for lung function, which may be estimated using cubic b-splines; Pij is the covariate information on a single protein or set of proteins, corresponding to a vector or matrix, where T implies taking the transpose; β is the vector of parameter coefficients corresponding to associations between lung function and protein expression level(s). Assuming Wi (tij ) follows integrated Brownian motion, it follows that the derivative of this quantity in Equation (3) will yield Brownian motion, denoted Bi(tij ) for the ith subject and jth time point. Then, the risk probability score is defined as


- Quantifying Uncertainty of Risk Probability Score. Pointwise confidence intervals for the patient-specific risk probability score defined in Equation (5) can be derived as follows. Without loss of generality, assume this derivation is for a 95% pointwise confidence interval. Let µB
it and ∑ni denote the mean and variance for Bi (tij ) given Hi (t). We assume the mean µBit satisfies:
i denotes the vector
i . is the estimate of µBi , and ni is the sample size for ith patient. - For each patient i, let ∑̂ n
i . denote the estimation of ∑ ni from estimating parameters in the model from Equation (3) and taking derivatives of the relevant probability risk score quantities in Equation (4). The bootstrapping process to obtain a 95% confidence interval for risk probability is below. - (1) Sample B-independent samples, Y ni
1 , . . ., YniB from Nni (0, ∑ ni ), B = 1,...100, and define parameter
- (2) For each sample Yn
i b, calculate Pr*(Bi (tij )) using


- (3) Construct the 95% confidence interval for risk probability by

- In one aspect, the risk probability score may be calculated using an algorithm which further includes the step of inputting data from one or more clinical parameters of an individual.
- Derivation of Risk Probability Score. Additionally define Zit , wherein additional inputting data on clinical parameters, such as observed body mass index percentile, are represented as Zij. The input will take the form of a vector if inputting data from one clinical parameter, and will take the form of a matrix with dimension N × C if there are c = 1,..., C clinical parameters, and Zij may include covariates that are time-varying. To accommodate the additional inputs, Equation (3) can be expanded as:

where βZ is the parameter vector representing associations between each clinical input variable and the longitudinal lung function process. - It follows that the risk probability score can be modified to include covariate history by expanding Equation (4) as follows:

- Quantifying Uncertainty of Risk Probability Score. Boot-strapped estimates for covariate- adjusted risk probability scores can be computed as in Equation (5). In one aspect, the risk probability score may be performed for another clinical outcome.
- Modifying notation from above, let Yij be realizations of a longitudinal patient-specific process other than FEV1, such as body mass index percentile. By Equations (3) and (4) and approaches therein, the patient-specific risk probability score can be expressed as:

where elements correspond to the terms defined in Equation (4) but for a different outcome o than FEV1. Boot-strapped estimates for risk probability scores based on outcome o can be computed as in Equation (6). - Equation (8) and approaches herein can be adapted using the procedure set forth above to acquire covariate-adjusted estimates of risk probability for clinical outcome o.
- In one aspect, disclosed herein is a method for predicting and monitoring or treating an individual at risk for non-linear lung function decline. The method may comprise a) determining one or more covariates associated with lung function in said individual, said covariate being selected from one or more of a clinical measure, a biomarker or an imaging marker; and b) calculating a risk probability score based on said determining of one or more covariate, said risk probability score being used to characterize an individual as having no predicted lung impairment, mild predicted lung impairment, moderate predicted lung impairment, or severe predicted lung impairment. The method may further comprise c) treating said individual characterized as having mild predicted lung impairment, moderate predicted lung impairment, or severe predicted lung impairment with one or more of increased frequency of disease monitoring, increased frequency of infection monitoring, anti-inflammatory therapy, or combinations thereof.
- In one aspect, the risk probability score may comprise a risk probability of a clinical outcome selected from a decrease in forced expiratory volume in one second (FEV1), pulmonary exacerbation (PE) frequency, FEV1- indicated exacerbation signal (FIES), ventilation defect percent (VDP), abnormal lung heterogeneity in lung as measured via imaging, lung hyperinflation, and combinations thereof.
- In one aspect, the covariate may be a clinical measure selected from forced expiratory volume in one second (FEV1), body mass index percentile (BMI), pulmonary exacerbation (PE) frequency, historic lung function, ventilation defect percent (VDP), partial ventilation data, ventilation heterogeneity data, hyper-intensity data, FEV1- indicated exacerbation signal (FIES), and combinations thereof.
- In one aspect, the covariate may be a biomarker described in Table 1, Table 2, Table 3, or Table 4, said determining comprising determining an expression level of a protein described in Table 1, Table 2, Table 3, or Table 4.
- In one aspect, the covariate may be an imaging marker, said imaging marker including but not limited to VDP, lung heterogeneity, lung hyperinflation, CT, or the like.
- In one aspect, the imaging marker may be a functional lung measurement, a structural lung measurement, or combinations thereof.
- In one aspect, the imaging marker may be obtained by an imaging method.
- In one aspect, the image technique may be selected from hyperpolarized (HP) 129Xe, Ultra-short Echo-time (UTE) Magnetic resonance imaging (MRI), computed tomography (CT), and combinations thereof.
- In one aspect, the imaging marker may be structural remodeling of the lung.
- In one aspect, the imaging marker may be bronchiectasis.
- In one aspect, the predicted lung impairment may be non-linear decline in one or more parameters selected from Ventilation Defect Percentage (VDP), FEV1, partial ventilation, ventilation heterogeneity, ventilation hyper-intensity or a combination thereof.
- In one aspect, the individual may have normal FEV1 at the time of said determining and said calculating.
- In one aspect, the risk probability score may predict the probability of lung function decline over a period selected from three weeks to four months, or six months, or twelve months.
- In one aspect, rapid (non-linear) lung function decline may be defined as a rate of change in longitudinal FEV1 that falls below 1.5% predicted/year.
- In one aspect, non-linear lung function decline may be defined by the FEV1-indicated exacerbation signal (FIES) score.
- In one aspect, the one or more covariates may comprise a time-varying covariate.
- In one aspect, the time-varying covariate may comprise infections with Pa, MRSA, CF-related diabetes and use of state insurance as a marker of socioeconomic status.
- In one aspect, the biomarker may be one or more biomarkers selected from Table 1.
- In one aspect, the biomarker may be one or more biomarkers selected from Table 2.
- In one aspect, the biomarker may be one or more biomarkers selected from Table 3.
- In one aspect, the biomarker may be one or more biomarkers selected from Table 4.
- In one aspect, the individual may be diagnosed with cystic fibrosis (CF).
- In one aspect, the individual may be diagnosed with cystic fibrosis (CF) and has a normal forced expiratory volume in one second (FEV1) as measured by spirometry.
- In one aspect, the individual may be a pediatric patient having cystic fibrosis (CF).
- In one aspect, the individual may be a patient under the age of 13 years of age and having cystic fibrosis (CF).
- In one aspect, the method may forecast lung function trajectory for a period of about three weeks to about six months, or about six months to about twelve months.
- In one aspect, the method may further comprise applying a statistical algorithm to estimate correlation between a covariate value and predicted lung function.
- In one aspect, the method may be carried out via a computer system, and wherein said method comprises capturing and displaying information related to said characterization of said individual using a graphical user interface (GUI).
- In one aspect, the method may further comprise assessing a variable selected from one or more of sex, body mass index (BMI), pulmonary exacerbation (PE), number of hospitalizations, antibiotic status, infection status, and combinations thereof, in said individual.
- In one aspect, the lung function decline may be defined by one or more of absolute change in FEV1, rate of decline, risk of rapid decline, FIES.
- The following non-limiting examples are provided to further illustrate embodiments of the invention disclosed herein. It should be appreciated by those of skill in the art that the techniques disclosed in the examples that follow represent approaches that have been found to function well in the practice of the invention, and thus can be considered to constitute examples of modes for its practice. However, those of skill in the art should, in light of the present disclosure, appreciate that many changes can be made in the specific embodiments that are disclosed and still obtain a like or similar result without departing from the spirit and scope of the invention.
- Applicant analyzed serum samples from CF patients with severe (n=44) or mild (n=44) lung disease. Serum protein was purified via gel separation and liquid chromatography. Protein isoforms were identified using a cut off of at least 100 mass signatures per protein, coverage ranging from between about 15 and 100%. A combination of gel-based and MS-based label free quantitation was used to quantify the proteins. Pathways including the dataset members were analyzed.
- In an exhaustive analysis of 61,942 serum protein isoforms, Applicant discovered a number of novel markers of CF lung disease severity and inflammation and found that combining their measurement (either grouped or individually depending on the marker) with Functional Data (FD) Analysis of FEV1 can predict lung function decline by 6-18 months in advance. Applicant hypothesized that characterization of blood protein expression and modification in longitudinal samples integrated with monitoring of FEV1 changes over time and through FD analysis can provide a sensitive and specific algorithm that predicts risk of CF lung disease progression which can be used to inform therapeutic intervention. Applicant has developed a novel statistical model to predict FEV1 decline that have now been modified to include the novel biomarkers, and which can be adapted to include use of other clinical parameters besides FEV1 to predict disease progression.
- In particular, Applicant has identified and validated serum proteome changes in banked samples collected from patients with stable and declining FEV1, developed a dynamic prediction model by integrating analyses of validated proteomic data with Functional Data (FD) analysis of longitudinal FEV1 data to produce a novel diagnostic algorithm that identifies individuals at risk of lung function decline, and has evaluated the capacity of dynamic prediction modeling to identify CF patients who develop rapid pulmonary decline during adolescence in banked patient samples, testing the performance of the markers in banked samples from the EPIC study. Applicant's studies have the potential to fundamentally shift the nature of CF care from an evidence-based model of care decisions to individual patient-based care decisions informed through a predictive molecular and lung function disease platform and/or other clinical parameters. The disclosed algorithms of predictive biomarkers may be used to inform therapy choices and significantly improve CF care.
- Proteomic studies may be conducted with LC MS/MS tandem mass spectrometric examination of patient serum. Each sample may be split into 3 fractions which can be analyzed by MS for 15 hours (including 3 technical replicates, 3 quality controls, and 2 wash runs preventing carry over). This allows deep screens to be conducted that capture information on approximately 7,000-10,000 protein isoforms and modification per sample with high confidence and accuracy and allows capture of low-level proteins where differences are more often found when comparing disease severity cohorts. These analyses are far more rigorous than the usual "service center" analysis, generating approximately 7-10 times more data. This increased data collection also increases the time for analysis (-10 fold) but provides rigor for detection of useful biomarkers and decreases false discovery rates, markedly increasing chances of success. For Functional Data (FD) and Functional Principle Component (FPC) analyses of FEV1, Applicant's preliminary analyses build upon FD analysis and longitudinal models that have been applied to the CF Foundation Patient Registry (CFF-PR). Further analyses of the available cohort data at hand, providing strong evidence of associations and feasibility. The modeling disclosed herein blends established biostatistical approaches with modern FD approaches to characterize the nonlinear FEV1 trajectory of individual patients and predicts subsequent decline. The disclosed methods may be used for in-clinic applications for decision aids for pre-clinic planning and at the time of patient encounters. Marker data correlation with FEV1 was measured in multiple simulations and by appropriate statistical tests as described.
- As noted above, three measures are generally used in monitoring CF disease progression and response to therapy: FEV1, PE frequency, and BMI. Although these measures (particularly) lung function (FEV1), have demonstrated steady improvement over the past two decades, a rapid deterioration of lung function persists, especially during adolescence (
FIG. 3 ). See also https://cff.org/Research/Researcher-Resources/Patient-Registry/2019-Patient-Registry-Annual-Data-Report.pdf. While there are several potential interpretations for this observation, without intending to be limited by theory, it is believed that systemic changes reflected in the blood culminate in measurable pulmonary decline during this period (10-19 years of age). - Care for CF patients has advanced rapidly over the past two decades, with an unprecedented increase in patient longevity and quality of life. The reasons for these improvements include: a robust CFF-PR that collects data from nearly all CF patients in the US, allowing assessment of outcomes and treatment responses; standardization of care & therapies; and dramatic advances in new CF therapeutics, especially genotype-specific CFTR modulators such as KALYDECO® (4) and, to a lesser extent, ORKAMBI® (5), and more recently TRIKAFTA® (6). These advancements have increased the median survival of CF patients to 41 years (CFF-PR - 2014), and > 50% of CF patients alive today are adults. In many respects, research and care to improve CF patient outcomes has become the model for other rare diseases.
- Applicant modified proteomic approaches (7-17) to examine serum from CF patients with mild or severe lung disease (13). Based on the experience of others in the cancer and cardiovascular fields, where conventional "shotgun" proteomics (which identifies 500-1000 proteins per sample) failed to distinguish disease severity in cohorts exhibiting the same disease, Applicant hypothesized that deeper screens would be necessary for CF studies. A proteomic analysis protocol was developed, involving multidimensional separation of proteins by abundant protein-adsorption columns and gel and column chromatography. This approach generated multiple fractions from each sample that were subjected to 15 hours of mass spectrometric analysis.
- The following is a description of an exemplary proteomic analysis of CF patient serum. The approach may be applied to the analysis of any biological sample, for example, plasma, urine, cells, and other tissues. The methodology involves novel modifications of previously described approaches (Ziady AG, Sokolow A, Shank S, Corey D, Myers R, Plafker S, Kelley TJ. Interaction with CREB binding protein modulates the activities of Nrf2 and NF-kappaB in cystic fibrosis airway epithelial cells. Am.J.Physiol Lung ; Chen J, Kinter M, Shank S, Cotton C, Kelley TJ, Ziady AG. Dysfunction of Nrf-2 in CF epithelia leads to excess intracellular H2O2 and inflammatory cytokine production. PLoS.One. 2008;3(10):e3367; Ziady AG, Kinter M. Protein sequencing with tandem mass spectrometry. Methods Mol.Biol. 2009;544:325-41). Biological fluid or tissue lysate can be adsorbed for albumin or other highly expressed proteins using absorption columns. Protein may be precipitated from eluate or lysate with acetone (equilibrated to 90% acetone), dried, and rehydrated at a concentration of 5 mg/ml in 8 M urea, 2% CHAPS, 50 mM DTT in water. Greater than 45 ug of protein for a sample is generally subjected to SDS-PAGE, excised gel fragments containing all the protein from the sample are reduced and alkylated (to achieve more fractionation more gel fragments are cut), and subjected to in-gel tryptic digestion (20 ug/ml), and protein peptides are extracted for LC MS-MS. Extracts were acidified by equilibration in 0.1%-1% acid (e.g. acetic or formic acids), loaded onto a fractionation column (e.g. Thermo Fisher Scientific Acclaim PepMap C18 column) at a flowrate of 0.15-0.5 ul / min, and subjected to nanospray tandem mass spectrometry with a mass spectrometer (e.g. Thermo Fisher Scientific LTQ Velos Pro spectrometer). Analysis in conducted in data-dependent mode capturing the 3-12 most abundant parent ions from full MS scans for fragmentation by collision induced dissociation (CID). Each gel fragment is run 3-9 times, and the data files from all runs are pooled for database analyses. In addition to multiple fractionation steps mass tolerance of 0.1-2.0 Da is used for parent ions and 0.01-0.7 Da for fragment ions to enhance the ability to quantitate low level proteins. Identified protein isoforms using 2-100% coverage cut off with >2 mass signatures per protein.
- The EPIC Observational study includes >1,000 patients with annual blood samples for >10 years linked to the CFF-PR. 44 mild (FEV1 >85th percentile among CF patients) and 44 severe (<45th percentile) patient cohorts were matched based on age, gender, genotype, and P. aeruginosa infection status, then randomized and blinded before proteomic analysis. Applicant identified a total of 61,942 protein isoforms expressed across both cohorts, with 4751 proteins identified in at least half the subjects of each cohort. Data were normalized to a relative abundance (RA) measure (0 to 1) for each sample. For each isoform, RA was summarized (mean RA, number with RA > 0, ratio of RA mild/severe) and, to reduce the data, a battery of paired statistical tests was performed on the matched samples: McNemar's, Wilcoxon Signed-Rank, paired Student's t test, and permutation of the difference.
- In addition, a two-fold approach was used to identify protein isoforms as candidates for improved prediction of FEV1. Functional principal components (FPC) scores were correlated with each protein expression level as described in [0049], measured using correlation coefficient ρ̂kcl .In addition, these isoforms were included as covariates in one-at-a-time modeling of Equation (3) described in [0049]. These analyses generated the newly discovered 44 isoforms above which are the first serum biomarkers of CF disease severity identified by nonbiased analysis and are the basis for developing a lung function decline prediction model. Furthermore, the protein isoforms identified are baseline biomarkers of disease that segregate with disease severity when patient are stable. This is far more advantageous than presently available biomarkers such as C-reactive protein, which are only useful during acute exacerbation (20-24). The initial twenty biomarkers identified exhibited areas under the curve (AUC) of 0.69 or higher. These AUC values indicate that the biomarkers are superior to presently available markers of disease (21-24). Many of the biomarkers have either physiological or biological connections to CF (
Fig. 4 ). For example, tight junction protein (TJP) 3 contains a PDZ motif and is a member of a family of proteins that interact with CFTR (25). Increases in serum IgG Kappa light chain levels are associated with chronic inflammation (26). Alpha-1-acid glycoprotein 2 is one of 4 biomarkers used to predict inflammation and mortality beyond CF (27), and transthyretin has been shown to be significantly decreased in CF patients compared to non-CF (28). Excessive inflammatory signaling in CF and an increase in patients with severe disease would be expected and is suggested by nonbiased biomarker identification. - CF lung disease demonstrates a steady decline that typically manifests during adolescence and young adulthood (29); however, rapid decline, characterized by accelerated loss of lung function relative to center-specific and/or population norms, is a ubiquitous event in the lives of patients (
FIG. 1 ). Identifying when patients are at highest risk for rapid lung function decline is a significant gap in CF research, and offers the opportunity to intervene prior to irreversible lung damage. A key contributor to this gap has been the paucity of individualized predictive data on the specific timing and severity of lung function decline, and this is sustained by continued reliance on linear statistical approaches to fit nonlinear lung function decline (30). Moreover, phenotypes of patients at risk for rapid decline have not been well defined due to the analytically complex progression of CF (31). - In contrast to historical approaches, Applicant's biostatistical research on CF lung disease progression has been based on nonlinear longitudinal data analysis methodology and implementation in CF clinical/translational research. Applicant's approach fuses longitudinal data analysis together with FD analysis (32), a branch of statistics that offers tools to characterize nonlinear phenomena. FD analysis sheds light on complex pathophysiological relationships in different disease states, such as sleep disorders (33) and Alzheimer's disease (34).
- Applicant has used the CFF-PR to demonstrate that FD analysis predicts CF lung-function decline with improved accuracy compared to traditional linear approaches (35) and can be used to identify phenotypes of rapid decline. Historically, CF registries (such as the CFF-PR) have carefully maintained lung function data to track disease, but have not utilized data for prognostic care (36). The disclosed dynamic prediction models using FD analysis have leveraged this rich longitudinal data to develop more accurate tools that predict disease course and in turn help prioritize interventions for the individual patient (
FIG.5 ). The disclosed methods meaningfully contribute to CF precision medicine, an area that has been noticeably understudied (37). - Major advancements in personalized medicine in CF may change the clinical course of the disease (38). Applicant has successfully used FD analysis to characterize nonlinear population-level lung function decline of cystic fibrosis patients in the US. Applicant's CFF-PR study of over 30,000 patients and 500,000 FEV1% measurements utilized longitudinal FD methods to address nonlinearity and serial correlation (35). Applicant estimated degree (velocity) and timing of rapid decline by taking derivatives in Applicant's model and traditional models. The covariance structure included exponential decay and random intercepts. The FD model was superior, compared to traditional models, in terms of estimating the onset and severity of rapid FEV1% decline and model validity (
FIG. 5 ). Applicant's results indicate that nonlinear, heterogeneous lung disease progression prevails, and the ability of FD models to establish CF phenotypes predictive of rapid decline. - Applicant has further identified FEV1 phenotypes corresponding to early, middle and late rapid decline in patients 6-21 years of age. Using the CFF-PR data, modes of variation in FEV1 progression are characterized as functional principal components (39). The majority of variation (first functional principal component: 94%) among patient profiles are characterized by differences in mean longitudinal FEV1 trajectories. Average degree of rapid decline was similar among phenotypes (roughly -3% predicted/year); however, average timing differed, with early, middle and late phenotypes experiencing rapid decline at 12.9, 16.3 and 18.5 years of age, respectively. Individuals with the late phenotype had the highest initial FEV1 but experienced the greatest loss of lung function.
- FEV1 variation coupled with nonlinear progression over age produces an uneven, "saw-tooth" shape for each individual's trajectory (see
FIG. 1 ), making it difficult to model the time-course of a patient's underlying lung function and utilize it for earlier detection and intervention. To further improve the predictive accuracy of rapid decline, Applicant utilized FD analysis to develop a dynamic prediction model of CF progression that accounts for the variation in FEV1. To leverage existing data for individual patient prediction, a dynamic prediction model recently proposed by Diggle et al (40) was expanded to accommodate the jagged, nonlinear shape of FEV1 trajectories using CFF-PR data on 27,296 patients > 6 years who each had 1 to 89 FEV1 measurements. Covariates in the model were birth cohort, copies of delF508, baseline FEV1, and male gender. Time-varying covariates included infections with Pa, MRSA, CF-related diabetes and use of state insurance as a marker of socioeconomic status. Interactions between each of these covariates with time were examined. To account for irregular follow up and occurrence of PEs, rolling, time-varying covariates were included for the numbers of follow up visits and PEs within the last year. Although these covariates are not commonly used in the literature, their inclusion improved predictive performance of the model based on residual analyses. All covariates were statistically significant (P<0.05) with the exception of state insurance (P=0.07). - Applicant evaluated predictive ability of the proposed stochastic model using a preliminary sample size of 36 subjects with available data on proteomic markers. These subjects contributed a total of 1975 FEV1 longitudinal observations. The subjects were randomly split, with 80% contributing measurements to the training dataset for model building, and 20% providing data for the validation step. Using the training dataset, a model that included terms to model nonlinear progression of FEV1 over age (cubic b-splines), a severity indicator established by the EPIC study (binary variable) was used; also included were terms for the markers and their interaction with age. Severe classification met statistical significance (P<0.05).
- Predictive accuracy, measured using Akaike information criterion (AIC), was superior in this model compared to a model that excluded the proteomic marker terms. Validation metrics that were assessed in the test cohort included mean absolute deviation (MAD), root mean-square error (RMSE), mean absolute percentage error (MAPE) and correlation between predicted values and observed values. Based on the FEV1 scale, validation metrics showed relatively small prediction error. MAPE, which measures forecast accuracy as percent difference between actual FEV1 and predicted FEV1, shows that there is relatively small error between projected and actual FEV1 values. Correlation between observed and predicted values is excellent (above 0.80) and is significantly higher than presently available measures (range from 0.54-.0.71).
- Applicant also assessed the predictive value of proteomic markers using FD and dynamic prediction as described above. A number of the biomarkers were included as covariates and their interaction with age in the Reduced Model. Other covariates included in the model were age-specific components to fit the FEV1 trajectory, as shown in the FD analysis in previous studies, and the Mild/Severe designation from Applicant's original study. The model showed that proteomic markers were significantly associated with mean FEV1 (coefficient: - 8.03, SE: 4.07, z=-2.0, P=0.04) and approached significance in their association with FEV1 decline (coefficient for interaction: 1.03, SE: 0.79, z=1.3, P=0.19).
- Serum proteome changes in banked samples collected from patients with stable and declining FEV1 can be validated as follows. Preliminary studies generated serum biomarkers that segregate CF disease severity during periods of disease stability. Conduct of longitudinal analyses to validate the predictive power of biomarkers in samples from the EPIC CF cohort may provide the confidence for future modeling. Proteomic discovery studies in 88 cross sectional samples identified 20 biomarker changes that segregated CF patient lung disease severity in adolescence. Data collected from proteomic screens can benefit statistical models of lung function decline. To determine the utility of the molecular markers, top 20 molecular biomarkers were examined for their ability to enhance lung function decline modeling. Initial studies are cross sectional and conducted in discovery mode. Multiple (>10) simulations of functional principle component (FPCA) analyses of FEV1 including data for each of the top 20 markers showed significant correlations between the behavior of novel markers and FEV1 decline (
FIG. 6 ). - The discovery cross sectional data was collected by high throughput discovery mode MS analysis. Data from both targeted MS and ELISA may be integrated with FD analysis, either in combination or separately. Biomarkers discovered in preliminary cross-sectional studies for prediction of future FEV1 decline, may be validated using targeted proteomics and ELISA analyses of banked serum samples from the EPIC Observational study.
- Samples. Analysis of samples from EPIC can be used to evaluate the predictive capacity of the biomarkers 1-5 years in advance of cohort segregation by FEV1. These can be compared with additional candidate biomarkers, and secondary analyses can be used to examine relationships to established predictors of disease severity, including PEs, BMI, and microbiology. The choice of the EPIC samples may be based on the availability of longitudinal samples for patients that cover the age range where significant lung-function decline is observed (e.g., early teen years). The longitudinal proteomic profiles can be categorized for subjects already profiled at 'baseline' or time zero. This will determine if the baseline protein markers are able to predict subsequent disease progression. Preliminary data using FEV1 alone shows a fairly even distribution of different phenotypes to examine: stable high (n=16) and stable low (n=13) (total stable, n=29) and rapid lung-function decline among 'mild' lung disease subjects at baseline (n=10) and in those with more severe disease at baseline (n=12) (total 'decliners', n=22). The remaining patients (29 of the original 88) may be used to supplement the 'extreme phenotype' data and provide information on proteomic profiles across the continuum of clinical presentation.
- Mass spectrometry. Applicant has developed useful mass spectrometry-based approaches for the identification/quantitation of thousands of proteins in serum samples. Protein is prepared from serum using albumin adsorption columns and gel and column chromatography, followed by tryptic digestion. Following preparation of whole-serum protein, serum-protein peptides are extracted and subjected to data-dependent sequencing and mass spectrometry analysis, as previously described (33-33;35;37-41;42). Briefly, the samples are loaded in a HPLC system autosampler and eluted by reverse-phase chromatography into a mass spectrometer fitted with a nanospray ion source for analysis. The mass analyzer is set up for a data-dependent mode using dynamic exclusion settings: repeat count = 1; repeat duration = 0.5 minutes; exclusion list size = 50; exclusion duration = 1.5 minutes; exclusion mass width = 1.5 amu. Collision-induced dissociation (CID) is used to fragment peptides, and CID spectra are searched against a human fasta database using Proteome Discoverer™ software. A decoy database is used to control for false discovery. A threshold filter of >2.0 for peptide XCorr score is used for sequence identification. For preliminary studies, this produced a range of coverage for identified proteins of 5.15% - 79.91% and an average of 10.03 % for all proteins identified. This high stringency filter of data provides more reliable quantitation, and aids the reduction of data in follow-up statistical analyses.
- Given the emphasis on early detection of rapid disease progression from the CF community, the availability of extensive demographic, clinical, molecular and environmental measurements from the EPIC data augmenting the CFF-PR, and the emergence of promising methodologic approaches for analysis, the disclosed methods allow for improved dynamic prediction models of rapid decline through integration of validated proteomic markers. Rosenfeld and colleagues (47) have utilized part of the EPIC cohort (n=946 patients who were Pa-negative at enrollment) to study associations between data collected in the year after the first pulmonary function test (PFT) and subsequent rate of FEV1 decline (mean ± SD follow up: 6.2±1.3 years). Through multivariable linear modeling of age-related FEV1 progression with generalized estimating equations, they confirmed established risk factors for decline (e.g., female gender) and identified a new risk factor (S. maltophilia). Although this was a relatively young cohort (mean ± SD age at entry: 7.9±2.0 years) with mild CF disease, they observed a similar "ceiling" effect to what was originally described by Konstan and colleagues and previously found by Applicant.
- Modes of variation in FEV1 decline for the 88 EPIC subjects (44 Mild, 44 Severe, described above) with longitudinal PFT and cross-sectional proteomic data were examined using functional principal components, the FD analysis technique to the CFF-PR, in order to characterize rapid decline during adolescence and adulthood. Median (IQR) age at entry was 12.5 (9.8-15.3) years; follow-up ranged from 20 to 216 PFTs per patient. Individual smooth curves from the FD analysis had substantial variation between patients and within an individual patient over time (
FIG. 7 ). The first functional principal component explained 85.3% of the variation in FEV1, suggesting that the individual trajectories were similar to the overall mean curve but shifted according to initial FEV1. The four subsequently ordered functional principal components, which reflect higher-order modes of oscillatory variation, explained 8.1%, 3.7%, 1.8% and 1.0%, respectively. - Rapid decline was observed in different periods of age for the majority of individuals in the cohort. Most rapid decline during the observation period occurred, on average, at 15.5±2.3 years of age, with decline of 3.9 + 4.2% predicted/year. To understand how rapid decline in this cohort is related to proteomic markers, the association between each FD parameter and marker of interest was estimated using Spearman's r. To adjust for multiplicity in this preliminary analysis, associations with P<0.01 were considered statistically significant. Several associations were found between proteomic markers and the first functional principal component for FEV1 (lower values of this component correspond to milder disease); several markers including
glutamate receptor 2isoform 4, alpha-1-acid glycoprotein 2 precursor, immunoglobulin alpha-1 heavy chain constant region, anti-Entamoeba histolytica immunoglobulin kappa light chain, anti-HBsAg immunoglobulin Fab kappa chain, AT-rich interactive domain-containing protein 4A isoform I, and uridine-cytidine kinase-like 1isoform 2 were positively associated (range of r: 0.37 to 0.69); additional markers including unconventional myosin-XVIIIa isoform X1,chromosome 12OPR 42, isoform CRA c, andKeratin 18 were negatively associated (range of r: -0.73 to -0.54). Degree of rapid decline was negatively associated with markersA-kinase anchor protein 3 and Keratin 18 (r: -0.76 and - 0.72, respectively). Patients who experienced rapid decline at a younger age tended to have elevated levels of markers alpha-1-acid glycoprotein 2 precursor, anti-Entamoeba histolytica immunoglobulin kappa light chain, and anti-HBsAg immunoglobulin Fab kappa chain, corresponding to negative associations (range of r: -0.55 to -0.43), and lower levels ofchromosome 12open reading frame 42, isoform CRA c (r: 0.55) (seeFIG. 6 ). - The disclosed dynamic prediction model uses patient-specific information from the EPIC cohort while incorporating parameter estimates from Applicant's recent large-scale CFF-PR study to predict the onset of rapid decline. The model takes into account observed lung function for the patient at each time point, the mean FEV1 evolution for each patient, and encompasses covariates with corresponding association parameters. Normal distribution of the data provides patient-specific heterogeneity between FEV1 trajectories. Furthermore, a stochastic process is used to reflect the "saw tooth" variation over time for individual patients (see
FIG. 1 ); integrated Brownian motion is used to depict this process. Normally distributed measurement error from the PFT is accounted for. Finally, data for the level of markers is added to the model. The covariance functions and estimation algorithm have been described previously (40). The model for the CFF-PR is implemented using the lmenssp package (48) in R (R Foundation for Statistical Computing, Vienna, Austria). The covariates that considered from the CFF-PR may be expanded to include additional factors available from the EPIC study. Candidate molecular markers can be directly added as covariates, and the association parameters can be denoted to fit the model on smaller data. If marker data were available from all CFF-PR subjects, this new model could be called the "Full Model". A so-called "Reduced Model" can be fit using detailed data from the EPIC cohort. - A novel semiparametric "big data" calibration approach (49) may be adapted to examine predictive value of the markers. The approach can be geometrically described (
FIG. 8 ). The algorithm may be programmed using R. Briefly, constrained maximum likelihood estimation may be implemented to fit the Reduced Model described above while accounting for the parameter estimates found from the External Model on the CFF-PR. This estimation, as shown by Chatterjee, produces unbiased estimates with lower standard errors for the Full Model, compared to fitting the Reduced Model alone. The calibrated estimates may be used to determine whether the addition of molecular markers and other EPIC covariates improve prediction of rapid decline. Improved prediction may be assessed by 1) examining the interaction of a given biomarker with age in the Reduced Model; 2) using model diagnostics; 3) fit statistics (e.g., AIC, BIC); 4) the likelihood ratio test to model; an example of the risk function for a patient is inFIG 9 . To validate predictive accuracy, analysis with 20% of the EPIC cohort removed from the modeling may be performed. This subset of the cohort will have covariate data added to the model to check predictive accuracy; metrics here may include mean absolute deviation (MAD) and mean square error (MSE), which have been previously used by Applicant with good success (35). - The predictive value of a subset of proteomic markers is assessed based on the Reduced Model using FD and dynamic prediction as described above. Applicant included the protein similar to
dual specificity phosphatase 9, partial as a covariate and its interaction with age in the Reduced Model. Other covariates included in the model were age-specific components to fit the FEV1 trajectory, as shown in the FD analysis in previous studies, and the mild/severe designation from the original study. The proteomic marker was available on 36 EPIC subjects (23 Mild, 13 Severe); these subjects were 6.3 (6.6-7.7) years of age with FEV1 of 95.5 (61-138) %predicted. The median (range) number of PFTs (per subject was 54 (20-93); per-subject follow-up was 11.5 (9.4-12) years. The model showed the proteomic marker was significantly associated with mean FEV1 (coefficient: -8.03, SE: 4.07, z=-2.0, P=0.04) and approached significance in its association with FEV1 decline (coefficient for interaction: 1.03, SE: 0.79, z=1.3, P=0.19). These results suggest that the biomarker has a negative association with overall mean FEV1 but may have a positive effect on rate of FEV1 decline. - Covariate selection may also be performed using Bayesian Ensemble Trees (BET) (50). BET was developed by Applicant as an approach to perform variable selection for modeling FEV1 decline. This approach utilizes the ensemble of classification and regression trees (CART). Each constituent tree is estimated with a subset of similar data, and can be used for covariate selection and imputation of missing data (51). The form of each marker covariate will be modified to examine potential lagged effects on FEV1 decline. For select markers, associations with FEV1 decline can be simultaneously examined using joint models for high-dimensional data (52). To investigate the impact of the collection of markers on rapid decline, PCA may be used to develop composite score(s); the score data may then be included in the model as covariate(s). Alternatively, BET may be used to create step functions representing rapid decline. The step functions can be subsequently smoothed to represent rate of FEV1 decline and construct individual probabilities of rapid decline similar to the dynamic prediction model or risk scores for rapid decline.
- Four Bayesian penalized regression approaches for the previously described Gaussian linear mixed effects model with non-stationary covariance to account for the complicated structure of longitudinal lung-function data while simultaneously estimating unknown parameters and selecting protein isoforms to improve the prediction model. These penalized regression models induce variable selection by shrinking the coefficient of irrelevant variables toward zero while simultaneously keeping the relevant variables in the final model. Different types of shrinkage priors are considered and evaluated to induce variable selection in a fully Bayesian framework.
- Model setup: The main form of the Bayesian penalized regression model implemented for the non-stationary Gaussian linear mixed effect model can be written as:

where Yij is lung function measurement for subject i at time point tij, i = 1, ..., N; j = 1, ... , ni ; k = 1, ..., p. The βk 's are the coefficients of the proteomic biomarkers that we want to shrink towards zero to induce simultaneous variable selection and Xik is the covariate matrix for the proteomic biomarkers. Between-patient heterogeneity is incorporated in the model with a random intercept term Ui , where Ui∼N(0, ω 2). The term Wi (tij ) denotes realizations from the zero-mean, continuous-time integrated Brownian motion process, and Zij∼N(0, τ 2) represents iid measurement error. This model can be written as, Yi~MVN(ψiα + Xi β, Vi(φ)), where Vi (φ) = ω2Ji + σ2Ri + τ2Ii, and it is reparametrized as Vi ((φ) = τ 2(φ 1 Ji + φ 2 Ri + Ii ) where Ji is nixni matrix of ones, Ii is nixni identity matrix, and Ri is nixni matrix with (j, k) th element is,
- Bayesian Least Absolute Shrinkage Selection Operator (lasso): Preferable when the goal is obtaining a sparse set of potential predictive proteomic biomarkers. λ is the penalty parameter which controls the amount of penalty being applied to the coefficients of predictors (proteomic biomarkers) to force them near zero. The following prior distributions are assumed:

- Bayesian Adaptive Lasso: Similar to the Bayesian Lasso described above but assigns different amount of penalty to different coefficients based on their importance.
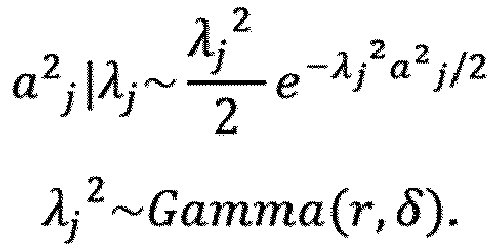
- Bayesian Ridge Regression: Bayesian ridge regression is more preferable when the predictors are highly correlated. When there exists multicollinearity between predictors, the ridge regression deals with collinearity and applies continuous shrinkage and improves prediction performance through a bias-variance trade-off.

- Bayesian Elastic-Net: This method merges the features of both the lasso and the ridge and takes into account both sparsity and correlation structure of the data. Hence, the elastic net simultaneously induces variable selection by forcing the coefficients of redundant variables toward zero and selection of groups of correlated covariates and handles with multicollinear predictors.

- Further, assigned are non-informative uniform prior for α 0 and α 1, flat uniform priors for φ 1 and φ 2, non-informative scale invariant prior

- Given the priors and the data likelihood, the posterior distributions of all unknown parameters are obtained by using Bayes' theorem. Unknown parameters and hyper-parameters of each model are estimated by sampling from their conditional posterior distributions through MCMC algorithm. Each MCMC algorithm is creating code in R software.
- The need for analysis of samples collected from subject undergoing modulator therapy is critical, as CFTR modulation has become the standard of care, and this will likely influence the behavior of molecular markers.
- A number of interventional therapies are used to stave off lung function decline in patients with cystic fibrosis, including antibiotics, anti-inflammatory therapies, hypertonic saline to increase clearance, and others. The largest challenge in CF care is projecting lung function performance and intervening accordingly. Currently, intervention occurs when clear declines in lung function as measured by FEV1 and other lagging indicators are observed. The approach of intervening once lung function has already declined rarely restores lost lung function; therefore, intervening before lung function decline occurs can be beneficial by preventing decline. An example that captures the range of the performance of some of the markers in Table 1 at improving the prediction of lung function is shown in
FIG 11 . - Tandem mass spectrometry or ELISA may be used to measure the levels of Ig lambda and Ig kappa chains in collections of blood from a CF patient during their regular hospital visits. The levels of these proteins would be inserted into the algorithm described herein along with the measurements of FEV1 for the patient over a number of hospital visits. The markers can be used individually or in combination. The algorithm will return a score that reflects the risk of lung function decline in the next 18 months. Based on the score returned a physician may choose to be more aggressive with conventional anti-inflammatory therapy to reduce or prevent impeding lung function decline or follow the usual regiment of care if the score does not indicate a high risk of future lung function decline.
- A large challenge for gene therapy with the CFTR gene is the lack of effective measures of the delivered CFTR transgene expression. The technology described herein allows us to measure the levels of full length or any portion of CFTR protein.
FIG 12 shows difference measured in the levels of CFTR between patients homozygous for the F508del mutation compared with the levels measured in the serum of patients heterozygous for F508del and various mutations that express minimal levels of protein. The difference observed by the technology claimed here of 1.65-fold reflects the expected higher levels of CFTR expression in the homozygous group. An example of using this technology would be in the context of a CFTR gene therapy trial. In such a trial, measuring the expression of the delivered transgene CFTR would be necessary. The technology described herein may be used to measure level of full length or a portion of CFTR in the serum, plasma, and/or bronchoalveolar lavage to assess the efficiency of gene delivery. An increase in levels of CFTR in serum, for example, would indicate successful delivery of CFTR. - Rigorous individual monitoring can reduce treatment costs, improve clinical outcomes, and decrease disease progression rate in CF patients. The disclosed methods may be used to predict or identify individuals most likely to benefit from various interventions allowing for a proactive (vs. the current reactive) approach in managing pulmonary exacerbations for patients with CF.
- Spirometry is the primary tool used to assess lung function in diseases, including asthma, chronic obstructive pulmonary disease, and CF. It has been central to defining the natural history of these disorders and in developing algorithms to predict their trajectories. (23) Spirometric measures (e.g., FEV1) are the standard-of-care used to assess disease progression and the most common endpoints in clinical trials for lung disease. (25) However, they are insensitive to the cellular and molecular processes that drive lung disease.
- While spirometry, primarily FEV1, is the standard clinical measure of lung function and is used ubiquitously to monitor disease progression and therapy response in CF, measures are abnormally low in virtually all adult CF patients, but young patients usually display normal FEV1. However, structural abnormalities, including bronchiectasis, are observed via computed tomography (CT) in up to ⅓ of CF patients before the 3rd year of life. (8). Similarly, bronchoalveolar lavage (BAL) has shown that infection and inflammation can be present years prior to clinical symptoms and spirometric changes. These observations indicate that common clinical metrics (e.g., body mass index and FEV1) are trailing indicators of disease progression and represent the culmination of years of pathological changes at the structural and molecular levels (10, 11). As such, they typically cannot be used to identify young patients at risk for rapid lung function decline or patients for whom interventions could prevent permanent lung disease from becoming established.
- More sensitive clinical tools available to assess lung disease are also ill-suited for prospective monitoring in early CF. For example, BAL fluid is obtained via bronchoscopy, which is invasive and often requires sedation-particularly in pediatric subjects. As such, it cannot be used for intensive monitoring. Similarly, exposure to the ionizing radiation of CT is associated with increased risk of cancer in pediatric subjects, because children are more susceptible to radiation and have longer remaining lifespans than adults 12), making CT also ill-suited for frequent prospective monitoring in CF.
- The duration of this spirometric "silent period" in CF lung disease is likely to increase in the coming years, further in view of the recently-approved triple-combination CFTR modulator therapy (Trikafta®, a combination of three drugs - elexacaftor/ivacaftor/tezacaftor - that target the defective CFTR protein). When treated with highly effective modulator therapy, CF patients display initially improved lung function and slower rates of decline, as assessed by FEV1 (11). However, structural remodeling-in particular bronchiectasis - continues in these patients (13). Thus, the CF field is at a crossroads, where dramatic past improvements in care now limit the ability to assess early disease severity and predict disease progression. This is particularly true in young patients for whom effective interventions will yield the greatest improvements in outcomes and generate the largest increases in lifespan. As such, it is advantageous to provide sensitive methods to quantify disease progression and therapy response in the context of spirometrically normal lung function, which may further be non-invasive and radiation-free. Without such tools, further improvements in CF care and increases in CF patient longevity may be limited. The present disclosure seeks to address this gap with methods that may be used to monitor and predict lung function decline and structural remodeling in early CF.
- The disclosed methods, in one aspect, may be used to fill this void by combining structural and functional lung measurements that may be used to detect, monitor, or predict lung pathophysiologies. Exemplary methods useful for determining a structural or functional lung measurement include, but are not limited to, MRI, CT, or other imaging methods known in the art, which may be combined with FD analysis, and methods for protein biomarker measurement including, not limited to, LC-MS/MS (Liquid Chromatography incorporated with tandem Mass Spectrometry) and ELISA. In one exemplary embodiment, that reflect the mechanisms driving lung function decline and remodeling in CF. Previously, bronchiectasis markers (29-30) examined in a biased fashion, focused only on targeted proteins in blood using epitope-based analyses with aptamers, which are prone to false positives and negatives. These factors contributed to only modest correlations (r -0.45) and did not further the understanding of CF bronchiectasis from what was known from other lung diseases. In contrast, Applicant has identified markers that correlate with disease severity (mean r -0.72) during stable disease, improving the ability to forecast lung function decline (
Fig. 4 ). - LC-MS/MS discovery of systemic disease biomarkers and FD analysis: Based on cancer and cardiovascular research, where conventional "shotgun" proteomics identify 500-1000 proteins per sample but failed to distinguish disease severity cohorts, Applicant reasoned that deeper proteomic screening would be necessary for CF studies. Thus, Applicant developed a pipeline using multidimensional protein separation by abundant protein-adsorption columns and gel and column chromatography. This more rigorous approach generated multiple fractions from each sample for subsequent MS analysis (7-17). Cohorts of 44 mild (FEV1>85%) and 44 severe (<45th percentile) CF patient were matched based on age, gender, genotype, and infection status, then randomized and blinded before proteomic analysis. Applicant identified 61,942 protein isoforms expressed in both cohorts, with 19,162 isoforms identified in all subjects. Principal Component Analysis (PCA), logistic regression with Least Absolute Shrinkage and Selection Operator (LASSO) (18), random forests (19), Wilcoxon Rank Sum (44), and McNemar's tests (45) were used to reduce the dataset from ∼62,000 isoforms analyzed to 744 isoforms across the battery of five tests. PCA of the top 744 isoforms with respect to FEV1 indicated that these markers segregated mild from severe disease and are good discriminators of lung function in this cross-sectional group. A subset of isoforms were identified by nonbiased proteomic analysis and may be biomarkers of choice for developing a lung function decline prediction model. Building on these approaches, Applicant used FD analysis to characterize lung function at the population level and to accurately predict rapid decline in individual patients. For example,
Fig. 14 shows the forecasting performance of the top 3, (voltage gated calcium channel alpha 1F subunit CACNA1F [9606], pleckstrin homology domain-containing family Amember 5 isoform X1 PLEKHA5 [9606], and pleckstrin homology domain-containing family Amember 5 isoform X9 PLEKHA5 [9606]). - In certain aspects, FEV1 may be used with biostatistical modeling as a point-of-care tool (14). The predictive power may be improved when data from Liquid Chromatography is incorporated with tandem Mass Spectrometry (LC-MS/MS), which can yield proteomic biomarkers sensitive at the molecular level to changes in CF lung disease (
Fig. 4 ,5 ). Here, these biostatical and proteomic tools may be combined with one or more biomarkers as disclosed herein, (See Table 4, Panel of protein biomarker covariates for algorithm). Functional information (e.g., as obtained via hyperpolarized (HP) 129Xe MRI, fluorine MRI, CT, or the like) may be used to determine regional lung dysfunction longitudinally and ultra-short echo-time (UTE), and may further be used to detect structural remodeling over time.Table 4. Panel of protein biomarker covariates Protein name (gene name) 1. alpha 1 typeXXIV collagen precursor 2. alpha-2- macroglobulin 3. alpha-fetoprotein enhancer binding protein 4. Alstrom syndrome protein 1isoform 15. aminopeptidase O isoform X9 (C9orf3) 6. ankyrin-3 isoform 37. anti-HBsAg immunoglobulin Fab kappa chain, partial 8. anti TNF-alpha antibodv light-chain Fab fragment, partial 9. ARAP2 protein (ARAP2) 10. Bifunctional glutamate/proline--tRNA ligase (EPRS) 11. C10ORF6 12. CECR2 protein (CECR2) 13. cell division cvcle 2-like 5 (cholinesterase-related cell division controller) (CDC2L5) 14. chromodomain-helicase-DNA-binding protein 6 isoform X3 (CHD6)15. chromosome 3 open reading frame 15 (C3orf15)16. cilia- and flagella-associated protein 91 isoform 317. cingulin-like 1 (CGNL1) 18. CLIP-associating protein 2 isoform X24 (CLASP2)19. Coiled-coil domain-containing protein 1820. coiled-coil domain-containing protein 18 isoform X2 (CCDC18)21. coiled-coil domain-containing protein 93 isoform X3 (CCDC93) 22. collagen triple helix repeat-containing RP11-45B20.2 23. collagen, type XXIV, alpha 1 (COL24A1) 24. complement component C2 (C2) 25. complement component C6 isoform X7 (C6) 26. complement factor H (CFH) 27. Connector enhancer of kinase suppressor of ras 28. connector enhancer of kinase suppressor of ras 2 isoform X2 (CNKSR2)29. CTP:phosphocholine cytidylyltransferase 30. death inducer-obliterator-3 (DIDO3) 31. diacylglycerol kinase iota isoform X4 (DGKI) 32. DNA annealing helicase and endonuclease ZRANB3 (ZRANB3) 33. DNA methvltransferase 1-associated protein 134. DNAH10 variant protein 35. E3 ubiquitin-protein ligase MIB2 isoform X5 (MIB2) 36. EPRSN1 37. fibrinogen alpha chain preproprotein, isoform alpha (FGA) 38. filamin 2 (FLN2) 39. Fras1-related extracellular matrix protein 2 (FREM2) 40. FYVE, RhoGEF and PH domain-containing protein 5 isoform X2 (FGD5)41. Gelsolin 42. gelsolin isoform X3 (GSN) 43. glutamate receptor-interacting protein 1 isoform X7 (GRIP1)44. growth-inhibiting protein 24 (GIG24) 45. hCG1656772 46. hemicentin 47. Histidine-rich glycoprotein 48. histidine-rich glycoprotein isoform X1 (HRG) 49. histone acetyltransferase MORF alpha 50. IF2 protein (IF2) 51. immunoglobulin lambda light chain VLJ region (IGL) 52. interferon regulatory factor-2 binding protein 2B 53. junction-mediating and -regulatory protein isoform X2 (JMY) 54. KIAA0328 protein KIAA0328 55. kinesin-like protein (KIF2) 56. kinesin-like protein KIF21A isoform X7 (KIF21A) 57. laminin subunit alha-2 isoform X3 (LAMA2) 58. la-related protein 1 isoform X5 LARP159. LIM and calponin homology domains-containing protein 1 isoform X20 (LIMCH1)60. LIM and calponin homology domains-containing protein 1 isoform X22 (LIMCH1)61. lysine-specific demethylase 2B isoform X7 (KDM2B) 62. MAX gene-associated protein isoform X11 (MGA) 63. multiple endocrine neoplasia type 1 candidate protein number 18 (HSPF2)64. MYCBP-associated protein isoform X1 (MYCBPAP) 65. nebulin-related anchoring protein, isoform CRA_b 66. Non-canonical poly(A) RNA polymerase PAPD5 (PAPD5) 67. PAP associated domain containing protein 5 variant68. partitioning-defective 3-like protein splice variant c (PAR3L) 69. paraoxanase-3 70. PF6 71. Platelet glycoprotein 1b alpha chain (GP1BA) 72. Pleckstrin homology-like domain family B member 2 (PHLDB2) 73. PMFBP1 protein (PMFBP1) 74. poly (ADP-ribose) plycohydrolase (PARG) 75. PRO2841 76. Pregnancy zone protein 77. probable E3 ubiquitin-protein ligase HERC1 isoform X1 (HERC1) 78. probable E3 ubiquitin-protein ligase HERC1 isoform X11 (HERC1) 79. Protein AMBP (AMBP) 80. protein arginine N- methyltransferase 3 isoform X1 (PRMT3)81. Protein SCAF11 (SCAF11) 82. ral GTPase-activating protein subunit alpha-1 isoform X12 (RALGAPA1) 83. Receptor-type tyrosine-protein phosphatase C (PTPRC) 84. RGS3 isoform C2PA-RGS3 (RGS3) 85. Rho-GTPase activating protein 10 (ARHGAP10) 86. RNA-binding motif protein, Y chromosome, family 1 member B isoform X1 (RBMY1B)87. RUNDC1 protein (RUNDC1) 88. protein-methionine sulfoxide oxidase MICAL3 isoform X10 (MICAL3) 89. Protein phosphatase 1 regulatory subunit (PPP1R12B)90. Protein sidekick-2 (SDK2) 91. sacsin isoform X3 (SACS) 92. SAPS domain family, member 2 (SAPS2) 93. serine/threonine- protein phosphatase 4 regulatorysubunit 3A isoform 194. serine-protein kinase ATM isoform X5 (ATM) 95. serum aryldialkylphosphatase precursor 96. SHMT2 protein (SHMT2) 97. smoothelin-B3 (SMTN) 98. somatostatin receptor interacting protein splice variant a (SSTRIP) 99. sperm-associated antigen 17 isoform X3 (SPAG17)100. spermatogenesis-associated protein 31C1 isoform X1 (SPATA31C1) 101. synaptotagmin- like protein 2 isoform X10 (SYTL2)102. T-cell lymphoma invasion and metastasis 1 (TIAM1) 103. translation initiation factor (IF2) 104. transthyretin precursor 105. terminal nucleotidyltransferase 4B isoform b 106. tetratricopeptide repeat protein 21A isoform X6 (TTC21A) 107. thrombospondin 1 (THBS1) 108. triadin isoform X17 (TRDN) 109. ubiquitin carboxyl- terminal hydrolase 40 isoform X1 (USP40)110. uridine-cvtidine kinase-like 1 isoform 2111. uridine-cvtidine kinase-like 1 isoform X7 (UCKL1) 112. utrophin isoform X4 (UTRN) 113. Voltage-dependent N-type calcium channel subunit alpha-1B (CACNA1B) 114. WD repeat-containing protein 64 isoform X2 (WDR64) 115. zinc finger and AT hook domain containing (ZFAT) 116. Zinc finger homeobox protein 4 (ZFHX4) - For predictive modeling, the primary outcome-lung function-may be defined by the ventilation defect percent (VDP) or other regional measures (partial ventilation, ventilation heterogeneity, hyper-intensity, etc.). The FD model (46) may be used to analyze longitudinal VDP as a function of time (indexed as age at the time of functional assessment, via MRI scan, CT, or the like, and blood draw) and degree of proteomic expression with adjustment for select clinical/demographic characteristics as covariates, including lung clearance index (LCI). Applicant has built a prediction model using patient-specific information to predict the onset of rapid decline. For VDP, this model can be expressed as Equation 9:

mean 0 and variance ω 2, and provides patient-specific variability. Wi (tij ) is a stochastic process reflecting image variation over time in an individual patient. Integrated Brownian motion is used to depict this process, which has variance σ 2 . Zi represents normally distributed measurement error with mean 0 and variance τ 2. The covariance functions and estimation algorithm have been described previously (47). Predictive models for other regional lung function metrics can be constructed similarly. The model for the CFF-PR was implemented using the lmenssp package (48) in R (R Foundation for Statistical Computing, Vienna, Austria). Candidate molecular markers B i1 ..., Bim may be used as covariates (main effect and interaction effect with time), and denote the association parameters as γ 1, ..., γm , to fit the model on smaller data. - When using structural remodeling as a covariable, which may include data obtained via any imaging method known in the art, including, but not limited to, CT, MRI, or other image analysis technique, prediction modeling and evaluation may be used, except the discreet response variable will be log-transformed and expressed as Equation 10:

- One outcome, for example, the degree of bronchiectasis, can be defined be expert reader scoring or using automated software (e.g., deep learning algorithms), may use scores from FPCA to estimate correlation between proteomic expression and degree of bronchiectasis (49).
- Sensitivity of MRI/CT to early CF lung disease: The disclosed modeling may be applied to advanced lung imaging data, which can be performed in children too young to perform spirometry (50) and detect pathology prior to spirometric changes (
Fig. 18 ). Any acquisition strategy can be used. For example, in one approach an efficient 3D spiral, FLORET (51-55) sequence to depict ventilation at 3-mm resolution may be used -the highest 129Xe resolution achieved in humans. "Keyhole" reconstruction pipeline may be used to mitigate regional 129Xe signal decay and improve image accuracy (56). Biomarkers of structural remodeling using a 1H FLORET acquisition may be optimized to visualize airway abnormities. This free-breathing protocol generates images with 1-mm resolution in ~5 minutes (57, 58). Airway-optimized 1H FLORET may be used to guide clinical bronchoscopies to obtain bronchoalveolar lavage (BAL) fluid from specific lung pathologies, including bronchiectasis. Using these data and FD analysis, molecular changes may be used to forecast functional and structural disease in individual CF patients. These methods may combine innovations in proteomics, imaging and modeling to 1) enable translational research that continues to advance CF patient care and 2) define the post-CFTR-modulator "new normal" for the natural history of CF. While the markers identified in this work may be specific to CF, combining non-invasive HP 129Xe and UTE MRI with blood and BAL proteomics may be applicable to a wide range of lung diseases. - Functional Data (FD) and Functional Principal Component (FPC) analyses: The disclosed methods build on FD analysis and longitudinal models using FEV1 data from the CFF-PR. This modeling blends established biostatistical approaches with modern FD analyses to characterize the nonlinear FEV1 trajectory of individual patients and predicts subsequent decline. The predictive models may be used for in-clinic applications for decision aids for treatment planning and at the time of patient encounters. Furthermore, predictive accuracy of lung function decline improves with proteomic markers (
Fig. 14 ). Biomarker data correlation with FEV1 may be measured in multiple simulations and by appropriate statistical tests as described. - Hyperpolarized (HP) 129Xe MRI: Images from 50 CF patients (24 male, 26 female) were acquired. HP 129Xe polarization (∼20-40%) was measured before MRI with a polarimetry station. Images were acquired with 129Xe coils to provide comparable performance across the range of subject sizes (15). Single-breath HP 129Xe images were acquired using a multi-slice gradient-echo sequence, linear phase encoding, and optimized flip angle (16). Impaired ventilation was assessed using the Ventilation Defect Percentage (VPD), defined by employing automated software to identify lung voxels with signal intensities below a threshold that maximized contrast between age-matched, healthy control subjects and CF patients (17).
- UTE MRI: Historically, lung MRI has been challenging, because magnetic inhomogeneities are created by air-tissue interfaces (i.e., alveoli) and cause the MR signal to decay with a rate constant (T2*) of -0.8 ms at 3 T (18). Rapid decay was mitigated using an ultra-short echo-time (UTE) sequence to sample the MR signal before significant decay (echo-times of <200 µs), retaining -80% of parenchymal signal. Data were collected at end expiration, where T2* and motion are minimized (19). Structural pathology (wall thickening, bronchiectasis, etc.) was identified and scored by two board-certified, pediatric radiologists using an MRI-variant of the well-established "Brody" scoring system (20) (
Fig. 15 ). - Correlation of MRI and Proteomics: 129Xe MRI and same-day blood draws were performed in 9 CF patients with mild lung disease (FEV1>85%). Blood samples were grouped by functional impairment according to ventilation defect percentage (VDP) as no impairment (VPD <2, 2 male, 1 female), mild (5<VDP<15; 1 m, 2 f), and moderate (VDP >20, 2 m, 1 f). UTE MRI and same-day blood draws were performed in 8 CF patients with mild disease. Bronchiectasis was scored with a simplified system by dividing lungs into 6 regions (5 lobes plus lingula) (20, 21). Regions were scored independently by a trained reader (scale: 0-3; 0=not present; 1=present in <1/3 lobe; 2=present in <2/3 lobe; and 3=present in >2/3 lobe), and regional scores were summed to yield whole-lung scores. Samples were grouped by bronchiectasis severity as mild (score≤3; 2 m, 2 f) or moderate (4≤ score ≤10; 2 m, 2 f). For both UTE and VDP, group identities were blinded for non-biased proteomic analysis.
- Correlation of MRI and Proteomics: For functional MRI studies, 129Xe MRI and same-day blood draws were performed in 9 CF patients with mild lung disease (FEV1>85%). Blood samples were grouped by functional impairment as no impairment (VPD<2, 2 male, 1 female), mild (5<VDP<15; 1 m, 2 f), and moderate (VDP>20, 2 m, 1 f). UTE MRI and same-day blood draws were performed in 8 CF patients with mild disease. For structural studies, bronchiectasis was scored with a simplified system by dividing lungs into 6 regions (5 lobes plus lingula) (21, 22). Regions were scored independently by a trained reader (scale: 0-3; 0=not present; 1=present in <1/3 lobe; 2=present in <2/3 lobe; and 3=present in >2/3 lobe), and regional scores were summed to yield whole-lung scores. Samples were grouped by bronchiectasis severity as mild (score≤3; 2 m, 2 f) or moderate (4≤ score ≤10; 2 m, 2 f). For both UTE and VDP, group identities were blinded for non-biased proteomic analysis.
- Using pathway, network, and process analyses, Applicant successfully identified the no, mild, or moderate impairment groups before data were unblinded. Analysis of proteomic changes revealed differences in pro-inflammatory signaling, remodeling-associated cytoskeletal rearrangement, and cell adhesion associated with inflammatory cell activation (
Fig. 16 ). Analysis of the groups segregated by structural Ultra-Short Echo Time (UTE) MRI revealed changes in pathways associated with CF disease (e.g. ENAC regulation), inflammatory signaling, remodeling, and cell adhesion (Fig. 17 ). The no, mild, or moderate impairment groups were successfully identified by Applicant before data were unblinded. Of particular note - all subjects had 85% or higher FEV1 percent predicted. Current pulmonary function tests cannot distinguish impairment in patients with 85% or higher FEV1 percent predicted. Analysis of proteomic changes revealed differences in pro-inflammatory signaling, remodeling-associated cytoskeletal rearrangement, and cell adhesion associated with inflammatory cell activation (Fig. 16 ). Analysis of the groups segregated by structural Ultra-Short Echo Time (UTE) MRI revealed changes in pathways associated with CF disease (e.g. epithelial sodium channel (ENAC) regulation), inflammatory signaling, remodeling, and cell adhesion (Fig. 17 ). These blinded studies provide compelling evidence that proteomics detects mild structural and ventilation abnormalities identified by MRI, supporting Applicant's hypothesis that these technologies yield robust and complimentary information to detect early remodeling and lung function impairment. Significantly, this sensitivity to early disease cannot be validated with available lung function testing. -
- 1. Drumm ML, Ziady AG, Davis PB. Genetic variation and clinical heterogeneity in cystic fibrosis. Annu Rev Pathol. 2012;7:267-82. doi: 10.1146/annurev-pathol-011811-120900 [doi].
- 2. Rosenfeld M, VanDevanter DR, Ren CL, Elkin EP, Pasta DJ, Konstan MW, Morgan WJ, Fibrosis IoCotESoC. Decline in lung function does not predict future decline in lung function in cystic fibrosis patients. Pediatr Pulmonol. 2015;50(9):856-62. doi: 10.1002/ppul.23227 [doi].
- 3. Szczesniak RD, McPhail GL, Li D, Amin RS, Clancy JP. Predicting future lung function decline in cystic fibrosis patients: Statistical methods and clinical connections. Pediatr Pulmonol. 2016;51(2):217-8. doi: 10.1002/ppul.23357 [doi].
- 4. Accurso FJ, Rowe SM, Clancy JP, Boyle MP, Dunitz JM, Durie PR, Sagel SD, Hornick DB, Konstan MW, Donaldson SH, Moss RB, Pilewski JM, Rubenstein RC, Uluer AZ, Aitken ML, Freedman SD, Rose LM, Mayer-Hamblett N, Dong Q, Zha J, Stone AJ, Olson ER, Ordonez CL, Campbell PW, Ashlock MA, Ramsey BW. Effect of VX-770 in persons with cystic fibrosis and the G551D-CFTR mutation. N Engl J Med. 2010;363(21):1991-2003.
- 5. Wainwright CE, Elborn JS, Ramsey BW, Marigowda G, Huang X, Cipolli M, Colombo C, Davies JC, De BK, Flume PA, Konstan MW, McColley SA, McCoy K, McKone EF, Munck A, Ratjen F, Rowe SM, Waltz D, Boyle MP, Group TS, Group TS. Lumacaftor-Ivacaftor in Patients with Cystic Fibrosis Homozygous for Phe508del CFTR. N Engl J Med. 2015;373(3):220-31. doi: 10.1056/NEJMoa1409547 [doi].
- 6. Hoy SM. Elexacaftor/Ivacaftor/Tezacaftor: First Approval. Drugs. 2019;79(18):2001-7. Epub 2019/12/01. doi: 10.1007/s40265-019-01233-7. PubMed PMID: 31784874.
- 7. Sanders DB, Bittner RC, Rosenfeld M, Hoffman LR, Redding GJ, Goss CH. Failure to recover to baseline pulmonary function after cystic fibrosis pulmonary exacerbation. Am J Respir Crit Care Med. 2010;182(5):627-32. doi: 200909-1421OC [pii]; 10.1164/rccm.200909-1421OC [doi].
- 8. Roach DJ, Cremillieux Y, Fleck RJ, Brody AS, Serai SD, Szczesniak RD, Kerlakian S, Clancy JP, Woods JC. Ultrashort Echo-Time Magnetic Resonance Imaging Is a Sensitive Method for the Evaluation of Early Cystic Fibrosis Lung Disease. Ann Am Thorac Soc. 2016;13(11):1923-31. PubMed PMID: WOS:000419097900012.
- 9. Tepper LA, Caudri D, Rovira AP, Tiddens HA, de Bruijne M. The development of bronchiectasis on chest computed tomography in children with cystic fibrosis: can pre-stages be identified? Eur Radiol. 2016;26(12):4563-9. Epub 2016/04/25. doi: 10.1007/s00330-016-4329-z. PubMed PMID: 27108295; PMCID: PMC5101271.
- 10. Konstan MW, McKone EF, Moss RB, Marigowda G, Tian S, Waltz D, Huang X, Lubarsky B, Rubin J, Millar SJ, Pasta DJ, Mayer-Hamblett N, Goss CH, Morgan W, Sawicki GS. Assessment of safety and efficacy of long-term treatment with combination lumacaftor and ivacaftor therapy in patients with cystic fibrosis homozygous for the F508del-CFTR mutation (PROGRESS): a ].
- 11. Sawicki GS, McKone EF, Pasta DJ, Millar SJ, Wagener JS, Johnson CA, Konstan MW. Sustained Benefit from Ivacaftor Demonstrated by Combining Clinical Trial and Cystic Fibrosis Patient Registry Data. Am J Respir Crit Care Med. 2015;192(7):836-42. doi: 10.1164/rccm.201503-0578OC [doi].
- 12. Pearce MS, Salotti JA, Little MP, McHugh K, Lee C, Kim KP, Howe NL, Ronckers CM, Rajaraman P, Craft AW, Parker L, de Gonzalez AB. Radiation exposure from CT scans in childhood and subsequent risk of leukaemia and brain tumours: a retrospective cohort study. Lancet. 2012;380(9840):499-505. doi: 10.1016/S0140-6736(12)60815-0. PubMed PMID: WOS:000307109000031.
- 13. Chassagnon G, Hubert D, Fajac I, Burgel P-R, Revel M-P. Long-term computed tomographic changes in cystic fibrosis patients treated with ivacaftor. European Respiratory Journal. 2016;48(1):249-52. doi: 10.1183/13993003.01918-2015.
- 14. Szczesniak RD, Brokamp C, Su W, Mcphail GL, Pestian J, Clancy JP. Improving Detection of Rapid Cystic Fibrosis Disease Progression-Early Translation of a Predictive Algorithm Into a Point-of-Care Tool. IEEE Journal of Translational Engineering in Health and Medicine. 2019;7:1-8. doi: 10.1109/JTEHM.2018.2878534.
- 15. Loew W TR, Pratt R, Cleveland Z, Dumoulin C, Woods J, Giaquinto R. A Volume saddle coil for hyperpolarized 129Xe lung imaging. Proc Int Soc Magn Reson Med. 2015;2015:93.
- 16. Miller GW, Altes TA, Brookeman JR, De Lange EE, Mugler JP, 3rd. Hyperpolarized 3He lung ventilation imaging with B 1-inhomogeneity correction in a single breath-hold scan. Magma. 2004;16(5):218-26. doi: 10.1007/s10334-003-0028-2. PubMed PMID: 15108030.
- 17. Thomen RP, Walkup LL, Roach DJ, Cleveland ZI, Clancy JP, Woods JC. Hyperpolarized 129Xe for investigation of mild cystic fibrosis lung disease in pediatric patients. Journal of Cystic Fibrosis. 2017;16(2):275-82. doi: http://dx.doi.org/10.1016/j.jcf.2016.07.008.
- 18. Yu J, Xue Y, Song HK. Comparison of lung T2* during free-breathing at 1.5 T and 3.0 T with ultrashort echo time imaging. Magnetic resonance in medicine : official journal of the Society of Magnetic Resonance in Medicine / Society of Magnetic Resonance in Medicine. 2011;66(1):248-54. doi: 10.1002/mrm.22829. PubMed PMID: 21695727; PMCID: 3122137.
- 19. Lederlin M, Crémillieux Y. Three-dimensional assessment of lung tissue density using a clinical ultrashort echo time at 3 tesla: A feasibility study in healthy subjects. Journal of Magnetic Resonance Imaging. 2014;40(4):839-47. doi: 10.1002/jmri.24429.
- 20. Brody AS, Klein JS, Molina PL, Quan J, Bean JA, Wilmott RW. High-resolution computed tomography in young patients with cystic fibrosis: Distribution of abnormalities and correlation with pulmonary function tests. Journal of Pediatrics. 2004;145(1):32-8. PubMed PMID: WOS:000222738500020.
- 21. Eichinger M, Optazaite D-E, Kopp-Schneider A, Hintze C, Biederer J, Niemann A, Mall MA, Wielpütz MO, Kauczor H-U, Puderbach M. Morphologic and functional scoring of cystic fibrosis lung disease using MRI. European Journal of Radiology. 2012;81(6):1321-9. doi: https://doi.org/10.1016/j.ejrad.2011.02.045.
- 22. Wielpütz MO, Puderbach M, Kopp-Schneider A, Stahl M, Fritzsching E, Sommerburg O, Ley S, Sumkauskaite M, Biederer J, Kauczor H-U, Eichinger M, Mall MA. Magnetic Resonance Imaging Detects Changes in Structure and Perfusion, and Response to Therapy in Early Cystic Fibrosis Lung Disease. American Journal of Respiratory and Critical Care Medicine. 2014;189(8):956-65. doi: 10.1164/rccm.201309-1659OC. PubMed PMID: 24564281.
- 23. Szczesniak R, Heltshe SL, Stanojevic S, Mayer-Hamblett N. Use of FEV(1) in cystic fibrosis epidemiologic studies and clinical trials: A statistical perspective for the clinical researcher. Journal of cystic fibrosis : official journal of the European Cystic Fibrosis Society. 2017;16(3):318-26. Epub 01/20. doi: 10.1016/j.jcf.2017.01.002. PubMed PMID: 28117136.
- 24. Vestbo J, Lange P. Natural history of COPD: Focusing on change in FEV1. Respirology. 2016;21(1):34-43. doi: 10.1111/resp. 12589.
- 25. Hanania NA, Sharafkhaneh A, Celli B, Decramer M, Lystig T, Kesten S, Tashkin D. Acute bronchodilator responsiveness and health outcomes in COPD patients in the UPLIFT trial. Respiratory Research. 2011;12(1):6. doi: 10.1186/1465-9921-12-6.
- 26. Stanojevic S, Ratjen F. Physiologic endpoints for clinical studies for cystic fibrosis. Journal of Cystic Fibrosis. 2016;15(4):416-23. doi: https://doi.org/10.1016/j.jcf.2016.05.014.
- 27. King TE, Bradford WZ, Castro-Bernardini S, Fagan EA, Glaspole I, Glassberg MK, Gorina E, Hopkins PM, Kardatzke D, Lancaster L, Lederer DJ, Nathan SD, Pereira CA, Sahn SA, Sussman R, Swigris JJ, Noble PW. A .
- 28. Walkup LL, Thomen RP, Akinyi TG, Watters E, Ruppert K, Clancy JP, Woods JC, Cleveland ZI. Feasibility, tolerability and safety of pediatric hyperpolarized Xe-129 magnetic resonance imaging in healthy volunteers and children with cystic fibrosis. Pediatric Radiology. 2016;46(12):1651-62. PubMed PMID: WOS:000387135600003.
- 29. DeBoer EM, Kroehl ME, Wagner BD, Accurso FJ, Harris JK, Lynch DA, Sagel SD, Deterding RR. Proteomic profiling identifies novel circulating markers associated with bronchiectasis in cystic fibrosis. PROTEOMICS - Clinical Applications. 2017;11(9-10): 1600147. doi: 10.1002/prca.201600147.
- 30. DeBoer EM, Wagner BD, Popler J, Harris JK, Zemanick ET, Accurso FJ, Sagel SD, Deterding RR. Novel Application of Aptamer Proteomic Analysis in Cystic Fibrosis Bronchoalveolar Lavage Fluid. PROTEOMICS - Clinical Applications.0(0): 1800085. doi: 10.1002/prca.201800085.
- 31. Chen J, Kinter M, Shank S, Cotton C, Kelley TJ, Ziady AG. Dysfunction of Nrf-2 in CF epithelia leads to excess intracellular H2O2 and inflammatory cytokine production. PLoS One. 2008;3(10):e3367.
- 32. Ziady AG, Kinter M. Protein sequencing with tandem mass spectrometry. Methods Mol Biol. 2009;544:325-41.
- 33. Ziady AG, Sokolow A, Shank S, Corey D, Myers R, Plafker S, Kelley TJ. Interaction with CREB binding protein modulates the activities of Nrf2 and NF-kappaB in cystic fibrosis airway epithelial cells. Am J Physiol Lung Cell Mol Physiol. 2012;302(11):L1221-L31. doi: ajplung.00156.2011 [pii];10.1152/ajplung.00156.2011 [doi].
- 34. Chirkova T, Lin S, Oomens AG, Gaston KA, Boyoglu-Barnum S, Meng J, Stobart CC, Cotton CU, Hartert TV, Moore ML, Ziady AG, Anderson LJ. CX3CR1 is an Important Surface Molecule for RSV Infection in Human Airway Epithelial Cells. J Gen Virol. 2015. doi: 10.1099/vir.0.000218 [doi].
- 35. Sinha C, Zhang W, Moon CS, Actis M, Yarlagadda S, Arora K, Woodroofe K, Clancy JP, Lin S, Ziady AG, Frizzell R, Fujii N, Naren AP. Capturing the Direct Binding of CFTR Correctors to CFTR by Using Click Chemistry. Chembiochem. 2015. doi: 10.1002/cbic.201500123 [doi].
- 36. Sinha C, Ren A, Arora K, Moon CS, Yarlagadda S, Woodrooffe K, Lin S, Schuetz JD, Ziady AG, Naren AP. PKA and actin play critical roles as downstream effectors in MRP4-mediated regulation of fibroblast migration. Cell Signal. 2015;27(7): 1345-55. doi: S0898-6568(15)00121-7 [pii];10.1016/j.cellsig.2015.03.022 [doi].
- 37. Ziady AG, Heltshe SL, Kelley TJ, Muhlebach MS, Accurso F, Pilewski J, Clancy JP, Sagel SD, Joseloff E. Proteomic analyses of serum from CF patients with mild or severe disease reveal the differential expression of proteins that regulate the differentiation of cartilage, myeloid leukocytes, and intestinal epithelia. Pediatr Pulmonol Suppl. 2014;38:288.
- 38. Sagel SD, Wagner B, Ziady AG, Kelley TJ, Muhlebach MS, Accurso F, Pilewski J, Heltshe SL, Clancy JP, Joseloff E. Validation of Candidate Serum Protein and Lipid Markers of Disease Severity In CF. Pediatr Pulmonol Suppl. 2014;38:288.
- 39. Ziady AG, Lin S, Wyatt C, Clancy JP. Proteomic analyses of BALF reveal potential biomarkers and suggest altered lipid, cyclic nucleotide, and iron metabolism in young CF children versus disease controls. Pediatr Pulmonol Suppl. 2013;36:250.
- 40. Li Q, Ding X, Thomas JJ, Harding CV, Pecora ND, Ziady AG, Shank S, Boom WH, Lancioni CL, Rojas RE. Rv2468c, a novel Mycobacterium tuberculosis protein that costimulates human CD4+ T cells through VLA-5. J Leukoc Biol. 2012;91(2):311-20. doi: jlb.0711364 [pii];10.1189/jlb.0711364 [doi].
- 41. Chen X, Shank S, Davis PB, Ziady AG. Nucleolin-mediated cellular trafficking of DNA nanoparticle is lipid raft and microtubule dependent and can be modulated by glucocorticoid. Mol Ther. 2011;19(1):93-102.
- 42. Tibshirani RJ. Regression shrinkage and selection via the lasso. Royal Statist Soc B. 1996;58:267-88.
- 43. Hastie T, Tibshirani RJ, Friedman J. The Elements of Statistical Learning: Data Mining, Inference, and Prediction2009 2009.
- 44. Wilcoxon F. Individual comparisons of grouped data by ranking methods. Journal of economic entomology. 1946;39:269. Epub 1946/04/01. doi: 10.1093/jee/39.2.269. PubMed PMID: 20983181.
- 45. Fagerland MW, Lydersen S, Laake P. The McNemar test for binary matched-pairs data: mid-p and asymptotic are better than exact conditional. BMC Med Res Methodol. 2013;13:91-. doi: 10.1186/1471-2288-13-91. PubMed PMID: 23848987.
- 46. Szczesniak RD, Su W, Brokamp C, Keogh RH, Pestian JP, Seid M, Diggle PJ, Clancy JP. Dynamic predictive probabilities to monitor rapid cystic fibrosis disease progression. Statistics in Medicine. 2020;39(6):740-56. doi: 10.1002/sim.8443.
- 47. Diggle PJ, Sousa I, Asar O. Real-time monitoring of progression towards renal failure in primary care patients. Biostatistics. 2015;16(3):522-36. doi: kxu053 [pii]; 10.1093/biostatistics/kxu053 [doi].
- 48. Asar O, Ilk O. mmm: an R package for analyzing multivariate longitudinal data with multivariate marginal models. Comput Methods Programs Biomed. 2013;112(3):649-54. doi: S0169-2607(13)00257-5 [pii];10.1016/j.cmpb.2013.07.022 [doi].
- 49. Szczesniak RD, Li D, Su W, Brokamp C, Pestian J, Seid M, Clancy JP. Phenotypes of Rapid Cystic Fibrosis Lung Disease Progression during Adolescence and Young Adulthood. American Journal of Respiratory and Critical Care Medicine. 2017;196(4):471-8. doi: 10.1164/rccm.201612-2574OC. PubMed PMID: 28410569.
- 50. Walkup LL, Myers K, El-Bietar J, Nelson A, Willmering MM, Grimley M, Davies SM, Towe C, Woods JC. 129Xe MRI detects ventilation deficits in pediatric stem-cell transplant patients unable to perform spirometry. European Respiratory Journal. 2019:1801779. doi: 10.1183/13993003.01779-2018.
- 51. Robison RK, Anderson AG, Pipe JG. Three-dimensional ultrashort echo-time imaging using a FLORET trajectory. Magnetic Resonance in Medicine. 2017;78(3):1038-49. PubMed PMID: WOS:000407855700022.
- 52. Zwart NR, Pipe JG. Graphical programming interface: A development environment for MRI methods. Magnetic Resonance in Medicine. 2015;74(5):1449-60. PubMed PMID: WOS:000364215900026.
- 53. Pipe JG, Zwart NR, Aboussouan EA, Robison RK, Devaraj A, Johnson KO. A New Design and Rationale for 3D Orthogonally Oversampled k-Space Trajectories. Magnetic Resonance in Medicine. 2011;66(5):1303-11. PubMed PMID: WOS:000296389800011.
- 54. Willmering MM, Robison RK, Wang H, Pipe JG, Woods JC. Implementation of the FLORET UTE sequence for lung imaging. Magnetic Resonance in Medicine. 2019;82(3):1091-100. doi: 10.1002/mrm.27800.
- 55. Willmering MM, Niedbalski PJ, Wang H, Walkup LL, Robison RK, Pipe JG, Cleveland ZI, Woods JC. Improved pulmonary 129Xe ventilation imaging via 3D-spiral UTE MRI. Magnetic Resonance in Medicine.n/a(n/a). doi: 10.1002/mrm.28114.
- 56. Niedbalski PJ, Willmering MM, Robertson SH, Freeman MS, Loew W, Giaquinto RO, Ireland C, Pratt RG, Dumoulin CL, Woods JC, Cleveland ZI. Mapping and correcting hyperpolarized magnetization decay with radial keyhole imaging. Magnetic Resonance in Medicine. 2019;DOI: 10.1002/mrm.27721. doi: 10.1002/mrm.27721.
- 57. Guo J, Hardie WD, Cleveland ZI, Davidson C, Xu X, Madala SK, Woods JC. Longitudinal free-breathing MRI measurement of murine lung physiology in a progressive model of lung fibrosis. Journal of Applied Physiology. 2019;126(4):1138-49. doi: 10.1152/japplphysiol.00993.2018. PubMed PMID: 30730810.
- 58. Higano NS, Hahn AD, Tkach JA, Cao XF, Walkup LL, Thomen RP, Merhar SL, Kingma PS, Fain SB, Woods JC. Retrospective Respiratory Self-Gating and Removal of Bulk Motion in Pulmonary UTE MRI of Neonates and Adults. Magnetic Resonance in Medicine. 2017;77(3):1284-95. doi: 10.1002/mrm.26212. PubMed PMID: WOS:000397407800038.
- 58. Diggle, P.J., Sousa, I., Asar, O. (2015). Real-time monitoring of progression towards renal failure in primary care patients. Biostatistics, 16(3): 522-36. DOI: 10.1093/biostatistics/kxu053.
- Jiang, C.-R., Wang, J.-L. (2010). Covariate-adjusted functional principal components analysis for longitudinal data. The Annals of Statistics, 38(2): 1194-1226.

- 59. Szczesniak, R., McPhail, G.L., Duan, L.L., Macaluso, M., Amin, R.S., Clancy, J.P. (2013). A semiparametric approach to estimate rapid lung function decline in cystic fibrosis. Annals of Epidemiology, 23(12): 771-7. DOI: 10.1016/j.annepidem.2013.08.009. PMID: 24103586.

- 60. Szczesniak, R., Li, D., Su, W., Pestian, J., Seid, M., Clancy, J.P. (2017). Phenotypes of Rapid Cystic Fibrosis Lung Disease Progression during Adolescence and Young Adulthood. American Journal of Respiratory and Critical Care Medicine, 196(4): 471-478. DOI: 10.1164/rccm.201612-2574OC. PMID: 28410569
- 61. Yao, F., Muller, H.-G., Wang, J.-L. (2005). Functional Data Analysis for Sparse Longitudinal Data. Journal of the American Statistical Association, 100(470): DOI: 10.1198/016214504000001745.
- All percentages and ratios are calculated by weight unless otherwise indicated.
- All percentages and ratios are calculated based on the total composition unless otherwise indicated.
- It should be understood that every maximum numerical limitation given throughout this specification includes every lower numerical limitation, as if such lower numerical limitations were expressly written herein. Every minimum numerical limitation given throughout this specification will include every higher numerical limitation, as if such higher numerical limitations were expressly written herein. Every numerical range given throughout this specification will include every narrower numerical range that falls within such broader numerical range, as if such narrower numerical ranges were all expressly written herein.
- The dimensions and values disclosed herein are not to be understood as being strictly limited to the exact numerical values recited. Instead, unless otherwise specified, each such dimension is intended to mean both the recited value and a functionally equivalent range surrounding that value. For example, a dimension disclosed as "20 mm" is intended to mean "about 20 mm."
- Every document cited herein, including any cross referenced or related patent or application, is hereby incorporated herein by reference in its entirety unless expressly excluded or otherwise limited. The citation of any document is not an admission that it is prior art with respect to any invention disclosed or claimed herein or that it alone, or in any combination with any other reference or references, teaches, suggests or discloses any such invention. Further, to the extent that any meaning or definition of a term in this document conflicts with any meaning or definition of the same term in a document incorporated by reference, the meaning or definition assigned to that term in this document shall govern.
- While particular embodiments of the present invention have been illustrated and described, it would be obvious to those skilled in the art that various other changes and modifications can be made without departing from the spirit and scope of the invention. It is therefore intended to cover in the appended claims all such changes and modifications that are within the scope of this invention.
Claims (18)
- A method of predicting and monitoring lung function decline in an individual at risk for non-linear lung function decline, comprising:a) determining a risk probability score based on one or more covariate associated with lung function in said individual, said covariate being selected from one or more of a clinical measure, a biomarker or an imaging marker that has been determined in said individual, andb) characterizing the individual as having no predicted lung impairment, mild predicted lung impairment, moderate predicted lung impairment, or severe predicted lung impairment using said risk probability score.
- A method of predicting and monitoring lung function decline in an individual at risk for non-linear lung function decline, comprising:a) determining one or more first covariate associated with lung function in said individual, said first covariate being selected from one or more biomarkers determined in a biological sample obtained from said individual;b) determining a risk probability score based on the determining of said at least one or more first covariate; andc) characterizing the individual as having no predicted lung impairment, mild predicted lung impairment, moderate predicted lung impairment, or severe predicted lung impairment using said risk probability score.
- The method of claim 2, wherein said determining of a risk probability score is based on the determining of the one or more first covariate and one or more second covariate selected from one or more of a clinical measure, or an imaging marker that has been determined in said individual.
- The method of any one of claims 1 to 3, wherein said risk probability score comprises a risk probability of a clinical outcome selected from a decrease in forced expiratory volume in one second (FEV1), pulmonary exacerbation (PE) frequency, FEV1- indicated exacerbation signal (FIES), ventilation defect percent (VDP), abnormal lung heterogeneity in lung as measured via imaging, lung hyperinflation, and combinations thereof.
- The method of any one of claims 1 and 3 to 4 wherein said covariate is a clinical measure selected from forced expiratory volume in one second (FEV1), body mass index percentile (BMI), pulmonary exacerbation (PE) frequency, historic lung function, ventilation defect percent (VDP), partial ventilation data, ventilation heterogeneity data, hyper-intensity data, FEV1- indicated exacerbation signal (FIES), and combinations thereof.
- The method of any one of claims 1 to 5, wherein said covariate is a biomarker described in Table 1, Table 2, Table 3, or Table 4 , said determining comprising determining an expression level of a protein described in Table 1, Table 2, Table 3, or Table 4 in a biological sample obtained from said individual.
- The method of any one of claims 1 and 3 to 5, wherein said covariate is an imaging marker being a functional lung measurement, a structural lung measurement, or combinations thereof.
- The method of claim 7, said imaging marker being obtained by an imaging method; preferably wherein said image technique being selected from hyperpolarized (HP) 129Xe, Ultra-short Echo-time (UTE) Magnetic resonance imaging (MRI), computed tomography (CT), and combinations thereof.
- The method of claim 8, said imaging marker being structural remodeling or bronchiectasis.
- The method of any one of claims 1 to 9, wherein said predicted lung impairment is a non-linear decline in one or more parameters selected from Ventilation Defect Percentage (VDP), FEV1, partial ventilation, ventilation heterogeneity, ventilation hyper-intensity or a combination thereof; or wherein said lung function decline is defined by one or more of absolute change in FEV1, rate of decline, risk of non-linear decline, FIES; wherein non-linear lung function decline is defined as a rate of change in longitudinal FEV1 that falls below 1.5% predicted/year or the FEV1-indicated exacerbation signal (FIES) score.
- The method of any one of claims 1 to 10, said individual having normal FEV1 at the time of said covariate determining and said risk probability score determining.
- The method of any one of claims 1 to 11, said risk probability score predicting the probability of lung function decline over a period selected from three weeks to four months, or six months, or twelve months; or wherein said method forecasts lung function trajectory for a period of about three weeks to about six months, or about six months to about twelve months.
- The method of any one of claims 1 to 12, said one or more covariates comprising a time-varying covariate; preferably selected from the group consisting of: infections with Pa, MRSA, CF-related diabetes and use of state insurance as a marker of socioeconomic status.
- The method of any one of claims 1 to 13, wherein said individual is diagnosed with cystic fibrosis (CF); wherein said individual is diagnosed with cystic fibrosis (CF) and has a normal forced expiratory volume in one second (FEV1) as measured by spirometry; wherein said individual is a pediatric patient having cystic fibrosis (CF); or wherein said individual is a patient under the age of 13 years of age and having cystic fibrosis (CF).
- The method of any one of claims 1 to 14, further comprising applying a statistical algorithm to estimate correlation between a covariate value and predicted lung function; or further comprising assessing a variable selected from one or more of sex, body mass index (BMI), pulmonary exacerbation (PE), number of hospitalizations, antibiotic status, infection status, and combinations thereof, in said individual.
- The method of any one of claims 1 to 15, wherein said method is carried out via a computer system, and wherein said method comprises capturing and displaying information related to said characterization of said individual using a graphical user interface (GUI).
- The method of any one of claims 1 to 16, further comprising one or more of increased frequency of disease monitoring, increased frequency of infection monitoring, or combinations thereof.
- An anti-inflammatory therapy for use in treating an individual at risk for non-linear lung function decline, wherein said individual has been classified as having mild predicted lung impairment, moderate predicted lung impairment, or severe predicted lung impairment using the method according to any one of claims 1 to 17.
Applications Claiming Priority (1)
| Application Number | Priority Date | Filing Date | Title |
|---|---|---|---|
| US17/333,058 US12411144B2 (en) | 2017-03-22 | 2021-05-28 | Compositions and methods for treatment of lung function |
Publications (1)
| Publication Number | Publication Date |
|---|---|
| EP4094676A1 true EP4094676A1 (en) | 2022-11-30 |
Family
ID=76553499
Family Applications (1)
| Application Number | Title | Priority Date | Filing Date |
|---|---|---|---|
| EP21180569.2A Withdrawn EP4094676A1 (en) | 2021-05-28 | 2021-06-21 | Compositions and methods for treatment of lung function |
Country Status (1)
| Country | Link |
|---|---|
| EP (1) | EP4094676A1 (en) |
Citations (1)
| Publication number | Priority date | Publication date | Assignee | Title |
|---|---|---|---|---|
| US20180275141A1 (en) * | 2017-03-22 | 2018-09-27 | Children's Hospital Medical Center | Compositions and methods for treatment of lung function |
-
2021
- 2021-06-21 EP EP21180569.2A patent/EP4094676A1/en not_active Withdrawn
Patent Citations (1)
| Publication number | Priority date | Publication date | Assignee | Title |
|---|---|---|---|---|
| US20180275141A1 (en) * | 2017-03-22 | 2018-09-27 | Children's Hospital Medical Center | Compositions and methods for treatment of lung function |
Non-Patent Citations (63)
| Title |
|---|
| ACCURSO FJROWE SMCLANCY JPBOYLE MPDUNITZ JMDURIE PRSAGEL SDHORNICK DBKONSTAN MWDONALDSON SH: "Effect of VX-770 in persons with cystic fibrosis and the G551D-CFTR mutation", N ENGL J MED, vol. 363, no. 21, 2010, pages 1991 - 2003 |
| ASAR OILK O: "mmm: an R package for analyzing multivariate longitudinal data with multivariate marginal models", COMPUT METHODS PROGRAMS BIOMED, vol. 112, no. 3, 2013, pages 649 - 54, XP028755109, DOI: 10.1016/j.cmpb.2013.07.022 |
| BRODY ASKLEIN JSMOLINA PLQUAN JBEAN JAWILMOTT RW: "High-resolution computed tomography in young patients with cystic fibrosis: Distribution of abnormalities and correlation with pulmonary function tests", JOURNAL OF PEDIATRICS., vol. 145, no. 1, 2004, pages 32 - 8, XP004561389, DOI: 10.1016/j.jpeds.2004.02.038 |
| CHASSAGNON GHUBERT DFAJAC IBURGEL P-RREVEL M-P: "Long-term computed tomographic changes in cystic fibrosis patients treated with ivacaftor", EUROPEAN RESPIRATORY JOURNAL, vol. 48, no. 1, 2016, pages 249 - 52 |
| CHEN JKINTER MSHANK SCOTTON CKELLEY TJZIADY AG: "Dysfunction of Nrf-2 in CF epithelia leads to excess intracellular H202 and inflammatory cytokine production", PLOS ONE, vol. 3, no. 10, 2008, pages e3367 |
| CHEN XSHANK SDAVIS PBZIADY AG: "Nucleolin-mediated cellular trafficking of DNA nanoparticle is lipid raft and microtubule dependent and can be modulated by glucocorticoid", MOL THER, vol. 19, no. 1, 2011, pages 93 - 102 |
| CHIRKOVA TLIN SOOMENS AGGASTON KABOYOGLU-BARNUM SMENG JSTOBART CCCOTTON CUHARTERT TVMOORE ML: "CX3CR1 is an Important Surface Molecule for RSV Infection in Human Airway Epithelial Cells", J GEN VIROL, 2015 |
| DEBOER EMKROEHL MEWAGNER BDACCURSO FJHARRIS JKLYNCH DASAGEL SDDETERDING RR: "Proteomic profiling identifies novel circulating markers associated with bronchiectasis in cystic fibrosis", PROTEOMICS - CLINICAL APPLICATIONS, vol. 11, 2017 |
| DEBOER EMWAGNER BDPOPLER JHARRIS JKZEMANICK ETACCURSO FJSAGEL SDDETERDING RR: "Novel Application of Aptamer Proteomic Analysis in Cystic Fibrosis Bronchoalveolar Lavage Fluid", PROTEOMICS - CLINICAL APPLICATIONS |
| DIGGLE, P.J.SOUSA, I.ASAR, O.: "Real-time monitoring of progression towards renal failure in primary care patients", BIOSTATISTICS, vol. 16, no. 3, 2015, pages 522 - 36 |
| DRUMM MLZIADY AGDAVIS PB: "Genetic variation and clinical heterogeneity in cystic fibrosis", ANNU REV PATHOL., vol. 7, 2012, pages 267 - 82 |
| EICHINGER MONIKA ET AL: "Morphologic and functional scoring of cystic fibrosis lung disease using MRI", EUROPEAN JOURNAL OF RADIOLOGY, vol. 81, no. 6, 23 March 2011 (2011-03-23), pages 1321 - 1329, XP028916423, ISSN: 0720-048X, DOI: 10.1016/J.EJRAD.2011.02.045 * |
| EICHINGER MOPTAZAITE D-EKOPP-SCHNEIDER AHINTZE CBIEDERER JNIEMANN AMALL MAWIELPIITZ MOKAUCZOR H-UPUDERBACH M: "Morphologic and functional scoring of cystic fibrosis lung disease using MRI", EUROPEAN JOURNAL OF RADIOLOGY, vol. 81, no. 6, 2012, pages 1321 - 9, XP028916423, DOI: 10.1016/j.ejrad.2011.02.045 |
| GUO JHARDIE WDCLEVELAND ZIDAVIDSON CXU XMADALA SKWOODS JC: "Longitudinal free-breathing MRI measurement of murine lung physiology in a progressive model of lung fibrosis", JOURNAL OF APPLIED PHYSIOLOGY, vol. 126, no. 4, 2019, pages 1138 - 49 |
| HANANIA NASHARAFKHANEH ACELLI BDECRAMER MLYSTIG TKESTEN STASHKIN D: "Acute bronchodilator responsiveness and health outcomes in COPD patients in the UPLIFT trial", RESPIRATORY RESEARCH, vol. 12, no. 1, 2011, pages 6, XP021085804, DOI: 10.1186/1465-9921-12-6 |
| HASTIE TTIBSHIRANI RJFRIEDMAN J: "The Elements of Statistical Learning", DATA MINING, INFERENCE, AND PREDICTION2009, 2009 |
| HIGANO NSHAHN ADTKACH JACAO XFWALKUP LLTHOMEN RPMERHAR SLKINGMA PSFAIN SBWOODS JC: "Retrospective Respiratory Self-Gating and Removal of Bulk Motion in Pulmonary UTE MRI of Neonates and Adults", MAGNETIC RESONANCE IN MEDICINE, vol. 77, no. 3, 2017, pages 1284 - 95 |
| HOY SM: "Elexacaftor/lvacaftor/Tezacaftor", FIRST APPROVAL. DRUGS., vol. 79, no. 18, 1 December 2019 (2019-12-01), pages 2001 - 7 |
| JIANG, C.-R.WANG, J.-L.: "Covariate-adjusted functional principal components analysis for longitudinal data", THE ANNALS OF STATISTICS, vol. 38, no. 2, 2010, pages 1194 - 1226 |
| KONSTAN MWMCKONE EFMOSS RBMARIGOWDA GTIAN SWALTZ DHUANG XLUBARSKY BRUBIN JMILLAR SJ: "Assessment of safety and efficacy of long-term treatment with combination lumacaftor and ivacaftor therapy in patients with cystic fibrosis homozygous for the F508del-CFTR mutation (PROGRESS): a phase 3, extension study", LANCET RESPIR MED, vol. 5, no. 2, 2017, pages 107 - 18 |
| LEDERLIN MCREMILLIEUX Y: "Three-dimensional assessment of lung tissue density using a clinical ultrashort echo time at 3 tesla: A feasibility study in healthy subjects", JOURNAL OF MAGNETIC RESONANCE IMAGING, vol. 40, no. 4, 2014, pages 839 - 47 |
| LI QDING XTHOMAS JJHARDING CVPECORA NDZIADY AGSHANK SBOOM WHLANCIONI CLROJAS RE: "Rv2468c, a novel Mycobacterium tuberculosis protein that costimulates human CD4+ T cells through VLA-5", J LEUKOC BIOL, vol. 91, no. 2, 2012, pages 311 - 20 |
| LOEW W TRPRATT RCLEVELAND ZDUMOULIN CWOODS JGIAQUINTO R: "A Volume saddle coil for hyperpolarized 129Xe lung imaging", PROC INT SOC MAGN RESON MED, vol. 2015, 2015, pages 93 |
| MILLER GWALTES TABROOKEMAN JRDE LANGE EEMUGLER JP: "Hyperpolarized 3He lung ventilation imaging with B 1-inhomogeneity correction in a single breath-hold scan", MAGMA, vol. 16, no. 5, 2004, pages 218 - 26 |
| NIEDBALSKI PJWILLMERING MMROBERTSON SHFREEMAN MSLOEW WGIAQUINTO ROIRELAND CPRATT RGDUMOULIN CLWOODS JC: "Mapping and correcting hyperpolarized magnetization decay with radial keyhole imaging", MAGNETIC RESONANCE IN MEDICINE, 2019 |
| PEARCE MSSALOTTI JALITTLE MPMCHUGH KLEE CKIM KPHOWE NLRONCKERS CMRAJARAMAN PCRAFT AW: "Radiation exposure from CT scans in childhood and subsequent risk of leukaemia and brain tumours: a retrospective cohort study", LANCET, vol. 380, no. 9840, 2012, pages 499 - 505 |
| PIPE JGZWART NRABOUSSOUAN EAROBISON RKDEVARAJ AJOHNSON KO: "A New Design and Rationale for 3D Orthogonally Oversampled k-Space Trajectories", MAGNETIC RESONANCE IN MEDICINE, vol. 66, no. 5, 2011, pages 1303 - 11 |
| ROACH DJCREMILLIEUX YFLECK RJBRODY ASSERAI SDSZCZESNIAK RDKERLAKIAN SCLANCY JPWOODS JC: "Ultrashort Echo-Time Magnetic Resonance Imaging Is a Sensitive Method for the Evaluation of Early Cystic Fibrosis Lung Disease", ANN AM THORAC SOC., vol. 13, no. 11, 2016, pages 1923 - 31 |
| ROBISON RKANDERSON AGPIPE JG: "Three-dimensional ultrashort echo-time imaging using a FLORET trajectory", MAGNETIC RESONANCE IN MEDICINE, vol. 78, no. 3, 2017, pages 1038 - 49 |
| ROSENFELD MVANDEVANTER DRREN CLELKIN EPPASTA DJKONSTAN MWMORGAN WJ: "Fibrosis IoCotESoC. Decline in lung function does not predict future decline in lung function in cystic fibrosis patients", PEDIATR PULMONOL, vol. 50, no. 9, 2015, pages 856 - 62 |
| SAGEL SDWAGNER BZIADY AGKELLEY TJMUHLEBACH MSACCURSO FPILEWSKI JHELTSHE SLCLANCY JPJOSELOFF E: "Validation of Candidate Serum Protein and Lipid Markers of Disease Severity In CF", PEDIATR PULMONOL SUPPL, vol. 38, 2014, pages 288 |
| SAHN SASUSSMAN RSWIGRIS JJNOBLE PW: "A Phase 3 Trial of Pirfenidone in Patients with Idiopathic Pulmonary Fibrosis", NEW ENGLAND JOURNAL OF MEDICINE, vol. 370, no. 22, 2014, pages 2083 - 92 |
| SANDERS DBBITTNER RCROSENFELD MHOFFMAN LRREDDING GJGOSS CH: "Failure to recover to baseline pulmonary function after cystic fibrosis pulmonary exacerbation", AM J RESPIR CRIT CARE MED, vol. 182, no. 5, 2010, pages 627 - 32 |
| SAWICKI GSMCKONE EFPASTA DJMILLAR SJWAGENER JSJOHNSON CAKONSTAN MW: "Sustained Benefit from Ivacaftor Demonstrated by Combining Clinical Trial and Cystic Fibrosis Patient Registry Data", AM J RESPIR CRIT CARE MED, vol. 192, no. 7, 2015, pages 836 - 42 |
| SINHA CREN AARORA KMOON CSYARLAGADDA SWOODROOFFE KLIN SSCHUETZ JDZIADY AGNAREN AP: "PKA and actin play critical roles as downstream effectors in MRP4-mediated regulation of fibroblast migration", CELL SIGNAL, vol. 27, no. 7, 2015, pages 1345 - 55 |
| STANOJEVIC SRATJEN F: "Physiologic endpoints for clinical studies for cystic fibrosis", JOURNAL OF CYSTIC FIBROSIS, vol. 15, no. 4, 2016, pages 416 - 23, XP029633501, DOI: 10.1016/j.jcf.2016.05.014 |
| SZCZESNIAK RDBROKAMP CSU WMCPHAIL GLPESTIAN JCLANCY JP: "Improving Detection of Rapid Cystic Fibrosis Disease Progression-Early Translation of a Predictive Algorithm Into a Point-of-Care Tool", IEEE JOURNAL OF TRANSLATIONAL ENGINEERING IN HEALTH AND MEDICINE, vol. 7, 2019, pages 1 - 8, XP011708383, DOI: 10.1109/JTEHM.2018.2878534 |
| SZCZESNIAK RDMCPHAIL GLLI DAMIN RSCLANCY JP: "Predicting future lung function decline in cystic fibrosis patients: Statistical methods and clinical connections", PEDIATR PULMONOL, vol. 51, no. 2, 2016, pages 217 - 8 |
| SZCZESNIAK RDSU WBROKAMP CKEOGH RHPESTIAN JPSEID MDIGGLE PJCLANCY JP: "Dynamic predictive probabilities to monitor rapid cystic fibrosis disease progression", STATISTICS IN MEDICINE, vol. 39, no. 6, 2020, pages 740 - 56 |
| SZCZESNIAK RHELTSHE SLSTANOJEVIC SMAYER-HAMBLETT N: "Use of FEV(1) in cystic fibrosis epidemiologic studies and clinical trials: A statistical perspective for the clinical researcher. Journal of cystic fibrosis", OFFICIAL JOURNAL OF THE EUROPEAN CYSTIC FIBROSIS SOCIETY, vol. 16, no. 3, 2017, pages 318 - 26 |
| SZCZESNIAK, R.LI, D.SU, W.PESTIAN, J.SEID, M.CLANCY, J.P.: "Phenotypes of Rapid Cystic Fibrosis Lung Disease Progression during Adolescence and Young Adulthood", AMERICAN JOURNAL OF RESPIRATORY AND CRITICAL CARE MEDICINE, vol. 196, no. 4, 2017, pages 471 - 478 |
| SZCZESNIAK, R.MCPHAIL, G.L.DUAN, L.L.MACALUSO, M.AMIN, R.S.CLANCY, J.P: "A semiparametric approach to estimate rapid lung function decline in cystic fibrosis", ANNALS OF EPIDEMIOLOGY, vol. 23, no. 12, 2013, pages 771 - 7, XP028778599, DOI: 10.1016/j.annepidem.2013.08.009 |
| TEPPER LACAUDRI DROVIRA APTIDDENS HADE BRUIJNE M: "The development of bronchiectasis on chest computed tomography in children with cystic fibrosis: can pre-stages be identified?", EUR RADIOL, vol. 26, no. 12, 25 April 2016 (2016-04-25), pages 4563 - 9, XP036095597, DOI: 10.1007/s00330-016-4329-z |
| TEPPER LEONIE A ET AL: "The development of bronchiectasis on chest computed tomography in children with cystic fibrosis: can pre-stages be identified?", EUROPEAN RADIOLOGY, SPRINGER BERLIN HEIDELBERG, BERLIN/HEIDELBERG, vol. 26, no. 12, 23 April 2016 (2016-04-23), pages 4563 - 4569, XP036095597, ISSN: 0938-7994, [retrieved on 20160423], DOI: 10.1007/S00330-016-4329-Z * |
| THOMEN RPWALKUP LLROACH DJCLEVELAND ZICLANCY JPWOODS JC: "Hyperpolarized 129Xe for investigation of mild cystic fibrosis lung disease in pediatric patients", JOURNAL OF CYSTIC FIBROSIS, vol. 16, no. 2, 2017, pages 275 - 82 |
| TIBSHIRANI RJ: "Regression shrinkage and selection via the lasso", ROYAL STATIST SOC B, vol. 58, 1996, pages 267 - 88 |
| VESTBO JLANGE P: "Natural history of COPD: Focusing on change in FEV1", RESPIROLOGY, vol. 21, no. 1, 2016, pages 34 - 43 |
| WAINWRIGHT CEELBORN JSRAMSEY BWMARIGOWDA GHUANG XCIPOLLI MCOLOMBO CDAVIES JCDE BKFLUME PA: "Group TS, Group TS. Lumacaftor-Ivacaftor in Patients with Cystic Fibrosis Homozygous for Phe508del CFTR", N ENGL J MED, vol. 373, no. 3, 2015, pages 220 - 31 |
| WALKUP LAURA L ET AL: "Feasibility, tolerability and safety of pediatric hyperpolarized129Xe magnetic resonance imaging in healthy volunteers and children with cystic fibrosis", PEDIATRIC RADIOLOGY, SPRINGER VERLAG, DE, vol. 46, no. 12, 5 August 2016 (2016-08-05), pages 1651 - 1662, XP036084052, ISSN: 0301-0449, [retrieved on 20160805], DOI: 10.1007/S00247-016-3672-1 * |
| WALKUP LLMYERS KEL-BIETAR JNELSON AWILLMERING MMGRIMLEY MDAVIES SMTOWE CWOODS JC: "129Xe MRI detects ventilation deficits in pediatric stem-cell transplant patients unable to perform spirometry", EUROPEAN RESPIRATORY JOURNAL, 2019 |
| WALKUP LLTHOMEN RPAKINYI TGWATTERS ERUPPERT KCLANCY JPWOODS JCCLEVELAND ZI: "Feasibility, tolerability and safety of pediatric hyperpolarized Xe-129 magnetic resonance imaging in healthy volunteers and children with cystic fibrosis", PEDIATRIC RADIOLOGY, vol. 46, no. 12, 2016, pages 1651 - 62, XP036084052, DOI: 10.1007/s00247-016-3672-1 |
| WIELPIITZ MOPUDERBACH MKOPP-SCHNEIDER ASTAHL MFRITZSCHING ESOMMERBURG OLEY SSUMKAUSKAITE MBIEDERER JKAUCZOR H-U: "Magnetic Resonance Imaging Detects Changes in Structure and Perfusion, and Response to Therapy in Early Cystic Fibrosis Lung Disease", AMERICAN JOURNAL OF RESPIRATORY AND CRITICAL CARE MEDICINE, vol. 189, no. 8, 2014, pages 956 - 65 |
| WILCOXON F: "Individual comparisons of grouped data by ranking methods", JOURNAL OF ECONOMIC ENTOMOLOGY, vol. 39, 1 April 1946 (1946-04-01), pages 269 |
| WILLMERING MMNIEDBALSKI PJWANG HWALKUP LLROBISON RKPIPE JGCLEVELAND ZIWOODS JC: "Improved pulmonary 129Xe ventilation imaging via 3D-spiral UTE MRI", MAGNETIC RESONANCE IN MEDICINE.N/A(N/A |
| WILLMERING MMROBISON RKWANG HPIPE JGWOODS JC: "Implementation of the FLORET UTE sequence for lung imaging", MAGNETIC RESONANCE IN MEDICINE, vol. 82, no. 3, 2019, pages 1091 - 100 |
| YAO, F.MULLER, H.-G.WANG, J.-L.: "Functional Data Analysis for Sparse Longitudinal Data", JOURNAL OF THE AMERICAN STATISTICAL ASSOCIATION, vol. 100, 2005, pages 470 |
| YU JXUE YSONG HK: "Comparison of lung T2* during free-breathing at 1.5 T and 3.0 T with ultrashort echo time imaging. Magnetic resonance in medicine", OFFICIAL JOURNAL OF THE SOCIETY OF MAGNETIC RESONANCE IN MEDICINE / SOCIETY OF MAGNETIC RESONANCE IN MEDICINE, vol. 66, no. 1, 2011, pages 248 - 54 |
| ZIADY AGHELTSHE SLKELLEY TJMUHLEBACH MSACCURSO FPILEWSKI JCLANCY JPSAGEL SDJOSELOFF E: "Proteomic analyses of serum from CF patients with mild or severe disease reveal the differential expression of proteins that regulate the differentiation of cartilage, myeloid leukocytes, and intestinal epithelia", PEDIATR PULMONOL SUPPL, vol. 38, 2014, pages 288 |
| ZIADY AGKINTER M: "Protein sequencing with tandem mass spectrometry", METHODS MOL BIOL, vol. 544, 2009, pages 325 - 41 |
| ZIADY AGKINTER M: "Protein sequencing with tandem mass spectrometry", METHODS MOL.BIOL., vol. 544, 2009, pages 325 - 41 |
| ZIADY AGLIN SWYATT CCLANCY JP: "Proteomic analyses of BALF reveal potential biomarkers and suggest altered lipid, cyclic nucleotide, and iron metabolism in young CF children versus disease controls", PEDIATR PULMONOL SUPPL, vol. 36, 2013, pages 250 |
| ZIADY AGSOKOLOW ASHANK SCOREY DMYERS RPLAFKER SKELLEY TJ: "Interaction with CREB binding protein modulates the activities of Nrf2 and NF-kappaB in cystic fibrosis airway epithelial cells", AM J PHYSIOL LUNG CELL MOL PHYSIOL., vol. 302, no. 11, 2012, pages L1221 - L31 |
| ZWART NRPIPE JG: "Graphical programming interface: A development environment for MRI methods", MAGNETIC RESONANCE IN MEDICINE, vol. 74, no. 5, 2015, pages 1449 - 60 |
Similar Documents
| Publication | Publication Date | Title |
|---|---|---|
| US10761099B2 (en) | Compositions and methods for treatment of lung function | |
| Leuzy et al. | 2020 update on the clinical validity of cerebrospinal fluid amyloid, tau, and phospho-tau as biomarkers for Alzheimer’s disease in the context of a structured 5-phase development framework | |
| Frölich et al. | Incremental value of biomarker combinations to predict progression of mild cognitive impairment to Alzheimer’s dementia | |
| Mapstone et al. | What success can teach us about failure: the plasma metabolome of older adults with superior memory and lessons for Alzheimer's disease | |
| Burnham et al. | A blood-based predictor for neocortical Aβ burden in Alzheimer’s disease: results from the AIBL study | |
| Haque et al. | A protein panel in cerebrospinal fluid for diagnostic and predictive assessment of Alzheimer’s disease | |
| Jahn et al. | Peptide fingerprinting of Alzheimer's disease in cerebrospinal fluid: identification and prospective evaluation of new synaptic biomarkers | |
| JP6763770B2 (en) | Biomarker for autism spectrum disorders | |
| JP6021187B2 (en) | Metabolic biomarkers of autism | |
| US12411144B2 (en) | Compositions and methods for treatment of lung function | |
| Llano et al. | Evaluation of plasma proteomic data for Alzheimer disease state classification and for the prediction of progression from mild cognitive impairment to Alzheimer disease | |
| Bereman et al. | Machine learning reveals protein signatures in CSF and plasma fluids of clinical value for ALS | |
| Trelle et al. | Plasma Aβ42/Aβ40 is sensitive to early cerebral amyloid accumulation and predicts risk of cognitive decline across the Alzheimer's disease spectrum | |
| Collinson et al. | The clinical and diagnostic performance characteristics of the high sensitivity Abbott cardiac troponin I assay | |
| Chen et al. | Predictive value of serum markers for the development of interstitial lung disease in patients with polymyositis and dermatomyositis: a comparative and prospective study | |
| WO2017082103A1 (en) | Biomarker for diagnosing depression and use of said biomarker | |
| US20230330121A1 (en) | Compositions and methods for the treatment of bronchiolitis obliterans | |
| US20190178900A1 (en) | Autism subsets | |
| Doecke et al. | Concordance between cerebrospinal fluid biomarkers with Alzheimer’s disease pathology between three independent assay platforms | |
| Radford-Smith et al. | Depressive symptoms in non-alcoholic fatty liver disease are identified by perturbed lipid and lipoprotein metabolism | |
| Rossi et al. | Biomarker discovery in asthma and COPD by proteomic approaches | |
| Antcliffe et al. | Metabolic profiling in patients with pneumonia on intensive care | |
| Kimenai et al. | Troponin I and T in relation to cardiac injury detected with electrocardiography in a population-based cohort-The Maastricht Study | |
| Brogan et al. | Biomarkers of insulin resistance and their performance as predictors of treatment response in overweight adults | |
| WO2016187317A1 (en) | Metabolic biomarkers for memory loss |
Legal Events
| Date | Code | Title | Description |
|---|---|---|---|
| PUAI | Public reference made under article 153(3) epc to a published international application that has entered the european phase |
Free format text: ORIGINAL CODE: 0009012 |
|
| STAA | Information on the status of an ep patent application or granted ep patent |
Free format text: STATUS: THE APPLICATION HAS BEEN PUBLISHED |
|
| AK | Designated contracting states |
Kind code of ref document: A1 Designated state(s): AL AT BE BG CH CY CZ DE DK EE ES FI FR GB GR HR HU IE IS IT LI LT LU LV MC MK MT NL NO PL PT RO RS SE SI SK SM TR |
|
| STAA | Information on the status of an ep patent application or granted ep patent |
Free format text: STATUS: THE APPLICATION IS DEEMED TO BE WITHDRAWN |
|
| 18D | Application deemed to be withdrawn |
Effective date: 20230531 |